Introduction
Immunoglobulin (Ig) and T-cell receptor (TCR) gene
rearrangement (GR) studies have been successfully employed to
investigate the clonality and cell lineage of various lymphoid
malignancies (1). By being simple,
highly efficient, cost-effective with wide fitness, polymerase
chain reaction (PCR)-based techniques have been extensively used in
the detection of GRs.
According to the numbers of PCR primer pairs,
PCR-based methods of detecting B-cell clonality may be divided into
two groups: the one using one or two pairs of primers in the PCR
amplification, potentially termed the ‘classical method’ (2,3) and
the other using multiple primers in one PCR tube, designated as the
‘BIOMED-2 method’ (4,5). However, oligoclonality (more than two
homoduplex and heteroduplex bands in a PCR product) sometimes
appears in the routine detection using either the classical or the
BIOMED-2 methods. In previous studies (6), we found that the DG75 cell line, used
as one of the positive control cells in GR detection, exhibited
biclonality in the assay. To further explore their characteristics,
we purified, cloned and sequenced these bands, and analyzed them
using DNA software.
Materials and methods
Cell lines and DNA extraction
DG75, BJAB, RAJI, L428, and Jurkat cell lines
(kindly provided by Dr Ren Song, Department of Molecular and
Medical Pharmacology, the David Geffen School of Medicine at the
University of California, LA, USA) were employed in our study. The
cell lines were maintained in a humidified 37°C atmosphere
containing 5% CO2. Of these, DG75 cell lines were
established from the pleural effusion of a 10-year-old boy with
Burkitt’s lymphoma in 1975 (7). The
Germany DSMZ cell bank sequence number of the DG75 cell line is
ACC83. Cell DNA was extracted using the DNAzol reagent, according
to the manufacturer’s protocol.
PCR conditions and DNA sequencing
In the classical method of immunoglobulin heavy
(IgH) GR assay, two pairs of FR3 region primers were used, as
previously reported (6). In the
BIOMED-2 assay method, however, Tube C primers were used (4) (Table
I). The PCR program was performed using rTaq (Takara, Dalian,
China), beginning with initial denaturation at 94°C for 5 min,
followed by 35 cycles (94°C for 30 sec, 55°C for 40 sec and 72°C
for 60 sec) of amplification, with a final extension at 72°C for 10
min. Products were visualized and photographed with GeneSnap (Gene
Co, Chicago, IL, USA) after electrophoresis in 2.0% agarose. PCR
products were purified, cloned into the pGEM-T vector, and
sequenced at the Invitrogen Biotech Co., Ltd. (Shanghai, China).
DNA sequences were analyzed using the ClustalW 2.1 multiple
sequence alignment software, accessed at http://www.ebi.ac.uk/Tools/msa/clustalw2/.
 | Table I.Primers used in the detection of
immunoglobulin heavy gene rearrangement. |
Table I.
Primers used in the detection of
immunoglobulin heavy gene rearrangement.
| Regions | Primer names | Primers (5′-3′) |
|---|
| FR3 | FR3 (up) | ACGGC (C/T)
GTGTATTACTGTGC |
| Classical method | FR33 (up) |
CTGTCGACACGGCCGTGTATTACTG |
| JH1 (down) |
ACCTGAGGAGAC(G/A)GTGACC |
| FR3 | VH1-FR3 |
TGGAGCTGAGCAGCCTGAGATCTGA |
| BIOMED-2 method | VH2-FR3 |
CAATGACCAACATGGACCCTGTGGA |
| VH3-FR3 |
TCTGCAAATGAACAGCCTGAGAGCC |
| VH4-FR3 |
GAGCTCTGTGACCGCCGCGGACACG |
| VH5-FR3 |
CAGCACCGCCTACCTGCAGTGGAGC |
| VH6-FR3 |
GTTCTCCCTGCAGCTGAACTCTGTG |
| VH7-FR3 |
CAGCACGGCATATCTGCAGATCAG |
| JH2 (down) |
CTTACCTGAGGAGACGGTGACC |
Results
PCR amplification of DG75 cell DNA by the
primer of IgH GR
PCR conditions were initially optimized using
various concentrations of MgCl2, without modifying any
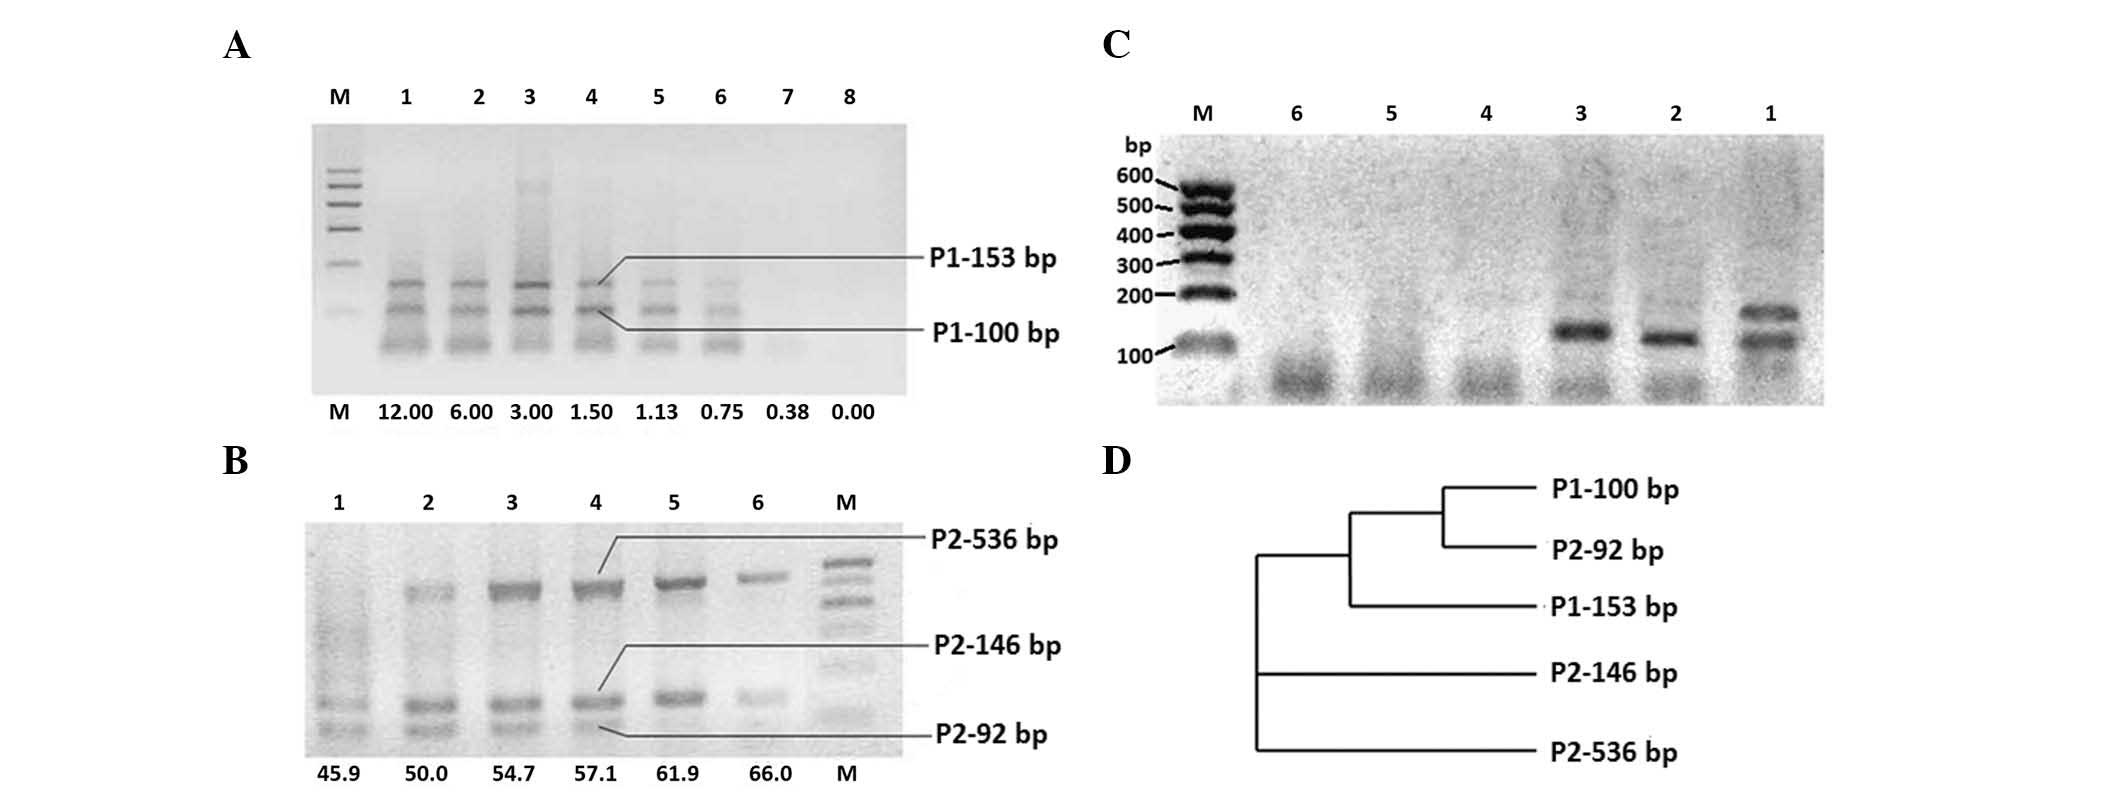
other parameters. The results showed two clear bands in the first
primer pair (IgH FR3-JH1) PCR products. One band was ∼100 base pair
(designated as the P1–100 bp band after DNA sequencing), while the
other was ∼150 bp size (designated as P1–153 bp) (Fig. 1A).
The results also showed that there were three clear
bands in the second PCR primer pair amplifications, of ∼100
(designated as P2–92 bp), 150 (designated as P2–146 bp) and 500 bp
(designated as P2–536 bp) size, respectively (Fig 1B).
The IgH GR statuses of five lymphoma cell lines were
also assayed using the primer of Tube C of the BiOMED-2 method. Of
these five lines, only DG-75 cell lines exhibited two clear bands
in the detection (Fig. 1C). The DNA
sequence resulting from the two bands was almost identical to that
resulting from the FR3-JH1 primer pair. We also used seven single
primer pairs from the multiple PCR of Tube C. The results
demonstrated that there were two pairs of primers that demonstrated
clear bands: the VH3-JH and VH4 -JH primer pairs (data not
shown).
DNA sequences
DNA sequences of these bands were analyzed using the
ClustalW2 software. The alignment results are shown in Table II, while the phylogram results are
shown in Fig 1D. These results
demonstrated that the P1–100 bp and P2–92 bp bands were derived
from the same form of GR, while the P1–153 bp, P2–146 bp and P2–536
bp from another form of GR.
| Table II.Result of ClustalW 2.1 multiple
sequence alignment (abbreviated). |
Table II.
Result of ClustalW 2.1 multiple
sequence alignment (abbreviated).
| Name - Size (bp) | Primer sequence | Sequence no. |
|---|
| P2–146 |
------ACGGCTGTGTATTACTGTGCGAGAGACTTTCCATATTGTGGTGGTGACTGCTAC | 54 |
| P2–536 |
------ACGGGTGTGTATTACTGTGCGACAGACTTTCCATATTGTGGTGGTGACTGCTAC | 54 |
| P1–153 |
GTCGACACGGCCGTGTATTACTGTGCGAGAGACTTTCCATATTGTGGTGGTGACTGCTAC | 60 |
| P1–100 |
GTCGACACGGCCGTGTATTACTGTGCGAC------------TTG-GATTATGACTACCAT | 47 |
| P2–92 |
-------CGGCTGTGTATTACTGTGCGAC------------TTG-GATTATGACTACCAT | 40 |
|
*** **************** *** * * ***** * * | |
| P2–146 |
TCCGCGATGGATTACTATGATAGTAGTGGTTATCACTCCCTTATTAGTTTGACTAGTGGG | 114 |
| P2–536 |
TCCGCGATGGATTACTATGATAGTAGTGGTTATCACTCCCTTATTAGTTTGACTAGTGGG | 114 |
| P1–153 |
TCCGCGATGGATTACTATGATAGTAGTGGTTATCACTCCCTTATTAGTTTGACTAGTGGG | 120 |
| P1–100 |
----------------------------------ACGCCCTT------TTGACTACTGGG | 67 |
| P2–92 |
----------------------------------ACGCCCTT------TTGACTACTGGG | 60 |
|
** ***** ******* **** | |
| P2–146 |
GCCAGGGAACCCTGGTCACCGTCTCCTCAGGT---------------------------- | 146 |
| P2–536 |
GCCAGGGAACCCTGGTCACCGTCTCCTCAGGTGAGTCCTCAGAACGTCTCTCCTGCTTTA | 174 |
| P1–153 |
GCCAGGGAACCCTGGTCACCGTCTCCTCTGGAG--------------------------- | 153 |
| P1–100 |
GCCAGGGAACCCTGGTCACCGTCTCCTCTGCAG--------------------------- | 100 |
| P2–92 |
GCCAGGGAACCCTGGTCACCGTCTCCTCAGGT---------------------------- | 92 |
|
**************************** * | |
| P2–146 |
------------------------------------------------------------ | |
| P2–536 |
ACTCTGAAGGGTTTTGCTGCATTTTTGGGGGGAAATAAGGGTGCTGGGTCTCCTGCCAAG | 234 |
| P1–153 |
------------------------------------------------------------ | |
| P1–100 |
------------------------------------------------------------ | |
| P2–92 |
------------------------------------------------------------ | |
| P2–146 |
------------------------------------------------------------ | |
| P2–536 |
AGAGCCCCGGAGCAGCCTGGGGGGCTCAGGAGGAT------------------------- | 536 |
| P1–153 |
------------------------------------------------------------ | |
| P1–100 |
------------------------------------------------------------ | |
| P2–92 |
------------------------------------------------------------ | |
Discussion
By definition, the bi/oligoclonal pattern indicates
the presence of two or more bands, following PCR and
electrophoretic resolution. The explanation for the difference in
oligoclonality findings may be due to the somatic mutation of the
VH genes (8,9). Another explanation for
bi/oligoclonality may be the presence of two cell populations in
the bone marrow, due to two separate events or the formation of
sub-clones (10,11).
In general, the tumor cell line is a stable cell
population that is relatively homogeneous in cell morphology,
proliferation and biological traits. There are several B-cell
lymphoma cell lines potentially employed as the positive control in
detecting GR, such as Raji, Nam, Daudi, BJAB and DG75 cell lines.
Of the B-cell lymphoma cell lines we used, the DG75 cell line
demonstrated two clear bands in the PCR amplifications. DNA
sequencing results showed that these two bands are distinct in the
N region of amino sequence, showing at least two different forms of
IgH GR. One form is the sequences of P2–92 bp or P1–100 bp, which
are almost identical to the form of VH3-JH2 of the primer in the
BIOMED-2 primer sets. Another form is the P2–146 bp or P1–153 bp,
identical to the form of VH4-JH2 of the primer in the BIOMED-2
primer sets.
Of note, the agarose electrophoresis results also
showed that there was a clear band in ∼500 bp (P2–536 bp) in the
PCR amplification of the classical primer pair FR33-JH1 (P2) of IgH
primer (Table I). Based on their
location, the DNA sequencing of P2–536 bp may be divided into two
parts: the one almost overlapped with the sequence of P2–146 bp
fragment, while the latter part is also associated with the
sequence of Ig sequences. Thus, we hypothesize that the P2–536 bp
DNA fragments, amplified by the P2 PCR primer pair, are also the
non-specific amplification of P2–146 fragment of Ig sequences.
In conclusion, we occasionally found that the DG75
cell line, a B-cell lymphoma cell line with the potential to be
used as a positive control in the detection of Ig heavy chain GR,
was a bioclonal in GR, reported for the first time in the present
study.
References
|
1.
|
Segal GH: Assessment of B-cell clonality
by the polymerase chain reaction: a pragmatic overview. Adv Anat
Pathol. 3:195–203. 1996. View Article : Google Scholar
|
|
2.
|
Trainor KJ, Brisco MJ, Wan JH, Neoh S,
Grist S and Morley AA: Gene rearrangement in B- and
T-lymphoproliferative disease detected by the polymerase chain
reaction. Blood. 78:192–196. 1991.PubMed/NCBI
|
|
3.
|
Aubin J, Davi F, Nguyen-Salomon F, et al:
Description of a novel FR1 IgH PCR strategy and its comparison with
three other strategies of clonality in B cell malignancies.
Leukemia. 9:471–479. 1995.PubMed/NCBI
|
|
4.
|
Van Dongen J J, Langerak AW, Brüggemann M,
et al: Design and standardization of PCR primers and protocols for
detection of clonal immunoglobulin and T-cell receptor gene
recombinations in suspect lymphoproliferations: report of the
BIOMED-2 Concerted Action BMH4-CT98-3936. Leukemia. 17:2257–2317.
2003.PubMed/NCBI
|
|
5.
|
van Krieken JH, Langerak AW, Macintyre EA,
et al: Improved reliability of lymphoma diagnostics via PCR-based
clonality testing: report of the BIOMED-2 Concerted Action
BHM4-CT98-3936. Leukemia. 21:201–206. 2007.PubMed/NCBI
|
|
6.
|
Qi ZL, Zhang B, Han XQ, Zhu MG and Zhao T:
Primers for detecting gene rearrangement in different regions of
immunoglobulin heavy chain genes and their application in diagnosis
of paraffin-embedded lymphoma tissues. Nan Fang Yi Ke Da Xue Xue
Bao. 28:1964–1967. 2008.(In Chinese).
|
|
7.
|
Ben-Bassat H, Goldblum N, Mitrani S, et
al: Establishment in continuous culture of a new type of lymphocyte
from a ‘Burkitt like’ malignant lymphoma (line DG-75). Int J
Cancer. 19:27–33. 1977.PubMed/NCBI
|
|
8.
|
Scrideli CA, Defavery R, Bernardes JE and
Tone LG: Prognostic significance of bi/oligoclonality in childhood
acute lymphoblastic leukemia as determined by polymerase chain
reaction. Sao Paulo Med J. 119:175–180. 2001. View Article : Google Scholar : PubMed/NCBI
|
|
9.
|
Szczepañski T, Willemse MJ, van Wering ER,
van Weerden JF, Kamps WA and van Dongen JJ: Precursor-B-ALL with
D(H)-J(H) gene rearrangements have an immature immunogenotype with
a high frequency of oligoclonality and hyperdiploidy of chromosome
14. Leukemia. 15:1415–1423. 2001.PubMed/NCBI
|
|
10.
|
Choi Y, Greenberg SJ, Du TL, et al: Clonal
evolution in B-lineage acute lymphoblastic leukemia by
contemporaneous VH-VH gene replacements and VH-DJH gene
rearrangements. Blood. 87:2506–2512. 1996.PubMed/NCBI
|
|
11.
|
Bagg A: Immunoglobulin and T-cell receptor
gene rearrangements: minding your B’s and T’s in assessing lineage
and clonality in neoplastic lymphoproliferative disorders. J Mol
Diagn. 8:426–429. 2006.PubMed/NCBI
|