Introduction
Following the completion of the first human genome
sequence, the National Institutes of Health launched a substantial
effort to sequence the genomes of a number of cancers in hundreds
of patients (1). Over the past few
years these data and the genomic inferences gained from them, known
collectively as The Cancer Genome Atlas (TCGA), have begun to
appear in publically accessible form. These releases have been
accompanied by a very important series of data analyses under the
auspices of The Cancer Genome Atlas Research Network (www.nature.com/ng/focus/tcga/index.html)
(2–4). Among the information released is the
expression of up to 1,046 miRNAs in thousands of tumors. Given the
stringency governing the acquisition and preparation of materials
in the TCGA, both large- and small-scale global analyses of data
within and between various types of cancer can be carried out with
confidence previously unattainable.
In the present study, we extracted miRNA expression
data on seven types of cancer for the purpose of examining shared
and unique expression patterns. The cancer types we selected to
extract are uterine corpus adenocarcinoma (designated as ENDOCA),
ovarian serous adenocarcinoma (OVARCA), breast adenocarcinoma
(BRSTCA), prostate adenocarcinoma (PROSCA), pancreatic
adenocarcinoma (PANCCA), colorectal adenocarcinoma (COLNCA), and
lung adenocarcinoma (LUNGCA). Our rank order correlation analyses
of miRNA expression in these seven types of cancer reveal a high
degree of homogeneity. Closer examination of individual miRNAs
shows that evolutionarily ancient miRNA families are significantly
over-represented among the most highly expressed miRNAs. We
hypothesized that the two observations suggest that relatively
minor variations in miRNA expression are sufficient to play a role
in establishing and maintaining tumorigenesis and the regulatory
targets of many of the most highly expressed miRNAs are likely to
be involved in fundamental cellular processes that are
re-programmed in cancer.
Materials and methods
The data used in this study and the analyses
reported herein have been approved by the The Cancer Genome Atlas
Program Office at the National Cancer Institute of the United
States National Institutes of Health (25/10/13).
TCGA miRNA expression in each cancer was determined
via deep sequencing tumor-derived RNAs on the
IlluminaHiSeq_miRNASeq platform (?). Potential microRNA sequences
were verified against primary miRNA (pri-miRNA) and precursor miRNA
(pre-miRNA) sequences contained in the miRBase microRNA database.
Molecule counts for human miRNA sequences were standardized within
each miRNA and reported as ‘hits’ per megabase (106
bases). Standardization was performed to avoid bias potentially
introduced by closely related miRNAs or by miRNAs occurring in
clusters.
Standardized miRNA hit data for 1,046 miRNAs in 415
uterine corpus tumors (designated as ENDOCA), 770 breast tumors
(BRSTCA), 286 prostate tumors (PROSCA), 62 pancreatic tumors
(PANCCA), 478 colorectal tumors (COLNCA), and 482 lung tumors
(LUNGCA) were extracted. However, TCGA reported expression data on
only 680 miRNAs in 970 ovarian tumors (OVARCA). We therefore
generated two separate files, one without OVARCA containing 1,046
miRNAs for each tumor and one with OVARCA that was trimmed to
contain only 680 OVARCA miRNAs. In all of the miRNA hit data we
calculated the average number of hits per miRNA per cancer and then
re-ordered them. We compared miRNA expression in all seven cancer
types pairwise (21 total comparisons) using the Spearman Rank Order
Correlation (ρ) (5) (www.wessa.net/rankcorr.wasp). Statistical significance
was assessed by the t-test with (n−2) degrees of freedom.
Regulatory targets of miRNAs were predicted via a
number of different algorithms. Predicted target mRNA lists were
compiled from three sources: TargetScan (targetscan.org), PicTar
(pictar.mdc-berlin.de) and miRanda (microRNA.org). Targets
appearing on at least two of the three sources were compiled for
specific miRNAs and then supplemented with experimentally confirmed
targets listed in TarBase (diana.imis.athena-innovation.gr). The
mRNAs were then submitted for pathway analysis using The Database
for Annotation, Visualization and Integrated Discovery (DAVID)
version 6.7 online tool (6,7).
Results
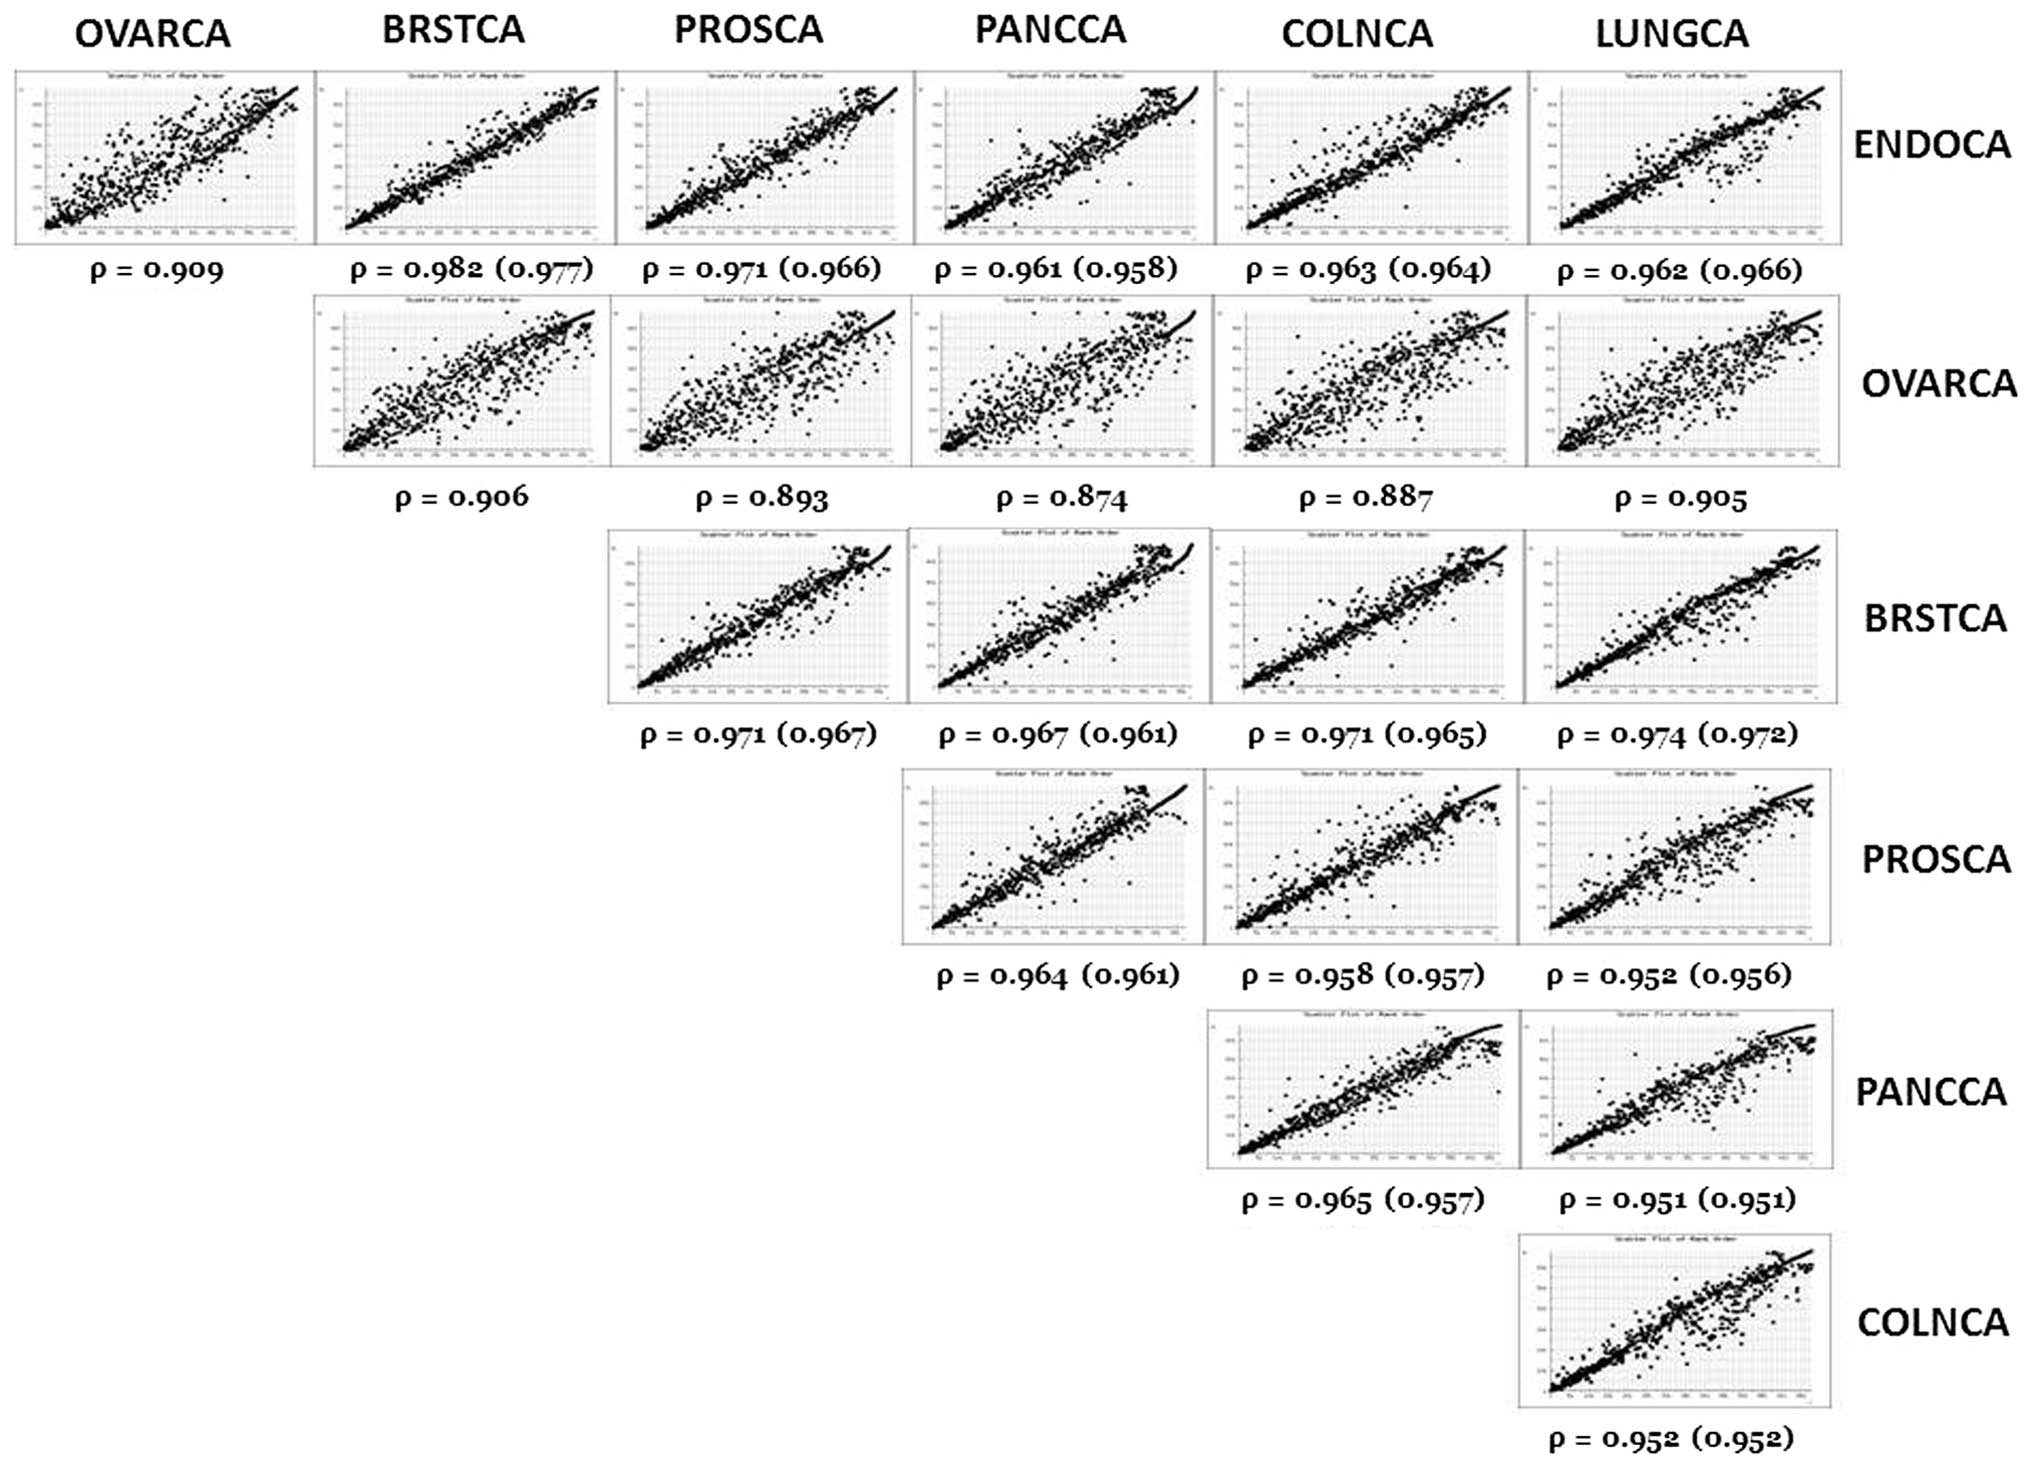
Pairwise rank order scatter plots of miRNA
expression among the seven types of cancer are shown in Fig. 1. These scatter plots indicate that
there is great similarity in miRNA expression ranks among all of
the cancers. This high degree of similarity is confirmed in the
Spearman Rank Order Correlations (ρ) (Fig. 1). Pairwise rank order correlations
are highly significant (p<0.0001), however, ovarian tumors
consistently exhibit the lowest correlations (mean ρ=0.896±0.014)
while breast tumors exhibit the highest correlations (mean
ρ=0.961±0.028). Scatter plots and correlations shown in Fig. 1 were determined using trimmed
(n=680) miRNA rank data, i.e., expression data for the six types of
cancer reporting 1,046 miRNAs were trimmed to match the 680 miRNAs
reported for ovarian cancer, after which the miRNAs were
re-ordered.
The Spearman Rank Order Correlations (ρ) among the
six types of cancer for which ranks were assigned on the basis of
1,046 miRNAs are also shown in Fig.
1. These correlations are almost identical to the trimmed
correlations. Thus, no bias was introduced by trimming the miRNA
ranks due to the fact that almost none of the 366 miRNAs that were
not included in the ovarian cancer data exhibit any expression
(mean hits ≤1.0) in the other six cancers.
Discussion
In the current study, we have presented a simple
rank correlation analysis of miRNA expression in seven types of
cancer: uterine, ovarian, breast, prostate, pancreas, colorectal
and lung. Our results show that all seven cancer types exhibit
significantly correlated miRNA expression patterns. Although highly
significant, the least similar of the expression patterns was
observed in comparisons with ovarian tumors, likely due to the fact
that, among the seven cancers, only ovarian tumors are uniformly of
the serous histologic type, which are known to be more aggressive
with a less favorable prognosis than the adenocarcinomas typical of
the other six cancers used in this study. Thus, histologic
similarity is potentially an aspect of the higher average miRNA
expression rank correlations among the other six cancers.
The initial impetus for analyzing TCGA miRNA
expression patterns originated from a previous study of miRNA
expression in endometrial adenocarcinoma (8). The aim of the study was to compare the
rank order correlation between our miRNA expression data, based on
qPCR miRNA arrays of eight tumors, with that of the TCGA, based
upon deep sequencing of 415 tumors. After censoring the two data
sets using human miRNA sequences archived in miRBase Release 20
(miRBase.org), the identity of 276 miRNAs was confirmed. An
expression rank order correlation showed that the two data sets
were in significant agreement (ρ=0.718, p<0.0001, df=274). Thus,
results obtained from our small miRNA study were entirely
consistent with those obtained in a large-scale study utilizing a
completely different technology. In a subsequent meta-analysis of
miRNA expression studies of endometrial cancers (9), we noted that many of the miRNAs whose
expression levels were reported to be significantly different in
endometrial adenocarcinomas compared with benign endometrial
tissues were involved in cell processes including response to
hypoxia, anti-apoptosis, the crucial epithelial to mesenchymal
transition and other cancer phenotypes such as invasiveness and
metastasis (10,11). In addition, we showed that these
chronically dysregulated miRNAs were all members of evolutionarily
ancient miRNA families (12–15).
It was found in the TCGA endometrial cancer data that the same
ancient miRNA families were significantly over-represented in the
most highly ranked miRNAs.
Examination of miRNA expression ranks of the other
six cancers showed that the same ancient miRNA families found to be
significantly over-represented among the most highly expressed
miRNAs in endometrial cancer were also significantly
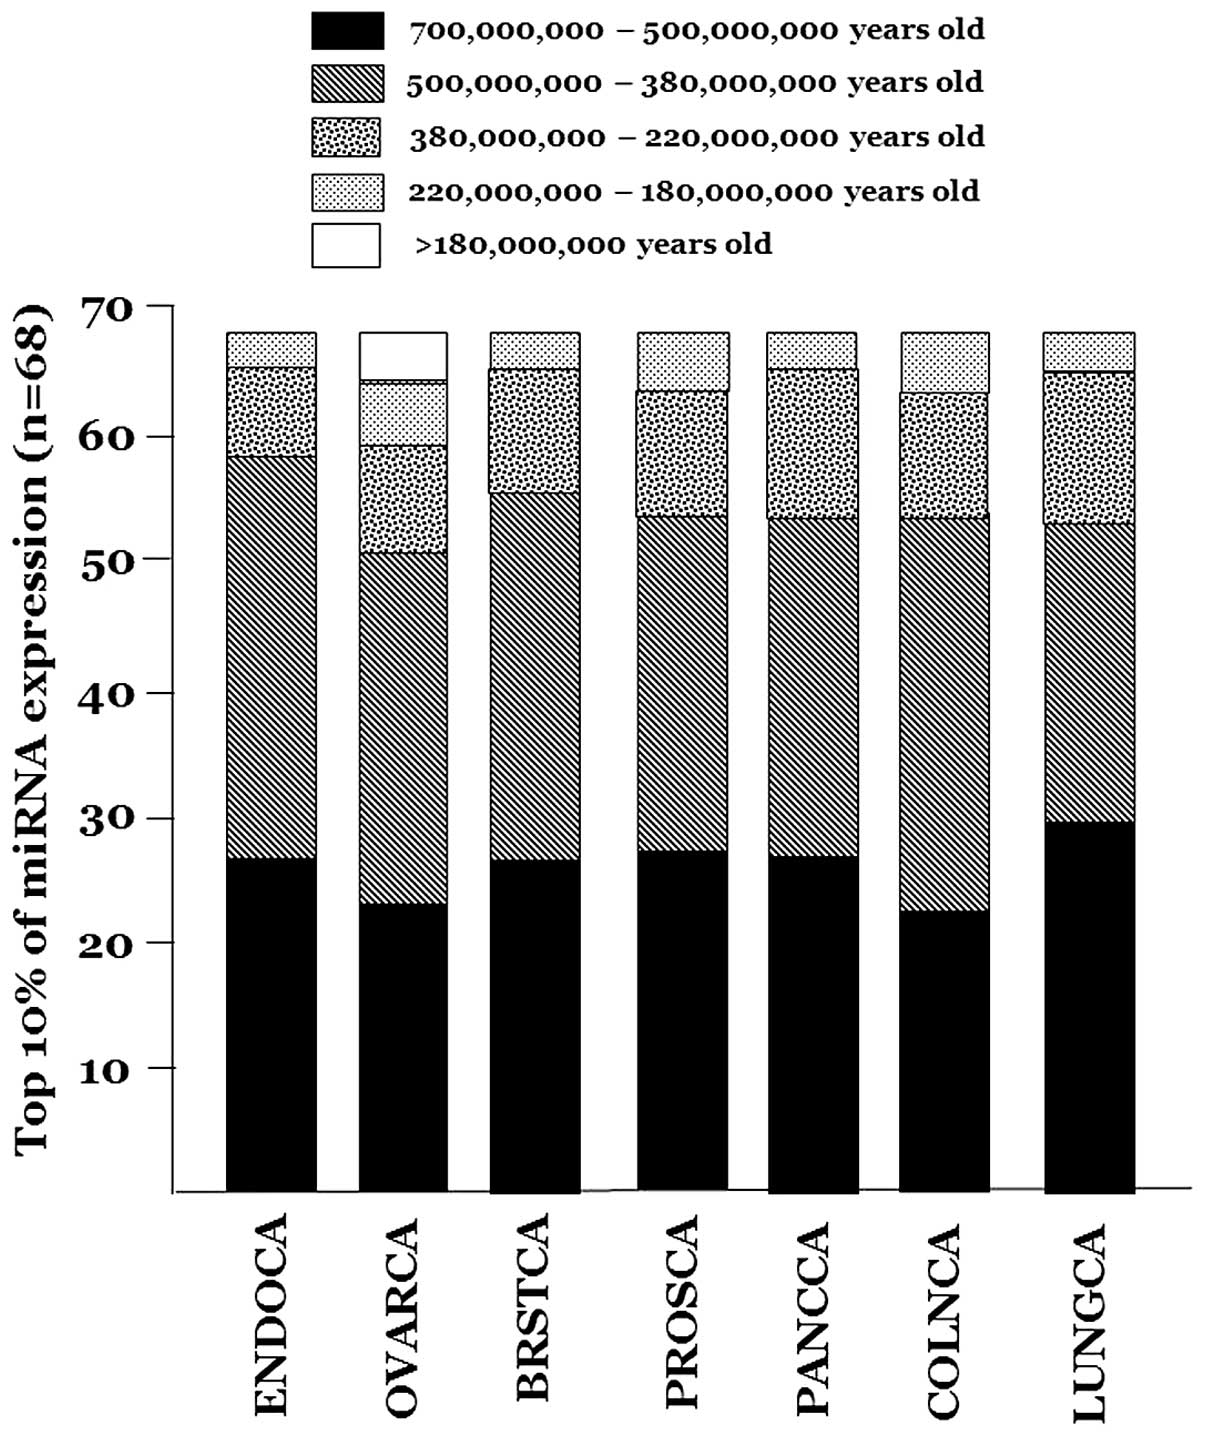
over-represented in the six types of cancer. There are 162 miRNAs
belonging to families that first appeared in animal genomes
>380,000,000 years ago, i.e., prior to the emergence of land
animals (16). In all seven cancer
types, the most ancient miRNAs comprise three quarters or more of
the top 10% of miRNA expression (Fig.
2). Moreover, among the miRNAs in the top 10% <380,000,000
years, almost none of the miRNAs is a member of a family that
post-dates the emergence of the Eutheria (mammals) 225,000,000
years ago (13,17).
Among the ‘younger’ miRNAs is the ubiquitous miR-21.
This miRNA is ranked first or second in six of the seven cancer
types examined in this study. miR-21 is well-known to play an
important role in a wide range of normal and pathologic biological
processes including development, inflammation, cardiovascular and
pulmonary function and cancer (18). Among the more ancient miRNAs, miR-10
is the oldest known animal miRNA family (13). The two members of this family have
average ranks of 9.9 (miR-10a; range, 3–27) and 8.1 (miR-10b;
range, 1–25) among the seven types of cancer. The DAVID analysis of
predicted miR-10 targets yielded a statistically significant
enrichment of pathways related to cell differentiation. Similarly,
miR-22, a single member family that first appeared among the bony
fishes ~400,000,000 years ago, has an average rank of 5.7 (range,
2–20). Among the predicted mRNA targets of miR-22 are known
cancer-related genes such as phosphatase and tensin homolog (PTEN),
metadherin (MTDH), cyclin-dependent kinase 6 (CDK6), and laminin γ1
(LAMC1). Several cancer-related pathways and pathways related to
the regulation of cell development are significantly enriched in
the miR-22 DAVID analysis. Other miRNAs, including the miR-200
family (miR-141, miR-200a,b,c and miR-429) and miR-205, which
emerged in animal genomes prior to the evolution of land animals,
are involved in regulating crucial cancer-related functions, such
as the epithelial to mesenchymal transition. This pattern is
repeated throughout the most highly expressed and ancient miRNAs.
We suggest that over-representation of these ancient miRNAs among
the most highly expressed miRNAs in various cancers is simply a
reflection of linkage between extremely ancient miRNAs and basic
cell processes that are re-programmed in cancer.
The results have shown that miRNA expression among
different human adenocarcinomas is significantly correlated.
Moreover, the ranks of the most highly expressed miRNAs in these
cancers are occupied by representatives of evolutionarily ancient
miRNA families. This pattern is the result of ancient linkages
between regulatory miRNAs and mRNA targets essential to
carcinogenesis. Thus, it is among these most ancient miRNAs and
their targets that attention should be focused. Recently, Hamilton
et al (19) discovered an
miRNA superfamily displaying pan-cancer oncogenic effects that are
linked together by a conserved, shared core seed sequence motif.
Members of this superfamily include miR-17, -18, -19, -93, -130,
-210, and -455 seed families. None of these seed families is
younger than 380,000,000 years.
Acknowledgements
This study was supported in part by NIH Grant
RO1CA99908 and in part by the Department of Obstetrics and
Gynecology Research Development Fund.
References
|
1
|
Collins FS and Barker AD: Mapping the
cancer genome. Pinpointing the genes involved in cancer will help
chart a new course across the complex landscape of human
malignancies. Sci Am. 296:50–57. 2007.PubMed/NCBI
|
|
2
|
Cancer Genome Atlas Research Network.
Weinstein JN, Collisson EA, Mills GB, et al: The Cancer Genome
Atlas Pan-Cancer analysis project. Nature Genet. 45:1113–1120.
2013. View
Article : Google Scholar : PubMed/NCBI
|
|
3
|
Kandoth C, McLellan MD, Vandin F, et al:
Mutational landscape and significance across 12 major cancer types.
Nature. 502:333–339. 2013. View Article : Google Scholar : PubMed/NCBI
|
|
4
|
Yang Y, Han L, Yuan Y, et al: Gene
co-expression network analysis reveals common system-level
properties of prognostic genes across cancer types. Nature Commun.
5:32312014.PubMed/NCBI
|
|
5
|
Spearman C: The proof and measurement of
association between two things. Am J Psychol. 15:72–101. 1904.
View Article : Google Scholar
|
|
6
|
Huang da W, Sherman BT and Lempicki RA:
Bioinformatics enrichment tools: paths toward the comprehensive
functional analysis of large gene lists. Nucleic Acids Res.
37:1–13. 2009.PubMed/NCBI
|
|
7
|
Huang da W, Sherman BT and Lempicki RA:
Systematic and integrative analysis of large gene lists using DAVID
bioinformatics resources. Nat Protoc. 4:44–57. 2009.PubMed/NCBI
|
|
8
|
Devor EJ, Hovey AM, Goodheart MJ,
Ramachandran S and Leslie KK: microRNA expression profiling of
endometrial endometrioid adenocarcinomas and serous adenocarcinomas
reveals profiles containing shared, unique and differentiating
groups of microRNAs. Oncol Rep. 26:995–1002. 2011.
|
|
9
|
Devor EJ, Goodheart MJ and Leslie KK:
Toward a microRNA signature of endometrial cancer. Proc Obstet
Gynecol. 2:22011.
|
|
10
|
DiLeva G and Croce CM: miRNA profiling of
cancer. Curr Opin Genet Dev. 23:3–11. 2013. View Article : Google Scholar
|
|
11
|
Lee YS and Dutta A: MicroRNAs in cancer.
Ann Rev Pathol. 4:199–207. 2009. View Article : Google Scholar
|
|
12
|
Hertel J, Lindemeyer M, Missal K, et al:
The expansion of the metazoan microRNA repertoire. BMC Genomics.
7:252006. View Article : Google Scholar : PubMed/NCBI
|
|
13
|
Sempere LF, Cole CN, McPeek MA and
Peterson KJ: The phylogenetic distribution of Metazoan microRNAs:
insights into evolutionary complexity and constraint. J Exp Zool B
Mol Dev Evol. 306:575–588. 2006. View Article : Google Scholar : PubMed/NCBI
|
|
14
|
Heimberg AM, Sempere LF, Moy VN, Donoghue
PC and Peterson KJ: MicroRNAs and the advent of vertebrate
morphological complexity. Proc Natl Acad Sci USA. 105:2946–2950.
2008. View Article : Google Scholar : PubMed/NCBI
|
|
15
|
Wheeler BM, Heimberg AM, Moy VN, Sperling
EA, Holstein TW, Heber S and Peterson KJ: The deep evolution of
metazoan microRNAs. Evol Dev. 11:50–68. 2009. View Article : Google Scholar : PubMed/NCBI
|
|
16
|
Daeschler EB, Shubin NH and Jenkins FA Jr:
A Devonian tetrapod-like fish and the evolution of the tetrapod
body plan. Nature. 440:757–763. 2006. View Article : Google Scholar : PubMed/NCBI
|
|
17
|
Lucas GS and Luo Z: Adelobaselius
from the Upper Triassic of West Texas: the oldest mammal. J Vert
Paleontol. 13:309–334. 1993. View Article : Google Scholar
|
|
18
|
Kumarswamy R, Volkmann I and Thum T:
Regulation and function of miRNA-21 in health and disease. RNA
Biol. 8:706–713. 2011. View Article : Google Scholar : PubMed/NCBI
|
|
19
|
Hamilton MP, Rajapakshe K, Hartig SM, et
al: Identification of a pan-cancer oncogenic microRNA superfamily
anchored by a central core seed motif. Nature Communications.
4:27302013. View Article : Google Scholar : PubMed/NCBI
|