Introduction
The liver is the largest internal organ that is
involved in a vast number of essential biochemical functions,
including metabolic, exocrine and endocrine systems. Hepatogenesis
is the process of liver formation, and the liver originates from
the gut endoderm. In rats, hepatic development begins at embryonic
day (ED) 9.5, as primitive epithelial cells of the foregut come
into contact with the cardiac mesoderm and form the liver
diverticulum. Subsequently, these cells invade the septum
transversum, proliferate extensively and differentiate further
(1). At ED 10.5, these cells
acquire the morphological appearance of immature liver epithelial
cells and are termed hepatoblasts, which are bipotential and
capable of generating hepatocyte and cholangiocyte cell lineages
(1,2). Germain et al (3) reported that hepatoblasts began to
differentiate to hepatocyte and cholangiocyte cells at ED 15 in
rats; however, Petkov et al (4) found that differentiation started at ED
16–17. Previous studies have found that certain molecular
mechanisms regulate hepatogenesis, such as cardiac tissue induction
and the role of the septum transversum mesenchyme, as well as the
presence of endothelial cells (5–7).
Several transcription factors are also involved in controlling
distinct aspects of hepatogenesis, including Prox1, which is
necessary for hepatoblast migration (8); homeobox factor Hex, which is essential
for morphogenesis and growth of the liver bud (9); HNF4, which is required for hepatocyte
differentiation and epithelial transformation of the liver
(10); and GATA6, which is required
for liver bud growth (11).
Hepatogenesis is an extremely intricate process, as
a variety of genes are involved and a complex network is formed.
However, certain mechanisms are not clear; numerous associated
genes have not been found. Future studies are required to
investigate how to get the endoderm reactive potency in liver
development, and to examine whether the upstream and downstream
activation mechanisms of the genes are involved. The interactions
between the epithelial and mesenchymal cells remain unclear.
In the present study, a rat genome-wide gene
expression bead chip was used to investigate the global patterns of
gene expression of the rat liver at ED 14 compared to adult rat
liver, which may provide specific information for the investigation
of hepatogenesis mechanism. The Illumina BeadChip is a forefront
chip technology, and its genome expression chip can be used for
human, mouse and rat genome-wide expression studies (12,13).
The rat genome microarray used could detect the expression of
21,910 genes. However, in our previous study (4), the microarray only focused on a
portion of the genes expressed during rat hepatogenesis. Therefore,
the current study involves the genome-wide analysis of
differentially-expressed genes.
Materials and methods
Animals and treatment
Two pregnant Sprague-Dawley rats at ED 14
(experimental group) and two adult female Sprague-Dawley rats
(control group) were purchased from the Experimental Animal Center
in Shandong University of Traditional Chinese Medicine (Shandong,
China). The livers of the rats were removed. All the experimental
animals used in the study were utilized under the protocol approved
by the Institutional Animal Care and Use Committee of Weifang
Medical University (Shandong, China).
Isolation of ED 14 and adult liver
cells
The cell suspensions from the ED 14 and adult rat
livers were prepared as previously reported (14). The cells were plated in
gelatin-coated dishes at a density of 15×106 cells per
10-cm plate. Following the removal of the hematopoietic cells (no
attachment) by washing with phosphate-buffered saline, the
epithelial cells were allowed to attach for 16 h.
RNA extraction and quality
assessment
Total RNA was isolated from frozen liver cells by
using TRIzol reagent (Invitrogen, Carlsbad, CA, USA) in accordance
with the manufacturer’s instructions. The samples were digested
with DNase (Invitrogen) and eluted with 30 μl RNase-free water. The
concentration and quality of the samples were measured by using the
DU-640 nucleic acid/protein analyzer (Beckman Coulter, Brea, CA,
USA).
Microarray analysis procedures
The microarray experiments (including sample
labeling, hybridization and initial data analysis) were performed
at Beijing Emei Tongde Technology Development Co., Ltd. (Beijing,
China). For each sample, biotinylated cRNA was prepared using an
Ambion Illumina TotalPrep RNA amplification kit (Applied
Biosystems, Foster City, CA, USA). Total RNA (5 μg) was converted
to double-stranded cDNA using T7-oligo (dT) primers. Subsequently,
an in vitro transcription reaction was performed to amplify
biotinylated cRNA, as described in the manufacturer’s instructions
(Illumina, Inc., San Diego, CA, USA). The biotinylated cRNA was
hybridized to a RatRef-12 Expression BeadChip platform that
contained 21,910 probes (Illumina, Inc.). Hybridization, washing
and scanning were performed in accordance with the manufacturer’s
instructions.
The chips were scanned by the BeadArray reader
(Illumina, Inc.). The microarray images were registered and
extracted automatically during the scan using the manufacturer’s
default settings.
Microarray data analysis
The microarray data were analyzed with Illumina
BeadStudio software (Illumina, Inc.). The average normalization
method was used. The sample intensities were scaled by a factor
equal to the ratio of the average intensity of the virtual sample
to the average intensity of the provided sample. The background was
subtracted prior to scaling. The average normalization minimizes
the amount of variation resulting from constant multiplicative
factors (including scanner power). The sample intensities were
scaled by a factor so that the average signal of all the samples
was equal to the global average of all the sample signals.
Background subtraction was performed prior to scaling, and
therefore, one-half of the unexpressed targets were predicted to
have negative signals.
The gene expression differences between the two
groups were calculated by DiffScore. The screening criteria for the
differences in gene expression were that the detection P-value of
the experimental or control group was <0.01 and the experimental
group DiffScore value was >20.
Gene ontology (GO) analysis was performed with the
GO classification system and using the database for annotation,
visualization and integrated discovery software (http://david.abcc.ncifcrf.gov/) (15). The over-representation of the genes
with altered expression within specific GO categories was
determined using the one-tailed Fisher’s exact probability test,
which was modified by adding a jack-knifing procedure. This
penalizes the significance of categories having extremely few (one
or two) genes and favors more robust categories having a larger
number of genes (16). A number of
these upregulated genes could be categorized into distinct,
differentially-expressed functional groups (including the genes
that are associated with the metabolism pathway, the cell cycle,
transcription, signal transduction, urine metabolism, cell
structure, transportation and apoptosis).
Quantitative polymerase chain reaction
(qPCR) experiment
To validate the microarray results, the 11 most
differentially and significantly expressed genes were selected for
qPCR analysis using the same RNA samples that were used for the
microarray. The ABI PRISM 7700 sequence detection system (Applied
Biosystems) was used to perform one-step qPCR. The results were
quantified as Ct values; this value signifies relative gene
expression (the ratio of target/control). qPCR results were
analyzed by the comparative Ct method (17). Table
I presents the primers used in the study. All the results are
expressed as mean ± standard deviation. Statistical analysis was
performed with analysis of variance followed by Student’s t-test
using SPSS 11.0 (SPSS, Inc., Chicago, IL, USA).. P<0.05 was
considered to indicate a statistically significant difference.
 | Table IOligonucleotide sequences of the
primers used for quantitative polymerase chain reaction. |
Table I
Oligonucleotide sequences of the
primers used for quantitative polymerase chain reaction.
| Gene symbol | Forward primer
(5-3′) | Reverse primer
(5-3′) |
|---|
| Hk2 |
CTGGTGCCCGACTGTGAT |
CCATTTCCACCTTCATTCTT |
| Eno2 |
GGGACAAACAGCGTTACTT |
CAATGTGGCGATAGAGGG |
| HMGA1 |
AGCCTTCGGTGAGTCCTGG |
GCTGTGCCCTTGTTCTTGC |
| Pde9a |
CCACCATCTCCCTTCTGA |
CTCCACCACTTTGAGTCCTT |
| KIF4 |
TTCCACCTAAGCCCAAAC |
CTCCTCCTCAGCCACAGA |
| Plag1 |
CCTTGCCTTCCAGCGAACT |
CGCCACCTTGTAACTCCATCAG |
| Orc1 |
GGATGATGCCGTCCAGTT |
CACCACGCTGATGGGAAA |
| Cspg2 |
GTAATGTGACGGATAGAACG |
GTAAATGGCTGGGAAGAG |
| Foxm1 |
ATCGCTACTTGACATTGGA |
CTCAGGATTGGGTCGTTT |
| Ccnf |
ACACCCACCGCAGAACTA |
TCTCCTGGTCTCCCTCAT |
| SPAG5 |
TGTAAAGGCCAAATAGAAC |
ACAATGGGAATGCTGACT |
| GAPDH |
AGACAGCCGCATCTTCTTGT |
CTTGCCGTGGGTAGAGTCAT |
Results
Screening of the gene expression profile
of ED 14 rat liver by microarray analysis
To screen the genes associated with ED 14 rat liver,
a genome-wide microarray analysis was performed using the Illumina
RatRef-12 Expression BeadChip (Illumina, Inc.), which contains
21,910 distinct rat oligonucleotide probes. This microarray chip
encompasses the largest number of rat genes that were available at
the time of the analysis. Total RNA was extracted from ED 14 and
adult rat liver cells. The extracted RNA was of high quality and
was homogeneous. Data analyses by average normalization of the
hybridization signals showed that the expressions of 787 genes were
upregulated in the ED 14 rat liver (DiffScore values, >20). A
number of these highly-expressed genes could be grouped into
distinct, differentially-expressed functional groups based on the
GO classification system. These upregulated genes included those
that are associated with the metabolism pathway, the cell cycle,
transcription, signal transduction, purine metabolism, cell
structure, transportation and apoptosis (Table II).
| Table IIGenes with increased expression in the
embryonic day 14 rat livera. |
Table II
Genes with increased expression in the
embryonic day 14 rat livera.
| Gene symbol | Definition | Accession no. | Detection
P-value | DiffScore |
|---|
| Metabolism
pathway | | | | |
| Hk2 | Hexokinase 2 | NM_012735.1 | 0 | 360.045 |
| Eno2 | Eenolase 2, γ | NM_139325.1 | 0 | 360.045 |
| Galnt7 |
UDP-N-acetyl-α-D-galactosamine:polypeptide
N-acetylgalactosaminyltransferase 7 | NM_022926.1 | 0.00121 | 106.51 |
| Gcnt1 | Glucosaminyl
(N-acetyl) transferase 1, core 2 | XM_579453.1 | 0.00121 | 88.097 |
|
Hsd11b2 | Hydroxysteroid 11-β
dehydrogenase 2 | NM_017081.1 | 0.00121 | 86.04 |
| Sphk1 | Sphingosine kinase
1 | NM_133386.2 | 0.00242 | 79.566 |
|
Galntl1 |
UDP-N-acetyl-α-D-galactosamine:polypeptide
N-acetylgalactosaminyltransferase-like 1, transcript variant 2
(predicted) | XM_001053416.1 | 0 | 74.865 |
| Galnt3 |
UDP-N-acetyl-α-D-galactosamine:polypeptide
N-acetylgalactosaminyltransferase 3 | NM_001015032.2 | 0.00242 | 53.1 |
| Eno1 | Enolase 1, α | NM_012554.1 | 0.00242 | 48.033 |
| Gad1 | Glutamic acid
decarboxylase 1 | NM_017007.1 | 0.00121 | 34.698 |
| Gfpt1 | Glutamine
fructose-6-phosphate transaminase 1 | NM_001005879.1 | 0.00242 | 31.043 |
| Dbh | Dopamine β
hydroxylase | NM_013158.1 | 0.00364 | 24.062 |
| Cell cycle | | | | |
| Cdc23 | Cell division cycle
23, yeast, homolog | XM_214588.4 | 0.00242 | 67.5 |
| Ccne1 | Cyclin E | XM_574426.1 | 0.00242 | 58.898 |
| Ccnf | Cyclin F | XM_001054372.1 | 0 | 360.045 |
| E2f1 | E2F transcription
factor 1 | XM_230765.4 | 0.00121 | 130.672 |
| Tgfβ3 | Transforming growth
factor, β3 | NM_013174.1 | 0.00242 | 22.983 |
| Mapk8 | Mitogen-activated
protein kinase 8 | XM_341399.2 | 0.00242 | 28.211 |
| SPAG5 | Sperm-associated
antigen 5 | XM_340848.3 | 0 | 360.045 |
| Nfκb1 | Nuclear factor of κ
light chain gene enhancer in B-cells 1, p105 | XM_001075876.1 | 0.00242 | 34.263 |
| Transcription | | | | |
| E2f1 | E2F transcription
factor 1 | XM_230765.4 | 0.00121 | 130.672 |
| HMGA1 | High-mobility group
AT-hook 1 | NM_139327.1 | 0 | 360.045 |
| Bmp4 | Bone morphogenetic
protein 4 | NM_012827.1 | 0.00242 | 79.573 |
| Nkx2-5 | NK2 transcription
factor related, locus 5 (Drosophila) | NM_053651.1 | 0.00242 | 63.247 |
| Rai14 | Retinoic acid
induced 14 | NM_001011947.1 | 0.00121 | 108.339 |
| Twist1 | Twist gene homolog
1 (Drosophila) | NM_053530.2 | 0 | 143.869 |
| Foxm1 | Forkhead box
M1 | NM_031633.1 | 0 | 360.045 |
| Zfhx1b | Zinc finger
homeobox 1b | NM_001033701.1 | 0.00242 | 35.255 |
| Sst | Somatostatin | NM_012659.1 | 0.00121 | 65.352 |
| Myog | Myogenin | NM_017115.2 | 0.00242 | 36.437 |
| Hdac7a | Histone deacetylase
7A | XM_345868.3 | 0.00242 | 60.799 |
| Lef1 | Lymphoid enhancer
binding factor 1 | NM_130429.1 | 0 | 57.738 |
| Runx1 | Runt-related
transcription factor 1 | NM_017325.1 | 0.00121 | 34.814 |
| Signal
transduction | | | | |
| Cpt1c | Carnitine
palmitoyltransferase 1c | XM_001078512.1 | 0.00242 | 49.495 |
| Fbxl12 | F-box and
leucine-rich repeat protein 12 | NM_001025700.1 | 0.00242 | 27.332 |
| Pde9a | Phosphodiesterase
9A | NM_138543.1 | 0 | 360.045 |
| Dnmt2 | DNA
methyltransferase 2 | NM_001031643.1 | 0.00242 | 40.064 |
| Bmp4 | Bone morphogenetic
protein 4 | NM_012827.1 | 0.00242 | 79.573 |
| Fbxl12 | F-box and
leucine-rich repeat protein 12 | NM_001025700.1 | 0.00242 | 27.332 |
| HMGA1 | High-mobility group
AT-hook 1 | NM_139327.1 | 0 | 360.045 |
| Hnrpa1 | Heterogeneous
nuclear ribonucleoprotein A1 | NM_017248.1 | 0.00242 | 81.233 |
| Hrc | Histidine-rich
calcium-binding protein | NM_181369.2 | 0.00242 | 30.671 |
| Zfhx1b | Zinc finger
homeobox 1b | NM_001033701.1 | 0.00242 | 35.255 |
| Cutl1 | Cut-like 1
(Drosophila) | XM_001070482.1 | 0.00242 | 84.871 |
| Mapk8 | Mitogen-activated
protein kinase 8 | XM_341399.2 | 0.00242 | 28.211 |
| Ptk2 | PTK2 protein
tyrosine kinase 2 | NM_013081.1 | 0.00242 | 47.335 |
| Crk | v-Crk sarcoma virus
CT10 oncogene homolog (avian) | NM_019302.1 | 0.00242 | 38.966 |
| Pscd3 | Pleckstrin
homology, Sec7 and coiled-coil domains 3 | NM_053912.2 | 0.00242 | 48.629 |
| Fgf12 | Fibroblast growth
factor 12 | NM_130814.1 | 0.00242 | 21.89 |
| Kit | v-Kit
Hardy-Zuckerman 4 feline sarcoma viral oncogene homolog | NM_022264.1 | 0.00242 | 32.155 |
| Purine
metabolism | | | | |
| Gmpr | Guanosine
monophosphate reductase | NM_057188.1 | 0 | 63.736 |
| Adcy8 | Adenylate cyclase 8
(brain) | NM_017142.1 | 0.00242 | 43.906 |
| Adcy2 | Adenylate cyclase 2
(brain) | NM_031007.1 | 0 | 36.184 |
| Adcy3 | Adenylate cyclase
3 | NM_130779.1 | 0.00242 | 25.177 |
| Pde9a | Phosphodiesterase
9A | NM_138543.1 | 0 | 360.045 |
| Cell structure | | | | |
| Actn1 | Actinin α1 | NM_031005.2 | 0.00242 | 30.32 |
| Actn3 | Actinin α3 | NM_133424.1 | 0.00242 | 39.463 |
| Cspg2 | Chondroitin
sulphate proteoglycan 2 | XM_215451.4 | 0 | 360.045 |
| Ptk2 | Protein tyrosine
kinase 2 | NM_013081.1 | 0.00242 | 47.335 |
| Transportation | | | | |
|
Slc18a2 | Solute carrier
family 18 (vesicular monoamine), member 2 | NM_013031.1 | 0.00242 | 29.17 |
|
Slc29a2 | Solute carrier
family 29 (nucleoside transporters), member 2 | NM_031738.1 | 0.00242 | 31.183 |
|
Slc39a6 | Solute carrier
family 39 (metal ion transporter), member 6 | NM_001024745.1 | 0.00121 | 111.965 |
| Slc6a4 | Solute carrier
family 6 (neurotransmitter transporter, serotonin), member 4 |
NM_013034.10.00242 | 50.804 | |
| Slc9a5 | Solute carrier
family 9 (sodium/hydrogen exchanger), member 5 | NM_138858.1 | 0.00121 | 133.543 |
| KIF4 | Kinesin family
member 4 | XM_343797.3 | 0 | 360.045 |
| Apoptosis | | | | |
| Anp32a | Acidic
(leucine-rich) nuclear phosphoprotein 32 family, member A | NM_012903.1 | 0.00242 | 46.678 |
| Orc1 | Origin recognition
complex, subunit 1 | NM_177931.2 | 0 | 360.045 |
| Plag1 | Pleiomorphic
adenoma gene 1 | NM_001008316.1 | 0 | 360.045 |
| Mapk8 | Mitogen-activated
protein kinase 8 | XM_341399.2 | 0.00242 | 28.211 |
| E2f1 | E2F transcription
factor 1 | XM_230765.4 | 0.00121 | 130.672 |
| Smo | Smoothened homolog
(Drosophila) | NM_012807.1 | 0.00242 | 71.987 |
| Ccne1 | Cyclin E | XM_574426.1 | 0.00242 | 58.898 |
| Actn3 | Actinin α3 | NM_133424.1 | 0.00242 | 39.463 |
| Inhα | Inhibin α | NM_012590.1 | 0.00242 | 55.708 |
| Trim35 | Tripartite motif
protein 35 | NM_001025142.1 | 0.00121 | 124.313 |
| Phlda1 | Pleckstrin
homology-like domain, family A, member 1 | NM_017180.1 | 0.00242 | 43.949 |
| Sst | Somatostatin | NM_012659.1 | 0.00121 | 65.352 |
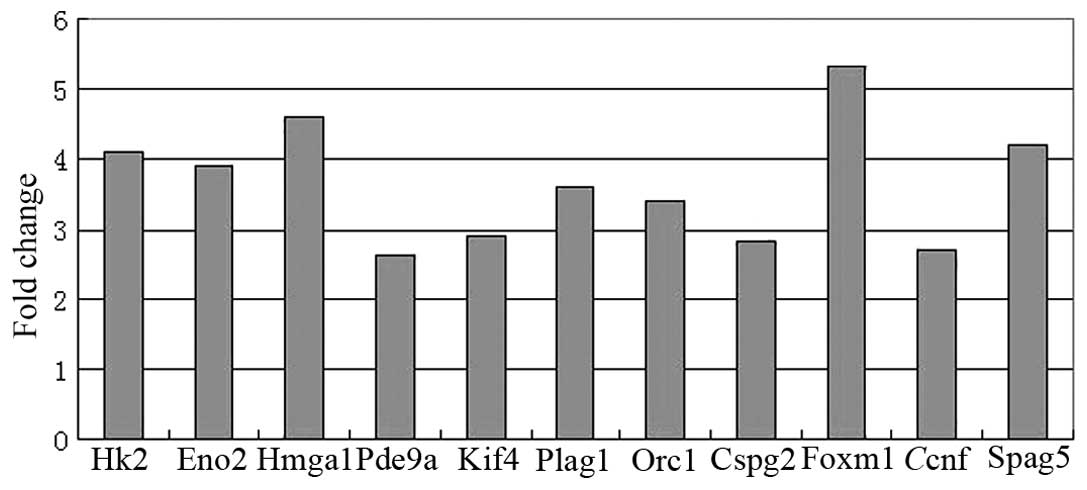
qPCR analysis
Fig. 1 shows the
results of the qPCR experiment for 11 genes. The expression of the
11 genes were all significantly increased in ED 14 rat liver
(P<0.05), compared to their expression in adult rat liver,
confirming the validity of the microarray results.
Discussion
In the present study, the gene expression pattern of
ED 14 rat liver compared to adult rat liver was investigated. The
microarray analysis initially suggested that there were 787
candidate genes. Some of the identified genes are known to be
involved in hepatogenesis. A previous study reported that high
levels of Bmp4 expression within the septum transversum mesenchyme
implied a significant role for Bmp4 signaling during hepatogenesis
(5). A number of these
highly-expressed genes can be grouped into distinct,
differentially-expressed functional groups based on the GO
classification system. These upregulated genes include genes that
are associated with the metabolism pathway, cell cycle,
transcription, signal transduction, purine metabolism, cell
structure, transportation and apoptosis. qPCR confirmed that 11
genes were significantly and differentially expressed. These
differentially-expressed genes may provide certain information for
the investigation of hepatogenesis mechanism.
In the adult rat liver, numerous genes belonging to
the group of genes associated with the metabolism pathway were
expressed at extremely low levels or were not expressed. However,
the function of certain genes remains unknown. The Hk2,
Eno2, Eno1, Galnt7, Slc1a3,
Galnt1 and Galnt3 genes are involved in glucose
metabolism. Hk2 can catalyze glucose, mannose, glucosamine and
fructose into their respective 6-phosphate form through an
irreversible phosphorylation reaction. Enolase (also known as
phosphoglycerate hydrolase) is a critical enzyme for adenosine
triphosphate synthesis in glycolysis, and is responsible for
catalyzing the conversion of 2-phosphoglycerate to
phosphoenolpyruvate and in catalyzing the reverse reaction during
gluconeogenesis (18). Eno1 exists
in the majority of tissues. However, recent studies have shown that
Enol has a transcriptional regulatory function as it can combine
with the c-Myc promoter region, which can inhibit c-Myc
transcriptional function. The present study found increased Eno1
expression in the embryonic liver. This action may be associated
with increased glycolysis in the embryonic liver tissue. Eno2 (also
known as NSE) is the homodimer of γ subunits and is primarily found
in neurons and neuroendocrine tissues.
An example of a gene associated with the cell cycle
is cyclin F, which belongs to the F-box protein family that is
characterized by a ~40-amino acid motif. In contrast to the
majority of cyclins, it does not bind or activate any
cyclin-dependent kinases. However, cyclin F, similar to other
cyclins, oscillates during the cell cycle with protein levels; it
peaks in the G2 phase. Through its ability to restrain the
expression of CP110, cyclin F plays a significant role in limiting
centrosome duplication and in maintaining chromosome stability
(19).
A spindle-binding protein, SPAG5 (also known as
astrin, hMAP126), plays an important role in the regulation of
mitosis. SPAG5 is located in the centromere during the medium term
of mitosis. The downregulation of SPAG5 expression results in
spindle deformity and may delay mitosis and therefore result in
cell cycle arrest at the G2/M phase (20). Glycogen synthase kinase 3β (GSK3β)
binds with SPAG5 and subsequently phosphorylates and regulates the
location of SPAG5 in the spindle and centrioles. Kif2b, CLASP1 and
SPAG5 (astrin) form a molecular switch in the centromere to
regulate centromere and microtubule dynamics, promote the process
of mitosis and maintain mitosis loyalty (21).
For the genes associated with transcription,
high-mobility group AT-hook 1 (HMGA1) is a non-histone protein
involved in numerous cellular processes, including the regulation
of inducible gene transcription, integration of retroviruses into
chromosomes and metastatic progression of cancer cells (22). The level of HMGA is high in
embryonic tissues and insignificant in normal adult tissues. As
early as ED 8.5, HMGA1 transcripts are highly detectable in all
embryonic tissues. During mid-late gestation, its expression is
gradually confined to specific body organs and tissues, including
the central nervous system (primarily confined to the germinal
layer), primordial liver, kidney and the retina. The high
expression of the HMGA1 gene is associated with cell
proliferation and to establishing the correct identity of
particular cells types (23). As a
transcription regulatory factor, HMGA1 could stimulate the binding
of nuclear factor-κB to the interferon-β promoter interacting with
the p50 and p65 subunits. The HMGA1 proteins may be involved in
organizing chromatin at the local level to provide the correct
architecture for other transcription factors that are associated
with playing a significant role in controlling growth.
The Foxm1 protein is a proliferation-specific member
of the Fox family. Liver regeneration markedly induces Foxm1b
expression at the G1/S transition and continues throughout
hepatocyte proliferation.
Several signal transducers are also upregulated in
rat embryonic liver. Pde9a, which maps to human chromosome
21q22.3 between TFF1 and D21S360, includes >20
splice variants, potentially changing the N-terminal amino acid
sequences of the encoded proteins. Pde9a is highly expressed in the
brain, heart, placenta, adult and embryonic kidney, spleen,
prostate and colon (24), has a
high affinity for cyclic guanosine 3′,5′-monophosphate (cGMP) and
can catalyze the hydrolysis of cGMP to the corresponding nucleoside
5′-monophosphate.
In association with the cell structure, the protein
Cspg2 belongs to the extracellular matrix chondroitin sulphate
proteoglycan family. Cspg2 has four isoforms, labeled V0–V3. The
isoforms V0 and V1 are highly expressed during embryonic
development and their expression decreases following tissue
maturation. Cspg2 is involved in extracellular matrix assembly and
in controlling cell adhesion, proliferation, migration and
apoptosis (25). In the mesenchymal
cell condensation area, Cspg2 is highly expressed during the
development of cartilage, heart, hair follicles and kidney. In
vitro evidence shows that the Cspg2 V0 and V1 isoforms are
involved in precartilage mesenchymal condensation and subsequent
chondrogenesis (26). The
requirement of Cspg2 in development is highlighted by the finding
that a Cspg2 deficiency (in a transgenic mouse model) is
embryonically lethal due to defects in cardiac formation, limb
mesenchymal aggregation and chondrogenesis (27). However, the overexpression of Cspg2
in the embryonic liver has not been reported previously.
The group that consists of the genes associated with
transportation includes a variety of genes involved in material
transportation, such as solute carrier family 18, member 2
(Slc18a2), which transports vesicular monoamine; Slc29a2 (which
transports nucleosides); Slc39a10, which transports zinc ions);
Slc39a6, which transports metal ions; Slc6a4, which is a
neurotransmitter transporter; Slc9a5, which is a
Na+/H+ transporter protein; and KIF4, which
transports cytoplasmic vesicles. The transport of these substances
can regulate the activities of certain significant biological
enzymes. Specific substances form cofactors and particular
substances are involved in the signal transduction processes of
growth factors or hormones.
Hepatogenesis requires the growth and proliferation
of certain cells and the removal of others by apoptosis. However,
only a limited number of genes associated with apoptosis were
present on the chips in the present study. The pleomorphic adenoma
gene 1 (Plag1) is a novel developmentally-regulated
C2H2 zinc finger gene. The deduced amino acid
sequence of the Plag1 protein shows seven canonical
C2H2 zinc finger domains and a serine-rich C
terminus; the latter may have a regulatory function. According to
Pendeville et al (28), the
embryonic lung and liver, but not adult organs, primarily express
Plag1. However, Plag1 has been found in a variety of tumors. The
oncogenic activity of Plag1 results from its positive regulation of
insulin growth factor 2 (IGF-II) expression. The peptide growth
factor IGF-II plays an important role in embryonic development and
carcinogenesis. The expression of IGF-II is primarily located in
hepatocytes of the embryonic and neonatal liver (29). These findings indicate that the
upregulation of Plag1 could reduce the apoptosis rate of cancer
cells.
Orc1 is the largest subunit of the origin
recognition complex (ORC), which plays a critical role during the
initiation of DNA replication in eukaryotes. The expression level
of the Orc1 subunit oscillates throughout the cell cycle (which
defines an Orc1 cycle); it accumulates during the G1 phase and is
degraded during the S phase. By controlling the progression of the
S phase, Orc1 regulates the growth of animal cells. Orc1 is closely
correlated with cell proliferation and the cell cycle and strictly
controls the progress of the cell cycle. Saha et al
(30) found that low Orc1 levels
could rapidly induce caspase-3 activity, which subsequently induces
p53-independent apoptosis. Orc1 is expressed in the adult brain and
muscle and in numerous embryonic tissues. However, no studies have
been performed regarding its expression in the liver. The results
of the present study show that Orc1 may play a multifunctional role
in the embryonic liver, and it possibly functions as a mediator of
p53-independent apoptosis.
In conclusion, 11 upregulated genes were found in
the ED 14 rat liver compared to the adult rat liver, which may
provide novel insights into the molecular mechanisms that control
hepatogenesis. These overexpressed genes are potential markers for
identifying hepatic progenitor cells.
Acknowledgements
The present study was supported by the Shandong
Province Natural Science Foundation (grant nos. ZR2010HM006,
ZR2010HM065 and ZR2010HM087), the Shandong Province Higher
Educational Science and Technology Program (grant nos. J07WE27 and
J11LF14), the Shandong Province Medicine and Health Science
Technology Program (grant no. 2013WS0279) and the Shandong Province
Taishan Scholar Project.
References
|
1
|
Zaret KS: Hepatocyte differentiation: from
the endoderm and beyond. Curr Opin Genet Dev. 11:568–574. 2001.
View Article : Google Scholar : PubMed/NCBI
|
|
2
|
Houssaint E: Differentiation of the mouse
hepatic primordium. I. An analysis of tissue interactions in
hepatocyte differentiation. Cell Differ. 9:269–279. 1980.
View Article : Google Scholar : PubMed/NCBI
|
|
3
|
Germain L, Blouin MJ and Marceau N:
Biliary epithelial and hepatocytic cell lineage relationships in
embryonic rat liver as determined by the differential expression of
cytokeratins, alpha-fetoprotein, albumin, and cell surface-exposed
components. Cancer Res. 48:4909–4918. 1988.
|
|
4
|
Petkov PM, Zavadil J, Goetz D, et al: Gene
expression pattern in hepatic stem/progenitor cells during rat
fetal development using complementary DNA microarrays. Hepatology.
39:617–627. 2004. View Article : Google Scholar : PubMed/NCBI
|
|
5
|
Rossi JM, Dunn NR, Hogan BL and Zaret KS:
Distinct mesodermal signals, including BMPs from the septum
transversum mesenchyme, are required in combination for
hepatogenesis from the endoderm. Genes Dev. 15:1998–2009. 2001.
View Article : Google Scholar : PubMed/NCBI
|
|
6
|
Matsumoto K, Yoshitomi H, Rossant J and
Zaret KS: Liver organogenesis promoted by endothelial cells prior
to vascular function. Science. 294:559–563. 2001. View Article : Google Scholar : PubMed/NCBI
|
|
7
|
Jung J, Zheng M, Goldfarb M and Zaret KS:
Initiation of mammalian liver development from endoderm by
fibroblast growth factors. Science. 284:1998–2003. 1999. View Article : Google Scholar : PubMed/NCBI
|
|
8
|
Sosa-Pineda B, Wigle JT and Oliver G:
Hepatocyte migration during liver development requires Prox1. Nat
Genet. 25:254–255. 2000. View
Article : Google Scholar : PubMed/NCBI
|
|
9
|
Keng VW, Yagi H, Ikawa M, et al: Homeobox
gene Hex is essential for onset of mouse embryonic liver
development and differentiation of the monocyte lineage. Biochem
Biophys Res Commun. 276:1155–1161. 2000. View Article : Google Scholar : PubMed/NCBI
|
|
10
|
Watt AJ, Garrison WD and Duncan SA: HNF4:
a central regulator of hepatocyte differentiation and function.
Hepatology. 37:1249–1253. 2003. View Article : Google Scholar : PubMed/NCBI
|
|
11
|
Zhao R, Watt AJ, Li J, Luebke-Wheeler J,
Morrisey EE and Duncan SA: GATA6 is essential for embryonic
development of the liver but dispensable for early heart formation.
Mol Cell Biol. 25:2622–2631. 2005. View Article : Google Scholar : PubMed/NCBI
|
|
12
|
Uppalapati D, Ohta N, Zhang Y, et al:
Identification and characterization of unique tumoricidal genes in
rat umbilical cord matrix stem cells. Mol Pharm. 8:1549–1558. 2011.
View Article : Google Scholar : PubMed/NCBI
|
|
13
|
Chen YF, Pottala JV, Weltman NY, Ge X,
Savinova OV and Gerdes AM: Regulation of gene expression with
thyroid hormone in rats with myocardial infarction. PLoS One.
7:e401612012. View Article : Google Scholar : PubMed/NCBI
|
|
14
|
Dabeva MD, Petkov PM, Sandhu J, Oren R,
Laconi E, Hurston E and Shafritz DA: Proliferation and
differentiation of fetal liver epithelial progenitor cells after
transplantation into adult rat liver. Am J Pathol. 156:2017–2031.
2000. View Article : Google Scholar : PubMed/NCBI
|
|
15
|
Jiao X, Sherman BT, Huang da W, Stephens
R, Baseler MW, Lane HC and Lempicki RA: DAVID-WS: a stateful web
service to facilitate gene/protein list analysis. Bioinformatics.
28:1805–1806. 2012. View Article : Google Scholar : PubMed/NCBI
|
|
16
|
Hosack DA, Dennis G Jr, Sherman BT, Lane
HC and Lempicki RA: Identifying biological themes within lists of
genes with EASE. Genome Biol. 4:R702003. View Article : Google Scholar : PubMed/NCBI
|
|
17
|
Nishimura M and Naito S: Tissue-specific
mRNA expression profiles of human carbohydrate sulfotransferase and
tyrosylprotein sulfotransferase. Biol Pharm Bull. 30:821–825. 2007.
View Article : Google Scholar : PubMed/NCBI
|
|
18
|
Pancholi V: Multifunctional alpha-enolase:
its role in diseases. Cell Mol Life Sci. 58:902–920. 2001.
View Article : Google Scholar : PubMed/NCBI
|
|
19
|
D’Angiolella V, Donato V, Vijayakumar S,
et al: SCF(Cyclin F) controls centrosome homeostasis and mitotic
fidelity through CP110 degradation. Nature. 466:138–142.
2010.PubMed/NCBI
|
|
20
|
Du J, Jablonski S, Yen TJ and Hannon GJ:
Astrin regulates Aurora-A localization. Biochem Biophys Res Commun.
370:213–219. 2008. View Article : Google Scholar : PubMed/NCBI
|
|
21
|
Mack GJ and Compton DA: Analysis of
mitotic microtubule-associated proteins using mass spectrometry
identifies astrin, a spindle-associated protein. Proc Natl Acad Sci
USA. 98:14434–14439. 2001. View Article : Google Scholar : PubMed/NCBI
|
|
22
|
Ben-Porath I, Thomson MW, Carey VJ, Ge R,
Bell GW, Regev A and Weinberg RA: An embryonic stem cell-like gene
expression signature in poorly differentiated aggressive human
tumors. Nat Genet. 40:499–507. 2008. View
Article : Google Scholar : PubMed/NCBI
|
|
23
|
Chiappetta G, Avantaggiato V, Visconti R,
et al: High level expression of the HMGI (Y) gene during embryonic
development. Oncogene. 13:2439–2446. 1996.PubMed/NCBI
|
|
24
|
Rentero C, Monfort A and Puigdomènech P:
Identification and distribution of different mRNA variants produced
by differential splicing in the human phosphodiesterase 9A gene.
Biochem Biophys Res Commun. 301:686–692. 2003. View Article : Google Scholar : PubMed/NCBI
|
|
25
|
Theocharis AD: Versican in health and
disease. Connect Tissue Res. 49:230–234. 2008. View Article : Google Scholar : PubMed/NCBI
|
|
26
|
Kamiya N, Watanabe H, Habuchi H, Takagi H,
Shinomura T, Shimizu K and Kimata K: Versican/PG-M regulates
chondrogenesis as an extracellular matrix molecule crucial for
mesenchymal condensation. J Biol Chem. 281:2390–2400. 2006.
View Article : Google Scholar : PubMed/NCBI
|
|
27
|
Williams DR Jr, Presar AR, Richmond AT,
Mjaatvedt CH, Hoffman S and Capehart AA: Limb chondrogenesis is
compromised in the versican deficient hdf mouse. Biochem Biophys
Res Commun. 334:960–966. 2005. View Article : Google Scholar : PubMed/NCBI
|
|
28
|
Pendeville H, Peers B, Kas K and Voz ML:
Cloning and embryonic expression of zebrafish PLAG genes. Gene Expr
Patterns. 6:267–276. 2006. View Article : Google Scholar : PubMed/NCBI
|
|
29
|
Voz ML, Agten NS, Van de Ven WJ and Kas K:
PLAG1, the main translocation target in pleomorphic adenoma of the
salivary glands, is a positive regulator of IGF-II. Cancer Res.
60:106–113. 2000.PubMed/NCBI
|
|
30
|
Saha T, Ghosh S, Vassilev A and
DePamphilis ML: Ubiquitylation, phosphorylation and Orc2 modulate
the subcellular location of Orc1 and prevent it from inducing
apoptosis. J Cell Sci. 119:1371–1382. 2006. View Article : Google Scholar : PubMed/NCBI
|