Introduction
Diabetes mellitus is one of the most severe types of
metabolic disorder in humans globally, and is characterized by
insulin resistance and impaired insulin secretion (1). Long-term hyperglycemia in diabetics leads
to many complications with tissues that require insulin for glucose
entrance or with insulin-independent organs (2), and cataracts are one of the most common
complications of exposure to uncontrolled chronic hyperglycemia in
diabetes. It has been reported that the onset of cataracts in
diabetic patients is 20 years earlier than in non-diabetic subjects
(3).
Activation of the polyol pathway (4), non-enzymatic glycation of lens proteins
(5–8) and
increased oxidative stress (9–13) were reported as pathogenetic mechanisms
of diabetic cataracts. In the polyol pathway, the excess glucose
changes to sorbitol via aldose reductase and the excessive
accumulation of sorbitol in the crystalline lens produces a high
osmotic gradient, and causes the collapse and liquefaction of lens
fibers, resulting in cataract formation (14,15).
Furthermore, enhanced osmotic stress leads to the production of
reactive oxygen species (ROS) in the crystalline lens (16–18). In
addition, sorbitol is metabolized to fructose. The fructose is
metabolized into fructose-3-phospate and 3-deoxyglucosone (potent
non-enzymatic glycation agents), which increase the quantity of
advanced glycation end products leading to ROS generation (19,20). Thus,
numerous studies have evaluated diabetic cataracts and model
animals have been used.
Streptozotocin (STZ)-induced hyperglycemia in
experimental animals (STZ rats) has been widely used as a valuable
model to investigate the effect of different hypoglycemic agents
(21). The STZ damages pancreatic
β-cells in rats, leading to deficient insulin secretion and a
diabetic model (22,23). The majority of diabetic rats are
susceptible to the development of cataracts and lenticular polyol
accumulation primarily induces cataractogenesis (14). However, all of the underlying
mechanisms for lens opacification have not been elucidated in the
STZ rats; therefore, further investigations are required. In the
current study, a shotgun liquid chromatography (LC)/mass
spectrometry (MS)-based global proteomic analysis of STZ rats was
conducted to examine the underlying mechanism of lens opacification
due to hyperglycemia. A total of 52 proteins were identified to be
differentially expressed in the lenses of STZ rats compared with
the lenses of normal rats, and these proteins may be involved in
lens opacification.
Materials and methods
Materials
The following high-grade chemicals and reagents were
purchased: Urea from GE Healthcare (Chicago, IL, USA) and thiourea
from Nacalai Tesque, Inc. (Kyoto, Japan). All other chemicals and
reagents were purchased from Wako Pure Chemical Industries, Ltd.
(Osaka, Japan).
Animals
Healthy Male Wistar rats (mean weight, 220 g; n=10)
were provided from the Kiwa Laboratory Animals Co., Ltd. (Wakayama,
Japan) and the 6-week old rats were injected with STZ for 2 days
(100 mg/kg/day via i.p. injection). As lens opacification was
initially observed 2–3 weeks after STZ treatment, the rats were
evaluated 3 weeks after the injection of STZ to elucidate the early
mechanism of diabetic cataracts. All of the experiments were
performed in compliance with the regulations approved by the Ethics
Committee of the Kindai University Faculty of Pharmacy (Osaka,
Japan). The rats were housed in a room at 25°C under a 12-h
light/dark cycle (2–3 rats/cage). All rats had access to food and
water ad libitum.
Assay of glucose and insulin
Blood (50 ml) was sampled without anesthesia from
the tail vein of each rat after fasting for 12 h (10:00 a.m.). The
plasma glucose level was measured using an Accutrend GCT (Roche
Diagnostics GmbH, Mannheim, Germany), and plasma insulin levels
were assayed using an ELISA Insulin kit (cat. no. M1103; Morinaga
Institute of Biological Science, Inc., Kanagawa, Japan) according
to the manufacturer's protocol (24).
The dynamic range of the ELISA Insulin kit is 0.1–6.4 ng/ml.
Imaging of lens opacification in STZ
rats
The rats were administered with 0.1% pivalephrine
(Santen Pharmaceutical Co., Osaka, Japan) without anesthesia, and
monitored using an EAS-1000 (Nidek Co., Ltd., Gamagori, Japan). The
EAS-1000 conditions were as follows: Flash power index, 2,300±73;
flash level, 100 W/sec; slit length and width, 5.0 mm.
Protein extraction from the lenses of
STZ rats
Three weeks after injection, the STZ rats were
euthanized, and the lenses of the STZ rats were removed and
homogenized in urea lysis buffer (7 M urea, 2 M thiourea, 5% CHAPS
and 1% Triton X-100). The protein concentration was measured using
a Bio-Rad Protein Assay kit (Bio-Rad Laboratories, Inc., Hercules,
CA, USA).
In-solution trypsin digestion
A gel-free digestion approach was performed in
accordance with the protocol described by Bluemlein and Ralser
(25). In brief, 10 µg protein extract
from each sample was reduced by the addition of 45 mM
dithiothreitol and 20 mM Tris(2-carboxyethyl)phosphine and
alkylated using 100 mM iodoacetic acid. Following alkylation,
samples were digested with trypsin gold, MS grade (Promega
Corporation, Madison, WI, USA) at 37°C for 24 h. Subsequently, the
digests were purified using PepClean C-18 Spin Columns (Thermo
Fisher Scientific, Inc., Waltham, MA, USA) according to the
manufacturer's protocol.
LC-MS/MS analysis for protein
identification
Approximately 2 µg peptide samples were injected
onto a peptide L-trap column (Chemicals Evaluation and Research
Institute, Tokyo, Japan) using an HTC PAL Autosampler (CTC
Analytics AG, Zwingen, Switzerland) and further separated through a
Paradigm MS4 (AMR, Inc., Tokyo, Japan) using a reverse-phase
C18-column (L-column, gel particle diameter, 3 µm; 120 Å; pore
size, 0.2×150 mm; Chemicals Evaluation and Research Institute). The
mobile phase consisted of solution A (0.1% formic acid in water)
and solution B (acetonitrile). The column flow rate was 1 µl/min
with a concentration gradient of acetonitrile, from 5% B to 40% B,
for 120 min. Gradient-eluted peptides were analyzed using an LTQ
ion-trap mass spectrometer (Thermo Fisher Scientific, Inc.). The
results were acquired in a data-dependent manner in which MS/MS
fragmentation was performed on the two most intense peaks of every
full MS scan.
All MS/MS spectral data were searched against the
SwissProt Rattus Norvegicus database using Mascot
(version_2.4.01; Matrix Science, London, UK). The search criteria
were set as follows: Enzyme, trypsin; allowance of up to two missed
cleavage peptides; mass tolerance ± 2.0 Da and MS/MS tolerance ±
0.8 Da; and modifications of cysteine carbamidomethylation and
methionine oxidation.
Semi-quantitative analysis of
identified proteins
The fold changes in expressed proteins, on a base-2
logarithmic scale, were calculated using the RSC, based on spectral
counting (26). Relative quantities of
identified proteins were also calculated using the normalized
spectral abundance factor (NSAF) (27). Differentially expressed proteins were
selected when their RSC was >1 or <-1, which corresponded to
fold changes of >2 or <0.5.
Western blot analysis
A total of 10 µg lens extract was added to each well
and subjected to 10% SDS-PAGE under reducing conditions, and the
separated proteins were transferred to polyvinylidene fluoride
membranes for 30 min at 15 V. Following blocking in Tris-buffered
saline Tween-20 (TBST) buffer (0.1%) with 5% skimmed milk for 2 h
at room temperature, the membranes were incubated at 4°C overnight
with anti-phosphorylated (p)-p38 mitogen-activated protein kinase
(MAPK; 1;1,000; cat. no. 4511) and anti-p38 MAPK (cat. no. 8690)
antibodies (both from Cell Signaling Technology, Inc., Danvers, MA,
USA), along with anti-β-actin antibody (cat. no. sc-47778; Santa
Cruz Biotechnology, Inc., Dallas, TX, USA) to confirm equal loading
of the proteins. The membranes were washed three times with TBST
and incubated with horseradish peroxidase-conjugated anti-rabbit
immunoglobulin G antibody (cat. no. A106PU; American Qualex, San
Clemente, CA, USA) for 1 h at room temperature. Following washing,
the blots were visualized using SuperSignal West Dura Extended
Duration substrate (Thermo Fisher Scientific, Inc.) and bands were
detected using a myECL Imager system (version 2.0; Thermo Fisher
Scientific, Inc.). Subsequently, the intensity of p-p38 and p38
were quantified using myImage Analysis software (version 2.0;
Thermo Fisher Scientific, Inc.) and the relative luminescence level
of p-p38 over p38 was used to represent the signal strength of
p-p38. All western blot analyses were performed in triplicate.
Statistical analysis
The unpaired Student's t-test was used and P<0.05
was considered to indicate a statistically significant difference.
All data are expressed as the standard error of the mean. The
analyses were performed using GraphPad Prism software (version 5;
GraphPad Software, Inc., La Jolla, CA, USA).
Results
Preparation of STZ-induced diabetic
rats
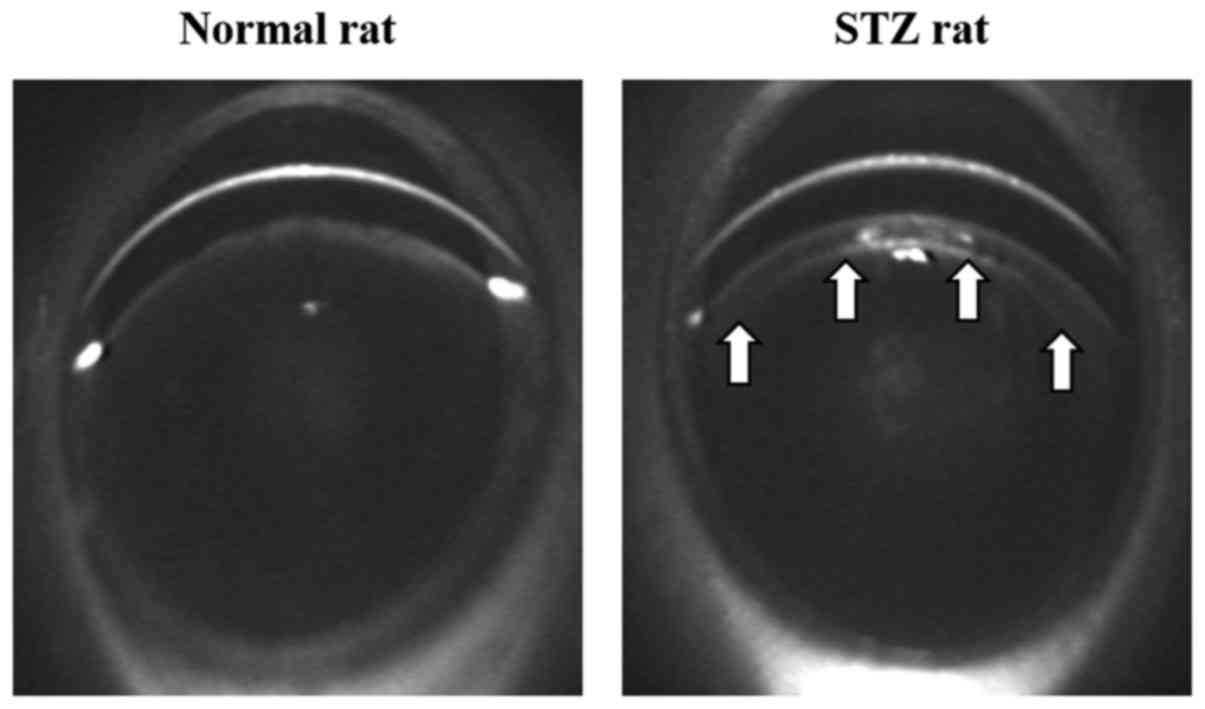
Initially, the changes in plasma glucose and insulin
were investigated in the rats following injection of STZ and
whether the hyperglycemia caused lens opacification in the STZ rats
was demonstrated. The plasma glucose levels in STZ rats (247.1±10.6
mg/dl; n=5) were significantly higher than in the normal rats
(81.3±4.1 mg/dl; n=5). Furthermore, insulin was not detected in the
STZ rats and the body weight in the STZ rats (217.3±11.9 g; n=5)
was significantly decreased when compared with that of the normal
rats (319.5±8.8 g; n=5). These results demonstrate that the STZ
rats developed diabetes mellitus with hyperglycemia and
hypoinsulinemia. In addition, opacification in the cortical
epithelium was observed in the lenses of the STZ rats (Fig. 1).
Protein identification and profile of
the lenses from STZ rats
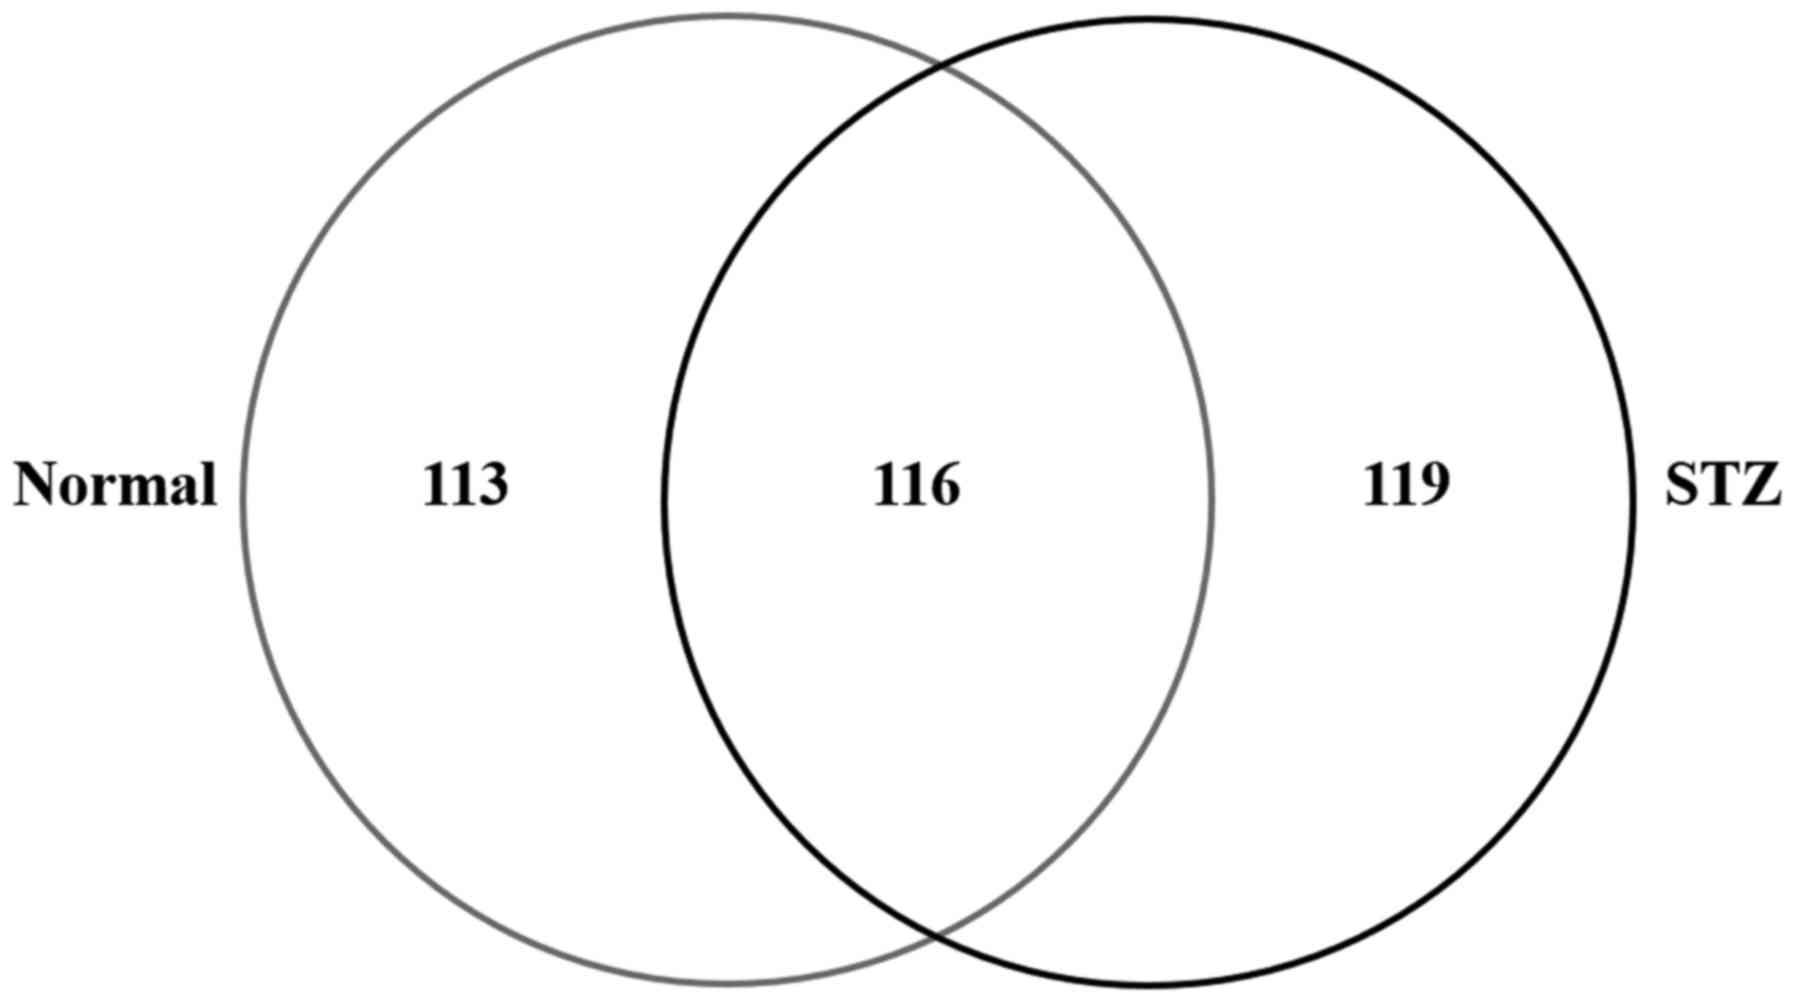
To examine the effect of hyperglycemia on lens
damage, the molecular profile of proteins whose expression level
was changed in the diabetic rat model was investigated using
shotgun proteomics. In the lenses of the STZ rats, 235 proteins
were identified and 229 were identified in that of the normal rat
(Normal) using the search parameters (Fig.
2). Among the 348 proteins identified in the rat lenses, 116
(33.3%) were identified in the two groups; while, 119 (34.2%) and
113 (32.5%) proteins were unique to STZ and normal rats,
respectively (Fig. 2).
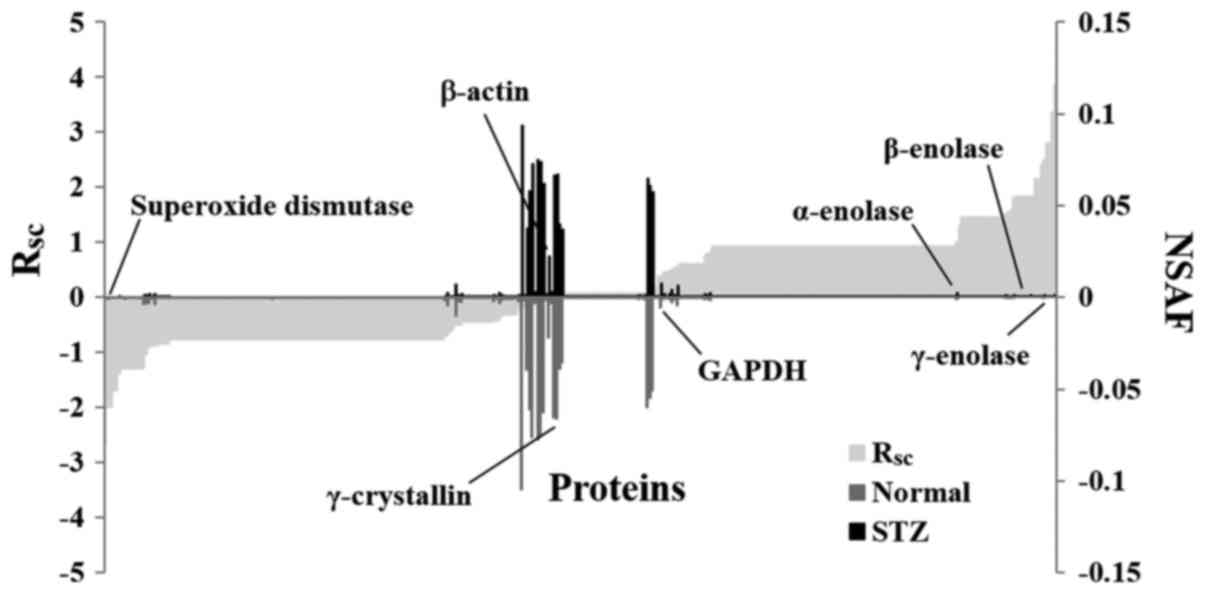
Subsequently, a label-free semi-quantitative method
based on spectral counting was used to identify proteins with
expression levels regulated by hyperglycemia. The RSC
value was plotted against the corresponding protein (x-axis) from
left to right for proteins identified in the STZ and normal rats
(Fig. 3). The positive and negative
RSC values indicate increased and decreased expression
levels, respectively in the STZ rats. The NSAF value was plotted
against the corresponding protein. The NSAF of proteins in the STZ
and normal rats are indicated above and below the x-axis,
respectively (Fig. 3). Proteins with
either a high positive or negative RSC value were
considered to be candidate proteins, whose expression was likely
regulated by hyperglycemia. A total of 52 differentially expressed
proteins were identified in the lenses of the STZ rats (Table I). The expression levels of
housekeeping proteins, such as β-actin and
glyceraldehyde-3-phosphate dehydrogenase, did not change in the
lenses of the normal and STZ rats (Fig.
3).
 | Table I.Differentially expressed proteins in
the lenses of STZ rats. |
Table I.
Differentially expressed proteins in
the lenses of STZ rats.
|
|
|
|
| Spectral
counting |
|---|
|
|
|
|
|
|
|---|
| No. | ID | Accession number and
description | Amino acids, n | Normal | STZ | Fold change
(RSC) |
|---|
| 1 | SODC_RAT | P07632: Superoxide
dismutase [Cu-Zn] | 154 | 4 | 0 | −1.995 |
| 2 | HDAC1_RAT | Q4QQW4: Histone
deacetylase 1 | 482 | 4 | 0 | −1.995 |
| 3 | AK1CL_RAT | Q6AYQ2: Aldo-keto
reductase family 1 member C21 | 318 | 3 | 0 | −1.690 |
| 4 | LGSN_RAT | Q7TT51: Lengsin | 561 | 3 | 0 | −1.690 |
| 5 | ARRS_RAT | P15887:
S-arrestin | 403 | 5 | 1 | −1.398 |
| 6 | TERA_RAT | P46462: Transitional
endoplasmic reticulum ATPase | 806 | 2 | 0 | −1.302 |
| 7 | ATIF1_RAT | Q03344: ATPase
inhibitor, mitochondrial | 107 | 2 | 0 | −1.302 |
| 8 | RHOB_RAT | P62747: Rho-related
GTP-binding protein RhoB | 196 | 2 | 0 | −1.302 |
| 9 | ENTP6_RAT | Q9ER31:
Ectonucleoside triphosphate diphosphohydrolase 6 | 455 | 2 | 0 | −1.302 |
| 10 | MYT1L_RAT | P70475: Myelin
transcription factor 1-like protein | 1,187 | 2 | 0 | −1.302 |
| 11 | RPGF2_RAT | F1M386: Rap guanine
nucleotide exchange factor 2 | 1,496 | 2 | 0 | −1.302 |
| 12 | LMIP_RAT | P54825: Lens fiber
membrane intrinsic protein | 173 | 2 | 0 | −1.302 |
| 13 | HS71L_RAT | P55063: Heat shock
70 kDa protein 1-like | 641 | 2 | 0 | −1.302 |
| 14 | ACTC_RAT | P68035: Actin, α
cardiac muscle 1 | 377 | 30 | 11 | −1.280 |
| 15 | ACTG_RAT | P63259: Actin,
cytoplasmic 2 | 375 | 25 | 11 | −1.027 |
| 16 | ENOA_RAT | P04764:
α-enolase | 434 | 11 | 22 | 1.006 |
| 17 | KCRB_RAT | P07335: Creatine
kinase B-type | 381 | 1 | 4 | 1.301 |
| 18 | K2C72_RAT | Q6IG04: Keratin,
type II cytoskeletal 72 | 520 | 0 | 2 | 1.456 |
| 19 | K1C14_RAT | Q6IFV1: Keratin,
type I cytoskeletal 14 | 485 | 0 | 2 | 1.456 |
| 20 | K1C13_RAT | Q6IFV4: Keratin,
type I cytoskeletal 13 | 438 | 0 | 2 | 1.4563 |
| 21 | PEBP1_RAT | P31044:
Phosphatidylethanolamine-binding protein 1 | 187 | 0 | 2 | 1.456 |
| 22 | COF1_RAT | P45592:
Cofilin-1 | 166 | 0 | 2 | 1.456 |
| 23 | NCAM1_RAT | P13596: Neural cell
adhesion molecule 1 | 858 | 0 | 2 | 1.456 |
| 24 | PGAM1_RAT | P25113:
Phosphoglycerate mutase 1 | 254 | 0 | 2 | 1.456 |
| 25 | PLEC_RAT | P30427:
Plectin | 4,687 | 0 | 2 | 1.456 |
| 26 | NMDE1_RAT | Q00959: Glutamate
receptor ionotropic, NMDA 2A | 1,464 | 0 | 2 | 1.456 |
| 27 | TCPG_RAT | Q6P502: T-complex
protein 1 subunit γ | 545 | 0 | 2 | 1.456 |
| 28 | NPT2A_RAT | Q06496:
Sodium-dependent phosphate transport protein 2A | 637 | 0 | 2 | 1.456 |
| 29 | KIFC1_RAT | Q5XI63:
Kinesin-like protein KIFC1 | 693 | 0 | 2 | 1.456 |
| 30 | RL18_RAT | P12001: 60S
ribosomal protein L18 | 188 | 0 | 2 | 1.456 |
| 31 | COPG1_RAT | Q4AEF8: Coatomer
subunit γ-1 | 874 | 0 | 2 | 1.456 |
| 32 | HSP7C_RAT | P63018: Heat shock
cognate 71 kDa protein | 646 | 0 | 2 | 1.456 |
| 33 | PDE3B_RAT | Q63085:
cGMP-inhibited 3~,5~-cyclic phosphodiesterase B | 1,108 | 0 | 2 | 1.456 |
| 34 | K2C75_RAT | Q6IG05: Keratin,
type II cytoskeletal 75 | 542 | 4 | 13 | 1.521 |
| 35 | K2C4_RAT | Q6IG00: Keratin,
type II cytoskeletal 4 | 536 | 1 | 5 | 1.552 |
| 36 | ENOB_RAT | P15429:
β-enolase | 434 | 2 | 8 | 1.588 |
| 37 | TBA1C_RAT | Q6AYZ1: Tubulin
α-1C chain | 449 | 3 | 13 | 1.826 |
| 38 | K2C8_RAT | Q10758: Keratin,
type II cytoskeletal 8 | 483 | 0 | 3 | 1.844 |
| 39 | K2C73_RAT | Q6IG03: Keratin,
type II cytoskeletal 73 | 553 | 0 | 3 | 1.844 |
| 40 | K2C7_RAT | Q6IG12: Keratin,
type II cytoskeletal 7 | 457 | 0 | 3 | 1.844 |
| 41 | ARF4_RAT | P61751:
ADP-ribosylation factor 4 | 180 | 0 | 3 | 1.844 |
| 42 | ARF1_RAT | P84079:
ADP-ribosylation factor 1 | 181 | 0 | 3 | 1.844 |
| 43 | TCAL7_RAT | D3ZT37:
Transcription elongation factor A protein-like 7 | 98 | 0 | 3 | 1.844 |
| 44 | TBB2B_RAT | Q3KRE8: Tubulin
β-2B chain | 445 | 0 | 3 | 1.844 |
| 45 | K1C15_RAT | Q6IFV3: Keratin,
type I cytoskeletal 15 | 447 | 0 | 4 | 2.149 |
| 46 | K1C17_RAT | Q6IFU8: Keratin,
type I cytoskeletal 17 | 433 | 0 | 4 | 2.149 |
| 47 | K2C1B_RAT | Q6IG01: Keratin,
type II cytoskeletal 1b | 519 | 0 | 5 | 2.401 |
| 48 | K2C5_RAT | Q6P6Q2: Keratin,
type II cytoskeletal 5 | 576 | 2 | 16 | 2.490 |
| 49 | ENOG_RAT | P07323:
γ-enolase | 434 | 0 | 7 | 2.802 |
| 50 | K1C10_RAT | Q6IFW6: Keratin,
type I cytoskeletal 10 | 526 | 0 | 7 | 2.802 |
| 51 | K2C6A_RAT | Q4FZU2: Keratin,
type II cytoskeletal 6A | 552 | 0 | 11 | 3.374 |
| 52 | K2C1_RAT | Q6IMF3: Keratin,
type II cytoskeletal 1 | 625 | 0 | 16 | 3.869 |
Effect of hyperglycemia on the p38
signaling pathway in the lenses of STZ rats
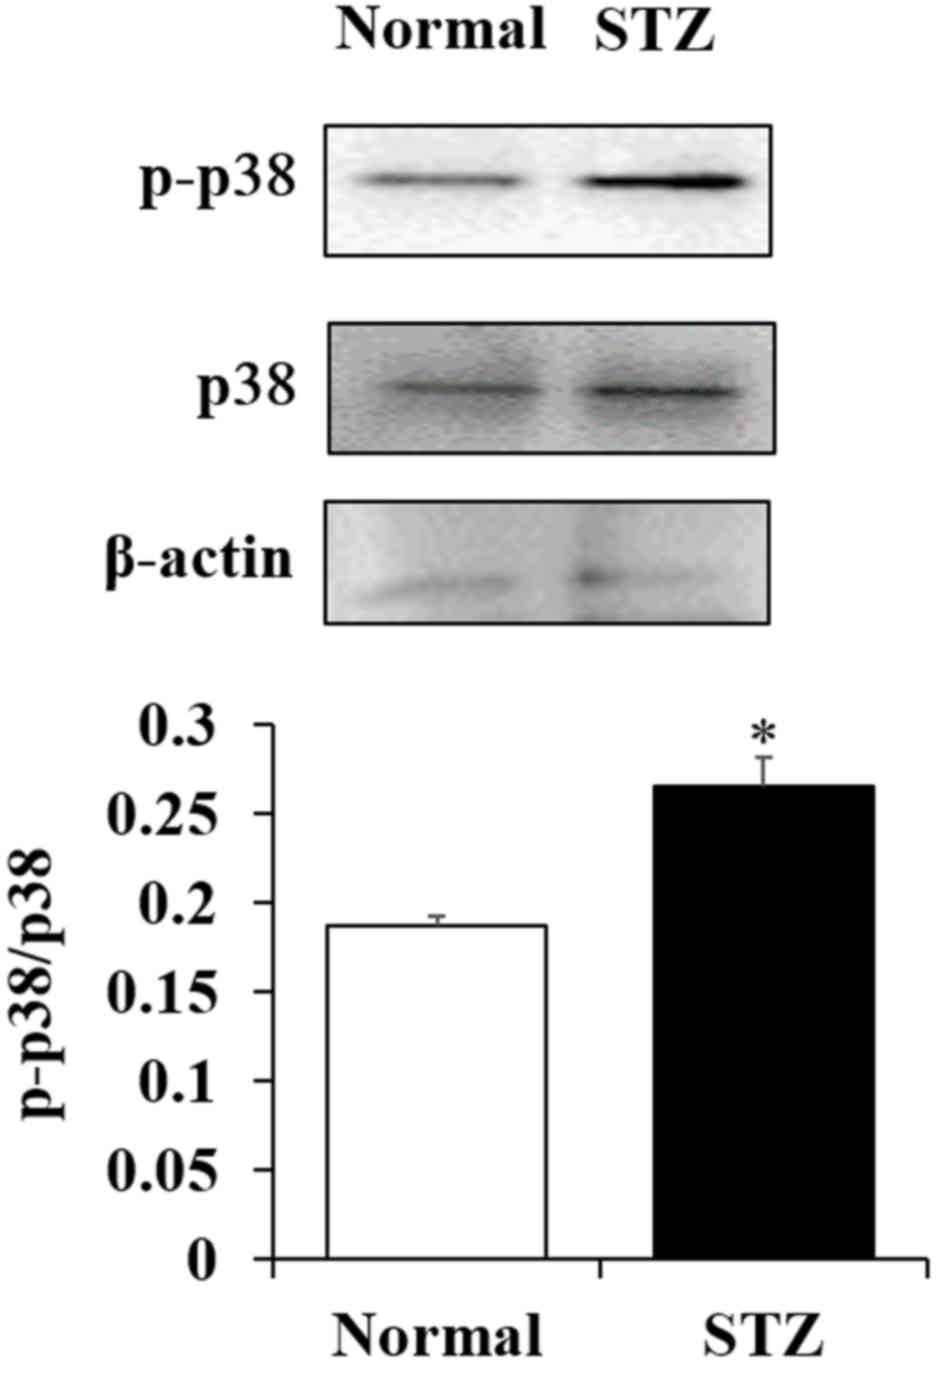
To determine whether the oxidative stress response
by active oxygen is affected by downregulation of superoxide
dismutase (SOD) expression, the phosphorylation of p38, which is
important in the signaling pathways involved in oxidative stress
response, were examined. The phosphorylation of p38 in the lenses
of STZ rats was significantly increased when compared with the
lenses of normal rats (P<0.05; Fig.
4).
Discussion
In the current study, a gel-free LC/MS-based
proteomics approach was used to examine the effect of hyperglycemia
on lens opacification. Although a quantitative value obtained using
spectral counting may not be accurate (28), it is useful and has been used in
previous studies investigating novel diagnostic biomarkers
(29–34). Using semi-quantitative methods based on
spectral counting, various proteins whose expression levels had
changed by >2-fold were successfully identified in the lenses of
STZ rats. Representative proteins involved in enzyme-associated
glycolysis, such as α-, β- and γ-enolase, were upregulated by the
injection of STZ. These enhanced enzymes may be induced by high
glucose. Although Quinlan et al (35) reported that keratin was not found in
the adult human lens, certain keratin proteins (type II
cytoskeletal 4, 5 and 75) were detected in the lenses of normal
rats. Furthermore, the expression levels of those keratin proteins
in the lenses of STZ rats were enhanced when compared with those of
normal rats. The expression levels of keratin proteins in lenses
may differ between humans and rats. Therefore, this requires
further investigation in future studies.
Additionally, SOD, which is a critical antioxidant
enzyme that detoxifies superoxides via redox cycling and histone
deacetylase 1 were downregulated. It is well known that chronic
hyperglycemia increases the oxidant load (11) and leads to the onset of cataracts
(12). Furthermore, the antioxidant
capacity is reduced and the free radical load is increased in the
eyes of diabetes mellitus patients. This change increases the
susceptibility of the crystalline lens to oxidative damage
(13). In addition, decrease in the
antioxidant capacity is facilitated by advanced glycation and
defects in antioxidant enzyme activity (13). Maurya et al (36) identified that the serum of SOD was
significantly lower in patients with diabetic cataracts (9.13 U/ml)
compared with patients with senile cataracts (25.30 U/ml) (36). These findings indicate that activation
of the p38 signaling pathway, via downregulation of SOD expression,
is one of the factors involved in the onset of lens opacification
and that dysfunction of transcription, via low histone deacetylase
1, may be associated with the development of diabetic cataracts in
STZ rats. Further studies are required to validate the results of
spectral counting by western blotting and to elucidate the precise
mechanisms for p38 in hyperglycemia-associated lens opacification
using p38 inhibitors or corresponding knockout/knock-in strategies.
In addition, it is important to validate these findings in human
tissues. Therefore, our future studies will investigate the
expression levels of SOD and p38 in human lens epithelial (HLE) SRA
01/04 cells exposed to high glucose conditions.
In conclusion, the changes in protein expression
levels in the lenses of STZ rats were evaluated using a shotgun
LC/MS-based global proteomic analysis, and an increase in oxidative
stress in the lenses of STZ rats was observed. Therefore, oxidative
stress may serve important roles in the progression of diabetic
cataracts.
Acknowledgements
The present study was supported in part by a
Grant-in-Aid for Scientific Research from the Japan Society for the
Promotion of Science to T. Yamamoto (grant no. 15K09054).
Glossary
Abbreviations
Abbreviations:
|
LC/MS
|
liquid chromatography/mass
spectroscopy
|
|
NSAF
|
normalized spectral abundance
factor
|
|
ROS
|
reactive oxygen species
|
|
SOD
|
superoxide dismutase
|
|
STZ
|
streptozotocin
|
References
|
1
|
Expert Committee on the Diagnosis and
Classification of Diabetes Mellitus, . Report of the expert
committee on the diagnosis and classification of diabetes mellitus.
Diabetes Care. 26 Suppl 1:S5–S20. 2003. View Article : Google Scholar : PubMed/NCBI
|
|
2
|
Brownlee M: Biochemistry and molecular
cell biology of diabetic complications. Nature. 414:813–820. 2001.
View Article : Google Scholar : PubMed/NCBI
|
|
3
|
Hashim Z and Zarina S: Osmotic stress
induced oxidative damage: Possible mechanism of cataract formation
in diabetes. J Diabetes Complications. 26:275–279. 2012. View Article : Google Scholar : PubMed/NCBI
|
|
4
|
Srivastava SK, Ramana KV and Bhatnagar A:
Role of aldose reductase and oxidative damage in diabetes and the
consequent potential for therapeutic options. Endocr Rev.
26:380–392. 2005. View Article : Google Scholar : PubMed/NCBI
|
|
5
|
Ahmed N: Advanced glycation endproducts -
role in pathology of diabetic complications. Diabetes Res Clin
Pract. 67:3–21. 2005. View Article : Google Scholar : PubMed/NCBI
|
|
6
|
Araki N, Ueno N, Chakrabarti B, Morino Y
and Horiuchi S: Immunochemical evidence for the presence of
advanced glycation end products in human lens proteins and its
positive correlation with aging. J Biol Chem. 267:10211–10214.
1992.PubMed/NCBI
|
|
7
|
Duhaiman AS: Glycation of human lens
proteins from diabetic and (nondiabetic) senile cataract patients.
Glycoconj J. 12:618–621. 1995. View Article : Google Scholar : PubMed/NCBI
|
|
8
|
Lyons TJ, Silvestri G, Dunn JA, Dyer DG
and Baynes JW: Role of glycation in modification of lens
crystallins in diabetic and nondiabetic senile cataracts. Diabetes.
40:1010–1015. 1991. View Article : Google Scholar : PubMed/NCBI
|
|
9
|
Nagaraj RH, Sell DR, Prabhakaram M,
Ortwerth BJ and Monnier VM: High correlation between pentosidine
protein crosslinks and pigmentation implicates ascorbate oxidation
in human lens senescence and cataractogenesis. Proc Natl Acad Sci
USA. 88:pp. 10257–10261. 1991; View Article : Google Scholar : PubMed/NCBI
|
|
10
|
Shamsi FA, Sharkey E, Creighton D and
Nagaraj RH: Maillard reactions in lens proteins:
Methylglyoxal-mediated modifications in the rat lens. Exp Eye Res.
70:369–380. 2000. View Article : Google Scholar : PubMed/NCBI
|
|
11
|
Agte VV and Tarwadi KV: Combination of
diabetes and cataract worsens the oxidative stress and
micronutrient status in Indians. Nutrition. 24:617–624. 2008.
View Article : Google Scholar : PubMed/NCBI
|
|
12
|
Jeganathan VS, Wang JJ and Wong TY: Ocular
associations of diabetes other than diabetic retinopathy. Diabetes
Care. 31:1905–1912. 2008. View Article : Google Scholar : PubMed/NCBI
|
|
13
|
Ookawara T, Kawamura N, Kitagawa Y and
Taniguchi N: Site-specific and random fragmentation of Cu,
Zn-superoxide dismutase by glycation reaction. Implication of
reactive oxygen species. J Biol Chem. 267:18505–18510.
1992.PubMed/NCBI
|
|
14
|
Kinoshita JH: Mechanisms initiating
cataract formation. Proctor Lecture. Invest Ophthalmol. 13:713–724.
1974.PubMed/NCBI
|
|
15
|
Kinoshita JH: Cataracts in galactosemia.
The Jonas S. Friedenwald Memorial Lecture. Invest Ophthalmol.
4:786–799. 1965.PubMed/NCBI
|
|
16
|
Pollreisz A and Schmidt-Erfurth U:
Diabetic cataract-pathogenesis, epidemiology and treatment. J
Ophthalmol. 2010:6087512010. View Article : Google Scholar : PubMed/NCBI
|
|
17
|
Takamura Y, Sugimoto Y, Kubo E, Takahashi
Y and Akagi Y: Immunohistochemical study of apoptosis of lens
epithelial cells in human and diabetic rat cataracts. Jpn J
Ophthalmol. 45:559–563. 2001. View Article : Google Scholar : PubMed/NCBI
|
|
18
|
Li WC, Kuszak JR, Dunn K, Wang RR, Ma W,
Wang GM, Spector A, Leib M, Cotliar AM, Weiss M, et al: Lens
epithelial cell apoptosis appears to be a common cellular basis for
non-congenital cataract development in humans and animals. J Cell
Biol. 130:169–181. 1995. View Article : Google Scholar : PubMed/NCBI
|
|
19
|
Tang WH, Martin KA and Hwa J: Aldose
reductase, oxidative stress, and diabetic mellitus. Front
Pharmacol. 3:872012. View Article : Google Scholar : PubMed/NCBI
|
|
20
|
Stitt AW: The maillard reaction in eye
diseases. Ann N Y Acad Sci. 1043:582–597. 2005. View Article : Google Scholar : PubMed/NCBI
|
|
21
|
Ivorra MD, Payá M and Villar A: A review
of natural products and plants as potential antidiabetic drugs. J
Ethnopharmacol. 27:243–275. 1989. View Article : Google Scholar : PubMed/NCBI
|
|
22
|
Irudayaraj S Stephen, Sunil C,
Duraipandiyan V and Ignacimuthu S: Antidiabetic and antioxidant
activities of Toddalia asiatica (L.) Lam. leaves in streptozotocin
induced diabetic rats. J Ethnopharmacol. 143:515–523. 2012.
View Article : Google Scholar : PubMed/NCBI
|
|
23
|
Nisha P and Mini S: Flavanoid rich ethyl
acetate fraction of Musa paradisiaca inflorescence down-regulates
the streptozotocin induced oxidative stress, hyperglycaemia and
mRNA levels of selected inflammatory genes in rats. J Funct Foods.
5:1838–1847. 2013. View Article : Google Scholar
|
|
24
|
Nagai N, Ito Y and Sasaki H: Hyperglycemia
enhances the production of amyloid β1–42 in the lenses of Otsuka
Long-Evans Tokushima fatty rats, a model of human type 2 diabetes.
Invest Ophthalmol Vis Sci. 57:1408–1417. 2016. View Article : Google Scholar : PubMed/NCBI
|
|
25
|
Bluemlein K and Ralser M: Monitoring
protein expression in whole-cell extracts by targeted label- and
standard-free LC-MS/MS. Nat Protoc. 6:859–869. 2011. View Article : Google Scholar : PubMed/NCBI
|
|
26
|
Old WM, Meyer-Arendt K, Aveline-Wolf L,
Pierce KG, Mendoza A, Sevinsky JR, Resing KA and Ahn NG: Comparison
of label-free methods for quantifying human proteins by shotgun
proteomics. Mol Cell Proteomics. 4:1487–1502. 2005. View Article : Google Scholar : PubMed/NCBI
|
|
27
|
Zybailov B, Coleman MK, Florens L and
Washburn MP: Correlation of relative abundance ratios derived from
peptide ion chromatograms and spectrum counting for quantitative
proteomic analysis using stable isotope labeling. Anal Chem.
77:6218–6224. 2005. View Article : Google Scholar : PubMed/NCBI
|
|
28
|
Lundgren DH, Hwang SI, Wu L and Han DK:
Role of spectral counting in quantitative proteomics. Expert Rev
Proteomics. 7:39–53. 2010. View Article : Google Scholar : PubMed/NCBI
|
|
29
|
Yamamoto T, Kudo M, Peng WX and Naito Z:
Analysis of protein expression regulated by lumican in PANC 1 cells
using shotgun proteomics. Oncol Rep. 30:1609–1621. 2013. View Article : Google Scholar : PubMed/NCBI
|
|
30
|
Takaya A, Peng WX, Ishino K, Kudo M,
Yamamoto T, Wada R, Takeshita T and Naito Z: Cystatin B as a
potential diagnostic biomarker in ovarian clear cell carcinoma. Int
J Oncol. 46:1573–1581. 2015. View Article : Google Scholar : PubMed/NCBI
|
|
31
|
Kanzaki A, Kudo M, Ansai S, Peng WX,
Ishino K, Yamamoto T, Wada R, Fujii T, Teduka K, Kawahara K, et al:
Insulin-like growth factor 2 mRNA-binding protein-3 as a marker for
distinguishing between cutaneous squamous cell carcinoma and
keratoacanthoma. Int J Oncol. 48:1007–1015. 2016. View Article : Google Scholar : PubMed/NCBI
|
|
32
|
Yamamoto T, Kudo M, Peng WX, Takata H,
Takakura H, Teduka K, Fujii T, Mitamura K, Taga A, Uchida E and
Naito Z: Identification of aldolase A as a potential diagnostic
biomarker for colorectal cancer based on proteomic analysis using
formalin-fixed paraffin-embedded tissue. Tumour Biol.
37:13595–13606. 2016. View Article : Google Scholar : PubMed/NCBI
|
|
33
|
Takata H, Kudo M, Yamamoto T, Ueda J,
Ishino K, Peng WX, Wada R, Taniai N, Yoshida H, Uchida E and Naito
Z: Increased expression of PDIA3 and its association with cancer
cell proliferation and poor prognosis in hepatocellular carcinoma.
Oncol Lett. 12:4896–4904. 2016.PubMed/NCBI
|
|
34
|
Kawamura T, Nomura M, Tojo H, Fujii K,
Hamasaki H, Mikami S, Bando Y, Kato H and Nishimura T: Proteomic
analysis of laser-microdissected paraffin-embedded tissues: (1)
Stage-related protein candidates upon non-metastatic lung
adenocarcinoma. J Proteomics. 73:1089–1099. 2010. View Article : Google Scholar : PubMed/NCBI
|
|
35
|
Quinlan RA, Sandilands A, Procter JE,
Prescott AR, Hutcheson AM, Dahm R, Gribbon C, Wallace P and Carter
JM: The eye lens cytoskeleton. Eye (Lond). 13(Pt 3b): 1–416.
1999.PubMed/NCBI
|
|
36
|
Maurya OP, Mohanty L, Bhaduri G and
Chandra A: Role of anti-oxidant enzymes superoxide dismutase and
catalase in the development of cataract: Study of serum levels in
patients with senile and diabetic cataracts. J Indian Med Assoc.
104:394, 396–397. 2006.
|