Introduction
Myosteatosis occurs in two forms: Fat deposition
within myocytes (intramyocellular fat) and fat infiltration within
the fascia between muscle layers (intermuscular fat) (1), although the latter is excluded by
computed tomography (CT) scan analysis. Myosteatosis increases with
aging and obesity, but it may also play a role in the development
of human disease (1). The clinical
significance of myosteatosis remains unclear but it appears to be
involved in the aetiology of insulin resistance and type II
diabetes mellitus through the modulation of both adipokine (e.g.,
adiponectin) secretion and nutritive muscle blood flow (2).
Cancer cachexia is a severe syndrome of skeletal
muscle wasting and lipolysis that appears to develop as part of an
aberrant host response to the presence of tumour (3). The clinical consequences of cachexia
include increased rates of patient morbidity and mortality, and
decreased rates of oncologic response to chemotherapy (4,5). Despite
demonstrable subcutaneous and visceral lipolysis during cancer
cachexia, myosteatosis and sequestration of fat into skeletal
muscle may be a key component of the syndrome (6). Several pro-inflammatory cytokines (e.g.,
IL-6 and TNF-α) and adipokines [e.g., zinc-α2-glycoprotein (ZAG)
are involved in the aetiology of cancer cachexia] (7,8). In the
past, members of our group have identified increased mRNA
expression of ZAG a proposed lipid mobilising factor, in fat
samples from cachectic cancer patients; however, serum ZAG levels
were unchanged from controls (9).
Visceral adipose tissue is lost more rapidly than subcutaneous
adipose tissue during cachexia, suggesting differential
tissue-dependent responses to the wasting process. Recently, focus
has concentrated on the concept of ‘fat-muscle crosstalk’ in cancer
cachexia. Notably, the genetic ablation of lipolytic pathways in
adipocytes protects against muscle mass loss in pre-clinical models
of cancer cachexia (10). These data
support the loss of visceral fat driven by lipolytic mechanisms as
an early event in cancer cachexia with a potential effect on
skeletal muscle.
We previously used cross-sectional magnetic
resonance imaging (MRI) of quadriceps to demonstrate increased
intermuscular fat in cancer patients compared with both elderly and
young healthy controls (11). We also
combined cross-sectional CT at the level of the third lumbar
vertebra with ultra-structural analysis of rectus abdominis muscle
biopsies by electron microscopy to demonstrate that
intramyocellular lipid deposition is increased in cancer patients
compared with controls (12).
However, whether myosteatosis is a cause or effect of cancer
cachexia remains to be elucidated. Certainly, insulin resistance is
a key finding in previous clinical studies of cancer cachexia, with
cancer patients demonstrating lower serum insulin and insulin:
cortisol ratios, and higher serum glucose (13). Such insulin resistance represents one
causative mechanism of skeletal muscle protein depletion in cancer
cachexia through a lack of anabolic phosphatidylinositol 3 kinase
pathway signalling (13).
Myosteatosis may play an even greater role in the development of
cancer cachexia in those patients with obesity in the presence of
skeletal muscle depletion, so-called ‘sarcopenic obesity’. Previous
cross-sectional CT studies showed that it is these individuals that
have the worst overall prognosis from advanced lung and pancreatic
cancer (14).
In an attempt to identify diagnostic biomarkers of
cancer cachexia, we previously showed that MALDI-TOF mass
spectrometric (MS) analysis can identify breakdown products of
skeletal muscle protein in human urine (15). Furthermore, SELDI-TOF MS was capable
of identifying diagnostic markers of upper gastrointestinal (uGI)
cancer in the same substrate (16).
Therefore, we hypothesised that a SELDI-TOF platform would also be
used to identify protein/peptide biomarkers of myosteatosis in the
urine of patients with cancer. The identity of such markers would
not only offer insights into the development of myosteatosis, but
also identify high-risk groups among individuals with
cancer-associated weight loss.
Materials and methods
Materials
Buffers, gels and SELDI chips were from Bio-Rad
(Hemel Hempstead, UK), and all other chemicals were obtained from
Sigma-Aldrich (Gillingham, UK) unless stated otherwise in the
text.
Sample collection
Urine samples were obtained from uGI and
hepatopancreaticobiliary (HPB) cancer patients who were undergoing
potentially curative surgery approximately 4–6 weeks after the
cessation of chemotherapy. Urine samples were collected into a
sterile container at induction of anaesthesia. They were snap
frozen in liquid nitrogen and stored at −80°C until use. The
procedures were approved by the local research ethics committee.
Written informed consent was obtained. The study conformed to the
standards set by the Declaration of Helsinki.
Myosteatosis stratification
Skeletal muscle CSA was measured from routine CT
scans performed prior to any surgical or oncological intervention.
CT scans were recorded within an average of 23 days prior to
supplying the urine samples. Digitally stored CT images completed
with a spiral CT scanner for initial staging and routine diagnostic
purposes were analysed using semi-automated software that permitted
specific tissue demarcation using Hounsfield unit thresholds of −29
to +150 for skeletal muscles, −150 to −50 for visceral adipose
tissue, and −190 to −30 for subcutaneous adipose tissue.
Cross-sectional areas (cm2) were computed for each
tissue by summing tissue pixels and multiplying by the pixel
surface area. A transverse CT image from the third lumbar vertebrae
(L3) was assessed for each scan date and tissue volumes estimated.
The muscles in the L3 region contain psoas, erector spinae,
quadratus lumborum, transversus abdominus, external and internal
oblique, and rectus abdominis. CT images were analysed by a single
trained observer, tissue boundaries were manually corrected as
needed. Cross-sectional area for muscle was normalized for stature
(cm2/m2). Cut-off values for low muscularity
were based on a CT-based sarcopenic obesity study of cancer
patients (i.e., L3 skeletal muscle index: ≤38.5
cm2/m2 for women and ≤52.4
cm2/m2 for men) (17) Myosteatosis was defined by the mean
Hounsfield units for skeletal muscle, and values <39.5 (two
standard deviations below a normal healthy cohort) were regarded as
myosteatotic.
SELDI-TOF-MS
SELDI-chips (CM10 and IMAC30) were prepared for
sample application according to the manufacturer's recommendations
(16). IMAC30 chips were loaded with
0.1 M CuSO4 and washed with water. Chips were
neutralised with 0.1 M NaHAc (pH 4.0) and washed with water. A
further 2 washes with 0.1 M NaHPO4 were completed. CM10
chips and 0.5 M NaCl were washed twice with 0.1 M NaHPO4
(pH 4.0). All chips were processed in a bioprocessor-assembly by
incubating 0.1 ml urine and 0.1 ml binding buffer [CM10: 0.1 M
NaHPO4 (pH 4.0); IMAC30: 0.1 M NaHPO4, 0.5 M
NaCl] for 1 h at room temperature. Three washes were completed with
0.2 ml binding buffer for 5 min each at room temperature and 2
washes with 0.2 ml water. Samples were air dried and 2 times 1 ml
energy absorbing matrix [sinapinic acid (SPA) in 50% CAN, 0.5% TFA]
was added. Air-dried chips were analysed in PCS4000 SELDI-TOF
instrument (Bio-Rad) by measuring the 1,000 to 25,000 Da range with
a laser setting of 2.5 mJ. Spectra was exported as ‘.xml’ files.
The SELDI instrument was calibrated using the ProteinCip All-In-one
peptide standard (Bio-Rad). Source voltage was set as 25,000 V and
detector voltage as 2,946 V. Quality control and consistency was
ensured by using one random pool of urines on one spot per chip
each. Spectral alignments of all quality controls ensured
consistency of all spectra.
Data processing
ProteinChip Data Manager software (PCDMS) version
4.1 with integrated Biomarker Wizard cluster analysis (Bio-Rad) was
used for analysis. SELDI-TOF-MS traces were split into two groups:
Control and myosteatosis based on CT scan analysis. The baseline
was subtracted from individual m/z traces and profiles were
normalised using total ion current, followed by identification of
peak clusters using the cluster analysis tool. Peaks were selected
in the first pass where the signal to noise (S/N) ratio was >5
and had a valley depth of at least 3. In the second pass the S/N
ratio was 2 and the valley depth was also 2. The cluster mass
window was set to 0.2% of mass. Clustered peaks were only included
if they occurred in at least 10% of all spectra. The resulting
P-values, ROC areas, mean and median m/z values, and intensities of
the clustered peaks were exported and saved as ‘.csv’ files and
used for model building. Heat-maps using Pearson's correlation and
principle component analysis plots were calculated to assess global
group divisions (i.e., myosteatosic and non-myosteatotic). A
two-sample t-test was used to compare mean normalised intensities
between the case and control groups. P<0.05 was considered
statistically significant.
Model building and validation
Clustered peak lists were analysed with the
Biomarker Pattern software (BPS; Bio-Rad). The m/z versus intensity
matrices were analysed using decision tree-analysis, selecting the
standard error rule of minimum cost-tree regardless of size. The
method used was Gini. V-fold testing was set to 1,000. A total of
20 myosteatosis samples and 20 control samples were chosen randomly
and used as the learning and testing dataset. The remaining 15
samples were used as the validation dataset for blind-testing.
Sensitivity was defined as the probability of predicting
myosteatosis cases, and the specificity was defined as the
probability of predicting non-myosteatotic samples.
Peak isolation and identification
Peaks observed in the CM10 and IMAC30 chip-types
which show marked expression differences between control and
myosteatosis samples, or were branching points in the models were
further investigated as detailed below: 0.5 ml of urine from
positive or negative samples in relation to specific peaks was
added to 30 ml CM10 or IMAC30 spin column resins (Bio-Rad). A total
of 0.75 ml of binding buffer [0.1 M NaHPO4 (pH 4.0) for
CM10 resins and 0.1 M NaHPO4 (pH 7.0) and 0.5 M NaCl for
IMAC30 resins]was then added. These were incubated for 1 h at room
temperature under constant agitation. Unbound material was removed
and the resin was washed 4 times with 0.3 ml binding buffer. Bound
material was separated by electrophoresis on a 16.5% Tris-Tricine
gel (Bio-Rad) and gel bands in the region of 2 to 10 kDa were
excised after Coomassie staining (BioSafe Coomassie; Bio-Rad).
Positive and negative samples were chosen on the presence or
absence of a specific m/z peak to be identified based on
SELDI-TOF-MS analysis. Proteins and peptides from gel bands were
digested in situ with trypsin, the resulting peptides eluted
with ACN, and analysed using LC-MS/MS as previously described
(16). Fragmentation spectra were
then processed by Xcalibur and BioWorks software (Thermo Fisher
Scientific, Loughborough, UK) and submitted to the Mascot search
engine (Matrix Science, London, UK) using UniProt/SwissProt
(release July 2010, Homo sapiens, 18,055 sequences) as the
reference database. Mascot search parameters were: Enzyme
specificity trypsin, maximum missed cleavage 1, fixed modifications
cysteine carbamidomethylation, variable modification methionine
oxidation, precursor mass tolerance +/-3 Da, fragment ion mass
tolerance +/-0.4 Da. Only Mascot hits with a false discovery rate
of <0.05 were taken into consideration. Proteins with ≥2 peptide
matches were analysed by pattern matching based on SELDI-TOF-MS
measured expression levels of peaks of interest (expected abundance
in selected samples) and observed presence of proteins. Peptide
distribution of identified peptides within a protein as well as
calculated molecular mass of identified proteins was used to assess
whether breakdown products were likely to account for mass
variances between the expected mass and the molecular weight of the
full-length protein.
Mascot-SELDI matrix matching
Observed proteins with at least two peptide matches
from the LC-MS/MS analysis were further analysed by pattern
matching based on SELDI-TOF-MS measured expression levels of peaks
of interest (expected abundance in selected samples). This was
carried out using software written in-house, which compared
observed protein expression patterns in a pre-defined set of
samples (LC-MS/MS results) against a matrix of peak patterns
(SELDI-TOF clustered peak intensities, where estimated peaks are
set to null) in the same set of samples. Scoring was based on
sensitivity (percent observed over expected) and specificity
(percent not observed over not expected). Results are presented in
descending order of cumulative scores.
Results
Patient data
A total of 55 patients (mean age, 64 years) with uGI
cancer was stratified according to the presence or absence of
myosteatosis with 24 being regarded as non-myosteatotic (Table I). Data variables, with the exception
of plasma CRP, had normal distributions. The non-myosteatotic
control group was significantly shorter, lighter and older than the
Myosteatotic group but had similar BMI and weight loss (Student's
t-test) and similar CRP (Mann-Whitney U).
 | Table I.Demographics of the cohort
(n=55). |
Table I.
Demographics of the cohort
(n=55).
|
Characteristics | Non-myosteatotic,
n=24 | Myosteatosis,
n=31 | Entire cohort,
n=55 |
|---|
| Mean age
(years) | 60 (10) | 67 (7)a | 64 (9) |
| Male:female | 18:6 | 27:4 | 45:10 |
| Height (cm2) | 168.7 (8.4) | 174.8
(7.3)a | 172.1 (8.3) |
| Weight (kg) | 72.7 (16.5) | 82.9
(14.9)a | 78.4 (16.3) |
| Weight loss
(%) | 6.7 (8.8) | 5.3 (6.9) | 5.9 (7.7) |
| BMI | 25.5 (4.7) | 27.2 (4.6) | 26.4 (4.7) |
| CRP (mg/l) | 13.5 (34.0) | 12.5 (31.9) | 12.9 (32.5) |
| Skeletal muscle
mass | 47.8 (9.9) | 46.2 (7.6) | 46.9 (8.6) |
| Mean HU | 45.9 (4.6) | 33.6
(4.6)a | 39.0 (7.7) |
Four peak clusters in the IMAC30, and 8 in the CM10
datasets showed statistically significant P-values <0.05, which
indicates a potentially significant difference in the expression
levels for a particular protein or peptide cluster.
Decision tree analysis
Decision-tree modelling using the BPS of peak
clusters of 20 random samples of each cohort was validated by the
remainder of the entire cohort (4 control and 11 myosteatotic
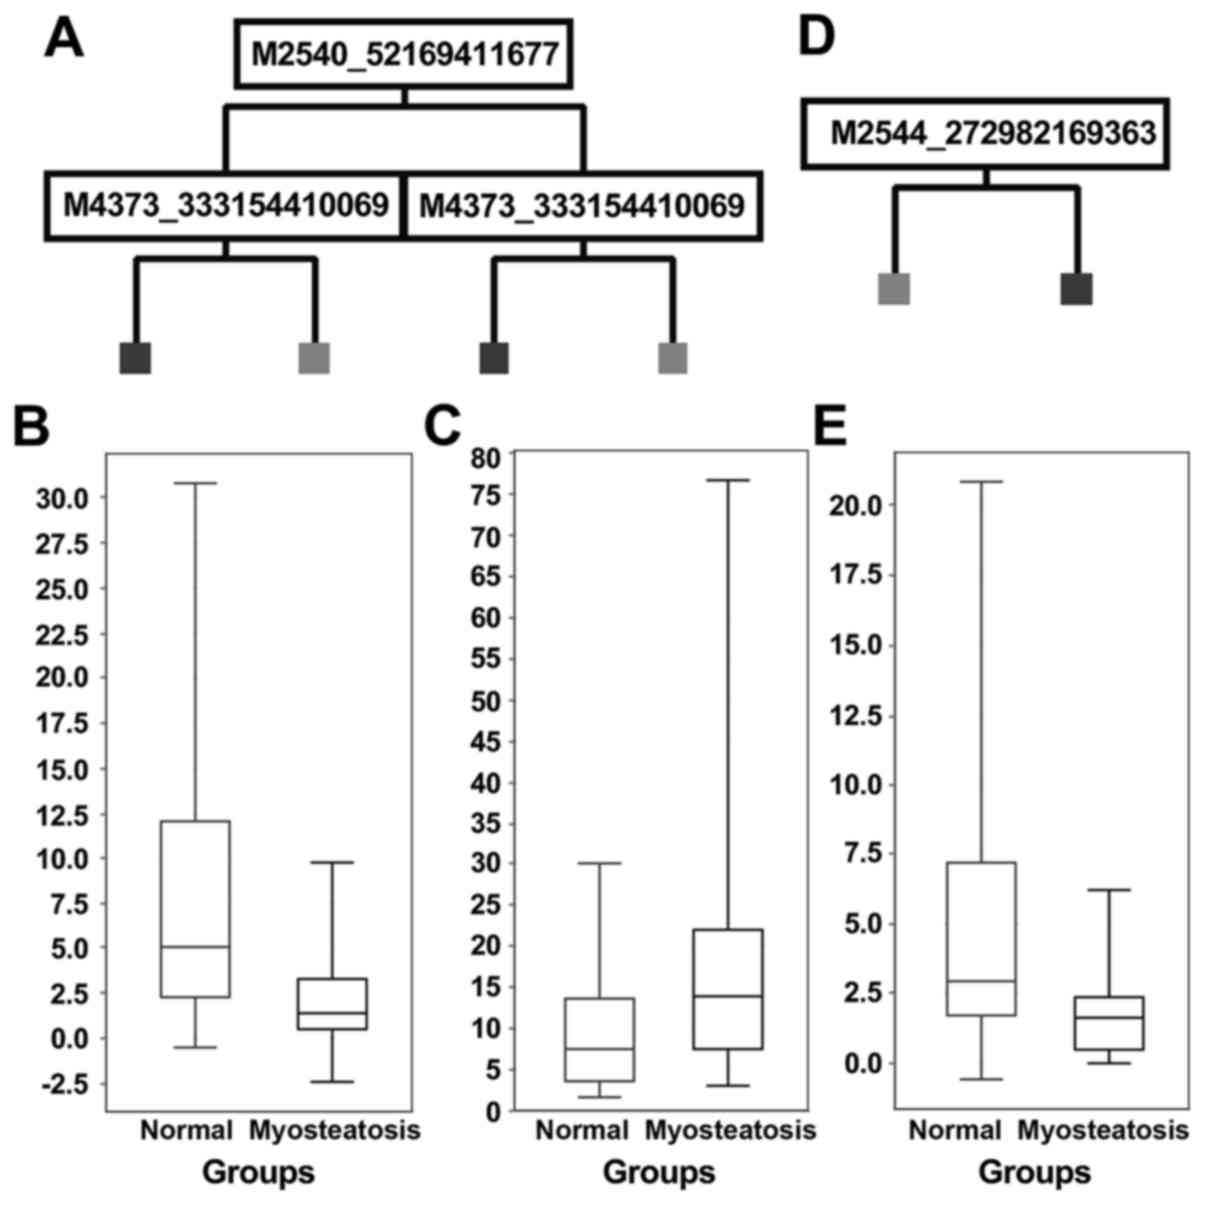
samples). Decision tree models are shown in Fig. 1A and D. The IMAC30 chipset-based model
(Fig. 1A) showed a sensitivity of
100% and a specificity of 25% for the validation dataset, and
application of the derived model to the entire cohort showed a
sensitivity of 97%, and specificity of 71%. Application of the CM10
chipset-based model (Fig. 1D) to the
validation dataset gave a sensitivity of 73%, specificity of 25%,
and for the entire cohort the values are 77% sensitivity, 67%
specificity.
Statistical analysis of the m/z cluster peaks
involved in the models and potential marker peaks showing low
P-values are shown in Table II.
| Table II.Expression profiles of potential
biomarker peaks identified in cluster and decision tree-analysis
models. |
Table II.
Expression profiles of potential
biomarker peaks identified in cluster and decision tree-analysis
models.
| Chip-type | P-value | ROC area | m/z average | m/z STH | Intensity
average | Intensity STD | Average fold change
in myosteatosis | Median fold change
in myosteatosis | Frequency % found
in control | Frequency % found
in myosteatosis | Sensitivity | Specificity | SELDI normalized
intensity cut-off value | Model score |
|---|
| IMAC30 | 8.80E-04 | 0.249 | 2,540.622 | 0.656 | 4.710 | 6.798 | 0.25 | 0.26 | 29 | 6 | 77 | 67 | 3.796 | 57 |
| IMAC30 | 0.010 | 0.692 | 4,374.115 | 2.053 | 15.006 | 15.331 | 1.92 | 1.89 | 33 | 52 | 90 | 46 | 5.330 | 100 |
| IMAC30 | 0.031 | 0.677 | 3,293.315 | 1.211 | 2.959 | 3.632 | 2.03 | 1.54 | 13 | 23 | 97 | 38 | 0.187 | 50 |
| IMAC30 | 0.038 | 0.633 | 4,022.472 | 3.849 | 15.242 | 14.390 | 1.82 | 1.32 | 58 | 87 | 23 | 100 | 23.359 | 40 |
| CM10 | 0.004 | 0.278 | 3,935.118 | 3.023 | 8.794 | 11.684 | 0.44 | 0.47 | 42 | 23 | 61 | 83 | 4.010 | 46 |
| CM10 | 0.013 | 0.293 | 2,544.214 | 0.734 | 3.120 | 3.819 | 0.37 | 0.54 | 21 | 3 | 100 | 33 | 6.248 | 100 |
| CM10 | 0.032 | 0.337 | 3,905.125 | 1.346 | 11.689 | 20.742 | 0.40 | 0.72 | 29 | 23 | 68 | 63 | 4.555 | 0 |
| CM10 | 0.035 | 0.367 | 19,135.906 | 4.947 | 1.174 | 1.325 | 0.50 | 0.59 | 42 | 35 | 100 | 25 | 2.631 | 0 |
| CM10 | 0.038 | 0.323 | 8,872.941 | 8.216 | 6.644 | 6.701 | 0.68 | 0.45 | 79 | 45 | 48 | 88 | 2.734 | 0 |
| CM10 | 0.040 | 0.352 | 9,972.795 | 5.235 | 8.391 | 6.251 | 0.77 | 0.62 | 33 | 29 | 77 | 63 | 7.948 | 0 |
| CM10 | 0.045 | 0.648 | 7,271.147 | 3.684 | 3.358 | 6.625 | 1.12 | 1.41 | 17 | 23 | 42 | 92 | 2.372 | 0 |
| CM10 | 0.049 | 0.633 | 22,341.029 | 34.548 | 0.995 | 1.077 | 1.80 | 1.71 | 38 | 61 | 48 | 88 | 1.024 | 0 |
Of the 4 peak clusters in the IMAC30-based dataset
which had either high model score values, or showed P-values
<0.05, three were upregulated and one downregulated in
myosteatosis (e.g., m/z 2,540 in Fig.
1B and m/z 4,373 in Fig. 1). The
CM10-based chipset showed 8 peak clusters of interest, of which one
was upregulated, 6 downregulated and one unchanged in myosteatosis
(e.g., m/z 2,544; Fig. 1E). All of
these clustered peaks, which showed statistical significance from
both the IMAC30 and CM10 dataset, were further investigated by
enrichment of urinary proteins from 14 (IMAC30) and 22 (CM10)
samples each, and excision of gel bands after electrophoresis and
LC-MS/MS downstream processing, followed by Mascot searching and
identification of proteins contained within the samples as
described earlier (15). All lead m/z
clusters have P-values <0.05.
Potential markers identified. All potential markers
identified by Mascot-SELDI pattern matching are detailed in
Table III.
| Table III.Potential biomarkers identified. |
Table III.
Potential biomarkers identified.
| m/z peak | Regulation | Protein ID | Protein name | Mass (Da) | Mascot score | Average number of
peptides | Average emPAI | Percentage of
sequence coverage | Expected percentage
of sequence coverage | Mascot-SELDI matrix
matching scores |
|---|
| 2,540 | Down | GELS_HUMAN | Gelsolin
precursor | 85,698 | 118 | 6.9 | 0.16 | 8.8 | 3.0 | 60/77 |
|
|
| MASP2_HUMAN | Mannan-binding
lectin | 75,702 | 65 | 9.3 | 0.13 | 6.3 | 3.4 | 60/77 |
|
|
|
| serine protease 2
precursor |
|
|
|
|
|
|
|
| 4,022 | Up | MASP2_HUMAN | Mannan-binding
lectin | 75,702 | 65 | 9.3 | 0.13 | 6.3 | 5.3 | 50/100 |
|
|
|
| serine protease 2
precursor |
|
|
|
|
|
|
|
| 3,934 | Down | CATC_HUMAN |
Dipeptidyl-peptidase 1 | 51,854 | 105 | 3 | 0.11 | 4.8 | 7.6 | 66/76 |
|
|
|
| precursor/cathepsin
C |
|
|
|
|
|
|
|
|
|
| AGRIN_HUMAN | Agrin
precursor | 214,846 | 45 | 8.7 | 0.03 | 2.8 | 1.8 | 55/76 |
| 2,544 | Down | ARSA_HUMAN | Arylsulfatase A
precursor | 53,588 | 25 | 2 | 0.07 | 4.7 | 4.7 | 50/94 |
|
|
| GFAP_HUMAN | Glial fibrillary
acidic protein | 49,937 | 61 | 4 | 0.07 | 11.2 | 5.1 | 50/88 |
| 8,874 | Down | A2GL_HUMAN | Leucine-rich | 38,178 | 90 | 7.9 | 0.25 | 12.4 | 23.2 | 66/100 |
|
|
|
| α-2-glycoprotein
precursor |
|
|
|
|
|
|
|
| 9,971 | Down | CYTB_HUMAN | Cystatin-B | 11,197 | 77 | 7.4 | 1.57 | 41.7 | 89.1 | 100/100 |
| 7,271 | – | H2AV_HUMAN | Histone H2AV | 13,509 | 30 | 2.3 | 0.29 | 13.7 | 53.8 | 100/100 |
Both the m/z 3,293 and 4,373 from the IMAC30 screen
and m/z 3,905 from the CM10 chipset data could not be matched to
observed expression patterns, and m/z 19,136 and 22,355 from the
CM10 chipset were too far removed from the gel-analysed mass range
to assign them to observed protein patterns. Both the m/z 2,540 and
4,022 clusters from the IMAC30 dataset matched Mannan-binding
lectin serine protease 2 precursor (MASP2), and the m/z 2,540 peak
also matched the expression pattern of gelsolin (GSN). The observed
expression patterns of both agrin (AGRN) and dipeptidyl-peptidase
1, also known as cathepsin C (CTSC), matched the m/z 3,934 peak
cluster. The downregulated m/z cluster at 2,544 matched to both
arylsulfatase A (ARSA) and glial fibrillary acidic protein (GFAP)
expression profiles. The downregulated m/z 8,874 peak cluster
expression profile matched Leucine-rich α-2-glycoprotein precursor
(LRG1). The m/z 9,971 cluster was associated with cystatin-B, and
the observed histone H2AV (H2AFV) expression correlated with the
m/z 7,271 peak. None of the peak clusters show any significant
age-or sex-related expression differences.
The m/z distribution of individual peaks within a
peak cluster shows the expected pattern of a heterogeneous
population of urinary molecular species. However, this does not
exclude that some peak clusters may consist of more than one unique
protein or peptide.
Discussion
In the present study, approximately 42% of patients
with uGI cancer were found to have myosteatosis. One potential
limitation of this study is that no previously established
definition of myosteatosis exists. A value of skeletal muscle
density (SMD) 2 SD below the mean in a healthy population was used
in a similar manner to definitions for sarcopenia and were selected
from values stated in one small study (16). The populations described in other
similar studies of skeletal muscle attenuation in healthy
individuals are also small, however, and different (although
similar) values could be obtained depending on the series chosen
(18,19). Skeletal muscle attenuation in the form
of HU has recently been demonstrated to be associated with adverse
outcome in patients with GI and lung cancer independent of BMI,
skeletal muscle mass or weight loss (20). Values obtained for increased risk were
<33 for individuals with BMI >25 or 41 for those with BMI
<25 (20) and so are not
dissimilar to the value of 39.5 chosen for all the participants as
a cut-off value for this study. Using this definition, HU values
were used to divide the cohort into two groups that had similar
characteristics in terms of BMI, weight loss and CRP, suggesting
that there was no difference between them in conventional measures
of cachexia severity (21). The
non-myosteatotic group were slightly older although the difference
of seven years is unlikely to be clinically significant.
In this cohort, SELDI-TOF-MS was able to analyse and
screen urine from uGI cancer patients for prospective myosteatosis
biomarkers and to establish a proteomic fingerprint pattern which
potentially can be used in clinical diagnostics. It was found that
both IMAC30 and CM10 are useful chip-types for the analysis of
human urine (16), and models based
on the analysis of 55 samples were generated from cancer patients.
The samples were measured on CM10 and IMAC30 chips, and using the
tree-analysis method, statistical models were established with
overall sensitivities of 97% (IMAC30) and 77% (CM10) and
specificities of 71% (IMAC30) and 67% (CM10) across the entire
datasets. Using expression pattern matching, it was possible to
assign several proteins identified in urine to the proposed
biomarkers.
Cystatin-B is described as a protein that can
stimulate cancer cell growth both in vitro and in
vivo and recently has been shown to be a potential prognostic
marker for lung cancer (22).
However, this molecule has no direct known association with
skeletal muscle wasting but has been shown to be associated with
total fat mass, percentage body fat, abdominal fat and body fat
distribution as measured by DEXA in a recent study examining
cardiovascular risk factors in children (23).
MASP2 matched the m/z 2,540 and 4,022 clusters from
the IMAC30 dataset; however, m/z 2,540 was shown to be
downregulated, and m/z 4,022 upregulated. It is a possibility that
this could be an indicator that fragmentation states are altered in
myosteatosis by for example, lower quantities of other proteases,
such as CTSC a lysosomal protease associated with proteolysis after
muscle trauma (24), which we found
to be associated with the downregulated m/z 3,934 cluster peak. It
has been shown in previous studies to play a role in protein
degradation and turnover particularly in the later stages of muscle
wasting following disuse (25).
Exercise injuries in mouse models have shown upregulation of CTSC
in skeletal muscle (26), and our
observed downregulation of the associated m/z cluster may indicate
a dysfunction in muscle repair.
The downregulated m/z peak of 2,540 also matched the
expression pattern of GSN, which is an actin-filament modulating
protein and can be found in smooth and skeletal muscle cells, as
well as a secreted form in plasma (27). Reported downregulation of GSN in
breast cancer cells, ovarian carcinomas, and melanomas suggests
that this molecule acts as a tumour suppressor (28). Underexpression of GSN has been shown
to increase inflammation in MS and encephalitits. It has already
been reported that recombinant human gelsolin (rhp-GSN) can remit
some inflammatory diseases in the animal model, such as burn
injury, middle cerebral artery occlusion, and sepsis (29). The association of GSN and apoptosis
has been deeply researched. Full-length GSN, and the C-terminal
half of GSN are generally considered as having anti-apoptotic
function (29).
AGRN, which also matched the same m/z cluster as
CTSC. It is a component of the basal lamina on the surface of
muscle fibres of the neuromuscular junction, and defects in this
gene perturbs the maintenance of the neuromuscular junction
(30), whereas an overexpression in a
laminin-deficient mouse model increases muscle integrity and
regenerative capacity (31). The
observed downregulation in the CM10-chipset based model could be
related to a dysfunction of muscle regeneration. Conflicting with
the downregulation observed herein, however, is the finding that
the agrin fragment (CAF) has recently been identified as being
elevated in the serum of a series of 73 older volunteers with
sarcopenia compared with age matched controls (32). A decrease in CAF has also been
associated with improvement of hand grip strength and muscle mass
in patients who were undergoing rehabilitation for acute stroke
(33). It is possible that this could
reflect different mechanisms of wasting in aging and cancer whereby
muscle regenerative ability is diminished in cancer but maintained
in aging.
The downregulated m/z cluster at 2,544 matched to
both ARSA and GFAP expression profiles. Mutations in ARSA can cause
demyelination and GFAP is associated with central nervous system
disorders (27) and chronic
neuropathies (32).
The downregulated m/z 8,874 peak cluster expression
profile matched LRG1, which is a secreted protein and has been
postulated as a biomarker of ventricular dysfunction and heart
failure (34). The reported
upregulation associated with heart disease is in contrast with our
observed downregulation of this marker, and its role in
myosteatosis remains unclear. H2AFV expression correlated with the
m/z 7,271 peak. Some members of the histone H1 family have been
reported to be involved in cell survival in breast cancer cells and
H1.2 was identified as an apoptogenic factor (34). The measured SELDI-MS-based slight
upregulation could be an indication of elevated apoptosis in
general, and a specific role in muscle function, cancer or fat
infiltration remains unclear.
With the exception of AGRN and CTSC, the poor
associations of some of these markers with known mechanisms of
muscle wasting casts some doubt over the specificity of these
results to changes in muscle quality in terms of intramyocellular
lipid. One possibility is that some of the markers listed above
might also be associated with other factors, such as cancer type.
The cohort here included patients with cancers of both
oesophagogastric and pancreatic origin and the presence of
unrecognised specific markers for these cancer types might skew any
interpretation of the results (35,36).
Additional potential limitations are that there may
be effects on skeletal muscle HU other than intracellular lipid. A
clear association between intramyocellular lipid and Hounsfield
units has been demonstrated in healthy individuals (37) and also in patients with cancer
cachexia. We have previously shown that the number and size of
intramyocellular lipid droplets is increased in the presence of
cancer and increases further with weight loss/loss of adipose mass
in other body compartments (12).
Oedema has been shown to be an additional influence on mean
Hounsfield unit of skeletal muscle in patients with cancer that
would not be present in healthy volunteers (38). While a number of potential markers
indicated such as CTSC, AGRN and arclsulfatase A may be associated
with muscle or neuromuscular wasting several of these proteins are
non-specific or cancer specific. This may indicate that the models
are describing both muscle wasting and additional factors,
potentially including cancer progression or nutritional states
unrecognised or not assessed in this cohort. The potential
influence on mean Hounsfield units in patients with cancer by
factors other than intramyocellular lipid also requires to be
explored further.
In conclusion, stratification and pattern matching
allowed us to search for specific myosteatosis-related biomarkers
in the urine of cancer patients using SELDI-TOF mass spectrometry.
We observed a downregulation of fragments of CTSC, argin, ARSA and
GFAP all of which may play a role muscle wasting. Further
investigation of specific assays monitoring expression levels in
our proposed biomarkers would help translate our findings into the
clinical setting. Investigations using a larger cohort would also
confirm their validity.
Acknowledgements
We thank N.A. Stephens for patient recruitment.
Glossary
Abbreviations
Abbreviations:
|
BPS
|
Biomarker Pattern software
|
|
emPAI
|
exponentially modified protein
abundance index
|
|
uGI
|
upper gastrointestinal
|
|
OGJ
|
oesophagogastric junction
|
|
PCDMS
|
ProteinChip Data Manager software
|
|
SPA
|
sinapinic acid
|
References
|
1
|
Delmonico MJ, Harris TB, Visser M, Park
SW, Conroy MB, Velasquez-Mieyer P, Boudreau R, Manini TM, Nevitt M,
Newman AB and Goodpaster BH: Health, Aging, and Body: Longitudinal
study of muscle strength, quality, and adipose tissue infiltration.
Am J Clin Nutr. 90:1579–1585. 2009. View Article : Google Scholar : PubMed/NCBI
|
|
2
|
Li Y, Xu S, Zhang X, Yi Z and Cichello S:
Skeletal intramyocellular lipid metabolism and insulin resistance.
Biophys Rev. 1:90–98. 2015.
|
|
3
|
Skipworth RJE, Stewart GD, Dejong CHC,
Preston T and Fearon KCH: Pathophysiology of cancer cachexia: Much
more than host-tumour interaction? Clin Nutr. 26:667–676. 2007.
View Article : Google Scholar : PubMed/NCBI
|
|
4
|
Dewys WD, Begg C, Lavin PT, Band PR,
Bennett JM, Bertino JR, Cohen MH, Douglass HO Jr, Engstrom PF,
Ezdinli EZ, et al: Eastern Cooperative Oncology Group: Prognostic
effect of weight loss prior to chemotherapy in cancer patients. Am
J Med. 69:491–497. 1980. View Article : Google Scholar : PubMed/NCBI
|
|
5
|
Fearon KCH, Voss AC and Hustead DS: Cancer
Cachexia Study Group: Definition of cancer cachexia: Effect of
weight loss, reduced food intake, and systemic inflammation on
functional status and prognosis. Am J Clin Nutr. 83:1345–1350.
2006. View Article : Google Scholar : PubMed/NCBI
|
|
6
|
Lieffers JR, Bathe OF, Fassbender K,
Winget M and Baracos VE: Sarcopenia is associated with
postoperative infection and delayed recovery from colorectal cancer
resection surgery. Br J Cancer. 107:931–936. 2012. View Article : Google Scholar : PubMed/NCBI
|
|
7
|
Ding Q, Mracek T, Gonzalez-Muniesa P, Kos
K, Wilding J, Trayhurn P and Bing C: Identification of macrophage
inhibitory cytokine-1 in adipose tissue and its secretion as an
adipokine by human adipocytes. Endocrinology. 150:1688–1696. 2009.
View Article : Google Scholar : PubMed/NCBI
|
|
8
|
Russell ST and Tisdale MJ: The role of
glucocorticoids in the induction of zinc-alpha2-glycoprotein
expression in adipose tissue in cancer cachexia. Br J Cancer.
92:876–881. 2005. View Article : Google Scholar : PubMed/NCBI
|
|
9
|
Mracek T, Stephens NA, Gao D, Bao Y, Ross
JA, Rydén M, Arner P, Trayhurn P, Fearon KC and Bing C: Enhanced
ZAG production by subcutaneous adipose tissue is linked to weight
loss in gastrointestinal cancer patients. Br J Cancer. 104:441–447.
2011. View Article : Google Scholar : PubMed/NCBI
|
|
10
|
Das SK, Eder S, Schauer S, Diwoky C,
Temmel H, Guertl B, Gorkiewicz G, Tamilarasan KP, Kumari P, Trauner
M, et al: Adipose triglyceride lipase contributes to
cancer-associated cachexia. Science. 333:233–238. 2011. View Article : Google Scholar : PubMed/NCBI
|
|
11
|
Gray C, MacGillivray TJ, Eeley C, Stephens
NA, Beggs I, Fearon KCH and Greig CA: Magnetic resonance imaging
with k-means clustering objectively measures whole muscle volume
compartments in sarcopenia/cancer cachexia. Clin Nutr. 30:106–111.
2011. View Article : Google Scholar : PubMed/NCBI
|
|
12
|
Stephens NA, Skipworth RJE, Macdonald AJ,
Greig CA, Ross JA and Fearon KCH: Intramyocellular lipid droplets
increase with progression of cachexia in cancer patients. J
Cachexia Sarcopenia Muscle. 2:111–117. 2011. View Article : Google Scholar : PubMed/NCBI
|
|
13
|
Mueller TC, Bachmann J, Prokopchuk O,
Friess H and Martignoni ME: Molecular pathways leading to loss of
skeletal muscle mass in cancer cachexia - can findings from animal
models be translated to humans? BMC Cancer. 16:752016. View Article : Google Scholar : PubMed/NCBI
|
|
14
|
Fearon KCH and Baracos VE: Cachexia in
pancreatic cancer: New treatment options and measures of success.
HPB. 12:323–324. 2010. View Article : Google Scholar : PubMed/NCBI
|
|
15
|
Skipworth RJE, Stewart GD, Bhana M,
Christie J, Sturgeon CM, Guttridge DC, Cronshaw AD, Fearon KCH and
Ross JA: Mass spectrometric detection of candidate protein
biomarkers of cancer cachexia in human urine. Int J Oncol.
36:973–982. 2010.PubMed/NCBI
|
|
16
|
Husi H, Stephens N, Cronshaw A, MacDonald
A, Gallagher I, Greig C, Fearon KCH and Ross JA: Proteomic analysis
of urinary upper gastrointestinal cancer markers. Proteomics Clin
Appl. 5:289–299. 2011. View Article : Google Scholar : PubMed/NCBI
|
|
17
|
Prado CM, Lieffers JR, McCargar LJ, Reiman
T, Sawyer MB, Martin L and Baracos VE: Prevalence and clinical
implications of sarcopenic obesity in patients with solid tumours
of the respiratory and gastrointestinal tracts: A population-based
study. Lancet Oncol. 9:629–635. 2008. View Article : Google Scholar : PubMed/NCBI
|
|
18
|
Goodpaster BH, Thaete FL and Kelley DE:
Composition of skeletal muscle evaluated with computed tomography.
Ann N Y Acad Sci. 904:18–24. 2000. View Article : Google Scholar : PubMed/NCBI
|
|
19
|
Goodpaster BH, Carlson CL, Visser M,
Kelley DE, Scherzinger A, Harris TB, Stamm E and Newman AB:
Attenuation of skeletal muscle and strength in the elderly: The
Health ABC Study. J Appl Physiol 1985. 90:2157–2165. 2001.
View Article : Google Scholar : PubMed/NCBI
|
|
20
|
Martin L, Birdsell L, Macdonald N, Reiman
T, Clandinin MT, McCargar LJ, Murphy R, Ghosh S, Sawyer MB and
Baracos VE: Cancer cachexia in the age of obesity: Skeletal muscle
depletion is a powerful prognostic factor, independent of body mass
index. J Clin Oncol. 31:1539–1547. 2013. View Article : Google Scholar : PubMed/NCBI
|
|
21
|
Fearon K, Strasser F, Anker SD, Bosaeus I,
Bruera E, Fainsinger RL, Jatoi A, Loprinzi C, MacDonald N,
Mantovani G, et al: Definition and classification of cancer
cachexia: An international consensus. Lancet Oncol. 12:489–495.
2011. View Article : Google Scholar : PubMed/NCBI
|
|
22
|
Hosokawa M, Kashiwaya K, Eguchi H,
Ohigashi H, Ishikawa O, Furihata M, Shinomura Y, Imai K, Nakamura Y
and Nakagawa H: Over-expression of cysteine proteinase inhibitor
cystatin 6 promotes pancreatic cancer growth. Cancer Sci.
99:1626–1632. 2008. View Article : Google Scholar : PubMed/NCBI
|
|
23
|
Dencker M, Tanha T, Karlsson MK, Wollmer
P, Andersen LB and Thorsson O: Cystatin B, cathepsin L and D
related to surrogate markers for cardiovascular disease in
children. PLoS One. 12:e01874942017. View Article : Google Scholar : PubMed/NCBI
|
|
24
|
Farges MC, Balcerzak D, Fisher BD, Attaix
D, Béchet D, Ferrara M and Baracos VE: Increased muscle proteolysis
after local trauma mainly reflects macrophage-associated lysosomal
proteolysis. Am J Physiol Endocrinol Metab. 282:E326–E335. 2002.
View Article : Google Scholar : PubMed/NCBI
|
|
25
|
Stevenson EJ, Giresi PG, Koncarevic A and
Kandarian SC: Global analysis of gene expression patterns during
disuse atrophy in rat skeletal muscle. J Physiol. 551:33–48. 2003.
View Article : Google Scholar : PubMed/NCBI
|
|
26
|
Salminen A and Kihlström M: Lysosomal
changes in mouse skeletal muscle during the repair of exercise
injuries. Muscle Nerve. 8:269–279. 1985. View Article : Google Scholar : PubMed/NCBI
|
|
27
|
Wen D, Corina K, Chow EP, Miller S, Janmey
PA and Pepinsky RB: The plasma and cytoplasmic forms of human
gelsolin differ in disulfide structure. Biochemistry. 35:9700–9709.
1996. View Article : Google Scholar : PubMed/NCBI
|
|
28
|
Rao J and Li N: Microfilament actin
remodeling as a potential target for cancer drug development. Curr
Cancer Drug Targets. 4:345–354. 2004. View Article : Google Scholar : PubMed/NCBI
|
|
29
|
Gao J, Qin Z, Guan X, Guo J, Wang H and
Liu S: Overexpression of GSN could decrease inflammation and
apoptosis in EAE and may enhance vitamin D therapy on EAE/MS. Sci
Rep. 7:6042017. View Article : Google Scholar : PubMed/NCBI
|
|
30
|
Bentzinger CF, Barzaghi P, Lin S and Ruegg
MA: Overexpression of mini-agrin in skeletal muscle increases
muscle integrity and regenerative capacity in
laminin-alpha2-deficient mice. FASEB J. 19:934–942. 2005.
View Article : Google Scholar : PubMed/NCBI
|
|
31
|
Hettwer S, Dahinden P, Kucsera S, Farina
C, Ahmed S, Fariello R, Drey M, Sieber CC and Vrijbloed JW:
Elevated levels of a C-terminal agrin fragment identifies a new
subset of sarcopenia patients. Exp Gerontol. 48:69–75. 2013.
View Article : Google Scholar : PubMed/NCBI
|
|
32
|
Brenner M, Johnson AB, Boespflug-Tanguy O,
Rodriguez D, Goldman JE and Messing A: Mutations in GFAP, encoding
glial fibrillary acidic protein, are associated with Alexander
disease. Nat Genet. 27:117–120. 2001. View
Article : Google Scholar : PubMed/NCBI
|
|
33
|
Scherbakov N, Knops M, Ebner N, Valentova
M, Sandek A, Grittner U, Dahinden P, Hettwer S, Schefold JC, von
Haehling S, et al: Evaluation of C-terminal agrin fragment as a
marker of muscle wasting in patients after acute stroke during
early rehabilitation. J Cachexia Sarcopenia Muscle. 7:60–67. 2016.
View Article : Google Scholar : PubMed/NCBI
|
|
34
|
Watson CJ, Ledwidge MT, Phelan D, Collier
P, Byrne JC, Dunn MJ, McDonald KM and Baugh JA: Proteomic analysis
of coronary sinus serum reveals leucine-rich α2-glycoprotein as a
novel biomarker of ventricular dysfunction and heart failure. Circ
Heart Fail. 4:188–197. 2011. View Article : Google Scholar : PubMed/NCBI
|
|
35
|
Huzé C, Bauché S, Richard P, Chevessier F,
Goillot E, Gaudon K, et al: Identification of an agrin mutation
that causes congenital myasthenia and affects synapse function. Am
J Hum Genet. 85:155–167. 2009. View Article : Google Scholar : PubMed/NCBI
|
|
36
|
Bentzinger CF, Barzaghi P, Lin S and Ruegg
MA: Overexpression of mini-agrin in skeletal muscle increases
muscle integrity and regenerative capacity in
laminin-alpha2-deficient mice. FASEB J. 19:934–942. 2005.
View Article : Google Scholar : PubMed/NCBI
|
|
37
|
Goodpaster BH, Kelley DE, Thaete FL, He J
and Ross R: Skeletal muscle attenuation determined by computed
tomography is associated with skeletal muscle lipid content. J Appl
Physiol (1985). 89:104–110. 2000. View Article : Google Scholar : PubMed/NCBI
|
|
38
|
Ramage MI, Johns N, Deans CD, Ross JA,
Preston T, Skipworth RJ, Jacobi C and Fearon KC: The relationship
between muscle protein content and CT-derived muscle radio-density
in patients with upper GI cancer. Clin Nutr. 37:752–754. 2018.
View Article : Google Scholar : PubMed/NCBI
|