Introduction
Cancer cachexia is a syndrome of muscle and fat loss
leading to progressive functional impairment (1,2). It is
thought to be due to complex and variable host-tumour interactions
(3,4).
Currently, cachexia is defined by the presence of weight loss
greater than 5% or greater than 2% in the presence of low muscle
mass or low BMI (5). This definition
also introduces the concept of ‘pre-cachexia’, a phase of minimal
weight loss that may be a stage at which intervention is best
targeted. By relying on weight loss, the current cancer cachexia
definition is dependent on gross assessment of the patient
phenotype rather than identification of the underlying pathological
process. Weight loss (often self-reported) may be difficult to
determine accurately and may be complicated by factors which act to
increase body mass such as fluid accumulation or fat gain because
of chemotherapeutic or hormonal treatment. The radiological
detection of low muscle mass is known to be associated with adverse
patient outcome, particularly in the presence of obesity (5). However, the use of low muscularity in
the diagnosis of cachexia is hampered by the fact that measures of
muscle mass are often only available as a single measure without
dynamic reference to loss or gain. As a result, slim individuals
with a low pre-morbid muscle mass risk are grouped along with those
with severe cachexia. One alternative to measuring the quantity of
fat and muscle tissue in body composition is to measure the tissue
quality or function.
Dynapenia is defined as ‘the age associated loss of
muscle strength that is not caused by neurologic or muscular
diseases’ (6). It predisposes
patients to an increased risk of functional limitations and
mortality. Development of dynapenia is variable according to
pre-existing host characteristics such as initial BMI, body
composition, physical activity, food intake and pre-existing
co-morbidities. These factors are often concurrently present and
interact to lead to muscle wasting (6).
Early recognition of dynapenia and assessment of its
progression or regression may be difficult with the common measures
used to diagnose muscle wasting, e.g., CT scan. Furthermore,
repeated measures of muscle strength and power may be hampered in
routine clinical practice by patient frailty and the specialised
equipment required. However, safe, accessible and non-invasive
tools to detect dynapenia biochemically are currently lacking
because the precise molecular mechanisms that define it are
currently poorly characterised (7).
Assessment of the urinary protein profile to
determine metabolites which may act as biomarkers is one potential
method for diagnosing or monitoring disease. Urine is an ideal
sample source for the clinical setting, as it can be obtained
easily, is relatively stable and the collection of samples is
non-invasive. In addition, urine contains a relatively small number
of proteins which are present at lower concentrations compared with
serum or plasma therefore making them easier to detect (8,9). Despite
the relative simplicity of urine this method is complicated by the
difficulty in standardising urine samples across individuals to
determine the clinically relevant concentration of any particular
urinary biomarker. One solution to this is to examine the whole
urine protein and peptide profile with SELDI-TOF-MS mass
spectrometry (MS) and identify potential biomarkers from a urinary
proteomic ‘fingerprint’ of multiple peaks corresponding to the
urinary metabolites of a potential marker. Previous studies have
found the technique of SELDI-TOF-MS ideally suited for urine
analysis, with a combination of high throughput, speed and
relatively low cost (10). The main
drawback of SELDI-TOF-MS is the comparatively medium resolution of
the spectra obtained. However, this is adequate to resolve peaks in
the 1,000 to 25,000 Da range from spectra with <500 peaks. The
presence or absence of dynapenic muscle is predicted by a decision
tree model consisting of the presence or absence of multiple
urinary protein/peptide peaks.
SELDI-TOF MS is an established technique for
peptide/protein biomarker discovery (11). This method has been successfully
performed in a recent study where SELDI-TOF MS was capable of
identifying urinary diagnostic markers of upper gastrointestinal
(uGI) cancer (12). As excess or
abnormal skeletal muscle protein breakdown or synthesis is likely
to result in the presence of metabolites in the urine just as
cancer-associated markers appear in urine, an identical methodology
should be suitable for the detection of protein/peptide markers for
the presence of dynapenia.
With this in mind, we aimed to identify potential
urinary biomarkers for dynapenia in patients with uGI cancer.
Materials and methods
Materials
Buffers, gels and SELDI chips were purchased from
Bio-Rad (Hemel Hempstead, UK), and all other chemicals were
obtained from Sigma-Aldrich (Gillingham, UK), unless stated
otherwise in the text.
Sample collection
Patients were recruited from the regional uGI or
hepatopancreaticobiliary mutli-disciplinary team meetings. Patients
had to be over the age of 18, be able to give informed consent and
be undergoing potentially curative surgery. There were otherwise no
exclusion criteria. Ethical approval was provided by the Lothian
region ethics board. Urine was sampled into a sterile container at
the time of anaesthesia following an overnight fast. Samples were
then snap frozen in liquid nitrogen and stored at −40°C until use.
Samples requiring to be stored for over a month were stored at
−80°C. The study conformed to the standards set by the Declaration
of Helsinki.
CRP measurement
Serum CRP concentration was measured using an
automated immunoturbidimetric assay. Using this assay, a
concentration of 10 mg/l represents the upper limit of normal range
with most healthy individuals having a serum concentration <2
mg/l.
Dynapenia stratification
Maximum isometric knee extensor strength (strain
gauge) (IKES). Maximum IKES (13) was
measured with the participant seated in an adjustable
straight-backed chair with the pelvis secured and the knee flexed
at strain gauge and data acquisition system (PowerLab;
ADInstruments, Ltd., Oxford, UK). Following instruction, the
participant made a maximum voluntary contraction which was held for
5 sec. Three separate measurements (Newtons) were obtained for each
limb and the highest value from the dominant limb used in
subsequent analysis. The coefficient of variation for IKES is 6.9%
for a single session and 10% across sessions occurring over several
days (14).
Maximum leg extensor power (LEP)
(Nottingham Power Rig)
Maximum LEG (Nottingham Power Rig) was measured
using the Nottingham Power Rig. The participant was seated on the
rig with the seat position adjusted so that in full extension the
footplate was fully depressed. The participant pushed as hard and
as fast as possible against the footplate to accelerate the fly
wheel. The final velocity of the flywheel was used to calculate the
average power output (Watts) during a single maximal thrust of the
lower limb. The process was repeated five times with each limb and
the highest value from the dominant limb used in subsequent
analysis. The coefficient of variation for repeated tests of leg
extensor power measured using the Nottingham power rig in healthy
individuals was 8.7% (15).
Definition of dynapenia
Dynapenia was defined as a strength and/or power
below the 5th percentile for the population matched for age and sex
based on the Allied Dunbar national fitness survey (16).
SELDI-TOF-MS
SELDI-chips (CM10 and IMAC30) were prepared for
sample application according to the protocol and as previously
reported (13). Briefly, IMAC30 chips
were loaded with 0.1 M CuSO4, washed with water,
neutralised with 0.1 M NaAc (pH 4.0) and washed with water,
followed by two washes with 0.1 M NaHPO4. NaCl (0.5 M),
and CM10 chips were washed twice with 0.1 M NaHPO4 (pH
4.0). All the chips were processed in a bioprocessor-assembly by
incubating 0.1 ml urine and 0.1 ml binding buffer [CM10: 0.1 M
NaHPO4 (pH 4.0); IMAC30: 0.1 M NaHPO4, 0.5 M
NaCl] for 1 h at room temperature with vigorous shaking. This was
followed by three washes with 0.2 ml binding buffer for 5 min each
at room temperature with vigorous shaking and two washes with 0.2
ml water at room temperature with vigorous shaking. They were then
air-dried and 2 times 1 ml energy absorbing matrix [sinapinic acid
(SPA), in 50% ACN, 0.5% TFA)] was added. Air-dried chips were
analysed in a PCS4000 SELDI-TOF instrument (Bio-Rad) by measuring
the 1,000 to 25,000 Da range with a laser setting of 2.5 mJ and
spectra were exported as ‘.xml’ files. The SELDI instrument was
calibrated using the ProteinChip All-In-One peptide standard
(Bio-Rad). Source voltage was 25,000 V, and detector voltage was
2,946 V. Quality control and consistency was ensured by using one
random pool of urines on one spot per chip each. Spectral
alignments of quality controls ensured consistency of all
spectra.
Data processing
ProteinChip Data Manager software (PCDMS) version
4.1 with integrated Biomarker Wizard cluster analysis (Bio-Rad) was
used for analysis. SELDI-TOF-MS traces were split into two groups:
Control and dynapenia. The baseline was subtracted from individual
m/z traces and profiles were normalised using total ion current,
followed by identification of peak clusters using the cluster
analysis tool. Peaks were selected in the first pass where the
signal to noise (S/N) ratio was >5, had a valley depth of at
least 3, and in the second pass S/N ratio was 2 and the valley
depth 2. The cluster mass window was set to 0.2% of mass. Clustered
peaks were only included if they occurred in at least 10% of all
spectra. The resulting P-values, receiver-operating characteristic
(ROC) areas, average and median m/z values, and intensities of the
clustered peaks were exported and saved as ‘.csv’ files and used
for model building. Heat-maps using Pearson's correlation and
principle component analysis plots were calculated to assess global
group divisions (i.e., dynapenia and control). A two-sample t-test
was used to compare mean normalized intensities between the case
and control groups. P<0.05 was considered statistically
significant.
Model building and validation
Clustered peak lists were analysed with the
Biomarker Pattern software (BPS; Bio-Rad). The m/z versus intensity
matrices were analysed using decision tree-analysis, selecting the
standard error rule of minimum cost-tree regardless of size, and
the method used was Gini. V-fold testing was set to 1,000. A total
of 15 dynapenic samples and 15 control samples were randomly chosen
and used as the learning and testing datasets for both the CM10-
and IMAC30-based datasets. The remainder of 19 (IMAC30) or 12
(CM10) samples were used as the validation dataset for
blind-testing. Sensitivity was defined as the probability of
predicting dynapenia cases, and the specificity was defined as the
probability of predicting control samples.
Peak isolation and identification
Peaks observed in the CM10 and IMAC30 chip-types
which showed marked expressional differences between control and
dynapenia samples, or branching points in the models were further
investigated. Urine (0.5 ml) from positive or negative samples in
relation to specific peaks was added to 30 ml CM10 or IMAC30 spin
column resins (Bio-Rad) and 0.75 ml binding buffer [0.1 M
NaHPO4 (pH 4.0) for CM10 resins, and or 0.1 M
NaHPO4 (pH 7.0) including 0.5 M NaCl for IMAC30 resins]
and incubated for 1 h at room temperature under constant agitation.
Unbound material was removed and the resin was washed 4 times with
0.3 ml binding buffer. Bound material was separated by
electrophoresis on a 16.5% Tris-Tricine gel (Bio-Rad), and gel
bands in the region of 2 to 10 kDa were excised after Coomassie
staining (BioSafe Coomassie; Bio-Rad). Positive and negative
samples were both chosen on the presence and absence of a specific
m/z peak to be identified based on SELDI-TOF-MS analysis. Proteins
and peptides from gel bands were digested in situ with trypsin, the
resulting peptides eluted with ACN, and analysed by LC-MS/MS as
described (12). Fragmentation
spectra were then processed by Xcalibur and BioWorks software
(Thermo Fisher Scientific, Loughborough, UK) and submitted to the
Mascot search engine (Matrix Science, London, UK) using
UniProt/SwissProt (release July 2010, Homo sapiens, 18,055
sequences) as the reference database. Mascot search parameters
were: Enzyme specificity trypsin, maximum missed cleavage 1, fixed
modifications cysteine carbamidomethylation, variable modification
methionine oxidation, precursor mass tolerance +/-3 Da, fragment
ion mass tolerance +/-0.4 Da. Only Mascot hits with a false
discovery rate of <0.05 were taken into consideration. Proteins
with at least two peptide matches were then analysed by pattern
matching based on SELDI-TOF-MS measured expression levels of peaks
of interest (expected abundance in selected samples) and observed
presence of proteins. Peptide distribution of identified peptides
within a protein as well as calculated molecular mass of identified
proteins was also used to assess whether breakdown products were
likely to account for mass variances between the expected mass and
the molecular weight of the full-length protein.
Mascot-SELDI matrix matching
Observed proteins with at least two peptide matches
from the LC-MS/MS analysis were then further analysed by pattern
matching based on SELDI-TOF-MS measured expression levels of peaks
of interest (expected abundance in selected samples). This was
carried out using software written in-house, which compares
observed protein expression patterns in a pre-defined set of
samples (LC-MS/MS results) against a matrix of peak patterns
(SELDI-TOF clustered peak intensities, where estimated peaks are
set to null) in the same set of samples. The scoring was based on
sensitivity (percent observed over expected) and specificity
(percent not observed over not expected), and results are presented
in descending order of cumulative scores.
Results
Patients
A total of 51 patients were recruited, of whom 44%
had oesophagogastric cancer and the remainder had a mixture of
pancreatic and duodenal cancer. A total of 49 patients underwent
strength testing of which 22 (44.9%) were classified as dynapenic;
42 of these patients also underwent power testing of which 23
(54.8%) were dynapenic; 13 patients had both low strength and
power. The mean age of participants was 65 years with ages ranging
from 43 to 82. Patients on average had lost 5.6% of their body
weight, mean BMI was 24.10 and CRP was 3. Demographic data are
shown in Table I.
 | Table I.Expression profiles of potential
biomarker peaks identified in cluster and decision tree-analysis
models. |
Table I.
Expression profiles of potential
biomarker peaks identified in cluster and decision tree-analysis
models.
| Chip-type | P-value | ROC area | m/z average | m/z STD | Intensity
average | Intensity STD | Average fold change
in dynapenia | Median fold change
in dynapenia | Frequency % found
in control | Frequency % found
in dynapenia | Sensitivity | Specificity | SELDI normalized
intensity cut-off value | Model score |
|---|
| IMC30 | 0.213 | 0.623 | 2,199.692 | 1.191 | 35.053 | 35.303 | 0.87 | 1.92 | 85 | 91 | 77 | 59 | 19.565 | 55 |
| IMC30 | 0.748 | 0.539 | 5,880.582 | 0.452 | 3.724 | 6.828 | 0.75 | 1.01 | 15 | 9 | 86 | 33 | 0.836 | 39 |
| IMC30 | 0.015 | 0.311 | 6,362.808 | 7.783 | 11.323 | 13.123 | 0.72 | 0.36 | 96 | 59 | 77 | 74 | 6.033 | 75 |
| IMC30 | 0.044 | 0.331 | 6,460.539 | 7.200 | 7.782 | 8.992 | 0.71 | 0.43 | 81 | 55 | 82 | 59 | 5.652 | 38 |
| IMC30 | 0.016 | 0.270 | 7,478.491 | 8.908 | 8.185 | 8.419 | 0.53 | 0.37 | 93 | 68 | 82 | 59 | 7.202 | 0 |
| IMC30 | 0.018 | 0.290 | 7,683.885 | 11.419 | 17.201 | 17.923 | 0.49 | 0.52 | 96 | 95 | 50 | 85 | 7.396 | 0 |
| IMC30 | 0.042 | 0.342 | 11,756.315 | 5.845 | 13.023 | 34.690 | 0.49 | 0.49 | 96 | 86 | 73 | 67 | 3.408 | 100 |
| IMC30 | 0.049 | 0.357 | 11,967.707 | 5.838 | 3.082 | 8.058 | 0.52 | 0.39 | 63 | 36 | 64 | 74 | 1.041 | 87 |
| CM10 | 0.003 | 0.228 | 10,867.511 | 4.409 | 6.917 | 6.609 | 0.43 | 0.30 | 68 | 43 | 61 | 89 | 3.041 | 76 |
| CM10 | 0.017 | 0.690 | 2,445.428 | 1.569 | 38.118 | 47.170 | 2.79 | 2.57 | 68 | 91 | 74 | 68 | 15.310 | 100 |
| CM10 | 0.018 | 0.301 | 12,726.534 | 4.194 | 1.392 | 1.669 | 0.40 | 0.42 | 47 | 9 | 74 | 74 | 0.987 | 73 |
| CM10 | 0.031 | 0.690 | 2,583.045 | 0.712 | 6.470 | 7.567 | 1.93 | 2.12 | 21 | 43 | 83 | 53 | 2.393 | 79 |
Data collection
Mass spectra data were collected in the m/z range of
1,000 to 25,000 for the 49 strength-measurement-based and 42
power-measurement- based patient urine samples using the IMAC30
(Cu2+-complexed) chip-type and the CM10 chip-type respectively. A
total of 99 (IMAC30) and 106 (CM10) cluster peaks across the entire
datasets were identified. Fifteen of these peak clusters in the
IMAC30, and 6 in the CM10 datasets had P-values <0.05. Analysis
using peak clustering and group distribution demonstrated that both
control and dynapenia groups shared a general overlap in PCA for
both chip-types but were distinct enough to allow a degree of
separation in heat-map plotting using Pearsons correlation.
Decision-tree analysis
Decision-tree modelling using the BPS of peak
clusters of 15 random samples from each cohort was validated by the
remainder of the entire cohort (12 control and 7 dynapenic samples
for strength, and 4 control and 8 dynapenic samples for power).
Decision tree models are shown in Fig. 1A
and E. The IMAC30 chipset-based model (Fig. 1A) showed a sensitivity of 57% and a
specificity of 58% with an overall correctness of 58% for the
validation data-set. Application of the derived model to the entire
cohort showed a sensitivity of 86%, specificity of 81% and an
overall correctness of 84%. Application of the CM10 chipset-based
model (Fig. 1E) to the validation
dataset gave a sensitivity of 88%, specificity of 50% and an
overall correctness of 75%. For the entire cohort, the values are
96% sensitivity, 89% specificity and 93% overall correctness.
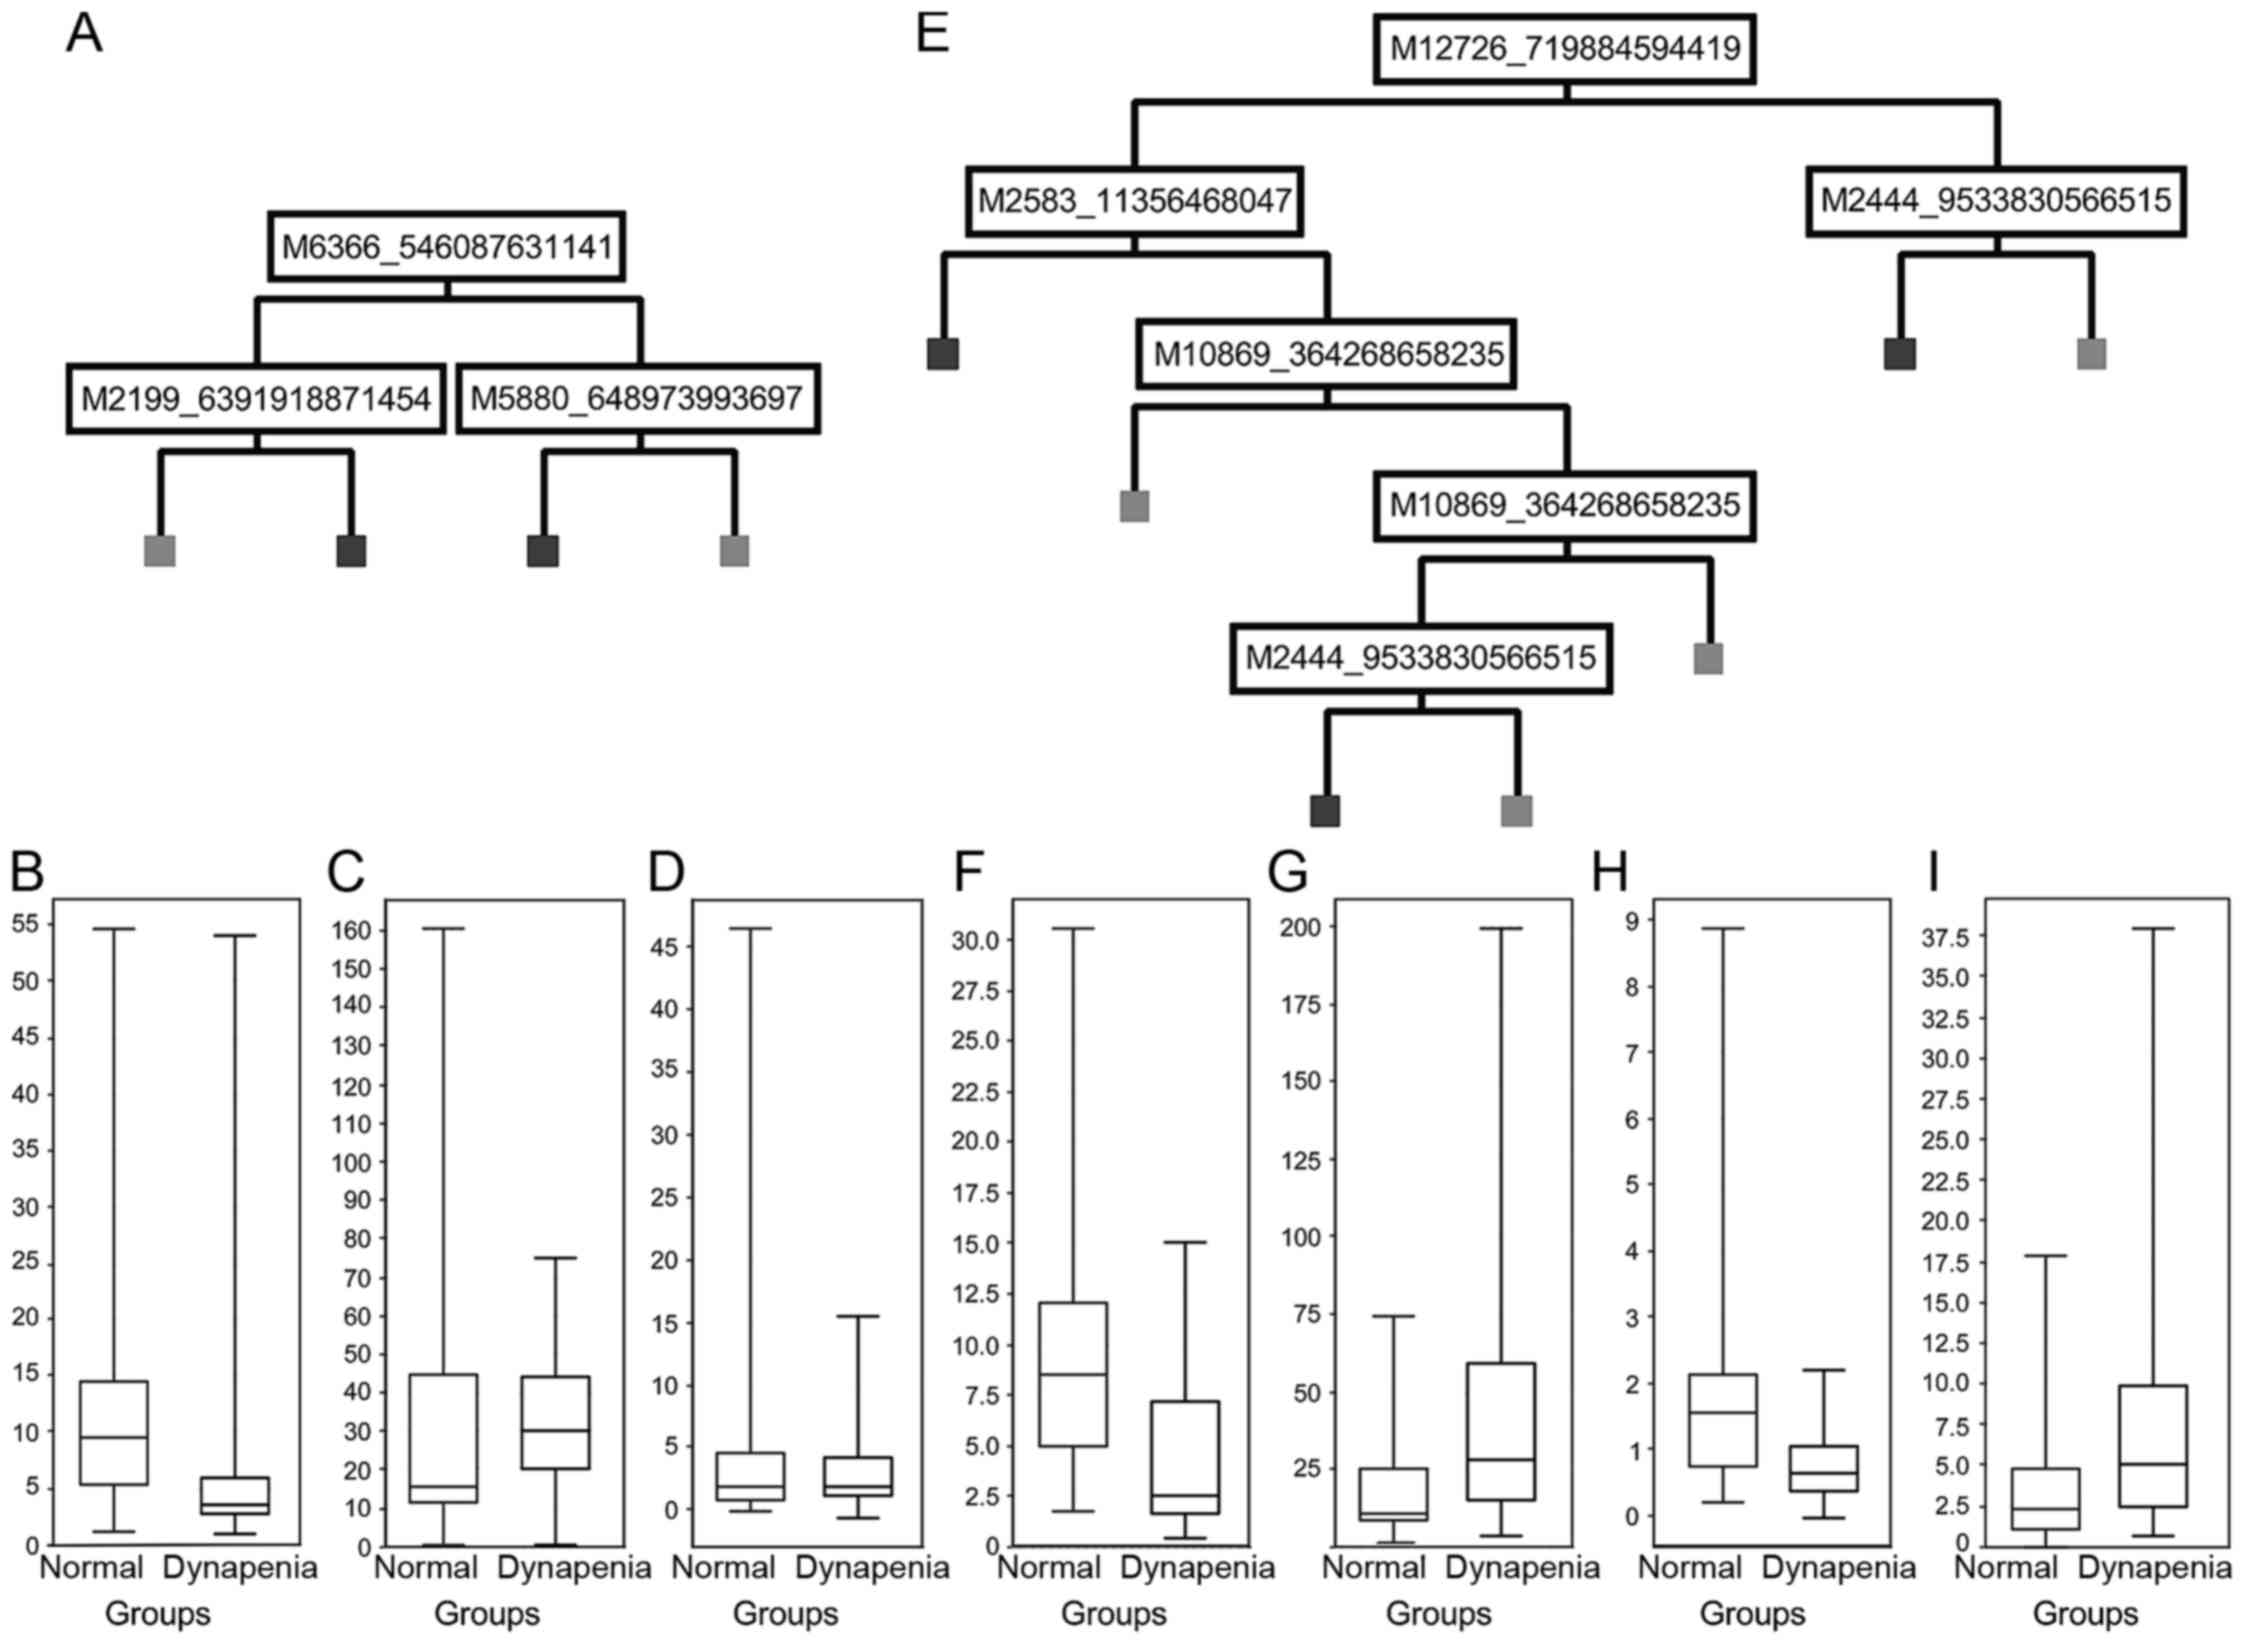 | Figure 1.Decision tree analysis. Cluster peaks
involved in the tree-analysis model using (A) the IMAC30 chip-type
or (E) the CM10 chip-type stratifying dynapenia (on the right) and
control (on the left) were plotted according to their normalised
intensity values (B, C, D, F, G, H and I, y-axis) for peak clusters
of (B) m/z 6,366, (C) m/z 2,199, (D) m/z 5,880, (F) m/z 10,869, (G)
m/z 2,445, (H) m/z 12,726, and (I) m/z 2,583. |
Potential biomarkers
Statistical analysis of the various m/z cluster
peaks involved in the models and potential marker peaks showing low
P-values are shown in Table II. We
could identify 8 peak clusters in the IMAC30-based dataset which
had either high model score values, or showed P-values <0.05, of
which 6 were downregulated and two unchanged in dynapenia (e.g.,
m/z 6,366 in Fig. 1B; m/z 2,199 in
Fig. 1C; and m/z 5880 in Fig. 1D). The CM10-based chipset showed four
peak clusters of interest, of which two were upregulated, and two
downregulated in dynapenia (e.g., m/z 10,869 in Fig. 1F; m/z 2,445 in Fig. 1G; m/z 12,726 in Fig. 1H; and m/z 2,583 in Fig. 1I).
| Table II.List of potential biomarkers
identified. |
Table II.
List of potential biomarkers
identified.
| m/z peak | Basis | Regulation | Protein ID | Protein name | Mass (Da) | Mascot score | Average number of
peptides | Average emPAI | Percentage of
sequence coverage | Expected percentage
of sequence coverage | Pattern
matching | Mascot-SELDI matrix
matching scores |
|---|
| 6,366 | Strength, | Down | ACTA_HUMAN | Actin, aortic
smooth muscle | 42,009 | 97 | 8 | 0.27 | 11.2 | 15.2 | A | 50//100 |
|
| IMAC30 |
| G3P_HUMAN | GAPDH | 36,053 | 66 |
4.6 | 0.16 | 10.8 | 17.7 | A | 50//100 |
|
|
|
| HORN_HUMAN | Hornerin | 282,390 | 66 | 11.3 | 0.04 | 4.4 | 2.3 | A | 50//100 |
| 6,461 | Strength, | Down | ALBU_HUMAN | Serum albumin
precursor | 69,367 | 190 | 18.1 | 0.4 | 12.7 | 9.3 | A | 71//66 |
|
| IMAC30 |
|
|
|
|
|
|
|
|
|
|
|
| 7,474 | Strength, | Down | G3P_HUMAN | GAPDH | 36,053 | 66 |
4.6 | 0.16 | 10.8 | 20.7 | A | 50//100 |
|
| IMAC30 |
| MASP2_HUMAN | Mannan-binding
lectin | 75,702 | 65 |
9.3 | 0.13 | 6.3 | 9.9 | A | 50//100 |
|
|
|
|
| serine protease 2
precursor |
|
|
|
|
|
|
|
|
|
|
|
| MMRN2_HUMAN | Multimerin-2
precursor | 104,409 | 32 |
3.7 | 0.04 | 4.2 | 7.2 | A | 50//100 |
|
|
|
| MTPN_HUMAN | Myotrophin | 12,895 | 64 |
5.5 | 0.5 | 26.8 | 58.0 | A | 50//100 |
|
|
|
| PEBP1_HUMAN |
Phosphatidylethanolamine- | 21,057 | 109 |
3.5 | 0.41 | 20.9 | 35.5 | A | 50//100 |
|
|
|
|
| binding protein
1 |
|
|
|
|
|
|
|
|
| 7,679 | Strength, | Down | HBB_HUMAN | Hemoglobin subunit
β | 15,998 | 108 |
5.3 | 0.91 | 32.3 | 48.0 | A | 66//100 |
|
| IMAC30 |
|
|
|
|
|
|
|
|
|
|
|
| 11,756 | Strength, | Down | ALBU_HUMAN | Serum albumin
precursor | 69,367 | 190 | 18.1 | 0.4 | 12.7 | 17.0 | A | 66//100 |
|
| IMAC30 |
| GFAP_HUMAN | Glial fibrillary
acidic protein | 49,937 | 61 | 4 | 0.07 | 11.2 | 23.5 | A | 66//100 |
| 11,966 | Strength, | Down | G3P_HUMAN | GAPDH | 36,053 | 66 |
4.6 | 0.16 | 10.8 | 33.2 | A | 60//100 |
|
| IMAC30 |
|
|
|
|
|
|
|
|
|
|
|
| 10,869 | Power, | Down | ANXA1_HUMAN | Annexin A1 | 38,714 | 126 |
6.5 | 0.3 | 16.3 | 28.1 | A, M | 100//100 |
|
| CM10 |
| CAP7_HUMAN | Azurocidin
precursor | 27,342 | 43 |
2.7 | 0.14 | 10 | 39.8 | A, M | 100//100 |
|
|
|
| CEL_HUMAN | Bile
salt-activated | 79,322 | 37 |
3.5 | 0.08 | 3.4 | 13.7 | A | 100//100 |
|
|
|
|
| lipase
precursor |
|
|
|
|
|
|
|
|
|
|
|
| COFA1_HUMAN | Collagen
α-1(XV) | 141,720 | 34 |
7.5 | 0.04 | 4.7 | 7.7 | A | 100//100 |
|
|
|
|
| chain
precursor |
|
|
|
|
|
|
|
|
|
|
|
| HV303_HUMAN | Ig heavy chain
V–III | 12,582 | 45 |
3.7 | 0.31 | 9.4 | 86.4 | A, M | 100//100 |
|
|
|
|
| region VH26
precursor |
|
|
|
|
|
|
|
|
|
|
|
| HV307_HUMAN | Ig heavy chain
V–III | 13,668 | 45 |
3.8 | 0.29 | 9.2 | 79.5 | A, M | 100//100 |
|
|
|
|
| region CAM |
|
|
|
|
|
|
|
|
| 2,445 | Power, | Up | MASP2_HUMAN | Mannan-binding
lectin | 75,702 | 65 |
9.3 | 0.13 | 6.3 | 3.2 | A | 100//100 |
|
| CM10 |
|
| serine protease 2
precursor |
|
|
|
| PGBM_HUMAN | Basement
membrane-specific | 468,830 | 198 | 16.8 | 0.05 | 3.2 | 0.5 | A | 100//100 |
|
|
|
|
| heparan sulfate
proteoglycan |
|
|
|
|
|
|
|
|
|
|
|
|
| core protein
precursor |
|
|
|
|
|
|
|
|
| 2,583 | Power, | Up | CATB_HUMAN | Cathepsin B
precursor | 38,791 | 44 | 3.7 | 0.1 |
6.1 |
6.7 | A | 66//100 |
|
| CM10 |
| KV113_HUMAN | Ig κ chain V-I
region Lay | 11,834 | 46 | 2.8 | 0.33 | 17.6 | 21.8 | A | 66//100 |
|
|
|
| KV305_HUMAN | Ig κ chain V–III
region WOL | 11,746 | 117 | 6.8 | 1.58 | 40.4 | 22.0 | A | 66//100 |
|
|
|
| KV310_HUMAN | Ig κ chain V–III
region VH | 12,757 | 47 | 3.2 | 0.51 | 18.9 | 20.2 | A | 66//100 |
Six of these clustered peaks, which showed
statistical significance from the IMAC30 dataset, and four from the
CM10 chipset were further investigated by enrichment of urinary
proteins from 10 (IMAC30) and 17 (CM10) samples each. Gel bands
were excised after electrophoresis and LC-MS/MS downstream
processing, followed by Mascot searching and identification of
proteins contained within the samples, as described earlier
(10). All the lead m/z clusters had
P-values <0.05.
The downregulated m/z 10,869 peak cluster observed
in the CM10 dataset was enriched in four positive samples and four
negative samples, which did not contain this peak based on SELDI-MS
and served as controls. This peak cluster is also the most
significant based on ROC area values, which signifies a combination
of false-positive and false-negative discovery rates. Mascot
searching matched this peak to either Annexin A1, azurocidin or IgG
(Table II). All other potential
markers were identified by Mascot pattern matching. This was
performed using a dataset of 600 proteins identified for the IMAC
chip-type from 10 urine samples, identical to samples used in this
study, and 950 proteins for CM10 chips from 17 urine samples, also
identical to samples used in this study, in the region of 2–10 kDa.
Each individual identification was based on Mascot scores >16
and consisting of ≥2 peptides each (17). The scores were calculated as a
percentage of the expected pattern in the Mascot-identified protein
list compared to the measured pattern of peaks found by SELDI-TOF
above the baseline (sensitivity), thereby setting all estimated
peaks as null values, which were used to calculate the specificity.
Table II lists all molecules
identified using this approach.
We found several fragments of
glyceraldehyde-3-phosphate dehydrogenase (GAPDH) (m/z 6,366, 7,474
and 11,966), all of which were downregulated in dynapenia using
strength as the stratifier. Other potential components of the
downregulated m/z 6,366 cluster are fragments of aortic smooth
muscle actin (ACTA2) and hornerin. Both the downregulated m/z 6,461
and 11,756 clusters match the expression pattern of albumin.
Mannan-binding lectin serine protease 2 precursor (MASP2) is
associated both with the downregulated m/z 7,474 and upregulated
m/z 2,445. Other potential candidates for the downregulated m/z
7,474 peak cluster are Multimerin-2 (MMRN2), also known as EMILIN-3
or elastin microfibril interface located protein 3, myotrophin
(MTPN) and phosphatidylethanolamine-binding protein 1 (PEBP1).
Hemoglobin subunit β was identified as the constituent of the m/z
7,679 peak cluster. Glial fibrillary acidic protein (GFAP) was
matched to the m/z 11,756 peak cluster. The m/z 10,869 cluster,
observed in the CM10 chip based dataset which used power
measurements for stratification, also matched the observed
expression patterns for Bile salt-activated lipase precursor (CEL)
and collagen α-1 (XV) chain precursor (COL15A1). The m/z 2,445
cluster matches basement membrane-specific heparan sulfate
proteoglycan core protein precursor (HSPG2), and the m/z 2,583 peak
cluster matched the expression profiles of cathepsin B and several
regions of the immunoglobulin κ light chain. The m/z 12,726 peak
cluster found in the CM10-based screen could not be identified
through pattern matching as its molecular mass is too big compared
to the gel band-cutting range.
Additionally, we tested whether any of our proposed
m/z peaks correlated with age or gender and found that none of the
peak clusters showed any significant age- or sex-related expression
differences. We also observed that the m/z distribution of
individual peaks within a peak cluster shows the expected pattern
of a heterogeneous population of urinary molecular species.
However, this does not exclude that some peak clusters may consist
of more than one unique protein or peptide. The high degree of
overlap of m/z peaks in some of the potential markers in due to the
way the DataManager software interprets ‘missing’ peaks (e.g.,
non-existent or below the S/N ratio) and attempts to estimate a
value centred at the m/z cluster value.
Discussion
In the present study, approximately 45% of patients
with uGI cancer were classified as being dynapenic based on
strength and power measurements. One potential limitation of the
study is that there are currently no defined cut points for
dynapenia and we therefore stratified patients based on the Allied
Dunbar national fitness survey using a strength and/or power
measurement below the 5th percentile for the population matched for
age and sex. The populations described in other similar studies of
skeletal muscle attenuation in healthy individuals are also small
however, and different (although similar) values could be obtained
depending on the series chosen (18).
In this cohort SELDI-TOF-MS could analyse and screen
urine from uGI cancer patients for prospective dynapenia biomarkers
to establish a proteomic fingerprint pattern which potentially can
be used in clinical diagnostics. The main drawback of SELDI-TOF-MS
is the comparatively medium resolution of the spectra obtained,
however this is adequate to resolve peaks in the 1,000 to 25,000 Da
range from spectra with less than 500 peaks. We found that both
IMAC30 and CM10 are useful chip-types for the analysis of human
urine (10), and we could generate
models based on the full analysis of 51 physical-activity
measurement-based dynapenic and non-dynapenic samples from cancer
patients. The samples were measured on CM10 and IMAC30 chips, and
using the tree-analysis method, we established statistical models
with overall sensitivities of 86% (IMAC30) and 96% (CM10) and
specificities of 81% (IMAC30) and 89% (CM10) across the entire
datasets. Using expression pattern matching, we could assign
several proteins identified in urine to our proposed
biomarkers.
Cathepsin B and IgGs are upregulated in uGI cancer,
and therefore the presence of both molecules at m/z 2,583 in our
panel of potential candidates to identify muscle-loss markers is
not surprising (19). However, those
molecules are very unlikely to be viable potential biomarkers in
dynapenia. Nevertheless, it cannot be excluded that modulated
levels of specific immunoglobulins are associated with dynapenia
per se.
Annexin A1 was reported to have an anti-inflammatory
role and is downregulated in nasal epithelial cells from cystic
fibrosis patients (20), but was
shown to be upregulated in muscular dystrophy (21). Azurocidin was described as a
neutrophil-derived protein, and is mainly expressed in
proliferating smooth muscle cells. It was identified for its
antimicrobial activity and was reported to show strong
immunoregulatory effects on host cells (22). The downregulation of fragments of IgG
heavy chain, whose expression pattern matches the expected pattern
from the SELDI-MS scans can be an artefact or may be due to an as
of yet unidentified mechanism. GAPDH has been shown to interact
with several muscular gene products such as ataxin-1 and androgen
receptor (23), and its role in
glycolysis is well documented. A downregulation of GAPDH could
therefore be an indication of starvation.
We also associated actin (ACTA2) to one of our
proposed m/z cluster peaks. This molecule is expressed in muscle
tissues and is a major constituent of the contractile apparatus.
Mutations of this gene can cause coronary artery disease and stroke
(24). The downregulated expression
of this molecule associated with dynapenia could be due to a
failing of regeneration of muscle cells. The same m/z peak cluster
may also contain fragments of hornerin, which is described in the
literature as a component of epithelial cells, and is downregulated
in skin-associated diseases such as psoriasis (25). This molecule is potentially a
contaminant in our dataset.
The downregulated m/z 6,461 and 11,756 clusters
match the expression pattern of albumin. However, albumin itself is
a common molecule found in all samples in various levels, and
specific breakdown fragments can be detected in many samples. The
downregulation of albumin associated with muscle loss was also
observed in a sarcopenia stratification model (unpublished
results), and its association with muscle dysfunction remains
unclear.
Various fragments of MASP2 were found to be
associated both with a downregulation of m/z 7,474 and an
upregulation of m/z 2,445. However, the upregulation of this
molecule appears to be more significant based on the
Mascot-SELDI-matrix matching scores. Levels of MASP2 were reported
to be elevated in neonatal infections (26), and mouse models lacking this molecule
showed protection of myocardial and gastrointestinal
ischemia/reperfusion injury (27).
The possible role of this molecule in dynapenia remains
unclear.
MMRN2 is a secreted protein described to be
associated with tumour progression (28) and part of the autophagy system
(29). It is a potential candidate
for the downregulated m/z 7,474 peak cluster, however, its
involvement in muscle loss is unknown, and due to the potential
involvement with cancer is not a suitable dynapenia marker.
MTPN was shown to have a strong growth promoting
activity on cultured primary skeletal muscle cells (30). The observed m/z of 7,474 would also
fit the published molecular weight of the mature and deglycosylated
form of 7 kDa. Elevated plasma levels of MTPN have been described
in the literature to be associated with heart failure (31). However, our observed downregulation
would fit with a potential hypothesis that one of the effects of
dynapenia is a reduced re-growth of muscle cells.
PEBP1 is known to be downregulated in various
cancers, such as prostate, breast, gastrointestinal stromal
tumours, melanoma, and epithelial ovarian cancer (31). This fits our observed downregulation
of this marker, and is therefore not considered to be of relevance
in dynapenia. Hemoglobin subunit β was identified as the
constituent of the m/z 7,679 peak cluster, which is downregulated
in dynapenia. This might be a potential misidentification, or might
be indicative of kidney dysfunction. GFAP was shown to be a marker
for axonal damage in chronic neuropathies (32), and has been reported to be associated
with trauma and was found frequently in various gliomas (33). Its modulation is therefore potentially
due to cancer and cancer conditions rather than dynapenia. Bile
salt-activated lipase precursor (CEL) is mainly expressed and
secreted in the pancreas and mammary glands, and has a role in
vitamin and fat absorption. Defects in this gene cause diabetes and
pancreatic exocrine dysfunction (34). Its role in muscle ablation and
degeneration is not apparent.
COL15A1, which also matches the expression pattern
of the downregulated peak cluster at m/z 10,869, is mainly
expressed in muscle cells, and in moderate levels in the kidney and
pancreas (35), and is part of the
basement membrane zone. Mouse studies have shown that a lack of
this molecule does not cause developmental defects, however,
progressive histological changes characteristic for muscular
diseases were visible a few months after birth, and they were more
vulnerable than controls to exercise-induced muscle injury
(36). COL15A1 therefore appears to
function as a structural component needed to stabilize skeletal
muscle cells and microvessels, which could explain our observed
apparent downregulation of this protein in dynapenia.
Basement membrane-specific HSPG2, also known as
Perlecan, which matched the upregulated m/z 2,445 cluster, is a
secreted inter-cellular protein, which serves as an attachment site
for cells, and its roles are in vascularisation, development and
vascular response to injury (37).
Deficiencies in this molecule have been shown to cause hypertrophy.
It also appears to be important in maintaining fast muscle mass,
fiber composition and in regulating myostatin signaling (38). The observed upregulation of a fragment
of this molecule is likely due to atrophy and might be directly
linked to dynapenia.
In conclusion, stratification of our cancer cohort
based on power and strength measurements using dynapenia as a
decider yielded a set of potential urinary biomarkers by SELDI-TOF
MS. The most likely lead candidates in this study are Annexin A1
and COL15A1 chain, which were downregulated, in leg-power
measurement-based dynapenia. The dynapenia model based on
leg-strength measurement includes downregulated MTPN as well as
upregulated Perlecan as the most promising potential biomarker
candidates. Further studies including an extended cohort will help
determine the validity of our findings in discriminating between
strength and power, and specific assays monitoring expression
levels of our proposed biomarkers will help to translate our
findings into the clinical setting.
Acknowledgements
We thank N.A. Stephens for patient recruitment.
Glossary
Abbreviations
Abbreviations:
|
BPS
|
Biomarker Pattern software
|
|
emPAI
|
exponentially modified protein
abundance index
|
|
uGI
|
upper gastrointestinal
|
|
OGJ
|
oesophagogastric junction
|
|
PCDMS
|
ProteinChip Data Manager software
|
|
SPA
|
sinapinic acid
|
References
|
1
|
Fearon K, Strasser F, Anker SD, Bosaeus I,
Bruera E, Fainsinger RL, Jatoi A, Loprinzi C, MacDonald N,
Mantovani G, et al: Definition and classification of cancer
cachexia: An international consensus. Lancet Oncol. 12:489–495.
2011. View Article : Google Scholar : PubMed/NCBI
|
|
2
|
Fearon KC: Cancer cachexia and fat-muscle
physiology. N Engl J Med. 365:565–567. 2011. View Article : Google Scholar : PubMed/NCBI
|
|
3
|
Fearon KC, Glass DJ and Guttridge DC:
Cancer cachexia: Mediators, signaling, and metabolic pathways. Cell
Metab. 16:153–166. 2012. View Article : Google Scholar : PubMed/NCBI
|
|
4
|
Skipworth RJ, Stewart GD, Dejong CH,
Preston T and Fearon KC: Pathophysiology of cancer cachexia: Much
more than host-tumour interaction? Clin Nutr. 26:667–676. 2007.
View Article : Google Scholar : PubMed/NCBI
|
|
5
|
Tan BH, Birdsell LA, Martin L, Baracos VE
and Fearon KC: Sarcopenia in an overweight or obese patient is an
adverse prognostic factor in pancreatic cancer. Clin Cancer Res.
15:6973–6979. 2009. View Article : Google Scholar : PubMed/NCBI
|
|
6
|
Clark BC and Manini TM: What is dynapenia?
Nutrition. 28:495–503. 2012. View Article : Google Scholar : PubMed/NCBI
|
|
7
|
Kushnir MM, Mrozinski P, Rockwood AL and
Crockett DK: A depletion strategy for improved detection of human
proteins from urine. J Biomol Tech. 20:101–108. 2009.PubMed/NCBI
|
|
8
|
Adachi J, Kumar C, Zhang Y, Olsen JV and
Mann M: The human urinary proteome contains more than 1500
proteins, including a large proportion of membrane proteins. Genome
Biol. 7:R802006. View Article : Google Scholar : PubMed/NCBI
|
|
9
|
Kalantari S, Jafari A, Moradpoor R,
Ghasemi E and Khalkhal E: Human Urine Proteomics: Analytical
techniques and clinical applications in renal diseases. Int J
Proteomics. 782798:2015.doi: 10.1155/2015/782798.
|
|
10
|
Caffrey RE: A review of experimental
design best practices for proteomics based biomarker discovery:
Focus on SELDI-TOF. Methods Mol Biol. 641:167–183. 2010. View Article : Google Scholar : PubMed/NCBI
|
|
11
|
Wright GL Jr, Cazares LH, Leung SM, Nasim
S, Adam BL, Yip TT, Schellhammer PF, Gong L and Vlahou A:
Proteinchip(R) surface enhanced laser desorption/ionization (SELDI)
mass spectrometry: A novel protein biochip technology for detection
of prostate cancer biomarkers in complex protein mixtures. Prostate
Cancer Prostatic Dis. 2:264–276. 1999. View Article : Google Scholar : PubMed/NCBI
|
|
12
|
Husi H, Stephens N, Cronshaw A, MacDonald
A, Gallagher I, Greig C, Fearon KC and Ross JA: Proteomic analysis
of urinary upper gastrointestinal cancer markers. Proteomics Clin
Appl. 5:289–299. 2011. View Article : Google Scholar : PubMed/NCBI
|
|
13
|
Harridge SD, Kryger A and Stensgaard A:
Knee extensor strength, activation, and size in very elderly people
following strength training. Muscle Nerve. 22:831–839. 1999.
View Article : Google Scholar : PubMed/NCBI
|
|
14
|
Todd G, Gorman RB and Gandevia SC:
Measurement and reproducibility of strength and voluntary
activation of lower-limb muscles. Muscle Nerve. 29:834–842. 2004.
View Article : Google Scholar : PubMed/NCBI
|
|
15
|
Arden NK and Spector TD: Genetic
influences on muscle strength, lean body mass, and bone mineral
density: A twin study. J Bone Miner Res. 12:2076–2081. 1997.
View Article : Google Scholar : PubMed/NCBI
|
|
16
|
Activity and Health Research: Allied
Dunbar National Fitness Survey: Main FindingsSummary. Health
Education Authority; London: 1992
|
|
17
|
Husi H, Skipworth RJE, Cronshaw A, Fearon
KCH and Ross JA: Proteomic identification of potential cancer
markers in human urine using subtractive analysis. Int J Oncol.
48:1921–1932. 2016. View Article : Google Scholar : PubMed/NCBI
|
|
18
|
Manini T and Clark B: Dynapenia and aging:
An update. J Gerontol A Biol Sci Med Sci. 67:28–40. 2012.
View Article : Google Scholar : PubMed/NCBI
|
|
19
|
O'Leary MF, Vainshtein A, Carter HN, Zhang
Y and Hood DA: Denervation-induced mitochondrial dysfunction and
autophagy in skeletal muscle of apoptosis-deficient animals. Am J
Physiol Cell Physiol. 303:C447–C454. 2012. View Article : Google Scholar : PubMed/NCBI
|
|
20
|
Bensalem N, Ventura AP, Vallée B, Lipecka
J, Tondelier D, Davezac N, Dos Santos A, Perretti M, Fajac A,
Sermet-Gaudelus I, et al: Down-regulation of the anti-inflammatory
protein annexin A1 in cystic fibrosis knock-out mice and patients.
Mol Cell Proteomics. 4:1591–1601. 2005. View Article : Google Scholar : PubMed/NCBI
|
|
21
|
Waddell LB, Lemckert FA, Zheng XF, Tran J,
Evesson FJ, Hawkes JM, Lek A, Street NE, Lin P, Clarke NF, et al:
Dysferlin, annexin A1, and mitsugumin 53 are upregulated in
muscular dystrophy and localize to longitudinal tubules of the
T-system with stretch. J Neuropathol Exp Neurol. 70:302–313. 2011.
View Article : Google Scholar : PubMed/NCBI
|
|
22
|
Gonzalez ML, Ruan X, Kumar P, Grammas P
and Pereira HA: Functional modulation of smooth muscle cells by the
inflammatory mediator CAP37. Microvasc Res. 67:168–181. 2004.
View Article : Google Scholar : PubMed/NCBI
|
|
23
|
Koshy B, Matilla T, Burright EN, Merry DE,
Fischbeck KH, Orr HT and Zoghbi HY: Spinocerebellar ataxia type-1
and spinobulbar muscular atrophy gene products interact with
glyceraldehyde-3-phosphate dehydrogenase. Hum Mol Genet.
5:1311–1318. 1996. View Article : Google Scholar : PubMed/NCBI
|
|
24
|
Guo DC, Papke CL, Tran-Fadulu V, Regalado
ES, Avidan N, Johnson RJ, Kim DH, Pannu H, Willing MC, Sparks E, et
al: Mutations in smooth muscle alpha-actin (ACTA2) cause coronary
artery disease, stroke, and Moyamoya disease, along with thoracic
aortic disease. Am J Hum Genet. 84:617–627. 2009. View Article : Google Scholar : PubMed/NCBI
|
|
25
|
Wu Z, Meyer-Hoffert U, Reithmayer K, Paus
R, Hansmann B, He Y, Bartels J, Gläser R, Harder J and Schröder JM:
Highly complex peptide aggregates of the S100 fused-type protein
hornerin are present in human skin. J Invest Dermatol.
129:1446–1458. 2009. View Article : Google Scholar : PubMed/NCBI
|
|
26
|
St Swierzko A, Cedzynski M,
Domzalska-Popadiuk I, MacDonald SL, Borkowska-Klos M, Atkinson AP,
Szala A, Jopek A, Jensenius JC, Kawakami M, et al: Mannan-binding
lectin-associated serine protease-2 (MASP-2) in a large cohort of
neonates and its clinical associations. Mol Immunol. 46:1696–1701.
2009. View Article : Google Scholar : PubMed/NCBI
|
|
27
|
Schwaeble WJ, Lynch NJ, Clark JE, Marber
M, Samani NJ, Ali YM, Dudler T, Parent B, Lhotta K, Wallis R, et
al: Targeting of mannan-binding lectin-associated serine protease-2
confers protection from myocardial and gastrointestinal
ischemia/reperfusion injury. Proc Natl Acad Sci USA. 108:7523–7528.
2011. View Article : Google Scholar : PubMed/NCBI
|
|
28
|
Soltermann A, Ossola R, Kilgus-Hawelski S,
von Eckardstein A, Suter T, Aebersold R and Moch H: N-glycoprotein
profiling of lung adenocarcinoma pleural effusions by shotgun
proteomics. Cancer. 114:124–133. 2008. View Article : Google Scholar : PubMed/NCBI
|
|
29
|
Behrends C, Sowa ME, Gygi SP and Harper
JW: Network organization of the human autophagy system. Nature.
466:68–76. 2010. View Article : Google Scholar : PubMed/NCBI
|
|
30
|
Hayashi T, Takeshita K, Tsuchida N, Kitano
K, Kawabata S, Iwanaga S and Ito T: Purification of a novel muscle
cell growth factor S-myotrophin from porcine skeletal muscle. Int J
Biochem Cell Biol. 30:897–908. 1998. View Article : Google Scholar : PubMed/NCBI
|
|
31
|
Wang X, Wang S, Tang X, Zhang A, Grabinski
T, Guo Z, Hudson E, Berghuis B, Webb C, Zhao P and Cao B:
Development and evaluation of monoclonal antibodies against
phosphatidylethanolamine binding protein 1 in pancreatic cancer
patients. J Immunol Methods. 362:151–160. 2010. View Article : Google Scholar : PubMed/NCBI
|
|
32
|
Notturno F, Capasso M, DeLauretis A, Carpo
M and Uncini A: Glial fibrillary acidic protein as a marker of
axonal damage in chronic neuropathies. Muscle Nerve. 40:50–54.
2009. View Article : Google Scholar : PubMed/NCBI
|
|
33
|
Husain H, Savage W, Grossman SA, Ye X,
Burger PC, Everett A, Bettegowda C, Diaz LA Jr, Blair C, Romans KE
and Holdhoff M: Pre- and post-operative plasma glial fibrillary
acidic protein levels in patients with newly diagnosed gliomas. J
Neurooncol. 109:123–127. 2012. View Article : Google Scholar : PubMed/NCBI
|
|
34
|
Hui DY, Hayakawa K and Oizumi J:
Lipoamidase activity in normal and mutagenized pancreatic
cholesterol esterase (bile salt-stimulated lipase). Biochem J.
291:65–69. 1993. View Article : Google Scholar : PubMed/NCBI
|
|
35
|
Kivirikko S, Saarela J, Myers JC,
Autio-Harmainen H and Pihlajaniemi T: Distribution of type XV
collagen transcripts in human tissue and their production by muscle
cells and fibroblasts. Am J Pathol. 147:1500–1509. 1995.PubMed/NCBI
|
|
36
|
Eklund L, Piuhola J, Komulainen J,
Sormunen R, Ongvarrasopone C, Fássler R, Muona A, Ilves M, Ruskoaho
H, Takala TE and Pihlajaniemi T: Lack of type XV collagen causes a
skeletal myopathy and cardiovascular defects in mice. Proc Natl
Acad Sci USA. 98:1194–1199. 2001. View Article : Google Scholar : PubMed/NCBI
|
|
37
|
Mongiat M, Fu J, Oldershaw R, Greenhalgh
R, Gown AM and Iozzo RV: Perlecan protein core interacts with
extracellular matrix protein 1 (ECM1), a glycoprotein involved in
bone formation and angiogenesis. J Biol Chem. 278:17491–17499.
2003. View Article : Google Scholar : PubMed/NCBI
|
|
38
|
Xu Z, Ichikawa N, Kosaki K, Yamada Y,
Sasaki T, Sakai LY, Kurosawa H, Hattori N and Arikawa-Hirasawa E:
Perlecan deficiency causes muscle hypertrophy, a decrease in
myostatin expression, and changes in muscle fiber composition.
Matrix Biol. 29:461–470. 2010. View Article : Google Scholar : PubMed/NCBI
|


