Introduction
Chronic hepatis B (CHB) remains the main cause of
liver cirrhosis and liver cellular carcinoma (1). The progress of liver fibrosis and
hepatic cellular carcinoma (HCC) is often unpredicted due to viral
and host factors (2). It has been
indicated that hepatic iron and steatosis may have a role in liver
fibrosis and carcinogenesis (3-5).
Iron overload is common in hemochromatosis, which is one of the
etiologies of cirrhosis, but it may also worsen liver injury in
other chronic liver diseases (3,4).
Certain studies suggested that elevated serum ferritin (FER) or
liver iron were associated with a diminished likelihood of response
to antiviral therapy (6-8).
A further study examined the association between hepatic iron grade
and HCC in patients with end-stage liver disease of diverse
etiologies, indicating that any iron overload was significantly
associated with HCC (3). However,
the prevalence and clinical significance of iron overload in CHB
have remained elusive. For liver steatosis, the prevalence of
non-alcoholic fatty liver disease (NAFLD) is currently increasing,
and so is the coexistence of NAFLD and hepatitis B virus (HBV)
infection (5). However, the
interplay between these two diseases remains unclear (9). Both may lead to liver injury and
augment the risk of liver cirrhosis and HCC. Conversely, NAFLD may
have a positive role in HBV antiviral therapy (10-13).
More information on the prevalence of NAFLD in CHB and its
relationship with the progress of the underlying disease is
needed.
Histopathological visualization of hepatocellular
fat droplets remains the gold standard for the assessment of liver
steatosis, as well as the liver iron concentration. However, it is
an invasive method that may potentially be associated with
significant complications, such as infection and bleeding (14). On the other hand, it also has
disadvantages including being semi-quantitative, prone to sampling
variability and observer-dependent (15). MRI is a non-invasive tool that can
measure liver iron and fat by R2* relaxometry and proton density
fat fraction (PDFF) (16). In the
present study, it was attempted to measure the content of liver
iron and fat noninvasively by MRI and then compare them with the
clinical characteristics, to predict the prevalence of iron
overload and NAFLD in CHB and the relationships between iron
overload, NAFLD, the severity of liver fibrosis and progression of
CHB.
Patients and methods
Study design and participants
the study protocol was approved by the Clinical
Research Ethics Committee of the Third Affiliated Hospital of Sun
Yat-Sen University [approval no. (2022)02-328-01]. The requirement
of written informed consent was waived. Patients with CHB were
retrospectively enrolled consecutively from August 2018 to August
2020. CHB was defined as positive hepatitis B surface antigen
(HBsAg) or HBV DNA for at least 6 months (17). The exclusion criteria are provided
in Appendix S1.
Data collection
Baseline demographic, clinical and laboratory
characteristics, along with MRI features, were collected. The
following data were included: Age, sex, clinical presentation and
blood biochemical indices. The fibrosis index based on four factors
(FIB-4), aspartate aminotransferase (AST) to platelet (PLT) ratio
index (APRI), albumin (ALB)-bilirubin score (ALBI), AST-alanine
aminotransferase (ALT) ratio (AAR) and gamma glutamyl
transpeptidase (GGT)-PLT ratio (GPR) were calculated (Table SI) (18-22).
MRI examination
MRI examination was performed at the same
hospitalization within 30 days. The details of the MRI scanning and
parameters are presented in Appendix
S2. The percentage of liver fat content was measured under the
fat fraction sequence estimated by MRI-PDFF, which does not exceed
5% in normal individuals (23). The
iron content was measured by R2* relaxation rate image sequence and
the liver iron content (LIC) was then measured according to Wood
formula [(Fe) mg/g=R2* x 0.0254 + 0.202] (24). The severity of iron overload was
rated as follows: No iron overload (<2 mg/g), insignificant (2-4
mg/g), mild (4-6 mg/g), moderate (6~8 mg/g), moderate-severe (8-16
mg/g) or severe (≥16 mg/g) (25).
Portal hypertension (PH) was defined as portal vein or splenic vein
dilation [portal vein diameter (PVD) >12 mm or splenic vein
diameter (SVD) >8 mm] (26).
Statistical analysis
Quantitative variables were presented as the mean ±
standard deviation or median (interquartile range) based on whether
the data followed a normal distribution. Categorical variables were
compared using the Chi-square or Fisher's exact test when
appropriate, and quantitative variables were compared using
Student's t-test or the Mann-Whitney U-test, as applicable.
Correlation analysis was performed with Pearson's correlation test.
Predictive factors of NAFLD and iron overload were evaluated using
the ‘enter’ multivariate binary logistic regression model. Receiver
operating characteristic (ROC) curve analysis was performed to
identify the discriminative capacity of PDFF and LIC levels in
predicting the degree of liver fibrosis, as well as FER levels in
predicting the degree of liver iron overload. P-values for ROC
curves were identified based on Wilcoxon's test and the Delong test
was used to compare the area under the receiver operating
characteristic curves (AUCs). A two-tailed P<0.05 was considered
to indicate statistical significance. All data were analyzed by
SPSS version 22.0 software (IBM Corp.) and R version 4.1.2 (R Core
Team).
Results
Patient characteristics
Within the enrolment period for the study, 378
patients met the criteria of inclusion. Of these, 38 patients were
excluded based on the exclusion criteria. As a result, 340 patients
were available for analysis. Table
I shows the characteristics of these patients. The mean age was
50.6±10.4 years (range, 18-77 years) with a male-to-female ratio of
6:1. The LIC had a median value of 1.68 mg/g, ranging from 0.79 to
9.90 mg/g and elevated LIC (LIC ≥2 mg/g) was seen in 122 patients
(35.9%), while the prevalence of insignificant, mild, moderate and
moderate-severe degree of iron overload was 28.2, 5.3, 1.8, 0.6%,
respectively. Regarding the liver fat content, the median value of
PDFF was 3.1%, ranging from 1.2 to 30%, while only 15.0% of
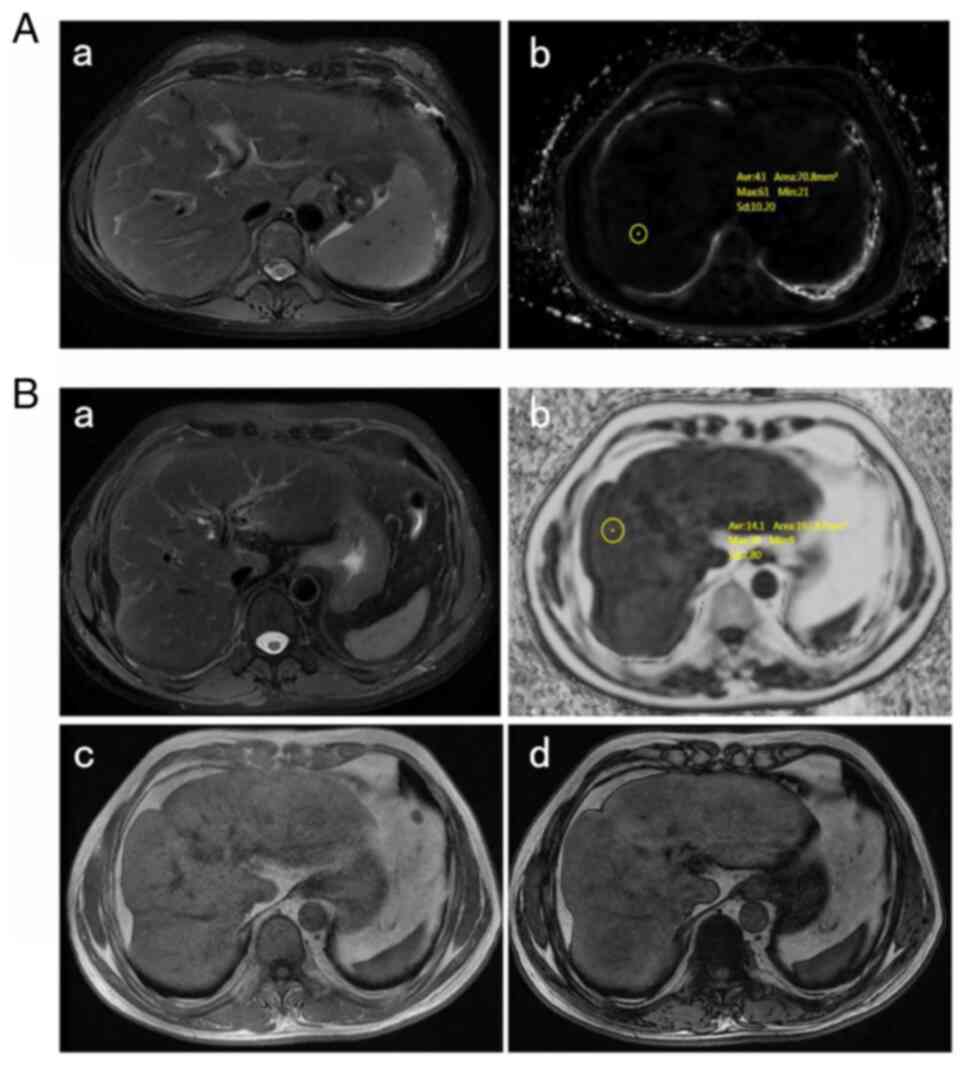
patients had liver steatosis (MRI-PDFF ≥5%). Representative MRI
images for liver iron and fat measurement are provided in Fig. 1.
 | Table IBaseline clinical and MRI
characteristics of the patients. |
Table I
Baseline clinical and MRI
characteristics of the patients.
|
Variablea | Value |
|---|
| Age, years | 50.6±10.4 |
| Males/females | 292/48 |
| LIC, mg/g | 1.68 (1.35,
2.41) |
| PDFF, % | 3.1(2.5, 3.9) |
| PVD, cm | 14.5±2.70 |
| SVD, cm | 9.57±2.59 |
| ALT, U/l | 34.5 (24.0,
59.0) |
| AST, U/l | 41.0 (27.0,
63.0) |
| GGT, U/l | 61.0 (32.5,
124.0) |
| ALP, U/l | 92.0 (72.0,
123.0) |
| PLT,
109/l | 92.0 (63.0,
143.0) |
| TB, µmol/l | 17.8 (10.9,
42.7) |
| ALB, g/l | 39.4±6.20 |
| INR | 1.44±0.46 |
| FER, ng/ml | 440.7 (160.5,
1446.0) |
| Cr, µmol/l | 75.2±21.9 |
| FIB-4 | 4.17 (2.24,
6.94) |
| APRI | 1.28 (0.67,
2.20) |
| ALBI | -2.44±0.70 |
| AAR | 1.27±0.63 |
| GPR | 0.76 (0.33,
1.39) |
Correlation between MRI features
After the intra-group consistency analysis and
inter-group consistency analysis, the intra-class correlation
values were 0.977 (95%CI 0.964-0.990) and 0.962 (95%CI
0.942-0.982), respectively. The correlation between PVD, SVD, LIC
and PDFF were explored. PVD and SVD had a moderate correlation
(r=0.686, P<0.001), while a slight negative correlation was
observed between LIC and SVD (r=-0.161, P=0.003) (Fig. S1). There were no linear
correlations between the LIC and PDFF, LIC and PVD, PVD and PDFF or
SVD and PDFF (r=0.016, P=0.773; r=-0.104, P=0.056; r=-0.082,
P=0.129; r=-0.084, P=0.124, respectively).
Correlation between MRI features and
serum parameters and indices
The correlation between MRI features and serum
indices was investigated using Pearson's correlation analysis. The
PDFF showed a positive association with PLT and ALB (r=0.240,
P<0.001; r=0.214, P<0.001. respectively), and a negative
association with FIB-4, APRI, ALBI, AAR and GPR score (r=-0.224,
P<0.001; r=-0.164, P=0.002; r=-0.245, P=0.002; r=-0.146 P=0.007;
r=-0.111, P=0.042, respectively), The LIC was positively associated
with AST, alkaline phosphatase, total bilirubin (TB), international
normalized ratio (INR), FIB-4, APRI and ALBI score (r=0.143,
P=0.008; r=0.143, P=0.019; r=0.248, P<0.001; r=0.315,
P<0.001; r=0.114, P=0.035; r=0.119, P=0.029; r=0.260,
P<0.001, respectively), and negatively associated with ALB
(r=-0.146, P=0.007). For the PVD, positive correlations were
indicated with FIB-4, APRI and GPR (r=0.184, P=0.001; r=0.132,
P=0.015; r=0.114, P=0.037, respectively) while it was negatively
associated with PLT (r=-0.290, P<0.001). For the SVD, a positive
correlation was only obtained with FIB-4 (r=0.178, P=0.001) while a
negative correlation with PLT, creatinine and FER (r=-0.325,
P<0.001; r=-0.148, P=0.009; r=-0.227, P=0.006, respectively) was
determined (Fig. S2).
Univariate and multivariate analysis
between MR features and serum indices
In the liver steatosis subgroup (PDFF ≥5%), sex,
PLT, ALB, proportion of PH, FIB-4, APRI, ALBI and GPR were
significantly different from those without steatosis in the
univariate analysis. Sex, age and factors such as ALT, AST, TB,
ALB, PLT and PH were included in the multivariate logistic
regression analysis, revealing that a higher PLT count [OR=1.005
(95%CI: 1.000 to 1.009), P=0.041] and PH [OR=0.381 (95%CI: 0.177 to
0.820, P=0.014)] independently predicted liver steatosis (Table II).
| Table IIPredictors of prevalence of fatty
liver in patients with chronic hepatitis B. |
Table II
Predictors of prevalence of fatty
liver in patients with chronic hepatitis B.
| | Univariate
analysis | Multivariate
analysis |
|---|
| Variable | Fatty liver
subgroup (n=51) | Non-fatty liver
subgroup (n=289) | P-value | OR (95%CI) | P-value |
|---|
| Sex
(male/female) | 39/12 | 253/36 | 0.036 | 1.56 (0.688,
3.536) | 0.287 |
| Age, years | 49.8±9.87 | 50.7±10.5 | 0.564 | 0.999 (0.968,
1.030) | 0.941 |
| ALT, U/l | 39.5±27.6 | 61.6±154.6 | 0.310 | 1.007 (0.992,
1.021) | 0.368 |
| AST, U/l | 39.0±22.5 | 66.5±108.9 | 0.074 | 0.984 (0.964,
1.004) | 0.117 |
| PLT,
109/l | 148.0±78.8 | 103.0±64.5 | <0.001 | 1.005 (1.000,
1.009) | 0.041 |
| TB, µmol/l | 29.4±100.3 | 56.5±97.0 | 0.068 | 1.000 (0.995,
1.005) | 0.935 |
| ALB, g/l | 42.7±6.42 | 38.8±5.99 | <0.001 | 1.056 (0.992,
1.124) | 0.090 |
| PH (yes/no) | 36/15 | 252/37 | 0.002 | 0.381 (0.177,
0.820) | 0.014 |
| FIB-4 | 3.22±2.72 | 5.76±5.07 | 0.001 | - | - |
| APRI | 0.97±0.95 | 2.18±3.42 | 0.013 | - | - |
| ALBI | -2.88±0.64 | -2.36±0.68 | <0.001 | - | - |
| AAR | 1.13±0.55 | 1.30±0.64 | 0.101 | - | - |
| GPR | 0.73±0.91 | 1.11±0.05 | 0.016 | - | - |
In the univariate analysis of the subgroup of liver
iron overload (LIC ≥2 mg/g), sex, age, ALT, AST, TB, ALB and ALBI
showed significant differences from those without iron overload.
Sex, age and factors such as ALT, AST, TB, ALB, PLT and PH were
included in the multivariate logistic regression analysis. Age, TB
and sex were significant independent predictive factors of liver
iron overload [OR=1.036 (95%CI: 1.011 to 1.062), P=0.005; 1.005
(95%CI: 1.002 to 1.009), P=0.004; 8.8344 (95%CI: 2.931 to 26.62),
P<0.001, respectively] (Table
III).
| Table IIIPredictors of prevalence of liver
iron overload in patients with chronic hepatitis B. |
Table III
Predictors of prevalence of liver
iron overload in patients with chronic hepatitis B.
| | Univariate
analysis | Multivariate
analysis |
|---|
| Variable | Iron overload
subgroup (n=122) | No iron overload
subgroup (n=218) | P-value | OR (95%CI) | P-value |
|---|
| Sex
(male/female) | 118/4 | 174/44 | <0.001 | 8.834 (2.931,
26.62) | <0.001 |
| Age, years | 52.4±9.48 | 49.6±10.8 | 0.019 | 1.036 (1.011,
1.062) | 0.005 |
| ALT, U/l | 86.2±231.0 | 42.7±39.5 | 0.007 | 1.005 (0.995,
1.014) | 0.322 |
| AST, U/l | 88.93±153.6 | 47.4±47.1 | <0.001 | 1.002 (0.993,
1.012) | 0.623 |
| PLT,
109/l | 111.9±66.7 | 108.6±69.8 | 0.676 | 1.003 (0.999,
1.007) | 0.180 |
| TB, µmol/l | 87.1±130.0 | 33.1±66.9 | <0.001 | 1.005 (1.002,
1.009) | 0.004 |
| ALB, g/l | 38.5±6.22 | 39.9±6.15 | 0.039 | 0.997 (0.952,
1.043) | 0.891 |
| PH (yes/no) | 102/20 | 186/32 | 0.674 | 0.778 (0.386,
1.571) | 0.484 |
| FIB-4 | 5.97±5.23 | 5.05±4.64 | 0.093 | - | - |
| APRI | 2.44±2.98 | 1.74±3.31 | 0.054 | - | - |
| ALBI | -2.21±0.74 | -2.57±0.64 | 0.000 | - | - |
| AAR | 1.31±0.62 | 1.25±0.64 | 0.404 | - | - |
| GPR | 1.11±0.97 | 1.03±1.08 | 0.463 | - | - |
PDFF and LIC for predicting liver
cirrhosis
Liver cirrhosis was previously identified by FIB-4
≥3.25, APRI ≥2, ALBI ≥-2.190, AAR ≥1 or GPR >0.56 (18-22).
As seen in Fig. 2, at different
levels of FIB-4, APRI, ALBI, AAR and GPR, the PDFF showed
significant differences in each of the two groups, while for LIC,
significant differences were obtained in the APRI and ALBI groups.
The ROC curves of LIC and PDFF for the identification liver
cirrhosis estimated by different serum indices are shown in
Fig. 3. The areas under the ROC
curves for PDFF were 0.677 (95% CI: 0.620 to 0.734, P<0.001),
0.708 (95% CI: 0.647 to 0.768, P<0.001), 0.704 (95% CI: 0.647 to
0.768, P<0.001), 0.629 (95% CI: 0.568 to 0.689, P<0.001),
0.635 (95% CI: 0.575 to 0.695, P<0.001), respectively; while for
LIC, the areas under the ROC curves were 0.574 (95% CI: 0.502 to
0.645, P=0.0328) (APRI ≥2 as cut-off value) and 0.637 (95% CI:
0.570 to 0.703, P<0.001) (ALBI ≥-2.190 as cut-off value). After
logistic regression, predictive models for liver cirrhosis using a
joint indicator of LIC and PDFF were established (liver cirrhosis
was identified by APRI ≥2 and ALBI ≥-2.190). The areas under the
ROC curves for each predictive model were 0.717 (95% CI:
0.657-0.777) and 0.696 (95% CI: 0.636-0.757), P<0.001,
respectively (Fig. S3). Both AUCs
were higher than those of LIC only (P<0.004, <0.001), while
there was no significant difference when compared with that of PDFF
only (P=0.562, 0.812).
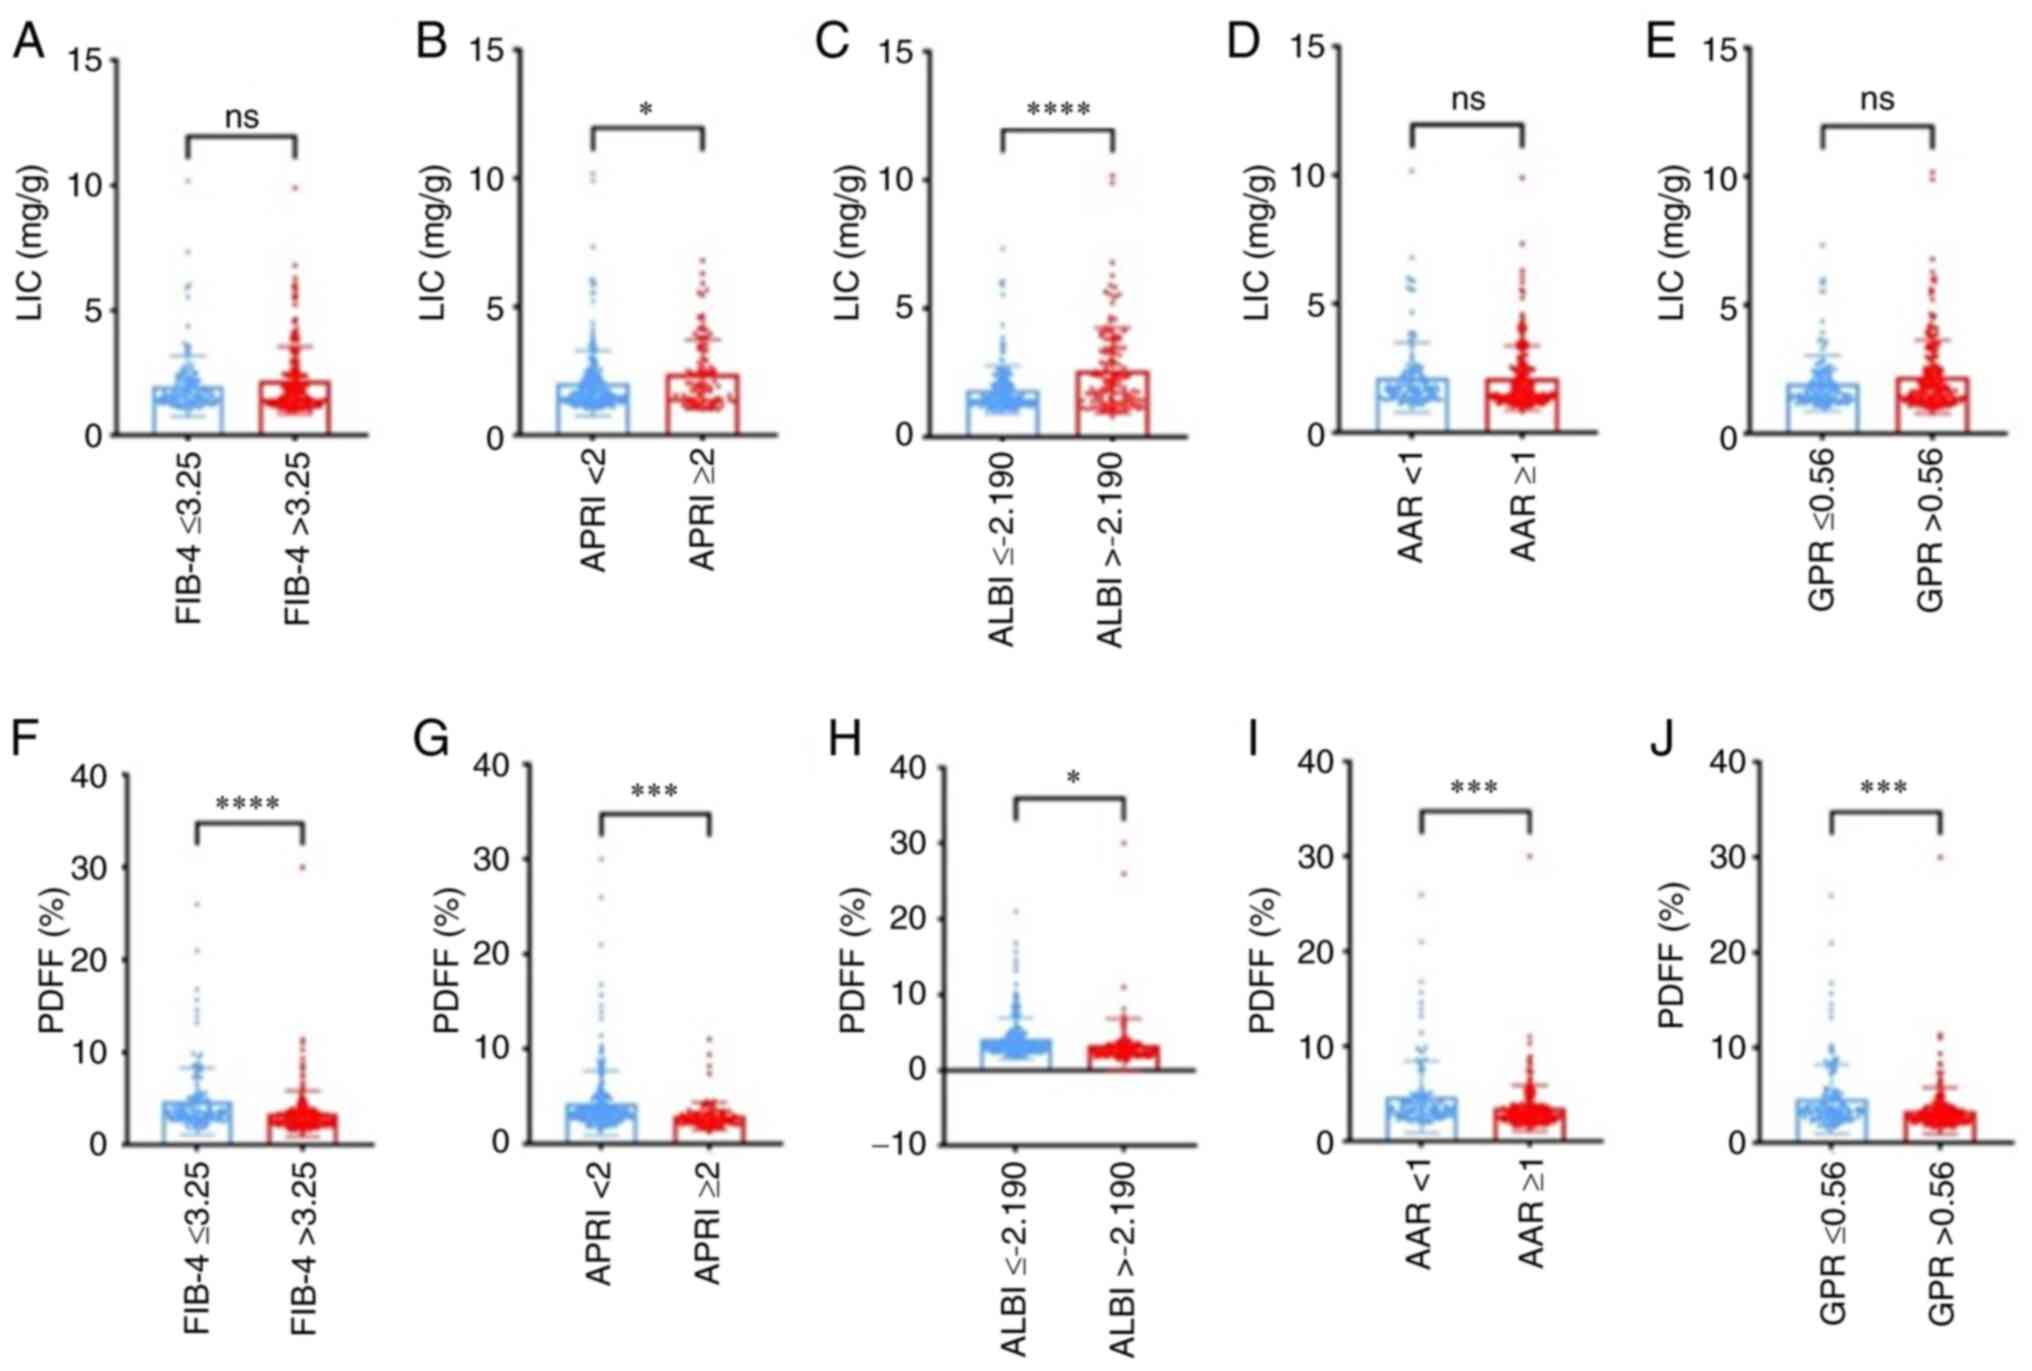 | Figure 2LIC and PDFF level in each liver
fibrosis score estimated by FIB-4, APRI, ALBI, AAR and GPR. (A-E)
LIC level estimated by (A) FIB-4, (B) APRI, (C) ALBI, (D) AAR and
(E) GPR. There was no significant difference in LIC levels between
two groups except for the APRI and ALBI (P=0.0218 and 0.001,
respectively). (F-J) PDFF level in each liver fibrosis score
estimated by (F) FIB-4, (G) APRI, (H) ALBI, (I) AAR and (J) GPR.
Significant differences in PDFF levels were found between different
groups according to FIB-4, APRI, ALBI, AAR and GPR (P<0.001,
<0.001, 0.013, <0.001 and <0.001, respectively). ns,
P>0.05; *P≤0.05; ***P≤0.001;
****P≤0.0001. LIC, liver iron content; PDFF, proton
density fat fraction; FIB-4, fibrosis index based on four factors;
APRI, aspartate aminotransferase-to-platelet ratio index; ALBI,
albumin-bilirubin index; AAR, AST-to-ALT ratio; GPR, gamma
glutamyltransferase-to-platelet ratio. |
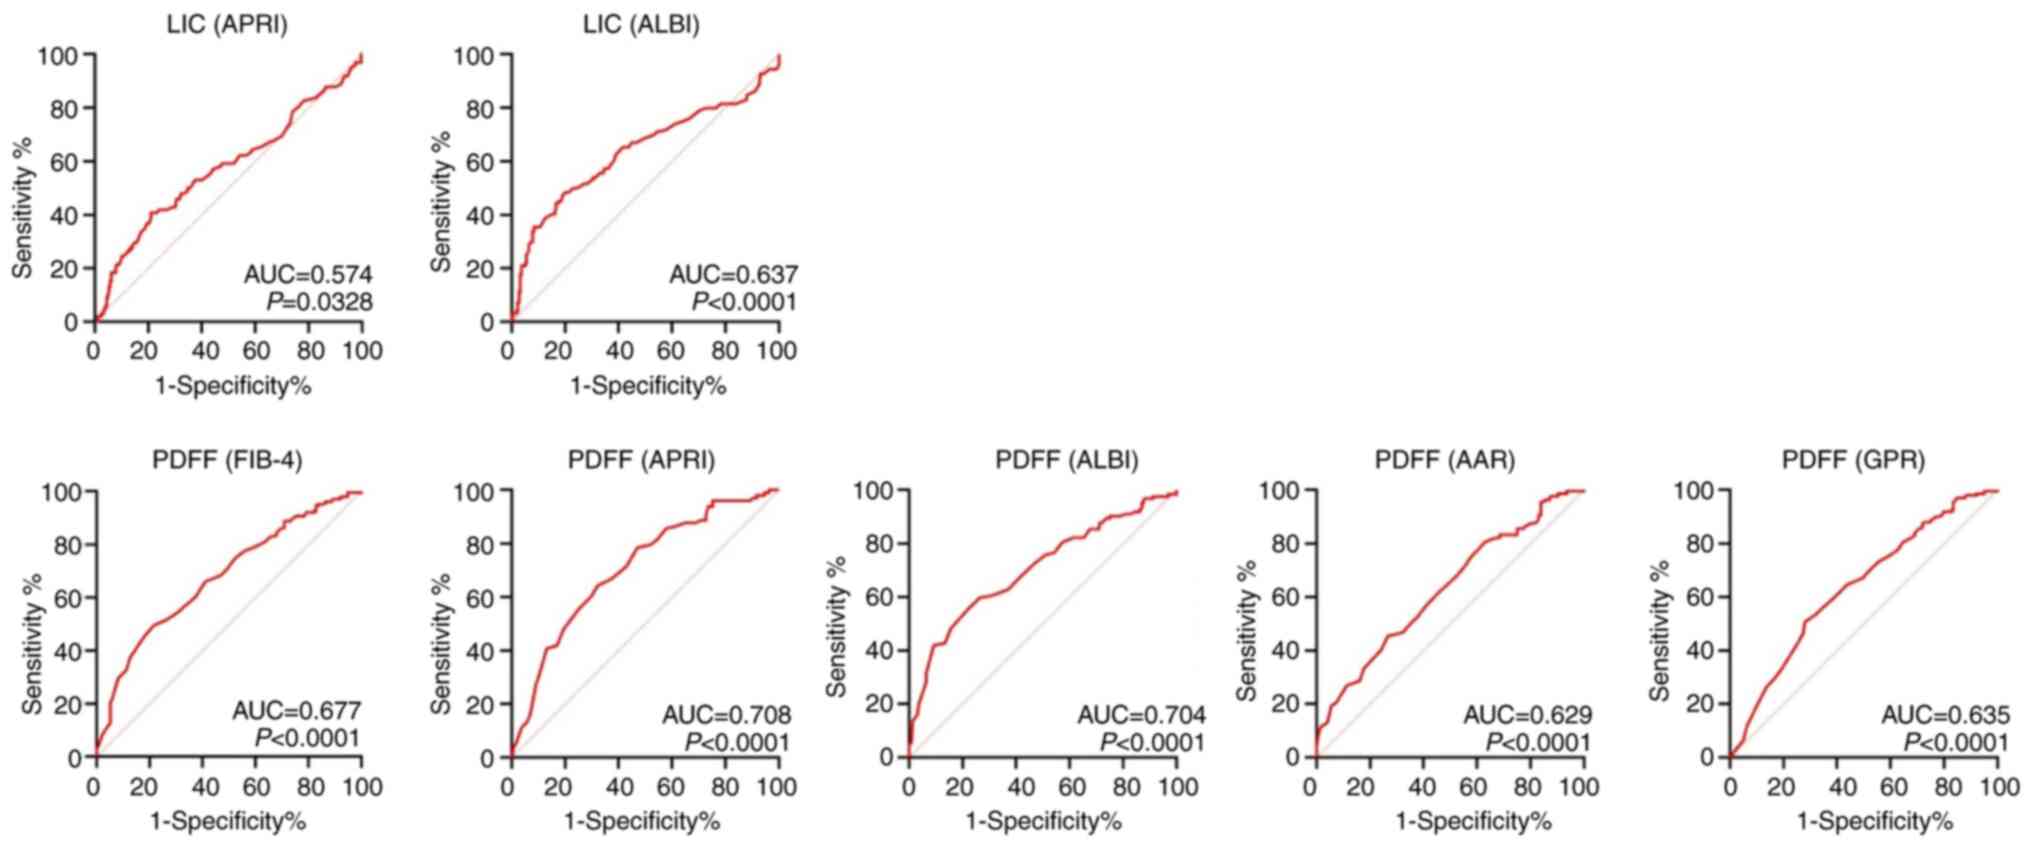 | Figure 3ROC curves of LIC and PDFF for the
identification of liver cirrhosis estimated by different
non-invasive fibrosis assessment tools (FIB-4 ≥3.25, APRI ≥2, ALBI
≥-2.190, AAR ≥1, GPR0.56) among patients with chronic hepatitis B.
The diagonal line represents detection achieved by chance alone
(AUC=0.50); the ideal AUC is 1.00. The AUCs for LIC were 0.574
(LIC-APRI, P=0.0328), 0.637 (LIC-ALBI, P<0.001), the areas under
the ROC curves of PDFF were 0.677 (P<0.001), 0.708 (P<0.001),
0.704 (P<0.001), 0.629 (P<0.001) and 0.635 (P<0.001),
respectively. LIC, liver iron content; PDFF, proton density fat
fraction; FIB-4, fibrosis index based on four factors; APRI,
aspartate aminotransferase-to-platelet ratio index; ALBI,
albumin-bilirubin index; AAR, AST-to-ALT ratio; GPR, gamma
glutamyltransferase-to-platelet ratio; ROC, receiver operating
characteristic; AUC, area under the ROC curve. |
Association of FER with LIC
A total of 145 patients had FER assessment at the
same time. FER elevation (upper limit of normal is 322 ng/ml) was
seen in 88 patients (60.7%). A significant linear correlation was
observed between FER and LIC (r=0.623, P<0.001) (Fig. S4A). When the ROC curve was plotted
to study the performance of FER for predicting liver iron overload,
the AUC was 0.858 (95%CI: 0.790 to 0.910, P<0.001)
(Fig. S4B), while the specificity
and sensitivity was 90.6 and 70.0%, respectively, with a cut-off
value of 885.3 ng/ml. According to the ROC curve, the patients were
divided into two groups based on their FER status [FER ≥885.3 ng/ml
(n=50) and FER <885.3 ng/ml (n=95)]. The data showed that the
patients in the group with FER ≥885.3 ng/ml had higher levels of
ALT, AST and TB and INR. The PVD and SVD were slightly but
significantly lower in the same group (Table SII).
Discussion
The present study indicated that iron overload was
common in CHB with a prevalence of 35.9%, particularly in those
with older age, male sex and higher TB. The prevalence of NAFLD in
patients with CHB was 15.0%, particularly in those with a high
platelet count and without PH. There appeared to be a weak
correlation between LIC and liver fibrosis, with a slight
diagnostic ability for cirrhosis with the AUCs ranging from 0.5 to
0.7. The diagnostic ability of PDFF to distinguish cirrhosis from
non-cirrhosis stages was slight to moderate and the AUCs were
between 0.6 and 0.8.
Martinelli et al (27) found hepatic iron deposits in 48.7%
of cases among 39 patients with HBV measured by liver biopsy, while
Ko et al (3) examined the
prevalence of hepatic iron overload in 5,224 patients undergoing
liver transplantation; only 13.3% of patients with HBV infection
had liver iron overload. Several studies have evaluated iron
overload in hepatitis C (HCV), with an increased liver iron
concentration in 10-36% of patients (28,29).
Ito et al (30) evaluated MR
images for diffuse hepatic iron deposition, indicating that 40%
were positive in cirrhotic patients with HCC. The differences among
those studies may be due to the various criteria used to define
iron stores.
FER is regarded as the primary tissue iron-storage
protein in the liver, which is induced in iron overload disorders
of various etiologies, resulting in increased hepatic and
circulating FER levels (31).
Hyperferritinemia has been observed in chronic liver disease due to
HCV and alcohol consumption (32-34),
but its relationship with hepatic iron deposition in such
situations has remained elusive. In the present study, FER
elevation was seen in more than half of the patients with CHB,
which had a strong correlation with the liver iron concentration
measured by MRI. Ripoll et al (35) reported that 59% of cirrhotic
patients had increased FER, which was similar to the present study.
Furthermore, the markers of liver failure, such as bilirubin and
INR score, were observed to be significantly different in those
patients with elevated FER levels. The markers of liver
inflammation, such as AST and ALT, were also elevated in the
high-level FER group, but were not independent factors that
predicted liver iron overload. It may be explained by FER being
induced by systemic inflammation, so that the situation of HBV
replication and other inflammation may lead to increased FER. This
suggests that when the FER level is used to evaluate the liver iron
overload, the inflammation status should be considered.
Several physiological mechanisms, particularly
reactive oxygen species accumulation and damage, may explain the
iron overload in liver fibrosis; low to moderate levels of excess
iron are sufficient to support the pathological progression
(36). A previous study indicated
that iron could increase HBV mRNA expression in HepG2 cells
(37), which may contribute to
sustenance of infection and inflammation, thereby potentiating
fibrosis. The iron-related parameters aid in the prediction,
diagnosis, staging and prognosis of liver fibrosis, when used in
combination with the routine markers of liver dysfunctionality.
Metwally et al (38) found
that increased hepatic iron deposition may be associated with more
advanced hepatic fibrosis in patients with CHC infection.
Martinelli et al (27) also
demonstrated that patients of CHB with liver iron deposits
exhibited significantly higher scores for necroinflammatory
activity and fibrosis than those without iron deposits. In
addition, patients with moderate liver iron deposits had a
significantly higher histologic activity index (12.8±3.2 and
7.3±3.7, respectively, P=0.001) and liver fibrosis (2.3±0.8 and
1.5±0.6, respectively, P=0.02) scores compared with those with
absent or mild liver iron deposits. In the present study, the LIC
was not strongly positively associated with the severity of liver
fibrosis, which was opposite to the above studies. The reason may
be that the LIC does not reflect the whole iron overload status and
extrahepatic iron load can also lead to the progression of liver
fibrosis. Further studies are needed to evaluate the value of
combining iron deposition parameters and other noninvasive indices
in the prediction of liver fibrosis.
In the present study, only 15.0% of patients had
liver steatosis as measured by MRI-PDFF, while the steatosis was
mild in most cases. The global prevalence of NAFLD is currently
estimated to be 24%, while it is 27% in Asia, and it is increasing
year by year due to the change in lifestyle (39). The prevalence of NAFLD is estimated
to be 14-67% in Asian individuals with CHB, similar to the data in
Western countries (40,41). In former studies, mounting evidence
tends to support a potentially negative association between CHB and
NAFLD in terms of hepatitis B serum markers, as well as onset of
NAFLD (9). Some research
demonstrated a significantly higher incidence of HBsAg clearance in
HBeAg-seronegative patients with CHB with hepatic steatosis than in
those without, and hepatic steatosis was further identified as an
independent predictor (hazard ratio=1.222) of spontaneous HBsAg
seroclearance in patients with CHB (11). On the other hand, there has been
evidence that indicates the association of chronic HBV infection
with a reduction in either hyperlipidemia or NAFLD incidence,
confirmed by the present data. A cross-sectional study in 7,695
Taiwanese adults showed that HBV-infected individuals exhibited a
lower risk of hypercholesterolemia (OR=0.8), hypertriglyceridemia
(OR=0.7) and high low-density lipoprotein cholesterol level
(OR=0.8) (42). A large
cross-sectional study in Hong Kong found a significantly lower risk
of NAFLD in HBsAg-positive subjects (adjusted OR=0.42) (43). Another cross-sectional study in
Taiwan also found a negative association of HBV infection with
NAFLD, particularly in individuals with BMI >22.4
kg/m2 or age >50 years (44).
Furthermore, a higher PLT and no PH were predictive
factors of liver steatosis in patients with CHB. The PDFF was lower
in cirrhotic patients than in those without cirrhosis. In the ROC
curve analysis, PDFF showed a slight to moderate diagnostic ability
to distinguish cirrhosis from non-cirrhosis patients. This allows
for the conclusion that, as liver fibrosis and PH progress, the
prevalence of liver steatosis decreases. However, the above
findings appear to be opposite to those of certain other studies. A
cohort study evaluated 459 HBeAg-negative patients across a 10-year
interval and found that hepatic steatosis was associated with
fibrosis progression in patients with CHB (OR=7.799) (45). A clinical study from Thailand
identified steatohepatitis as an independent predictor of
significant fibrosis (adjusted OR=10) and advanced fibrosis
(adjusted OR=3.45) (46). Due to
these contradictory results, more studies are needed to offer
high-level evidence in terms of the correlation with NAFLD and CHB
in the whole course of liver pathologic and immune progression.
Of note, the present study has certain limitations.
The pathologic data of live iron concentration, fat deposit and
fibrosis stage were not used as the gold standard for diagnosis of
iron overload, steatosis and liver fibrosis, which may lead to bias
distortion. Furthermore, the absence of a follow-up process in the
present study limits the ability to determine more precise causal
relationships through before-and-after comparisons. Since MRI is a
non-invasive and convenient tool, liver biopsy and MRI measurement
will be further combined and the role of MRI in identifying the
severity, complications, therapy response and progress in cirrhosis
of various causes will be comprehensively evaluated.
In conclusion, in patients with CHB, iron overload
was common and should be evaluated particularly in those with older
age, male sex and high TB levels. Liver steatosis is less common
and the steatosis was usually mild. Liver iron and fat measured by
MRI may reflect the severity of liver fibrosis in patients with
CHB.
Supplementary Material
Exclusion criteria.
MRI scan and parameters.
Scatter plots showing the correlation
between (A) SVD and PVD and (B) SVD and LIC. SVD, splenic vein
diameter; PVD, portal vein diameter; LIC, liver iron content.
Scatter plot showing the correlation
between the MRI features (A) PDFF, (B) LIC, (C) PVD and (D) SVD and
serum parameters and indices. LIC, liver iron content; PDFF, proton
density fat fraction; PVD, portal vein diameter; SVD, splenic vein
diameter; AST, aspartate aminotransferase; ALP, alkaline
phosphatase; PLT, platelet count; TB, total bilirubin; ALB,
albumin; INR, international normalized ratio; FER, serum ferritin;
Cr, creatinine; FIB-4, fibrosis index based on four factors, APRI,
aspartate aminotransferase to plateletratio index, ALBI,
albumin-bilirubin score, AAR, aspartate aminotransferase-alanine
aminotransferase ratio; GPR, gamma glutamyl transpeptidase
-plateletratio.
ROC curves of predictive models using
a joint indicator of LIC and PDFF for the identification of liver
cirrhosis estimated by different non-invasive fibrosis assessment
tools (APRI ≥2, ALBI ≥-2.190) among patients with chronic hepatitis
B. The area under the ROC curve for each predictive model was 0.717
(95%CI:0.657-0.777) and 0.696 (95%CI:0.636-0.757), P<0.001,
respectively. LIC, liver iron content; PDFF, proton density fat
fraction; APRI, aspartate aminotransferase-to-platelet ratio index;
ALBI, albumin-bilirubin index; ROC, receiver operating
characteristic.
(A) Scatter plot showing the
correlation between LIC and FER. (B) ROC curve for the
identification of LIC by the FER; the area under the ROC curve was
0.858 (P<0.001). LIC, liver ironcontent; FER, serum ferritin;
ROC, receiver operating characteristic.
Formulas for calculating the serum
indexes.
Differences in the serum indexes and
MRI features between low and high level of serum ferritin.
Acknowledgements
Not applicable.
Funding
Funding: This work was supported by grants from the Natural
Science Foundation of Guangdong Province (grant no.
2022A1515012546), the National Natural Science Foundation of China
(grant no. 82170569) and the major talent project training program
of the Third Affiliated Hospital of Sun Yat-Sen University (grant
no. P02089).
Availability of data and materials
The datasets used and/or analyzed during the current
study are available from the corresponding author upon reasonable
request.
Authors' contributions
ST planned and designed the study. JL, ZL and QW
collected and analyzed the data. JL and ST drafted the manuscript.
All authors have read and approved the submitted manuscript. JL and
ST checked and confirmed the authenticity of all the raw data.
Ethics approval and consent to
participate
The study protocol was approved by the Clinical
Research Ethics Committee of the Third Affiliated Hospital of Sun
Yat-Sen University [Guangzhou, China; approval no.
(2022)02-328-01]. The current study complied with the Declaration
of Helsinki. The requirement of written informed consent was
waived.
Patient consent for publication
Not applicable.
Competing interests
The authors declare that they have no competing
interests.
References
|
1
|
Ginzberg D, Wong RJ and Gish R: Global HBV
burden: Guesstimates and facts. Hepatol Int. 12:315–329.
2018.PubMed/NCBI View Article : Google Scholar
|
|
2
|
Ginès P, Krag A, Abraldes JG, Solà E,
Fabrellas N and Kamath PS: Liver cirrhosis. Lancet. 398:1359–1376.
2021.PubMed/NCBI View Article : Google Scholar
|
|
3
|
Ko C, Siddaiah N, Berger J, Gish R,
Brandhagen D, Sterling RK, Cotler SJ, Fontana RJ, McCashland TM,
Han SH, et al: Prevalence of hepatic iron overload and association
with hepatocellular cancer in end-stage liver disease: Results from
the national hemochromatosis transplant registry. Liver Int.
27:1394–1401. 2007.PubMed/NCBI View Article : Google Scholar
|
|
4
|
Guyader D, Thirouard AS, Erdtmann L, Rakba
N, Jacquelinet S, Danielou H, Perrin M, Jouanolle AM, Brissot P and
Deugnier Y: Liver iron is a surrogate marker of severe fibrosis in
chronic hepatitis C. J Hepatol. 46:587–595. 2007.PubMed/NCBI View Article : Google Scholar
|
|
5
|
Wang MM, Wang GS, Shen F, Chen GY, Pan Q
and Fan JG: Hepatic steatosis is highly prevalent in hepatitis B
patients and negatively associated with virological factors. Dig
Dis Sci. 59:2571–2579. 2014.PubMed/NCBI View Article : Google Scholar
|
|
6
|
Sikorska K, Stalke P, Izycka-Swieszewska
E, Romanowski T and Bielawski KP: The role of iron overload and HFE
gene mutations in the era of pegylated interferon and ribavirin
treatment of chronic hepatitis C. Med Sci Monit. 16:CR137–CR143.
2010.PubMed/NCBI
|
|
7
|
Van Thiel DH, Friedlander L, Fagiuoli S,
Wright HI, Irish W and Gavaler JS: Response to interferon alpha
therapy is influenced by the iron content of the liver. J Hepatol.
20:410–415. 1994.PubMed/NCBI View Article : Google Scholar
|
|
8
|
Olynyk JK, Reddy KR, Di Bisceglie AM,
Jeffers LJ, Parker TI, Radick JL, Schiff ER and Bacon BR: Hepatic
iron concentration as a predictor of response to interferon alfa
therapy in chronic hepatitis C. Gastroenterology. 108:1104–1109.
1995.PubMed/NCBI View Article : Google Scholar
|
|
9
|
Zhang J, Lin S, Jiang D, Li M, Chen Y, Li
J and Fan J: Chronic hepatitis B and non-alcoholic fatty liver
disease: Conspirators or competitors? Liver Int. 40:496–508.
2020.PubMed/NCBI View Article : Google Scholar
|
|
10
|
Liu J, Lee MH, Batrla-Utermann R, Jen CL,
Iloeje UH, Lu SN, Wang LY, You SL, Hsiao CK, Yang HI and Chen CJ: A
predictive scoring system for the seroclearance of HBsAg in
HBeAg-seronegative chronic hepatitis B patients with genotype B or
C infection. J Hepatol. 58:853–860. 2013.PubMed/NCBI View Article : Google Scholar
|
|
11
|
Tai DI, Tsay PK, Chen WT, Chu CM and Liaw
YF: Relative roles of HBsAg seroclearance and mortality in the
decline of HBsAg prevalence with increasing age. Am J
Gastroenterol. 105:1102–1109. 2010.PubMed/NCBI View Article : Google Scholar
|
|
12
|
Chiang CH, Yang HI, Jen CL, Lu SN, Wang
LY, You SL, Su J, Iloeje UH and Chen CJ: REVEAL-HBV Study Group.
Association between obesity, hypertriglyceridemia and low hepatitis
B viral load. Int J Obes (Lond). 37:410–415. 2013.PubMed/NCBI View Article : Google Scholar
|
|
13
|
Liu J, Yang HI, Lee MH, Lu SN, Jen CL,
Wang LY, You SL, Iloeje UH and Chen CJ: REVEAL-HBV Study Group.
Incidence and determinants of spontaneous hepatitis B surface
antigen seroclearance: A community-based follow-up study.
Gastroenterology. 139:474–482. 2010.PubMed/NCBI View Article : Google Scholar
|
|
14
|
Shackel NA and McCaughan GW: Liver biopsy:
Is it still relevant? Intern Med J. 36:689–691. 2006.PubMed/NCBI View Article : Google Scholar
|
|
15
|
Regev A, Berho M, Jeffers LJ, Milikowski
C, Molina EG, Pyrsopoulos NT, Feng ZZ, Reddy KR and Schiff ER:
Sampling error and intraobserver variation in liver biopsy in
patients with chronic HCV infection. Am J Gastroenterol.
97:2614–2618. 2002.PubMed/NCBI View Article : Google Scholar
|
|
16
|
Kim KY, Song JS, Kannengiesser S and Han
YM: Hepatic fat quantification using the proton density fat
fraction (PDFF): Utility of free-drawn-PDFF with a large coverage
area. Radiol Med. 120:1083–1093. 2015.PubMed/NCBI View Article : Google Scholar
|
|
17
|
Terrault NA, Lok ASF, McMahon BJ, Chang
KM, Hwang JP, Jonas MM, Brown RS Jr, Bzowej NH and Wong JB: Update
on prevention, diagnosis, and treatment of chronic hepatitis B:
AASLD 2018 hepatitis B guidance. Hepatology. 67:1560–1599.
2018.PubMed/NCBI View Article : Google Scholar
|
|
18
|
Wai CT, Greenson JK, Fontana RJ,
Kalbfleisch JD, Marrero JA, Conjeevaram HS and Lok AS: A simple
noninvasive index can predict both significant fibrosis and
cirrhosis in patients with chronic hepatitis C. Hepatology.
38:518–526. 2003.PubMed/NCBI View Article : Google Scholar
|
|
19
|
Vallet-Pichard A, Mallet V, Nalpas B,
Verkarre V, Nalpas A, Dhalluin-Venier V, Fontaine H and Pol S:
FIB-4: An inexpensive and accurate marker of fibrosis in HCV
infection. comparison with liver biopsy and fibrotest. Hepatology.
46:32–36. 2007.PubMed/NCBI View Article : Google Scholar
|
|
20
|
Johnson PJ, Berhane S, Kagebayashi C,
Satomura S, Teng M, Reeves HL, O'Beirne J, Fox R, Skowronska A,
Palmer D, et al: Assessment of liver function in patients with
hepatocellular carcinoma: A new evidence-based approach-the ALBI
grade. J Clin Oncol. 33:550–558. 2015.PubMed/NCBI View Article : Google Scholar
|
|
21
|
Sheth SG, Flamm SL, Gordon FD and Chopra
S: AST/ALT ratio predicts cirrhosis in patients with chronic
hepatitis C virus infection. Am J Gastroenterol. 93:44–48.
1998.PubMed/NCBI View Article : Google Scholar
|
|
22
|
Lemoine M, Shimakawa Y, Nayagam S, Khalil
M, Suso P, Lloyd J, Goldin R, Njai HF, Ndow G, Taal M, et al: The
gamma-glutamyl transpeptidase to platelet ratio (GPR) predicts
significant liver fibrosis and cirrhosis in patients with chronic
HBV infection in West Africa. Gut. 65:1369–1376. 2016.PubMed/NCBI View Article : Google Scholar
|
|
23
|
Caussy C, Alquiraish MH, Nguyen P,
Hernandez C, Cepin S, Fortney LE, Ajmera V, Bettencourt R, Collier
S, Hooker J, et al: Optimal threshold of controlled attenuation
parameter with MRI-PDFF as the gold standard for the detection of
hepatic steatosis. Hepatology. 67:1348–1359. 2018.PubMed/NCBI View Article : Google Scholar
|
|
24
|
Wood JC, Enriquez C, Ghugre N, Tyzka JM,
Carson S, Nelson MD and Coates TD: MRI R2 and R2* mapping
accurately estimates hepatic iron concentration in
transfusion-dependent thalassemia and sickle cell disease patients.
Blood. 106:1460–1465. 2005.PubMed/NCBI View Article : Google Scholar
|
|
25
|
Henninger B, Alustiza J, Garbowski M and
Gandon Y: Practical guide to quantification of hepatic iron with
MRI. Eur Radiol. 30:383–393. 2020.PubMed/NCBI View Article : Google Scholar
|
|
26
|
Chinese Society of Ultrasound in Medicine,
Oncology Intervention Committee of Chinese Research Hospital
Society and National Health Commission Capacity Building And
Continuing Education Expert Committee on Ultrasonic Diagnosis.
[Guideline for ultrasonic diagnosis of liver diseases]. Zhonghua
Gan Zang Bing Za Zhi. 29:385–402. 2021.PubMed/NCBI View Article : Google Scholar : (In Chinese).
|
|
27
|
Martinelli AL, Filho AB, Franco RF,
Tavella MH, Ramalho LN, Zucoloto S, Rodrigues SS and Zago MA: Liver
iron deposits in hepatitis B patients: Association with severity of
liver disease but not with hemochromatosis gene mutations. J
Gastroenterol Hepatol. 19:1036–1041. 2004.PubMed/NCBI View Article : Google Scholar
|
|
28
|
Piperno A, D'Alba R, Fargion S, Roffi L,
Sampietro M, Parma S, Arosio V, Faré M and Fiorelli G: Liver iron
concentration in chronic viral hepatitis: A study of 98 patients.
Eur J Gastroenterol Hepatol. 7:1203–1208. 1995.PubMed/NCBI View Article : Google Scholar
|
|
29
|
Di Bisceglie AM, Axiotis CA, Hoofnagle JH
and Bacon BR: Measurements of iron status in patients with chronic
hepatitis. Gastroenterology. 102:2108–2113. 1992.PubMed/NCBI View Article : Google Scholar
|
|
30
|
Ito K, Mitchell DG, Gabata T, Hann HW, Kim
PN, Fujita T, Awaya H, Honjo K and Matsunaga N: Hepatocellular
carcinoma: Association with increased iron deposition in the
cirrhotic liver at MR imaging. Radiology. 212:235–240.
1999.PubMed/NCBI View Article : Google Scholar
|
|
31
|
Arosio P, Ingrassia R and Cavadini P:
Ferritins: A family of molecules for iron storage, antioxidation
and more. Biochim Biophys Acta. 1790:589–599. 2009.PubMed/NCBI View Article : Google Scholar
|
|
32
|
Bell H, Skinningsrud A, Raknerud N and Try
K: Serum ferritin and transferrin saturation in patients with
chronic alcoholic and non-alcoholic liver diseases. J Intern Med.
236:315–322. 1994.PubMed/NCBI View Article : Google Scholar
|
|
33
|
Chapman RW, Morgan MY, Laulicht M,
Hoffbrand AV and Sherlock S: Hepatic iron stores and markers of
iron overload in alcoholics and patients with idiopathic
hemochromatosis. Dig Dis Sci. 27:909–916. 1982.PubMed/NCBI View Article : Google Scholar
|
|
34
|
Ferrara F, Ventura P, Vegetti A, Guido M,
Abbati G, Corradini E, Fattovich G, Ferrari C, Tagliazucchi M,
Carbonieri A, et al: Serum ferritin as a predictor of treatment
outcome in patients with chronic hepatitis C. Am J Gastroenterol.
104:605–616. 2009.PubMed/NCBI View Article : Google Scholar
|
|
35
|
Ripoll C, Keitel F, Hollenbach M, Greinert
R and Zipprich A: Serum ferritin in patients with cirrhosis is
associated with markers of liver insufficiency and circulatory
dysfunction, but not of portal hypertension. J Clin Gastroenterol.
49:784–789. 2015.PubMed/NCBI View Article : Google Scholar
|
|
36
|
Mehta KJ, Farnaud SJ and Sharp PA: Iron
and liver fibrosis: Mechanistic and clinical aspects. World J
Gastroenterol. 25:521–538. 2019.PubMed/NCBI View Article : Google Scholar
|
|
37
|
Park SO, Kumar M and Gupta S: TGF-β and
iron differently alter HBV replication in human hepatocytes through
TGF-β/BMP signaling and cellular microRNA expression. PloS One.
7(e39276)2012.PubMed/NCBI View Article : Google Scholar
|
|
38
|
Metwally MA, Zein CO and Zein NN: Clinical
significance of hepatic iron deposition and serum iron values in
patients with chronic hepatitis C infection. Am J Gastroenterol.
99:286–291. 2004.PubMed/NCBI View Article : Google Scholar
|
|
39
|
Younossi ZM, Koenig AB, Abdelatif D, Fazel
Y, Henry L and Wymer M: Global epidemiology of nonalcoholic fatty
liver disease-Meta-analytic assessment of prevalence, incidence,
and outcomes. Hepatology. 64:73–84. 2016.PubMed/NCBI View Article : Google Scholar
|
|
40
|
Fan JG, Kim SU and Wong VW: New trends on
obesity and NAFLD in Asia. J Hepatol. 67:862–873. 2017.PubMed/NCBI View Article : Google Scholar
|
|
41
|
Farrell GC, Wong VW and Chitturi S: NAFLD
in Asia-as common and important as in the west. Nat Rev
Gastroenterol Hepatol. 10:307–318. 2013.PubMed/NCBI View Article : Google Scholar
|
|
42
|
Liu PT, Hwang AC and Chen JD: Combined
effects of hepatitis B virus infection and elevated alanine
aminotransferase levels on dyslipidemia. Metabolism. 62:220–225.
2013.PubMed/NCBI View Article : Google Scholar
|
|
43
|
Wong VW, Wong GL, Chu WC, Chim AM, Ong A,
Yeung DK, Yiu KK, Chu SH, Chan HY, Woo J, et al: Hepatitis B virus
infection and fatty liver in the general population. J Hepatol.
56:533–540. 2012.PubMed/NCBI View Article : Google Scholar
|
|
44
|
Cheng YL, Wang YJ, Kao WY, Chen PH, Huo
TI, Huang YH, Lan KH, Su CW, Chan WL, Lin HC, et al: Inverse
association between hepatitis B virus infection and fatty liver
disease: A large-scale study in populations seeking for check-up.
PLoS One. 8(e72049)2013.PubMed/NCBI View Article : Google Scholar
|
|
45
|
Mak LY, Seto WK, Hui RW, Fung J, Wong DK,
Lai CL and Yuen MF: Fibrosis evolution in chronic hepatitis B e
antigen-negative patients across a 10-year interval. J Viral Hepat.
26:818–827. 2019.PubMed/NCBI View Article : Google Scholar
|
|
46
|
Charatcharoenwitthaya P, Pongpaibul A,
Kaosombatwattana U, Bhanthumkomol P, Bandidniyamanon W, Pausawasdi
N and Tanwandee T: The prevalence of steatohepatitis in chronic
hepatitis B patients and its impact on disease severity and
treatment response. Liver Int. 37:542–551. 2017.PubMed/NCBI View Article : Google Scholar
|