Introduction
The prevalence of non-alcoholic fatty liver disease
(NAFLD) is increasing globally in tandem with rising rates of
obesity and associated metabolic conditions, such as insulin
resistance, dyslipidemia, central obesity and hypertension.
Estimates suggest that NAFLD affects 25-30% of the adult population
worldwide, which varies based on the clinical setting, ethnicity
and geographical region, and NAFLD often remains undiagnosed
(1,2). Consequently, the incidence of hepatic
decompensation, hepatocellular carcinoma (HCC) and mortality due to
non-alcoholic steatohepatitis (NASH)-associated cirrhosis is
projected to rise 2- to 3-fold by 2030(1). Therefore, early identification of
hepatic steatosis and screening for advanced fibrosis are crucial
for planning appropriate management strategies (3,4).
Pathological biopsy remains the gold standard for
evaluating the severity of hepatic steatosis and liver fibrosis;
however, vibration-controlled transient elastography (VCTE) is an
increasingly utilized non-invasive alternative (5). VCTE, a non-invasive technique, employs
the controlled-attenuation parameter (CAP) score to quantify the
severity of hepatic steatosis, as well as the liver stiffness
measurement (LSM) to assess the degree of fibrosis (6). The procedure involves placing a probe
on the patient's skin over the liver, where it emits a mechanical
pulse and measures the velocity of the resulting shear wave as it
travels through the liver tissue. The speed of the wave is directly
related to liver stiffness, with higher velocities indicating more
severe fibrosis. Therefore, VCTE serves as an effective tool for
diagnosing liver fibrosis and hepatic steatosis. Furthermore, LSM
provides prognostic insights beyond fibrosis staging, such as the
assessment of liver stiffness changes over time, which are crucial
for monitoring fibrosis progression and its complications,
including cirrhosis, portal hypertension and HCC (7,8). These
insights can help identify patients at higher risk for adverse
outcomes and guide clinical management. Integrating LSM and CAP
into nationally representative datasets offers an opportunity to
accurately explore the relationship between the non-high-density
lipoprotein cholesterol (non-HDL-C) to high-density lipoprotein
cholesterol (HDL-C) ratio (NHHR) and the population-level risks of
liver steatosis and fibrosis.
Due to important advances in understanding the
metabolic determinants of NAFLD incidence and progression, specific
blood-related markers of dyslipidemia, particularly the NHHR, have
been extensively associated with various conditions such as
nephritis (9), abdominal aortic
aneurysm (10), diabetes mellitus
(11), periodontitis (12) and depression (13), demonstrating a promising predictive
value. However, the association of the NHHR with liver fibrosis and
hepatic steatosis remains incompletely explored. Yang et al
(14) revealed a positive
association between the NHHR and NAFLD in Chinese children and
adolescents. However, this finding is constrained by its focus on a
single ethnic group, the exclusion of adults, the inadequate
control of complex confounders, imprecise methods for categorizing
liver disease via ultrasound and the inability to assess steatosis
severity.
In the present study, to further investigate the
association between the NHHR and the risk of liver steatosis and
fibrosis, a large, nationally representative cross-sectional study
was conducted using National Health and Nutrition Examination
Survey (NHANES) data.
Materials and methods
Study population
NHANES (https://wwwn.cdc.gov/nchs/nhanes/continuousnhanes/default.aspx?Cycle=2017-2020)
is a biennial cross-sectional survey conducted to assess the
nutritional and physical health of the United States population.
The evaluation includes standardized in-home interviews, physical
examinations, records of examinations (including liver ultrasound
transient elastography) and laboratory tests conducted at mobile
examination centers. The NHANES protocols (NHANES 2017-2020;
protocol nos. #2011-17 and #2018-01) were approved by the Centers
for Disease Control and Prevention, with all participants providing
written informed consent.
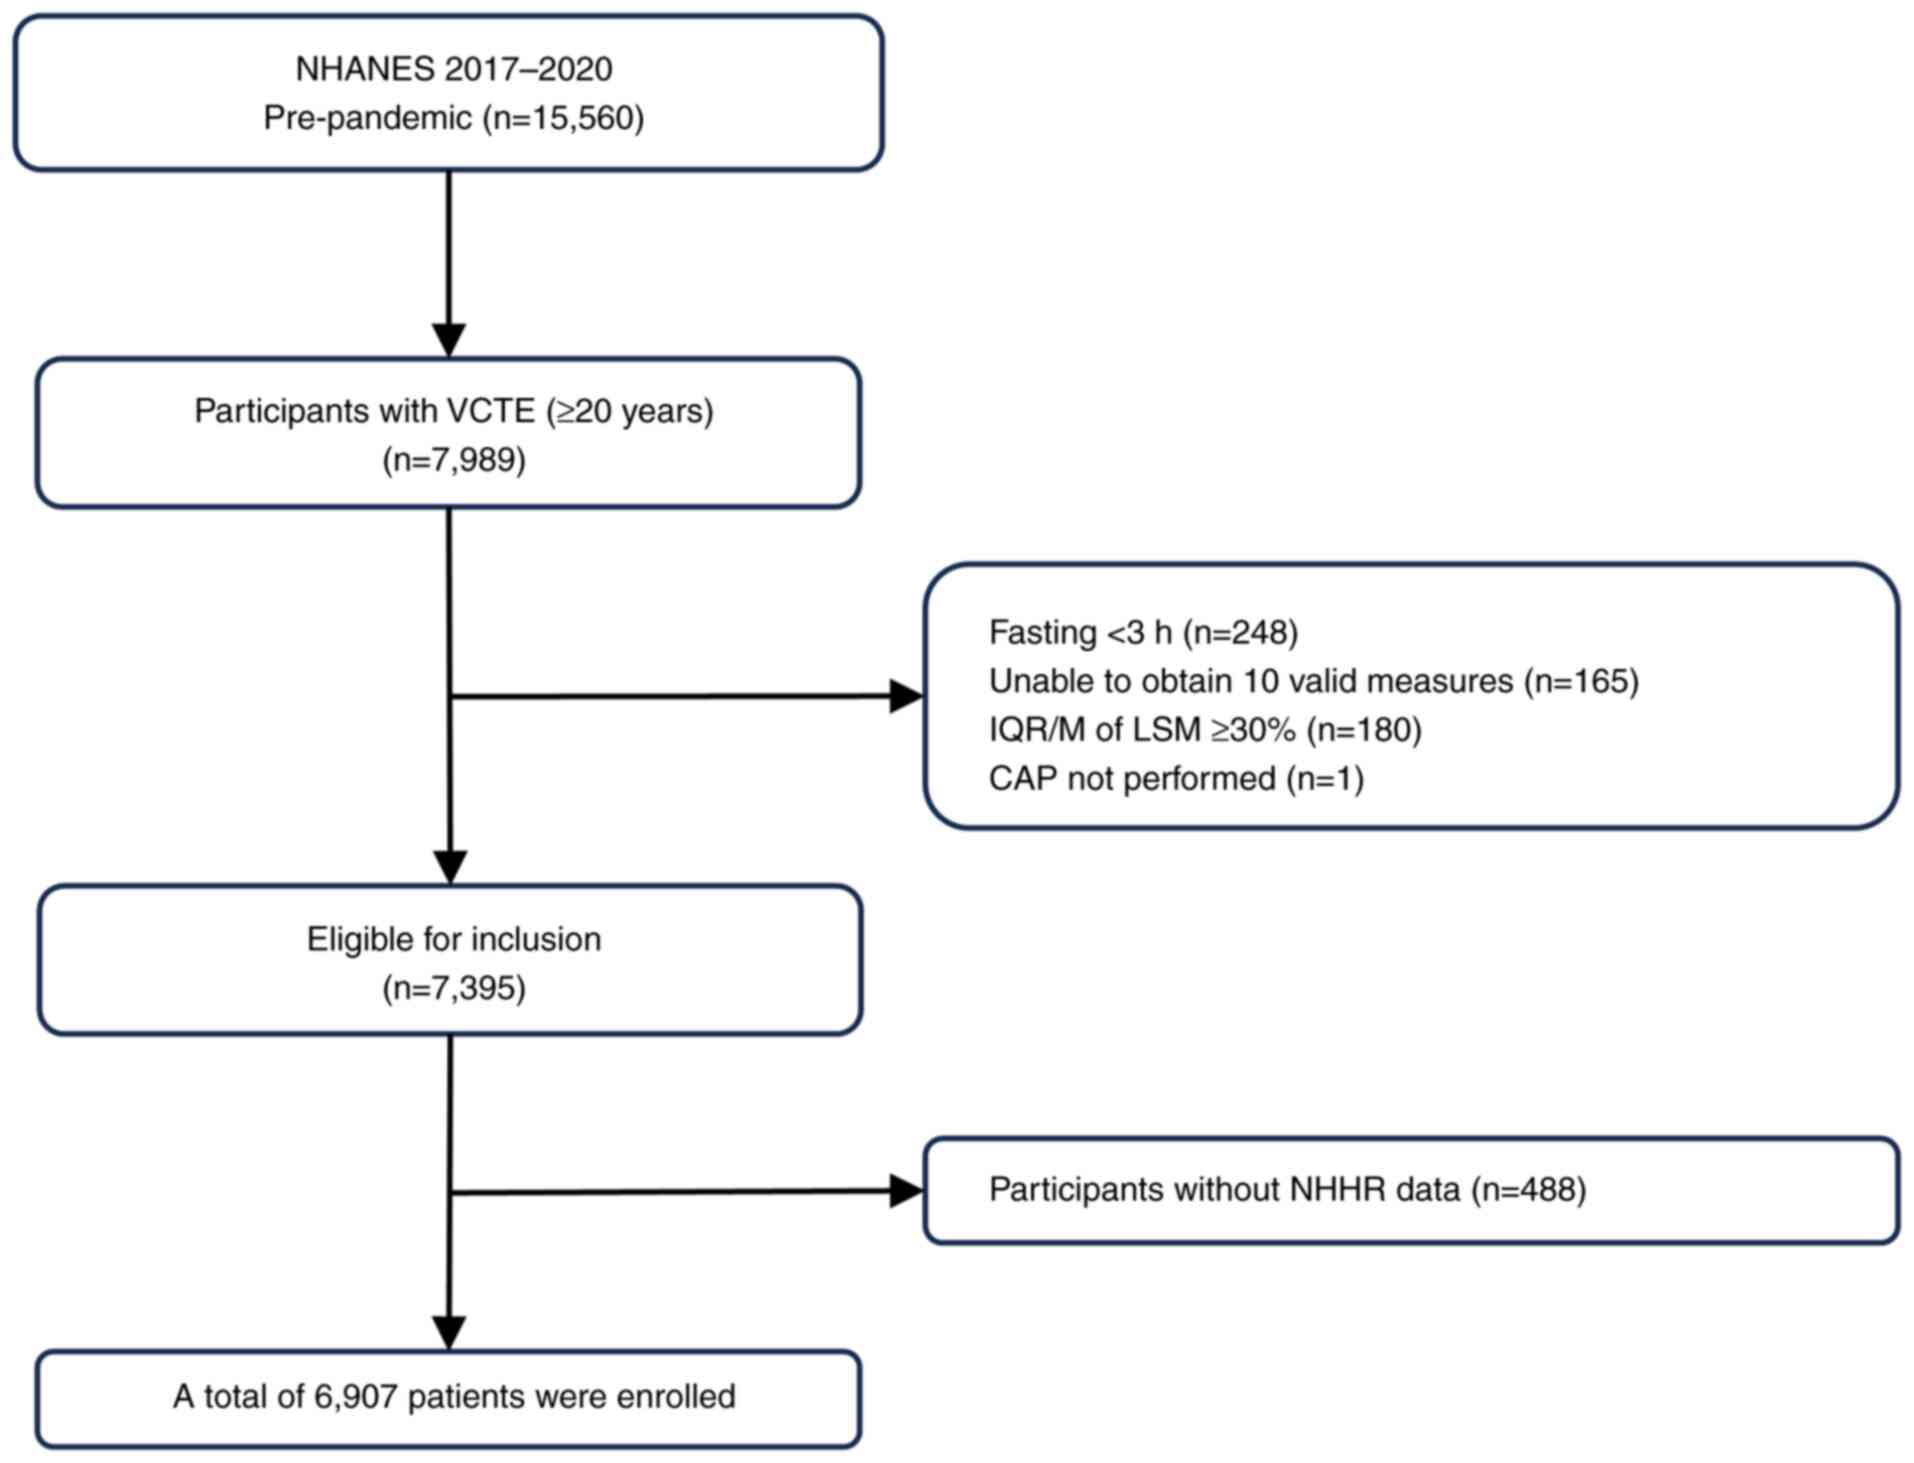
From the initial 15,560 patients included in NHANES
(2017-2020), 6,907 individuals aged ≥20 years, who had undergone
hepatic VCTE examinations, were included. The age and sex
distribution of the participants are further detailed in the
Results section and Table I.
Individuals were excluded if they met the following criteria: i)
Age <20 years (n=6,328); ii) missing elastography examination
data (the examination was not performed at all; n=1,243); iii)
absence of elastography examination data (fasting time <3 h,
inability to obtain 10 valid measurements, interquartile
range/median ratio of LSM >30% and cases where CAP was not
performed; n=594); and iv) lack of complete data on the NHHR
(n=488). The flowchart depicting the sample selection process is
presented in Fig. 1.
 | Table ICharacteristics of the study
population according to non-high-density lipoprotein cholesterol to
high-density lipoprotein cholesterol ratio data. |
Table I
Characteristics of the study
population according to non-high-density lipoprotein cholesterol to
high-density lipoprotein cholesterol ratio data.
| | P-value |
|---|
| Characteristic | Total (n=6,907) | Q1 (0.67-2.71)
(n=1,727) | Q2 (2.72-3.36)
(n=1,726) | Q3 (3.37-4.06)
(n=1,723) | Q4 (4.07-10.58)
(n=1,731) | Overall | Q1 vs. Q2 | Q2 vs. Q3 | Q3 vs. Q4 | Q1 vs. Q4 |
|---|
| Age, years | 50.56±17.21 | 50.62±19.09 | 51.15±17.85 | 51.03±16.34 | 49.43±15.26 | 0.007 | 0.379 | 0.765 | 0.004 | 0.023 |
| Sex, n (%) | | | | | | 0.007 | - | - | - | - |
|
Female | 3,509 (50.80) | 1,084 (62.77) | 973 (56.37) | 847 (49.16) | 605 (34.95) | | | | | |
|
Male | 3,398 (49.20) | 643 (37.23) | 753 (43.63) | 879 (50.84) | 1,123 (65.05) | | | | | |
| Ethnicity, n (%) | | | | | | <0.001 | - | - | - | - |
|
Non-Hispanic
White | 2,394 (34.66) | 604 (34.97) | 610 (35.34) | 591 (34.30) | 589 (34.03) | | | | | |
|
Hispanic | 1,586 (22.96) | 283 (16.39) | 381 (22.07) | 424 (24.61) | 498 (28.77) | | | | | |
|
Non-Hispanic
Black | 1,748 (25.31) | 567 (32.83) | 462 (26.77) | 406 (23.56) | 313 (18.08) | | | | | |
|
Non-Hispanic
Asian | 837 (12.12) | 198 (11.46) | 192 (11.12) | 208 (12.07) | 239 (13.81) | | | | | |
|
Others | 342 (4.95) | 75 (4.34) | 81 (4.69) | 94 (5.46) | 92 (5.31) | | | | | |
| Education, n
(%) | | | | | | <0.001 | - | - | - | - |
|
Less than
high school | 1,266 (18.33) | 247 (14.30) | 282 (16.34) | 341 (19.79) | 396 (22.88) | | | | | |
|
High school
graduate | 2,327 (33.69) | 428 (24.78) | 396 (22.94) | 413 (23.97) | 413 (23.86) | | | | | |
|
College or
associate's degree | 2,022 (29.27) | 576 (33.35) | 572 (33.14) | 574 (33.31) | 526 (30.39) | | | | | |
|
College or
above | 907 (13.13) | 474 (27.45) | 474 (27.46) | 393 (22.81) | 393 (22.70) | | | | | |
| Ratio of family
income to poverty | | | | | | 0.716 | - | - | - | - |
|
<1.3 | 1,651 (23.90) | 423 (24.49) | 385 (22.31%) | 429 (24.90%) | 414 (23.92%) | | | | | |
|
1.3-4.9 | 2,327 (33.69) | 564 (32.66) | 580 (33.60%) | 572 (33.20%) | 611 (35.30%) | | | | | |
|
≥5 | 2,022 (29.27) | 534 (30.92) | 534 (30.94%) | 481 (27.92%) | 473 (27.33%) | | | | | |
| Body mass index, n
(%) | | | | | | <0.001 | - | - | - | - |
|
Under weight
(<18.5 kg/m2) | 84 (1.22) | 52 (3.01) | 17 (0.98) | 8 (0.46) | 7 (0.40) | | | | | |
|
Normal
weight (18.5-24.9 kg/m2) | 1,670 (24.18) | 713 (41.29) | 461 (26.71) | 295 (17.12) | 201 (11.61) | | | | | |
|
Overweight
(25.0-29.9 kg/m2) | 2,243 (32.47) | 511 (29.59) | 568 (32.91) | 581 (33.72) | 583 (33.68) | | | | | |
|
Obese
(>30.0 kg/m2) | 2,856 (41.35) | 436 (25.25) | 658 (38.12) | 829 (48.11) | 933 (53.90) | | | | | |
| Alcohol abuse, n
(%) | | | | | | 0.004 | - | - | - | - |
|
Yes | 1,180 (17.08) | 313 (18.12) | 251 (14.54) | 289 (16.77) | 327 (18.89) | | | | | |
|
No | 5,727 (82.92) | 1,414 (81.88) | 1,475 (85.46) | 1,440 (83.29) | 1,398 (81.11) | | | | | |
| Smoking status, n
(%) | | | | | | <0.001 | - | - | - | - |
|
Never
smokers | 4,040 (58.49) | 1,023 (59.24) | 1,054 (61.07) | 1,025 (59.49) | 938 (54.19) | | | | | |
|
Former
smokers | 1,634 (23.66) | 387 (22.41) | 418 (24.22) | 386 (22.40) | 443 (25.59) | | | | | |
|
Current
smokers | 1,233 (17.85) | 317 (18.36) | 254 (14.72) | 312 (18.11) | 350 (20.22) | | | | | |
| Vigorous activity,
n (%) | | | | | | 0.147 | - | - | - | - |
|
Yes | 2,487 (36.01) | 617 (35.73) | 609 (35.28) | 599 (34.76) | 662 (38.24) | | | | | |
|
No | 4,420 (63.99) | 1,110 (64.27) | 1,118 (64.72) | 1,128 (65.24) | 1,064 (61.65) | | | | | |
| Comorbidities, n
(%) | | | | | | | | | | |
|
Diabetes | | | | | | <0.001 | - | - | - | - |
|
Yes | 1,312 (17.08) | 283 (16.39) | 301 (17.44) | 330 (19.15) | 398 (22.99) | | | | | |
|
No | 5,595 (81.00) | 1,444 (83.61) | 1,426 (82.56) | 1,397 (80.85) | 1,328 (77.03) | | | | | |
|
Hypertension | | | | | | 0.601 | - | - | - | - |
|
Yes | 2,612 (37.82) | 642 (37.17) | 638 (36.96) | 658 (38.19) | 674 (38.94) | | | | | |
|
No | 4,295 (62.18) | 1,085 (62.82) | 1,088 (63.04) | 1,071 (61.85) | 1,051 (60.93) | | | | | |
|
Congestive
heart failure | | | | | | 0.205 | - | - | - | - |
|
Yes | 188 (2.72) | 57 (3.30) | 49 (2.84) | 45 (2.61) | 37 (2.14) | | | | | |
|
No | 6,719 (97.28) | 1,670 (96.70) | 1,678 (97.16) | 1,684 (97.39) | 1,687 (97.86) | | | | | |
|
Coronary
heart disease | | | | | | 0.020 | - | - | - | - |
|
Yes | 274 (3.97) | 84 (4.86) | 78 (4.52) | 55 (3.19) | 57 (3.29) | | | | | |
|
No | 6,633 (96.03) | 1,643 (95.14) | 1,649 (95.48) | 1,674 (96.81) | 1,667 (96.71) | | | | | |
|
Angina | | | | | | 0.148 | - | - | - | - |
|
Yes | 156 (2.26) | 40 (2.32) | 49 (2.84) | 38 (2.21) | 29 (1.68) | | | | | |
|
No | 6,571 (97.74) | 1,687 (97.68) | 1,678 (97.16) | 1,691 (97.79) | 1,695 (98.32) | | | | | |
|
Stroke | | | | | | 0.048 | - | - | - | - |
|
Yes | 314 (4.55) | 96 (5.56) | 82 (4.75) | 73 (4.24) | 63 (3.64) | | | | | |
|
No | 6,593 (95.45) | 1,631 (94.44) | 1,645 (95.25) | 1,656 (95.76) | 1,661 (96.35) | | | | | |
|
Asthma | | | | | | 0.583 | - | - | - | - |
|
Yes | 1058 (15.32) | 278 (16.10) | 270 (15.64) | 259 (15.03) | 251 (14.50) | | | | | |
|
No | 5,849 (84.68) | 1,449 (83.90) | 1,457 (84.36) | 1,468 (85.00) | 1,475 (85.46) | | | | | |
|
COPD | | | | | | 0.651 | - | - | - | - |
|
Yes | 574 (8.31) | 153 (8.86) | 146 (8.46) | 142 (8.24) | 133 (7.68) | | | | | |
|
No | 6,333 (91.69) | 1,574 (91.14) | 1,581 (91.54) | 1,587 (91.76) | 1,591 (92.32) | | | | | |
|
Thyroid
problems | | | | | | <0.001 | - | - | - | - |
|
Yes | 808 (11.70) | 200 (11.58) | 251 (14.54) | 206 (11.96) | 151 (8.72) | | | | | |
|
No | 6,099 (88.30) | 1,527 (88.42) | 1,475 (85.46) | 1,524 (88.10) | 1,573 (91.24) | | | | | |
|
Arthritis | | | | | | <0.001 | - | - | - | - |
|
Yes | 2,059 (29.81) | 523 (30.28) | 525 (30.42) | 565 (32.79) | 446 (25.77) | | | | | |
|
No | 4,848 (70.19) | 1,204 (69.72) | 1,201 (69.51) | 1,162 (67.28) | 1,281 (74.17) | | - | - | - | - |
| Laboratory
features | | | | | | | | | | |
|
Total
cholesterol (0-5.18), mmol/l | 4.82±1.05 | 4.25±0.93 | 4.58±0.87 | 4.89±0.87 | 5.57±1.05 | <0.001 | <0.001 | <0.001 | <0.001 | <0.001 |
|
HDL
cholesterol (0-3.11), mmol/l | 1.38±0.41 | 1.79±0.45 | 1.45±0.28 | 1.25±0.23 | 1.04±0.20 | <0.001 | <0.001 | <0.001 | <0.001 | <0.001 |
|
Triglycerides
(0-1.70), mmol/l | 1.57±1.23 | 0.94±0.42 | 1.21±0.53 | 1.56±0.67 | 2.59±1.90 | <0.001 | <0.001 | <0.001 | <0.001 | <0.001 |
|
Glycohemoglobin
(4.00-6.00), % | 5.85±1.10 | 5.66±0.87 | 5.77±0.98 | 5.85±0.98 | 6.10±1.44 | <0.001 | <0.001 | <0.001 | <0.001 | <0.001 |
|
AST
(0-37.00), U/l | 21.96±14.44 | 22.50±18.51 | 21.45±15.89 | 21.03±9.30 | 22.86±12.27 | <0.001 | 0.571 | 0.359 | <0.001 | <0.001 |
|
ALT
(0-40.00), U/l | 22.48±18.87 | 19.31±17.31 | 20.74±21.36 | 22.41±14.91 | 27.44±20.20 | <0.001 | <0.001 | <0.001 | <0.001 | <0.001 |
|
ALP
(40.00-129.00), U/l | 77.52±25.67 | 73.62±25.92 | 76.53±23.55 | 77.63±22.07 | 82.29±29.72 | <0.001 | <0.001 | 0.098 | <0.001 | <0.001 |
|
γGT
(11.00-51.00), U/l | 32.18±45.79 | 30.42±52.68 | 29.40±41.90 | 29.60±33.68 | 39.26±51.52 | <0.001 | <0.001 | <0.001 | <0.001 | <0.001 |
|
Total
bilirubin (6.60-8.70), g/dl | 7.84±4.70 | 8.41±5.43 | 7.86±4.47 | 7.57±4.57 | 7.51±4.18 | <0.001 | 0.020 | 0.015 | 0.754 | <0.001 |
|
Albumin
(35.00-50.00), g/l | 40.67±3.30 | 40.59±3.38 | 40.67±3.40 | 40.53±3.23 | 40.87±3.18 | 0.009 | 0.390 | 0.130 | 0.001 | 0.010 |
|
Creatinine,
(45.10-84.00) µmol/l | 79.52±40.22 | 79.24±50.00 | 78.34±42.00 | 78.43±26.94 | 82.05±38.38 | <0.001 | 0.153 | 0.070 | <0.001 | <0.001 |
|
Uric acid
(202.20-416.40), µmol/l | 321.48±87.07 | 293.67±83.23 | 307.34±80.82 | 331.71±85.06 | 353.11±86.96 | <0.001 | <0.001 | <0.001 | <0.001 | <0.001 |
|
Platelet
count (150.00-450.00), 109/µl | 246.07±64.97 | 239.12±64.74 | 245.50±64.97 | 248.79±65.03 | 250.84±64.60 | <0.001 | 0.003 | 0.111 | 0.420 | <0.001 |
|
hsCRP
(<5.00), mg/l | 3.98±8.27 | 3.14±8.44 | 3.90±9.45 | 4.31±7.15 | 4.58±7.82 | <0.001 | <0.001 | <0.001 | <0.001 | <0.001 |
| Liver ultrasound
transient elastography | | | | | | | | | | |
|
LSM value,
kPa | 5.82±4.58 | 5.58±4.10 | 5.68±4.20 | 5.73±3.99 | 6.30±5.75 | <0.001 | 0.086 | 0.031 | <0.001 | <0.001 |
|
Advanced
fibrosis, n (%) | | | | | | 0.016 | - | - | - | - |
|
Yes | 409 (5.92) | 86 (4.98) | 102 (5.91) | 93 (5.40) | 128 (7.39) | | | | | |
|
No | 6,498 (94.08) | 1,641 (95.02) | 1,625 (94.09) | 1,636 (94.60) | 1,596 (92.61) | | | | | |
|
CAP value,
dB/m | 265.10±62.04 | 237.25±57.86 | 255.08±58.76 | 275.03±58.76 | 292.96±58.24 | <0.001 | <0.001 | <0.001 | <0.001 | <0.001 |
|
Hepatic
steatosis, n (%) | | | | | | <0.001 | - | - | - | - |
|
Yes | 3,034 (43.93) | 435 (25.19) | 623 (36.10) | 876 (50.84) | 1,100 (63.55) | | | | | |
|
No | 3,873 (56.07) | 1,292 (74.81) | 1,103 (63.90) | 852 (49.16) | 626 (36.45) | | | | | |
Definition of NHHR
The NHHR was included as an exposure variable in the
present study and calculated as follows: NHHR=non-HDL-C/HDL-C.
The computation of non-HDL-C involved subtracting
HDL-C from total cholesterol (TC). The present study stratified
participants based on their NHHR values, and categorized them into
four quartiles (Q1: 0.67-2.71; Q2: 2.72-3.36; Q3: 3.37-4.06; and
Q4: 4.07-10.58) for analytical convenience.
Measurement of liver fibrosis and
hepatic steatosis
The elastography measurements at the NHANES mobile
examination center were conducted using the FibroScan®
model 502 V2 Touch (Echosens), which was outfitted with either a
medium (M) or extra-large (XL) probe. Participants were placed in
the supine position with the right arm fully extended for hepatic
measurements via intercostal spaces in the right lobe. A minimum
3-h fasting period was performed by the participants before the
procedure. The selection of M and XL probes was guided by the
automatic selection function of the device system, the manual
assessment of skin to liver envelope distance and body mass index.
This selection process was performed in accordance with the
manufacturer's instructions to ensure accurate and reliable
measurements. The success of each measurement was evaluated by the
software of the aforementioned system, with the overall validity
based on meeting the following criteria: i) A minimum of 10 valid
shots; ii) a success rate >60% (calculated as valid shots
divided by total shots); and iii) an interquartile range <30% of
the median LSM value (interquartile range/median <30%). LSM was
recorded in kilopascals (kPa), while CAP was recorded in decibels
per meter (dB/m). Previous studies (6,15)
suggested that a CAP cut-off value of ≥274 dB/m, with a sensitivity
of 90%, is indicative of hepatic steatosis. Furthermore, an LSM
cut-off value of ≥9.7 kPa, with a sensitivity of 71% and
specificity of 75%, is suggestive of advanced fibrosis (≥F3)
(6).
Covariates
According to the literature, several covariates were
analyzed in the present study, including age, sex, ethnicity,
educational attainment, family income-to-poverty ratio, smoking
status, alcohol abuse and vigorous activity (16-18).
For the purposes of the present study, ethnicity was divided into
five categories: i) Non-Hispanic White; ii) Hispanic; iii)
non-Hispanic Black; iv) non-Hispanic Asian; and v) other (which
encompasses multiethnic groups). Educational attainment was also
classified into four distinct categories: i) Less than high school;
ii) high school graduate; iii) college or associate's degree; and
iv) college graduate or higher.
The ratio of family income to poverty, determined by
dividing the income of the family or individual by the poverty
guidelines specific to the year of the survey, classified familial
income into three categories: i) Low (<1.3); ii) medium
(1.3-4.9); and iii) high (≥5.0). Smoking status was determined
based on the responses of the participants to two questions in the
‘Smoking Cigarette Use’ questionnaire: i) Whether they now smoke
cigarettes; and ii) whether they have smoked at least 100
cigarettes in their entire life. Participants were categorized into
three smoking status groups: i) Never smokers (<100 cigarettes
in their entire life); ii) former smokers (≥100 cigarettes but had
quit smoking); and iii) current smokers (19). Alcohol abuse was defined as the
consumption of more than two or more than three standard drinks per
day on average for female and male participants, respectively, with
a standard drink defined as a 12 oz. beer, a 5 oz. glass of wine or
1.5 oz. liquor. Vigorous activity was characterized as
participation in activities with a metabolic equivalent of ≥6.
Statistical analysis
All statistical analyses were performed using R
software v.4.1.3 (Posit Software). Continuous variables are
presented as the mean ± SD, while categorical variables are
presented as counts and percentages. Baseline differences between
NHHR quartile (Q) groups were compared using one-way ANOVA followed
by Bonferroni post hoc test for continuous variables or
χ2 test for categorical variables. For study variables
of primary interest (such as the NHHR), records containing missing
values were removed entirely. For important covariates that
required adjustment (such as educational attainment, smoking status
and alcohol abuse), the missing records were filled in by
transforming them into categorical variables (‘missing’ category).
The association between the NHHR and the presence of steatosis and
fibrosis was explored using multivariate logistic regression
analyses. Odds ratio (OR) and 95% (confidence interval) CI values
for the NHHR were calculated, treating it as both a continuous and
categorical variable. The multivariate analysis comprised three
models: i) Model 1, unadjusted; ii) model 2, adjusted for age, sex
and ethnicity; and iii) model 3, additionally adjusted for
education level, family income-to-poverty ratio, smoking status,
alcohol use and vigorous physical activity.
In addition, a restricted cubic spline (RCS)
regression model was utilized to analyze dose-response associations
of the NHHR with liver fibrosis and hepatic steatosis. Subgroup
analyses were performed to evaluate the robustness of these
associations across diverse population factors. A log-likelihood
ratio test was applied to ascertain the presence of a threshold,
contrasting a single-linear model (non-segmented) with a
two-piecewise linear regression model. The inflection point (K) was
determined through a two-step recursive method.
Several sensitivity analyses were performed to
evaluate the robustness of the results. First, hepatic steatosis
was defined using a CAP cut-off value of ≥285 dB/m, which was
selected to optimize sensitivity (80%) and specificity (77%)
(20). Second, an optimal LSM
cut-off of ≥8.6 kPa was applied (sensitivity of 66% and specificity
of 80%) to indicate clinically significant fibrosis (stage F2-F4)
(4,5). Third, the analysis was restricted to
patients with NAFLD (n=5,478) to exclude confounding factors on
steatosis. Patients with alcohol consumption (n=1,234), use of
steatogenic medications for >6 months (n=89) and hepatitis B
(n=38) or C (n=157) were excluded (3,4).
Certain patients had more than one of these conditions; therefore,
the number of excluded patients may overlap.
A two-sided P<0.05 was considered to indicate a
statistically significant difference.
Results
Baseline characteristics
Among the 15,560 participants enrolled in NHANES
between 2017 and 2020, 8,653 individuals were excluded due to their
age being <20 years, missing or absent elastography data or
incomplete NHHR records. This resulted in a final analytical cohort
of 6,907 patients. The average age of these adults was 50.56±17.21
years, with 3,398 male patients and 3,509 female patients. The
baseline characteristics of the NHANES participants from 2017 to
2020 are presented in Table I,
stratified by the following NHHR Qs: i) 0.67-2.71; ii) 2.72-3.36;
iii) 3.37-4.06; and iv) 4.07-10.58. Significant differences were
observed among the groups. Compared with subjects in the lowest Q
of the NHHR, those in the highest Q were more likely to be male,
more obese as assessed by body mass index, had higher percentage of
diabetes and worse liver function (higher aspartate
aminotransferase and alanine aminotransferase levels). The mean ±
SD values of CAP and LSM were 265.10±62.04 dB/m and 5.82±4.58 kPa,
respectively. The overall prevalence of advanced fibrosis was
5.92%, with rates by Q (Q1 to Q4) of 4.98, 5.91, 5.40 and 7.39%,
respectively (P=0.016). Hepatic steatosis occurred in 43.93% of
cases, showing a significant increase with higher NHHR Qs (Q1,
25.19%; Q2, 36.10%; Q3, 50.84%; and Q4, 63.55%; P<0.001).
Association between the NHHR and
advanced fibrosis
The results of the multivariate logistic regression
analysis are presented in Table
II. In the unadjusted model, an elevated NHHR exhibited a
positive association with increased possibility for advanced
fibrosis (OR, 1.10; 95% CI, 1.03-1.17; P=0.002), which remained
consistent after adjusting for multiple confounding factors (Model
2: OR, 1.10; 95% CI, 1.03-1.17; P=0.005; Model 3: OR, 1.10; 95% CI,
1.03-1.17; P=0.007). Stratifying the NHHR into Qs for further
analysis revealed that individuals in the highest Q (Q4) had a
higher risk of advanced fibrosis compared with those in the lower
Qs (Q1-Q3) in a fully adjusted model (OR, 1.44; 95% CI, 1.07-1.93;
P=0.016). This finding highlights the association between higher
NHHR levels and advanced fibrosis risk. The association between the
NHHR and advanced fibrosis is shown in Fig. 2A, where each yellow point represents
a sample. The RCS model indicated a linear dose-response
relationship between the NHHR and advanced fibrosis (P=0.647 for
non-linearity; Fig. 2B; Table III). When NHHR is <5.01, the
chance of developing advanced fibrosis increases by 13% (OR, 1.13;
95% CI, 1.02-1.24; P=0.014) for every additional unit of NHHR.
Conversely, when the NHHR was ≥5.01, no significant change in the
relative risk of advanced fibrosis was observed.
| Table IIAssociation between NHHR and advanced
fibrosis. |
Table II
Association between NHHR and advanced
fibrosis.
| | Model 1 | Model 2 | Model 3 |
|---|
| NHHR category | OR (95% CI) | P-value | OR (95% CI) | P-value | OR (95% CI) | P-value |
|---|
| NHHR total | 1.10
(1.03-1.17) | 0.002 | 1.10
(1.03-1.17) | 0.005 | 1.10
(1.03-1.17) | 0.007 |
| NHHR quartile | | | | | | |
|
Q1 | 1.00
(Reference) | | 1.00
(Reference) | | 1.00
(Reference) | |
|
Q2 | 1.20
(0.89-1.61) | 0.229 | 1.16
(0.86-1.56) | 0.340 | 1.16
(0.86-1.57) | 0.324 |
|
Q3 | 1.09
(0.81-1.47) | 0.580 | 1.03
(0.76-1.40) | 0.831 | 1.02
(0.75-1.39) | 0.889 |
|
Q4 | 1.52
(1.15-2.02) | 0.003 | 1.45
(1.08-1.95) | 0.012 | 1.44
(1.07-1.93) | 0.016 |
|
P-value for
trend | | 0.008 | | 0.027 | | 0.038 |
| Table IIITwo-segment piecewise linear
regression model for the analysis of threshold effects between the
NHHR, advanced fibrosis and hepatic steatosis. |
Table III
Two-segment piecewise linear
regression model for the analysis of threshold effects between the
NHHR, advanced fibrosis and hepatic steatosis.
| Liver function
parameter | OR (95% CI) | P-value |
|---|
| Advanced
fibrosis | | |
|
Fitting by
standard linear model | 1.10
(1.03-1.17) | 0.007 |
|
Fitting by
two-piecewise linear model | | |
|
<5.01 | 1.13
(1.02-1.24) | 0.014 |
|
≥5.01 | 1.04
(0.90-1.21) | 0.589 |
|
Log-likelihood
ratio | 0.402 | |
| Hepatic
steatosis | | |
|
Fitting by
standard linear model | 1.61
(1.53-1.68) | <0.001 |
|
Fitting by
two-piecewise linear model | | |
|
<3.83 | 1.96
(1.84-2.09) | <0.001 |
|
≥3.83 | 1.07
(0.98-1.16) | 0.135 |
|
Log-likelihood
ratio | 0.039 | |
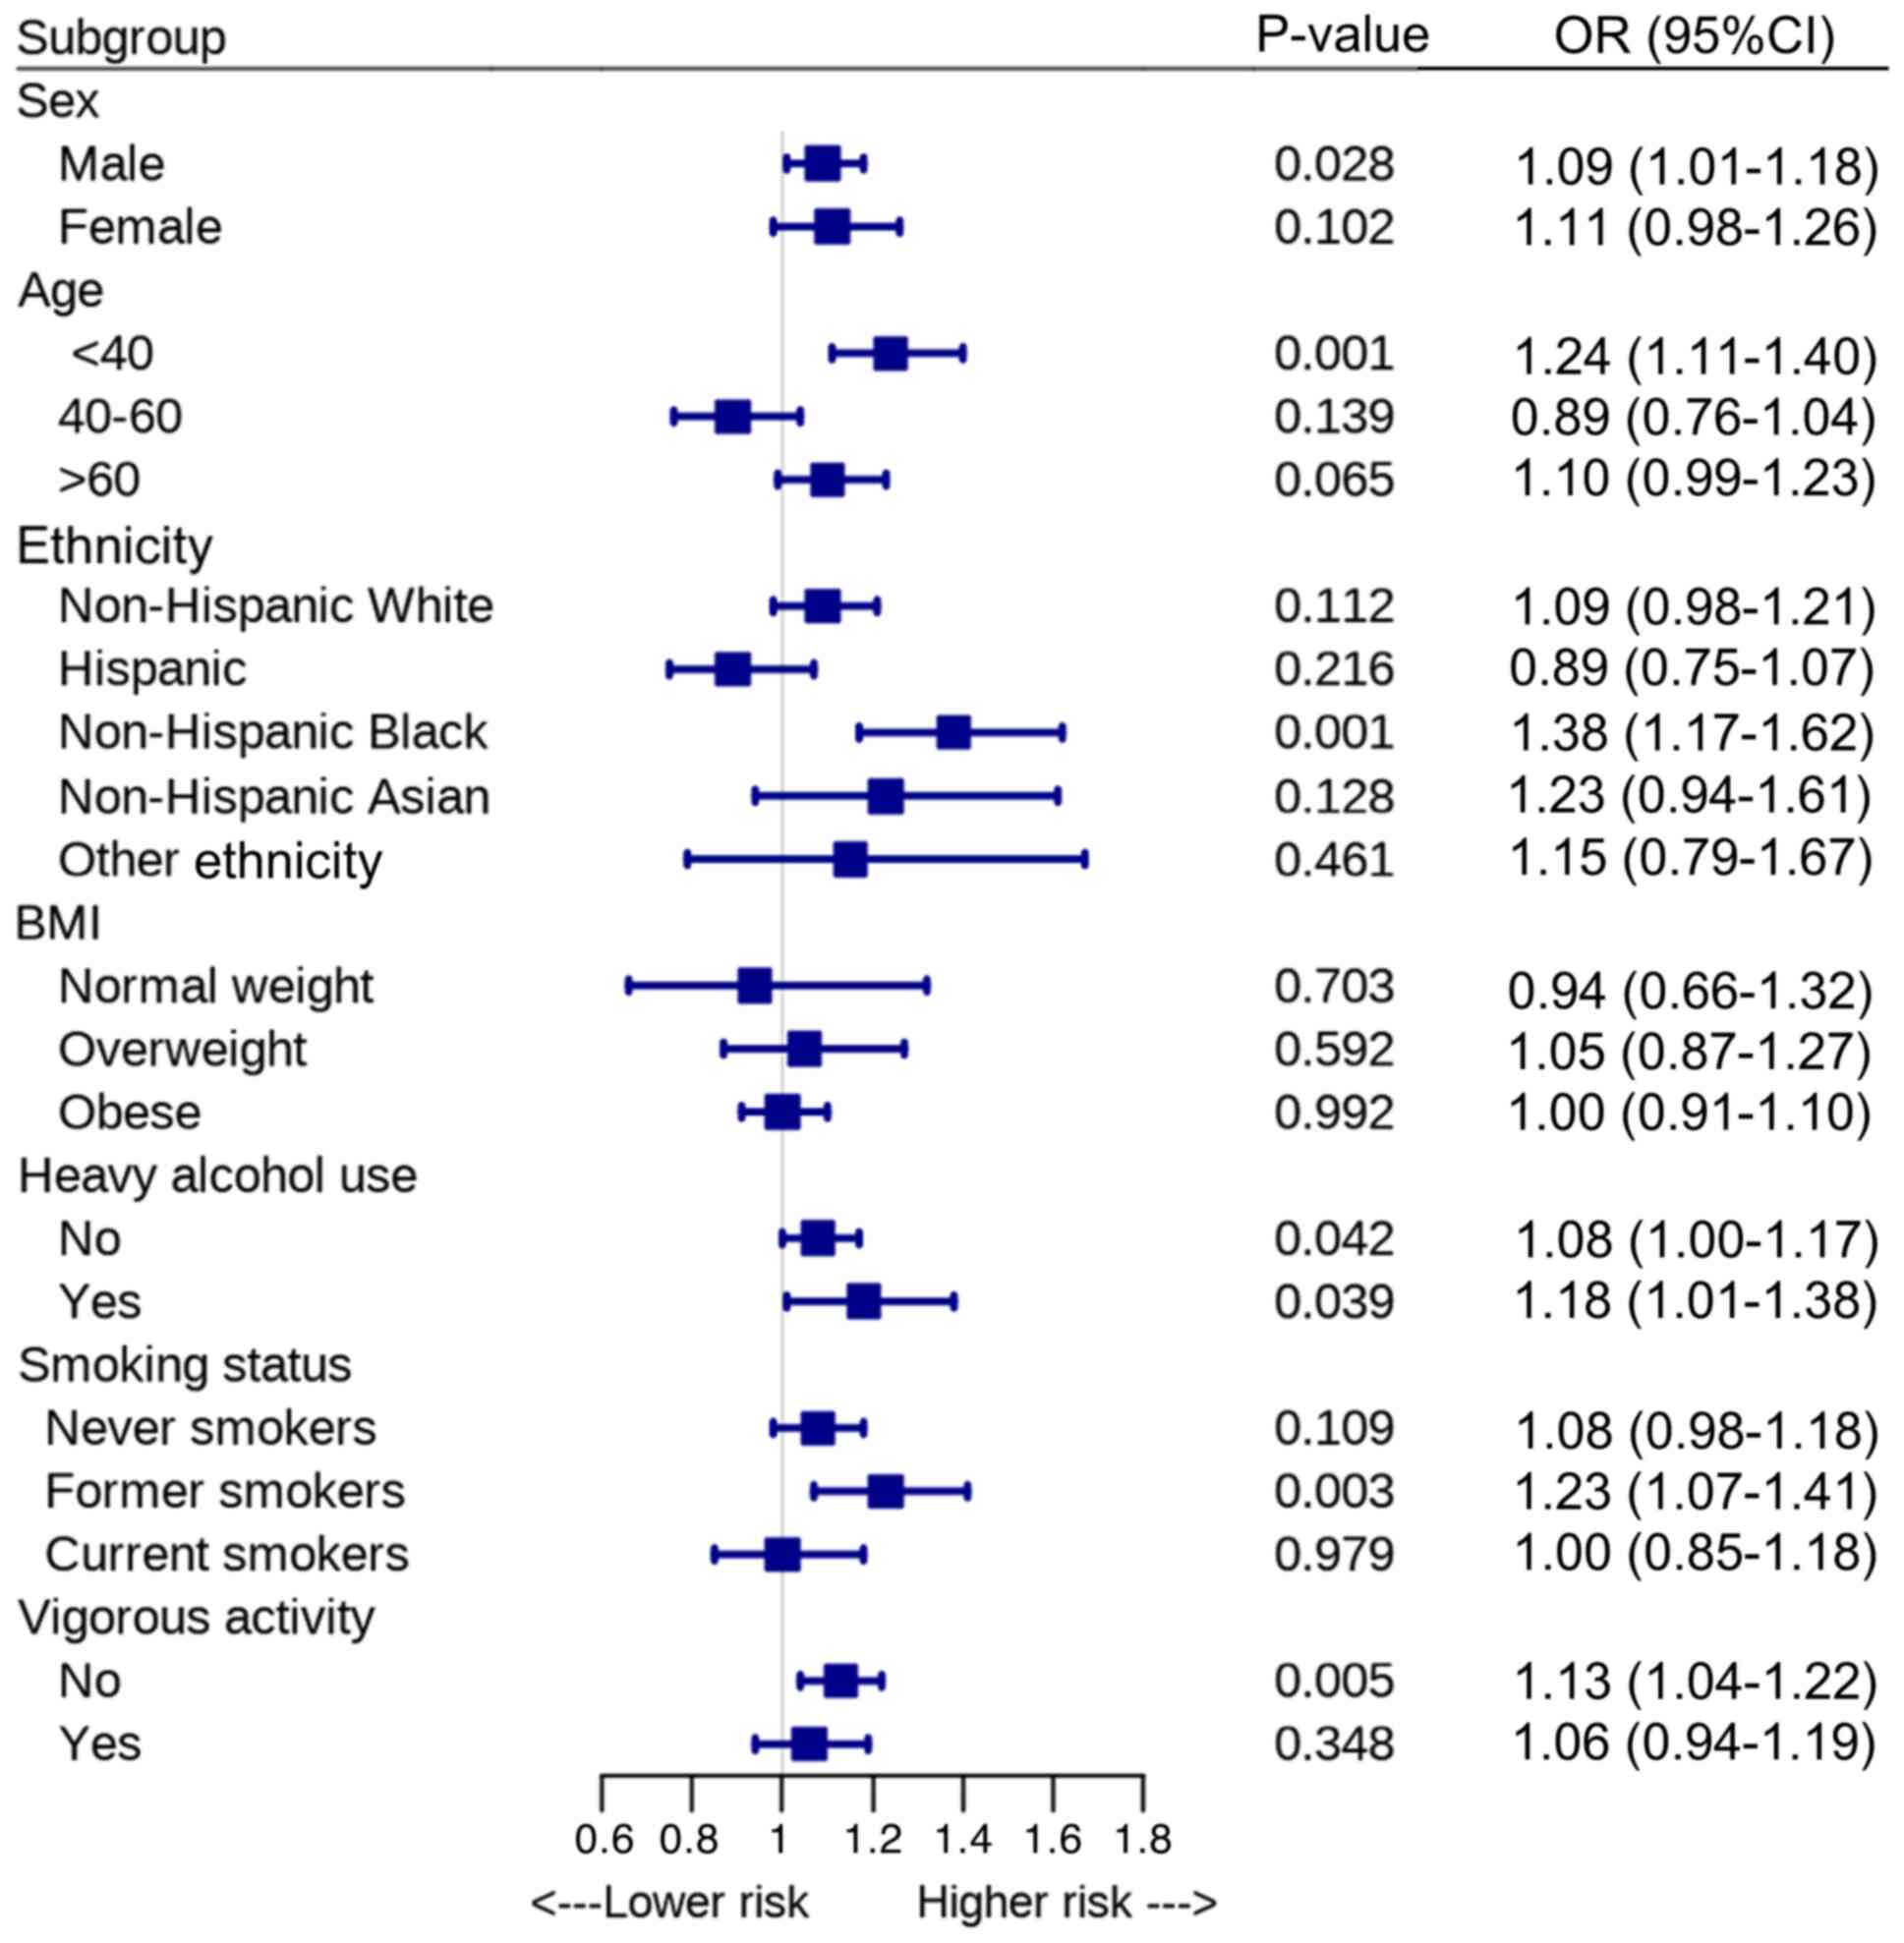
The robustness of the association between the NHHR
and advanced fibrosis was assessed through subgroup analysis
(Fig. 3). The results revealed
significant associations between the NHHR and advanced fibrosis
among men (OR, 1.09; 95% CI, 1.01-1.18; P=0.028), individuals aged
20-39 years (OR, 1.24; 95% CI, 1.11-1.40; P=0.001) and non-Hispanic
Black individuals (OR, 1.38; 95% CI, 1.17-1.62; P=0.001).
Furthermore, significant associations were observed in individuals
without heavy alcohol use (OR, 1.08; 95% CI, 1.00-1.17; P=0.042),
former smokers (OR, 1.23; 95% CI, 1.07-1.41; P=0.003) and those
without vigorous physical activity (OR, 1.13; 95% CI, 1.04-1.22;
P=0.005).
Using an LSM cut-off of ≥8.6 kPa to define
clinically significant fibrosis, the association between the NHHR
and clinically significant fibrosis remained statistically
significant (OR, 1.10; 95% CI, 1.03-1.16; P=0.003). To reduce the
influence of other factors contributing to hepatic steatosis, the
analysis was restricted to patients with NAFLD. In a logistic
regression sensitivity analysis, the NHHR was significantly
associated with advanced fibrosis in patients with NAFLD (OR, 1.08;
95% CI, 1.01-1.17; P=0.042) (Table
IV).
| Table IVSensitivity analyses of the
association between NHHR and advanced fibrosis or hepatic
steatosis. |
Table IV
Sensitivity analyses of the
association between NHHR and advanced fibrosis or hepatic
steatosis.
| Analysis | OR (95% CI) | P-value |
|---|
| Advanced
fibrosis | | |
|
LSM cut-off
of ≥8.6 kPa | 1.10
(1.03-1.16) | 0.003 |
|
Patients
with NAFLD | 1.08
(1.01-1.17) | 0.042 |
| Hepatic
steatosis | | |
|
CAP cut-off
value of ≥285 dB/m | 1.56
(1.49-1.63) | <0.001 |
|
Patients
with NAFLD | 1.55
(1.47-1.64) | <0.001 |
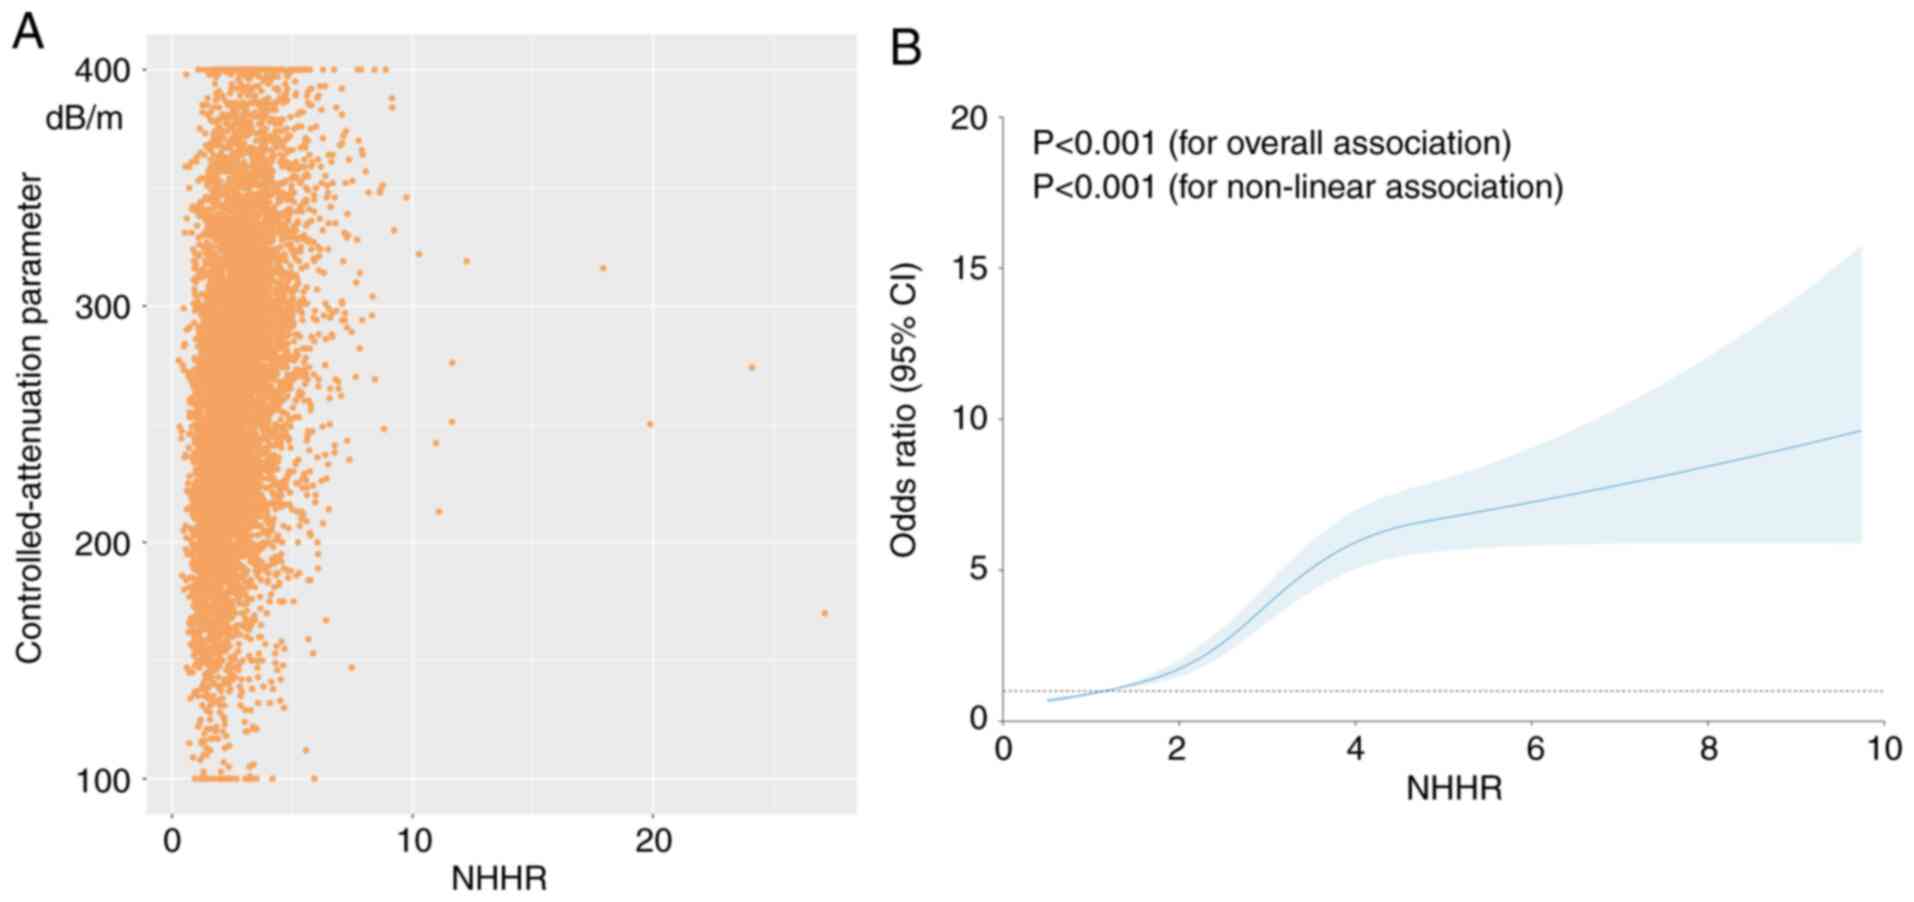
Association between the NHHR and
hepatic steatosis
The association between the NHHR and hepatic
steatosis is presented in Table V.
In the continuous model, the NHHR exhibited a significant
association with an increased risk of hepatic steatosis after full
adjustment for covariates (OR, 1.61; 95% CI, 1.53-1.68;
P<0.001). In the fully adjusted categorical model, compared with
the lowest Q reference, participants in the second, third and
fourth Qs had an OR of 1.60 (95% CI, 1.37-1.85; P<0.001), 2.91
(95% CI, 2.51-3.38; P<0.001) and 4.86 (95% CI, 4.17-5.67;
P<0.001) for hepatic steatosis risk, respectively, which
demonstrated a significant trend (P<0.001). The association
between the NHHR and hepatic steatosis is demonstrated in Fig. 4A. As shown in Fig. 4B, the NHHR was non-linearly linked
with the prevalence of hepatic steatosis (P<0.001 for
non-linearity). Utilizing biphasic linear models and recursive
algorithms, the present study identified an inflection point at an
NHHR value of 3.83 (Table III).
Below an NHHR of 3.83, there was a 96% increase in the likelihood
of developing hepatic steatosis per unit increase in the NHHR (OR,
1.96; 95% CI, 1.84-2.09; P<0.001). Conversely, NHHR values ≥3.83
were not significantly associated with the relative risk of hepatic
steatosis (OR, 1.07; 95% CI, 0.98-1.16; P=0.135).
| Table VAssociation between NHHR and hepatic
steatosis. |
Table V
Association between NHHR and hepatic
steatosis.
| | Model 1 | Model 2 | Model 3 |
|---|
| NHHR category | OR (95% CI) | P-value | OR (95% CI) | P-value | OR (95% CI) | P-value |
|---|
| NHHR total | 1.64
(1.56-1.71) | <0.001 | 1.59
(1.52-1.67) | <0.001 | 1.61
(1.53-1.68) | <0.001 |
| NHHR quartile | | | | | | |
|
Q1 | 1.00
(Reference) | | 1.00
(Reference) | | 1.00
(Reference) | |
|
Q2 | 1.68
(1.45-1.94) | <0.001 | 1.59
(1.37-1.85) | <0.001 | 1.60
(1.37-1.85) | <0.001 |
|
Q3 | 3.07
(2.66-3.55) | <0.001 | 2.88
(2.48-3.33) | <0.001 | 2.91
(2.51-3.38) | <0.001 |
|
Q4 | 5.18
(4.47-5.99) | <0.001 | 4.76
(4.09-5.55) | <0.001 | 4.86
(4.17-5.67) | <0.001 |
|
P-value for
trend | | <0.001 | | <0.001 | | <0.001 |
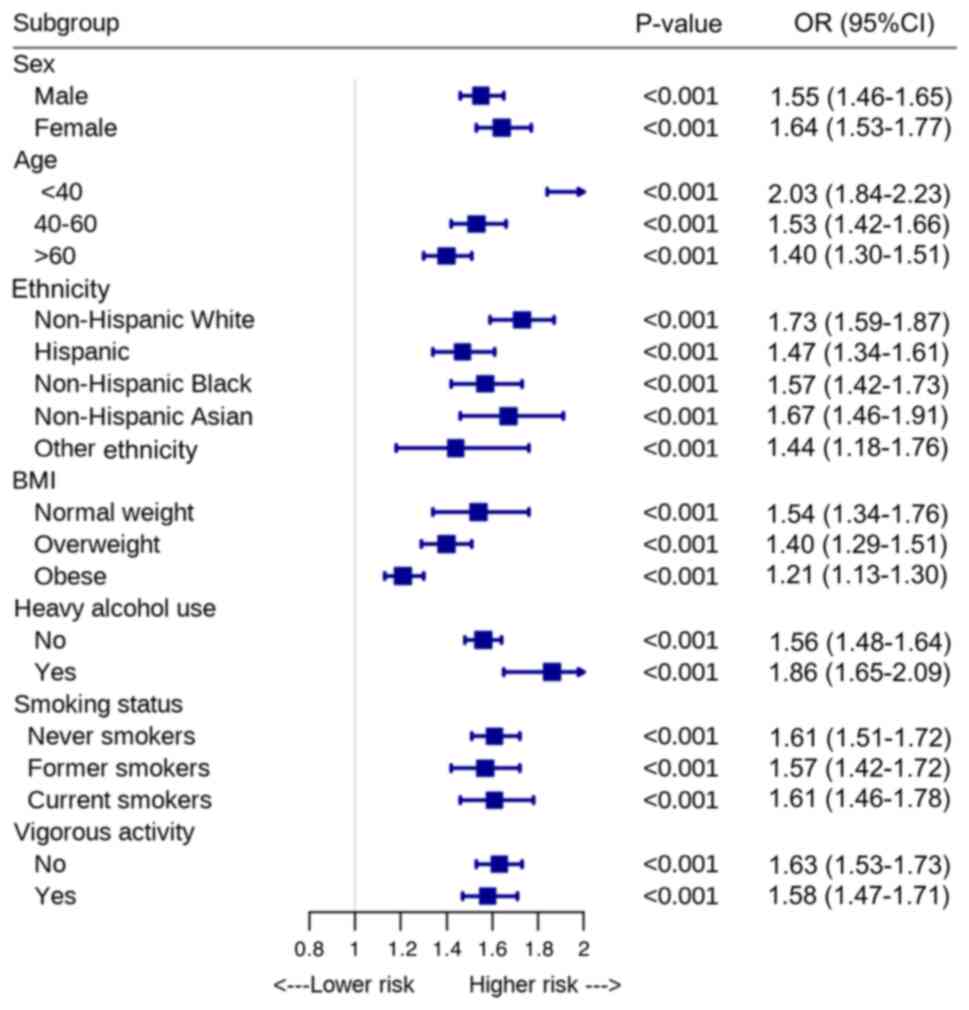
The subgroup analyses results are shown in Fig. 5. The NHHR exhibited a significant
association with hepatic steatosis across all subgroups, including
those stratified by age, sex, ethnicity, smoking status, alcohol
use and vigorous physical activity (all P<0.001).
Using a CAP cut-off of ≥285 dB/m to define hepatic
steatosis, the association between the NHHR and hepatic steatosis
was significant (OR, 1.56; 95% CI, 1.49-1.63; P<0.001). To
minimize the influence of other factors contributing to hepatic
steatosis, the analysis focused exclusively on patients with NAFLD.
In a logistic regression sensitivity analysis, the NHHR remained
significantly associated with hepatic steatosis in patients with
NAFLD (OR, 1.55; 95% CI, 1.47-1.64; P<0.001) (Table IV).
Discussion
Lipoprotein metabolism serves a crucial role in the
pathogenesis of NAFLD. The present study aimed to investigate the
potential associations between the NHHR and the presence of
advanced fibrosis and hepatic steatosis. Utilizing a nationally
representative sample of United States adults, it was observed that
an elevated NHHR was significantly associated with an increased
likelihood of advanced fibrosis. The RCS model demonstrated a
linear dose-response relationship between the NHHR and advanced
fibrosis. Additionally, the NHHR was significantly associated with
a higher risk of hepatic steatosis after adjusting for covariates.
An S-shaped relationship was identified between the NHHR and
hepatic steatosis, with an inflection point at 3.83. Given the use
of the NHANES design to obtain national estimates, these findings
are likely generalizable to the broader adult outpatient population
in the United States.
NAFLD encompasses a spectrum of pathological
features, ranging from the ectopic accumulation of triglycerides in
hepatocytes (hepatic steatosis) to inflammation and hepatocellular
injury, known as NASH. This condition can lead to fibrosis,
cirrhosis, end-stage liver disease or HCC (21). Dyslipidemia serves a crucial role in
the pathogenesis of NAFLD. The underlying metabolic mechanisms
reflect an imbalance in hepatic energy metabolism, where excess
energy, primarily from carbohydrates and fats, is stored as
triglycerides in the liver (22).
Adipocyte dysfunction also contributes to the development of NAFLD
(23). Severe forms of NAFLD and
NASH can occur as complications of congenital lipodystrophy, where
the absence of adipose tissue forces the liver to store excess
fatty acids, leading to notable insulin resistance (24). Increased visceral adipose tissue is
associated with hyperlipidemia, insulin resistance and NAFLD
(25). It is widely accepted that
visceral adipose tissue contributes to NAFLD and its metabolic
complications, partly due to a higher rate of lipolysis, which
typically occurs during conditions such as insulin resistance,
excess caloric intake, or inflammation. This increased lipolysis
may be mediated by interleukin-6 and results in an increased influx
of fatty acids to the liver, promoting hepatic steatosis, insulin
resistance and dyslipidemia (26).
Additionally, the gut microbiota influences hepatic triglyceride
metabolism by increasing endotoxin levels, affecting nutrient
absorption, and altering the composition and levels of metabolites
such as amino acids, fatty acids and bile acids (27).
Non-HDL-C represents cholesterol carried by
atherogenic particles containing apolipoprotein B, including
triglyceride-rich lipoproteins, such as low-density lipoprotein
cholesterol, intermediate-density lipoprotein cholesterol, very
low-density lipoprotein cholesterol and its remnants, chylomicrons
and lipoprotein (a). Guidelines emphasize the importance of
monitoring non-HDL-C levels, particularly in patients with
diabetes, obesity or metabolic syndrome, as these individuals
frequently exhibit elevated non-HDL-C and triglyceride levels,
along with reduced HDL-C levels, even when low-density
lipoprotein-cholesterol levels are not significantly elevated
(28,29). The value of non-HDL-C is obtained by
subtracting HDL-C from TC. This measurement is advantageous because
it is unaffected by fasting conditions and triglyceride
variability, making it a reliable indicator. On the other side, the
NHHR provides a more comprehensive assessment of lipid
dysregulation and offers a superior capacity for evaluating the
risk of lipid metabolism-related diseases.
The present study demonstrated that the NHHR is an
independent predictor of advanced fibrosis and hepatic steatosis.
The present findings are consistent with previous research and
contribute to the understanding of the causal relationship between
dyslipidemia and NAFLD. For example, Wang et al (30) revealed that the NHHR was associated
with an increased risk of NAFLD, with a hazard ratio (HR) of 2.66
(95% CI, 1.13-6.24; P=0.025) in women and an HR of 2.11 (95% CI,
1.15-3.90; P=0.016) in men, demonstrating that the NHHR was a
stronger predictor than non-HDL-C in the Chinese population.
Similarly, Yang et al (14)
reported that the prevalence of NAFLD was positively associated
with the NHHR, with an OR of 8.61 (95% CI, 5.90-12.57; P<0.001)
in the highest NHHR tertile compared with the lowest tertile.
However, a small number of studies have explored the association
between the NHHR and advanced fibrosis.
The present study has a number of strengths. First,
to the best of our knowledge, this is the first study to examine
the potential association of the NHHR with advanced fibrosis and
hepatic steatosis as estimated by VCTE, which allows for a more
accurate assessment of hepatic fibrosis and steatosis. Furthermore,
since the selection of LSM and CAP thresholds may influence
diagnostic performance, sensitivity analyses were conducted using
different LSM and CAP thresholds to demonstrate a strong
association of the NHHR with advanced fibrosis and hepatic
steatosis. This suggested that the original findings were not
overly dependent on a specific threshold, reinforcing the
reliability and consistency of the association across different
sensitivity analyses. Second, the present study sample was
nationally representative, and all participants had comprehensive
data. This broad representation enhanced the generalizability of
the present findings and permitted robust subgroup analyses with
high statistical power. Additionally, the study employed rigorous
exclusion criteria and effectively controlled potential confounding
factors by collecting comprehensive data on various lifestyle
factors.
Several limitations of the present study should be
acknowledged. First, advanced fibrosis and hepatic steatosis were
diagnosed using VCTE rather than liver histopathology. Although
VCTE is widely recognized as an accurate and reliable tool for
detecting advanced fibrosis and hepatic steatosis, certain
inaccuracies in the diagnosis may not be excluded. Second, the
cross-sectional nature of the present analysis precludes
establishing causality or identifying associations with clinical
outcomes. Longitudinal and interventional studies are necessary to
address this limitation. Third, although numerous potential
confounding variables were adjusted for, residual and unmeasured
confounding factors could not be entirely ruled out.
In conclusion, the present findings demonstrated a
strong association of the NHHR with advanced fibrosis and hepatic
steatosis. The NHHR may serve as a simple and effective
anthropometric index for predicting these conditions. However,
further large-scale prospective studies are necessary to validate
the present results in different nations and ethnic groups.
Acknowledgements
Not applicable.
Funding
Funding: No funding was received.
Availability of data and materials
The data generated in the present study may be
requested from the corresponding author.
Authors' contributions
LH and YS designed the study, performed the
statistical analysis, and drafted the manuscript. XL collected and
reviewed the clinical data. XX revised the manuscript and was
responsible for the study conception, design, data collection and
analysis. LH and XX confirm the authenticity of all the raw data.
All authors read and approved the final manuscript.
Ethics approval and consent to
participate
Not applicable.
Patient consent for publication
Not applicable.
Competing interests
The authors declare that they have no competing
interests.
References
|
1
|
Estes C, Razavi H, Loomba R, Younossi Z
and Sanyal AJ: Modeling the epidemic of nonalcoholic fatty liver
disease demonstrates an exponential increase in burden of disease.
Hepatology. 67:123–133. 2018.PubMed/NCBI View Article : Google Scholar
|
|
2
|
Le P, Chaitoff A, Rothberg MB, McCullough
A, Gupta NM and Alkhouri N: Population-based trends in prevalence
of nonalcoholic fatty liver disease in US adults with type 2
diabetes. Clin Gastroenterol Hepatol. 17:2377–2378. 2019.PubMed/NCBI View Article : Google Scholar
|
|
3
|
European Association for the Study of the
Liver (EASL); European Association for the Study of Diabetes
(EASD); European Association for the Study of Obesity (EASO).
EASL-EASD-EASO clinical practice guidelines on the management of
metabolic dysfunction-associated steatotic liver disease (MASLD). J
Hepatol. 81:492–542. 2024.PubMed/NCBI View Article : Google Scholar
|
|
4
|
Rinella ME, Neuschwander-Tetri BA,
Siddiqui MS, Abdelmalek MF, Caldwell S, Barb D, Kleiner DE and
Loomba R: AASLD practice guidance on the clinical assessment and
management of nonalcoholic fatty liver disease. Hepatology.
77:1797–1835. 2023.PubMed/NCBI View Article : Google Scholar
|
|
5
|
European Association for the Study of the
Liver; Clinical Practice Guideline Panel; Chair:; EASL Governing
Board representative:; Panel members. EASL clinical practice
guidelines on non-invasive tests for evaluation of liver disease
severity and prognosis-2021 update. J Hepatol. 75:659–689.
2021.PubMed/NCBI View Article : Google Scholar
|
|
6
|
Eddowes PJ, Sasso M, Allison M, Tsochatzis
E, Anstee QM, Sheridan D, Guha IN, Cobbold JF, Deeks JJ, Paradis V,
et al: Accuracy of fibroscan controlled attenuation parameter and
liver stiffness measurement in assessing steatosis and fibrosis in
patients with nonalcoholic fatty liver disease. Gastroenterology.
156:1717–1730. 2019.PubMed/NCBI View Article : Google Scholar
|
|
7
|
Vilar-Gomez E, Vuppalanchi R, Gawrieh S,
Samala N and Chalasani N: CAP and LSM as determined by VCTE are
independent predictors of all-cause mortality in the US adult
population. Hepatology. 77:1241–1252. 2023.PubMed/NCBI View Article : Google Scholar
|
|
8
|
Yu H, Huang Y, Li M, Jiang H, Yang B, Xi
X, Smayi A, Wu B and Yang Y: Prognostic significance of dynamic
changes in liver stiffness measurement in patients with chronic
hepatitis B and compensated advanced chronic liver disease. J
Gastroenterol Hepatol. 39:2169–2181. 2024.PubMed/NCBI View Article : Google Scholar
|
|
9
|
Hong H, He Y, Gong Z, Feng J and Qu Y: The
association between non-high-density lipoprotein cholesterol to
high-density lipoprotein cholesterol ratio (NHHR) and kidney
stones: A cross-sectional study. Lipids Health Dis.
23(102)2024.PubMed/NCBI View Article : Google Scholar
|
|
10
|
Lin W, Luo S, Li W, Liu J, Zhou T, Yang F,
Zhou D, Liu Y, Huang W, Feng Y and Luo J: Association between the
non-HDL-cholesterol to HDL- cholesterol ratio and abdominal aortic
aneurysm from a Chinese screening program. Lipids Health Dis.
22(187)2023.PubMed/NCBI View Article : Google Scholar
|
|
11
|
Tan MY, Weng L, Yang ZH, Zhu SX, Wu S and
Su JH: The association between non-high-density lipoprotein
cholesterol to high-density lipoprotein cholesterol ratio with type
2 diabetes mellitus: Recent findings from NHANES 2007-2018. Lipids
Health Dis. 23(151)2024.PubMed/NCBI View Article : Google Scholar
|
|
12
|
Hou K, Song W, He J and Ma Z: The
association between non-high-density lipoprotein cholesterol to
high-density lipoprotein cholesterol ratio (NHHR) and prevalence of
periodontitis among US adults: A cross-sectional NHANES study. Sci
Rep. 14(5558)2024.PubMed/NCBI View Article : Google Scholar
|
|
13
|
Qi X, Wang S, Huang Q, Chen X, Qiu L,
Ouyang K and Chen Y: The association between non-high-density
lipoprotein cholesterol to high-density lipoprotein cholesterol
ratio (NHHR) and risk of depression among US adults: A
cross-sectional NHANES study. J Affect Disord. 344:451–457.
2024.PubMed/NCBI View Article : Google Scholar
|
|
14
|
Yang S, Zhong J, Ye M, Miao L, Lu G, Xu C,
Xue Z and Zhou X: Association between the non-HDL-cholesterol to
HDL-cholesterol ratio and non-alcoholic fatty liver disease in
Chinese children and adolescents: A large single-center
cross-sectional study. Lipids Health Dis. 19(242)2020.PubMed/NCBI View Article : Google Scholar
|
|
15
|
Ciardullo S and Perseghin G: Statin use is
associated with lower prevalence of advanced liver fibrosis in
patients with type 2 diabetes. Metabolism.
121(154752)2021.PubMed/NCBI View Article : Google Scholar
|
|
16
|
Vilar-Gomez E, Nephew LD, Vuppalanchi R,
Gawrieh S, Mladenovic A, Pike F, Samala N and Chalasani N:
High-quality diet, physical activity, and college education are
associated with low risk of NAFLD among the US population.
Hepatology. 75:1491–1506. 2022.PubMed/NCBI View Article : Google Scholar
|
|
17
|
Yu H, Li M, Yang B, Sun H, Jiang H, Liang
Z, Smayi A, Wu B and Yang Y: Proton pump inhibitor use is
associated with increased liver steatosis. Biomed Rep.
21(116)2024.PubMed/NCBI View Article : Google Scholar
|
|
18
|
Leung CW and Tapper EB: Sugar-sweetened
beverages are associated with increased liver stiffness and
steatosis among apparently healthy adults in the United States.
Clin Gastroenterol Hepatol. 20:959–961.e1. 2022.PubMed/NCBI View Article : Google Scholar
|
|
19
|
Ruan Z, Lu T, Chen Y, Yuan M, Yu H, Liu R
and Xie X: Association between psoriasis and nonalcoholic fatty
liver disease among outpatient US adults. JAMA Dermatol.
158:745–753. 2022.PubMed/NCBI View Article : Google Scholar
|
|
20
|
Siddiqui MS, Vuppalanchi R, Van Natta ML,
Hallinan E, Kowdley KV, Abdelmalek M, Neuschwander-Tetri BA, Loomba
R, Dasarathy S, Brandman D, et al: Vibration-Controlled transient
elastography to assess fibrosis and steatosis in patients with
nonalcoholic fatty liver disease. Clin Gastroenterol Hepatol.
17:156–163.e2. 2019.PubMed/NCBI View Article : Google Scholar
|
|
21
|
Rinella ME, Lazarus JV, Ratziu V, Francque
SM, Sanyal AJ, Kanwal F, Romero D, Abdelmalek MF, Anstee QM, Arab
JP, et al: A multisociety Delphi consensus statement on new fatty
liver disease nomenclature. Ann Hepatol. 29(101133)2024.PubMed/NCBI View Article : Google Scholar
|
|
22
|
Loomba R, Friedman SL and Shulman GI:
Mechanisms and disease consequences of nonalcoholic fatty liver
disease. Cell. 184:2537–2564. 2021.PubMed/NCBI View Article : Google Scholar
|
|
23
|
Lotta LA, Gulati P, Day FR, Payne F, Ongen
H, van de Bunt M, Gaulton KJ, Eicher JD, Sharp SJ, Luan J, et al:
Integrative genomic analysis implicates limited peripheral adipose
storage capacity in the pathogenesis of human insulin resistance.
Nat Genet. 49:17–26. 2017.PubMed/NCBI View
Article : Google Scholar
|
|
24
|
Petersen KF, Oral EA, Dufour S, Befroy D,
Ariyan C, Yu C, Cline GW, DePaoli AM, Taylor SI, Gorden P and
Shulman GI: Leptin reverses insulin resistance and hepatic
steatosis in patients with severe lipodystrophy. J Clin Invest.
109:1345–1350. 2002.PubMed/NCBI View
Article : Google Scholar
|
|
25
|
Kelley DE, McKolanis TM, Hegazi RA, Kuller
LH and Kalhan SC: Fatty liver in type 2 diabetes mellitus: Relation
to regional adiposity, fatty acids, and insulin resistance. Am J
Physiol Endocrinol Metab. 285:E906–E916. 2003.PubMed/NCBI View Article : Google Scholar
|
|
26
|
Wueest S, Item F, Lucchini FC, Challa TD,
Müller W, Blüher M and Konrad D: Mesenteric fat lipolysis mediates
obesity-associated hepatic steatosis and insulin resistance.
Diabetes. 65:140–148. 2016.PubMed/NCBI View Article : Google Scholar
|
|
27
|
Caussy C, Tripathi A, Humphrey G,
Bassirian S, Singh S, Faulkner C, Bettencourt R, Rizo E, Richards
L, Xu ZZ, et al: A gut microbiome signature for cirrhosis due to
nonalcoholic fatty liver disease. Nat Commun.
10(1406)2019.PubMed/NCBI View Article : Google Scholar
|
|
28
|
Mach F, Baigent C, Catapano AL, Koskinas
KC, Casula M, Badimon L, Chapman MJ, De Backer GG, Delgado V,
Ference BA, et al: 2019 ESC/EAS guidelines for the management of
dyslipidaemias: Lipid modification to reduce cardiovascular risk.
Eur Heart J. 41:111–188. 2020.PubMed/NCBI View Article : Google Scholar
|
|
29
|
Garber AJ, Abrahamson MJ, Barzilay JI,
Blonde L, Bloomgarden ZT, Bush MA, Dagogo-Jack S, DeFronzo RA,
Einhorn D, Fonseca VA, et al: Consensus statement by the American
Association of Clinical Endocrinologists and American College Of
Endocrinology on the comprehensive type 2 diabetes management
algorithm-2019 executive summary. Endocr Pract. 25:69–100.
2019.PubMed/NCBI View Article : Google Scholar
|
|
30
|
Wang K, Shan S, Zheng H, Zhao X, Chen C
and Liu C: Non-HDL-cholesterol to HDL-cholesterol ratio is a better
predictor of new-onset non-alcoholic fatty liver disease than
non-HDL-cholesterol: A cohort study. Lipids Health Dis.
17(196)2018.PubMed/NCBI View Article : Google Scholar
|