Introduction
Hepatocellular carcinoma (HCC) is one of the most
common malignant neoplasms worldwide (1). Its incidence is particularly high in
China (2) on account of hepatitis B
(HBV) and C (HCV) infection. However, in the western world, HCC is
primarily due to non-alcoholic fatty liver disease (NAFLD)
(3,4). The aggressive nature of this malignancy
combined with the limited therapeutic options result in poor
prognosis (1,5). Unfortunately, HCC has a high recurrence
rate even with successful surgical removal because of the
insensitivity of HCC to chemotherapy agents and radiotherapy
(6). Although there have been
extensive previous studies on the molecular mechanism of HCC
formation and progression, the causes of HCC are not yet clear.
Hence, owing to the high morbidity and mortality in HCC, it is very
important to determine the underlying molecular mechanisms and
pathological processes and identify suitable molecular biomarkers
for early HCC diagnosis.
While HCC is a highly heterogeneous tumor, with
different genetic compositions and multifaceted molecular
pathogenesis (7,8), it is also a slow process during which
plenty of genomic alterations accumulate and change the
hepatocellular phenotype, leading to cellular intermediates and
multiple monoclonal that evolve into HCC (9,10).
Microarray technology has become an indispensable tool to monitor
genome wide expression levels of genes in a given organism. Gene
Expression Omnibus (GEO) and The Cancer Genome Atlas (TCGA) are two
public functional genomics data repositories accepting data from
diverse microarray platforms (11).
Nowadays, gene expression studies by microarray have been performed
to uncover molecular variations in HCC (12–14).
Pathway analysis has shown several important cellular signaling
pathway alterations to be linked with the main pathogenic mechanism
(8). A small number of hub genes
(proteins) were identified as key modulators in HCC metastasis by
using protein-protein interaction (PPI) network. However, the most
significantly dysregulated genes from previous studies are
inconsistent because of the sample heterogeneity in independent
studies, small sample size, and different statistical methods.
In the present study, four original microarray
datasets GSE25097, GSE45267, GSE57957, and GSE62232 were downloaded
from the NCBI-Gene Expression Omnibus database (NCBI-GEO)
(available online: https://www.ncbi.nlm.nih.gov/geo/), and included 436
HCC and 94 normal liver tissues. The microarray data was normalized
and preprocessed using the robust multi-array average algorithm
(RMA). The differentially expressed genes (DEGs) were obtained
using the limma package. Venny was applied to filter the
overlapping DEGs among groups. Gene ontology (GO) and pathway
enrichment analysis were also performed for annotation and
visualization with DAVID and KEGG PATHWAY (Available online:
http://www.genome.jp/kegg). We used the STRING
online database (Available online: http://string-db.org) to annotate functional
interactions of DEGs. The most significant module was selected from
PPI, and 15 important hub genes were identified. The sub-networks
of hub genes were involved in cell division, p53 signaling and
HTLV-I infection signaling pathways.
Materials and methods
Microarray data information and data
preprocessing
The microarray data from GSE25097, GSE45267,
GSE57957, and GSE62232 were downloaded from the GEO database
(http://www.ncbi.nlm.nih.gov/geo/). The
microarray data of GSE25097 was based on GPL10687 platforms
(Rosetta/Merck Human RSTA Affymetrix 1.0 microarray, Custom CDF;
Affymetrix Inc., Santa Clara, CA, USA). The microarray data of
GSE45267 was based on GPL570 platforms (HG-U133_Plus_2, Affymetrix
Human Genome U133 Plus 2.0 Array). The microarray data of GSE57957
was based on GPL10558 platforms (Illumina HumanHT-12 v4.0
expression beadchip). The microarray data of GSE62232 was based on
GPL570 platforms (HG-U133_Plus_2, Affymetrix Human Genome U133 Plus
2.0 Array). We chose these four datasets for integrated analysis,
because they represented different racial populations. The
microarray data was preprocessed using the RMA with the Affy and
limma package in Bioconductor (v1.46.1; http://www.bioconductor.org/). Background correction,
normalization, and calculation of expression were all included in
the preprocessing stage. The microarray data probe was transformed
to gene symbols with Bioconductor Annotation Data software
packages. If several probes were mapped to one gene symbol, the
mean value was set as the final expression value of this gene. The
DEGs in every group were analyzed using the limma package. In
Bioconductor. The DEG P-values were calculated using the unpaired
or paired Student's t-test provided by the limma package. P<0.01
and [logFC]>1 were used as cut-off criterion for DEGs.
Hierarchical clustering analysis of the DEGs was then performed and
visualized using g-plots in the R package. Venny is an interactive
tool used to compare lists with Venn diagrams. The intersections of
upregulated and downregulated genes in different sample groups were
respectively analyzed using Venny v2.0.
GO and pathway enrichment
analysis
Candidate DEG functions and pathway enrichment were
analyzed using multiple online databases; among them, DAVID is a
website with gene annotation, visualization, and integrated
discovery function, and can thus provide gene biological meaning.
GO analysis and pathway analysis were carried out using the KEGG
PATHWAY (available online: http://www.genome.jp/kegg), Reactome (available
online: http://www.reactome.org), and GO
website, with P<0.01 as the cut-off criterion (15,16).
Integration of protein-protein
interaction (PPI) network, modular analysis and significant
candidate genes and pathway identification
First, online database STRING (available online:
http://string-db.org) was employed to develop
DEGs-encoded proteins and protein-protein interaction network
(PPI). Second, the Cytoscape software (17) was utilized to construct a protein
interaction relationship network and analyze the interaction
relationship of the candidate DEGs encoding proteins in colon
cancer. Third, the Network Analyzer plug-in was used to calculate
the node degree, i.e., the numbers of inter-connections to filter
the hub genes of PPI. The corresponding proteins in the central
nodes might be the core proteins and key candidate genes that have
important physiological regulatory functions. The cBio Cancer
Genomics Portal (http://cbioportal.org) is an open platform for
exploring multidimensional cancer genomics data by encapsulating
molecular profiling data obtained from cancer tissue and cell lines
into readily understandable genetic, epigenetic, gene expression,
and proteomic events. Complex cancer genomic profiles can be easily
accessed using the query interface of the portal enabling
researchers to explore and compare genetic alterations across
samples. The underlying data thus obtained can be linked to
clinical outcomes to facilitate novel discovery in biological
systems. Through use of the portal search function, identified DEG
candidate genes are classified as altered or not altered. The
genomics datasets are then presented using OncoPrint as heatmaps-a
visually appealing display of alterations in gene arrays across
tumor samples.
Results
Identification of DEGs in HCC
NCBI-GEO is a public functional genomics data
repository accepting data from diverse microarray platforms, from
which gene expression profiles of HCC and normal or adjacent liver
tissue from the GSE25097, GSE45267, GSE57957, and GSE62232
databases were obtained. The microarray data of GSE25097 had 268
HCC tissues and 6 normal liver tissues (18); the GSE62232 data had 81 HCC tissues
and 10 normal liver tissues (12);
the GSE45267 data included 48 HCC tissues and 39 healthy liver
tissues; and the GSE57957 data had 39 pairs of HCC tissues and
matched paraneoplastic tissue (19).
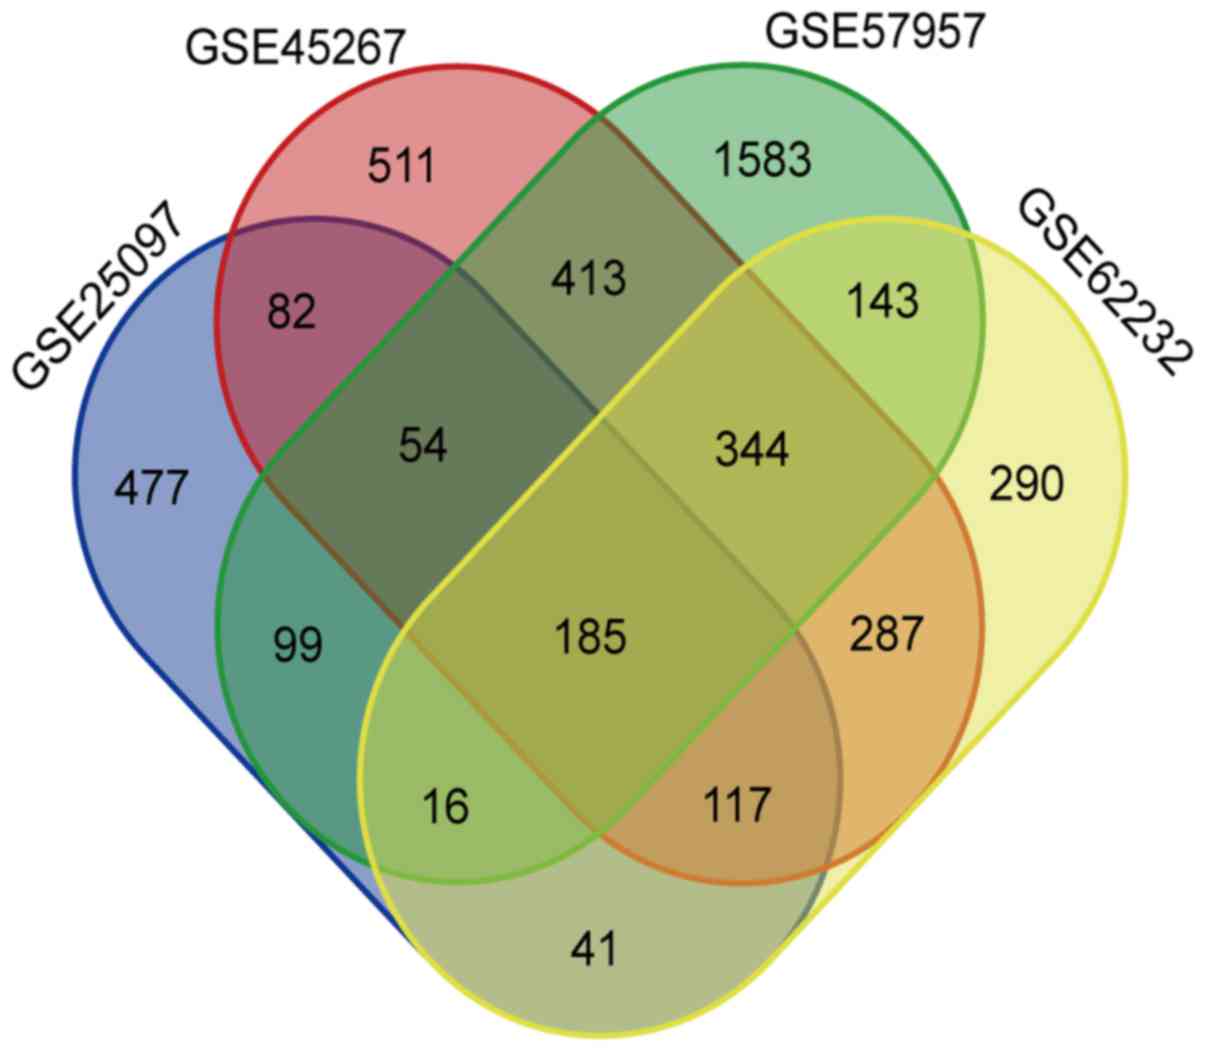
Using P<0.01 and [logFC]>1 as cut-off criterion, we extracted
1072, 1850, 4055, and 1876 DEGs from the expression profile
datasets GSE25097, GSE45267, GSE57957, and GSE62232, respectively.
In total, 185 overlapping DEGs were identified in HCC (Fig. 1). However, when we determined the
intersections of upregulated and downregulated genes in four sample
groups using Venny, one gene was excluded because of it's
contradictory expression in different groups. So, we ultimately
identified 92 upregulated genes and 92 downregulated genes
(Table I).
 | Table I.Up and downregulated DEGs. |
Table I.
Up and downregulated DEGs.
| DEGs | Genes name |
|---|
| Upregulated | TPX2 GPSM2 IGSF3
CCDC34 ZIC2 ANLN SMYD3 RACGAP1 NUP37 SULT1C2 AURKA ATP6V1C1 TTC13
KIF4A THY1 SQLE MCM5 TMEM106C MELK ZWINT OIP5 PTTG1 TARBP1 STMN1
UBE2T CKS2 TP53I3 SLC38A6 TBCE CCNB2 MCM7 PRC1 CEP55 CCNE2 MTHFD1L
MCM2 MCM4 CNIH4 DLGAP5 RAD51AP1 RAP2A COL4A1 GPC3 CDKN2C PLVAP PIGC
C8orf33 DTNA NEK2 FANCD2 RFX5 COL15A1 GSTA4 ERMP1 MCM3 PCNA CENPA
CDC20 RFC4 BUB1 PBK RFXANK TRIP13 PDCD2 P4HA2 SMC2 TMEM9 ASPM CDCA3
ATAD2 PEA15 UBE2C STXBP6 MICB MDK TOP2A TUBG1 RNASEH2A CAP2 FAM83D
HMMR MCM6 GMNN KIF20A SAE1 CDKN2A TTK CDKN3 E2F3 NCAPG FDPS
NUSAP1 |
| Downregulated | CYP26A1 IGF1 C1RL
SORL1 CYP2C19 GHR CLEC1B STARD5 SHBG ATOH8 CPEB3 CRHBP QKI DBH
SRD5A2 ADRA1A PLSCR4 RCAN1 CLEC4M ESR1 GCH1 FOXO1 APOF PDE7B GREM2
TTC36 CXCL2 LYVE1 ASPG NAAA NAT2 NCOR1 GCKR OIT3 CETP SRPX MT1F
KCNN2 GSTZ1 OLFML3 CNDP1 CCBE1 MASP1 FOSB MARCO LCAT RSPO3 HAMP
STAB2 HGFAC SLC4A4 PZP C1QTNF1 CXCL14 MBNL2 EFHD1 IGFALS MT1M
ANTXR2 ECM1 FCN2 CHST4 MAN1C1 ST3GAL6 KBTBD11 PCK1 RND3 IL1RAP
TMEM27 MT1X AADAT ACADS RNF165 CYP1A2 LPA LIFR EXPH5 COLEC10 PAMR1
CXCL12 LARP1B ANGPTL6 MSRA SOCS2 SARDH LY6E FCN3 CLEC4G VIPR1 LHX2
DHODH PTH1R |
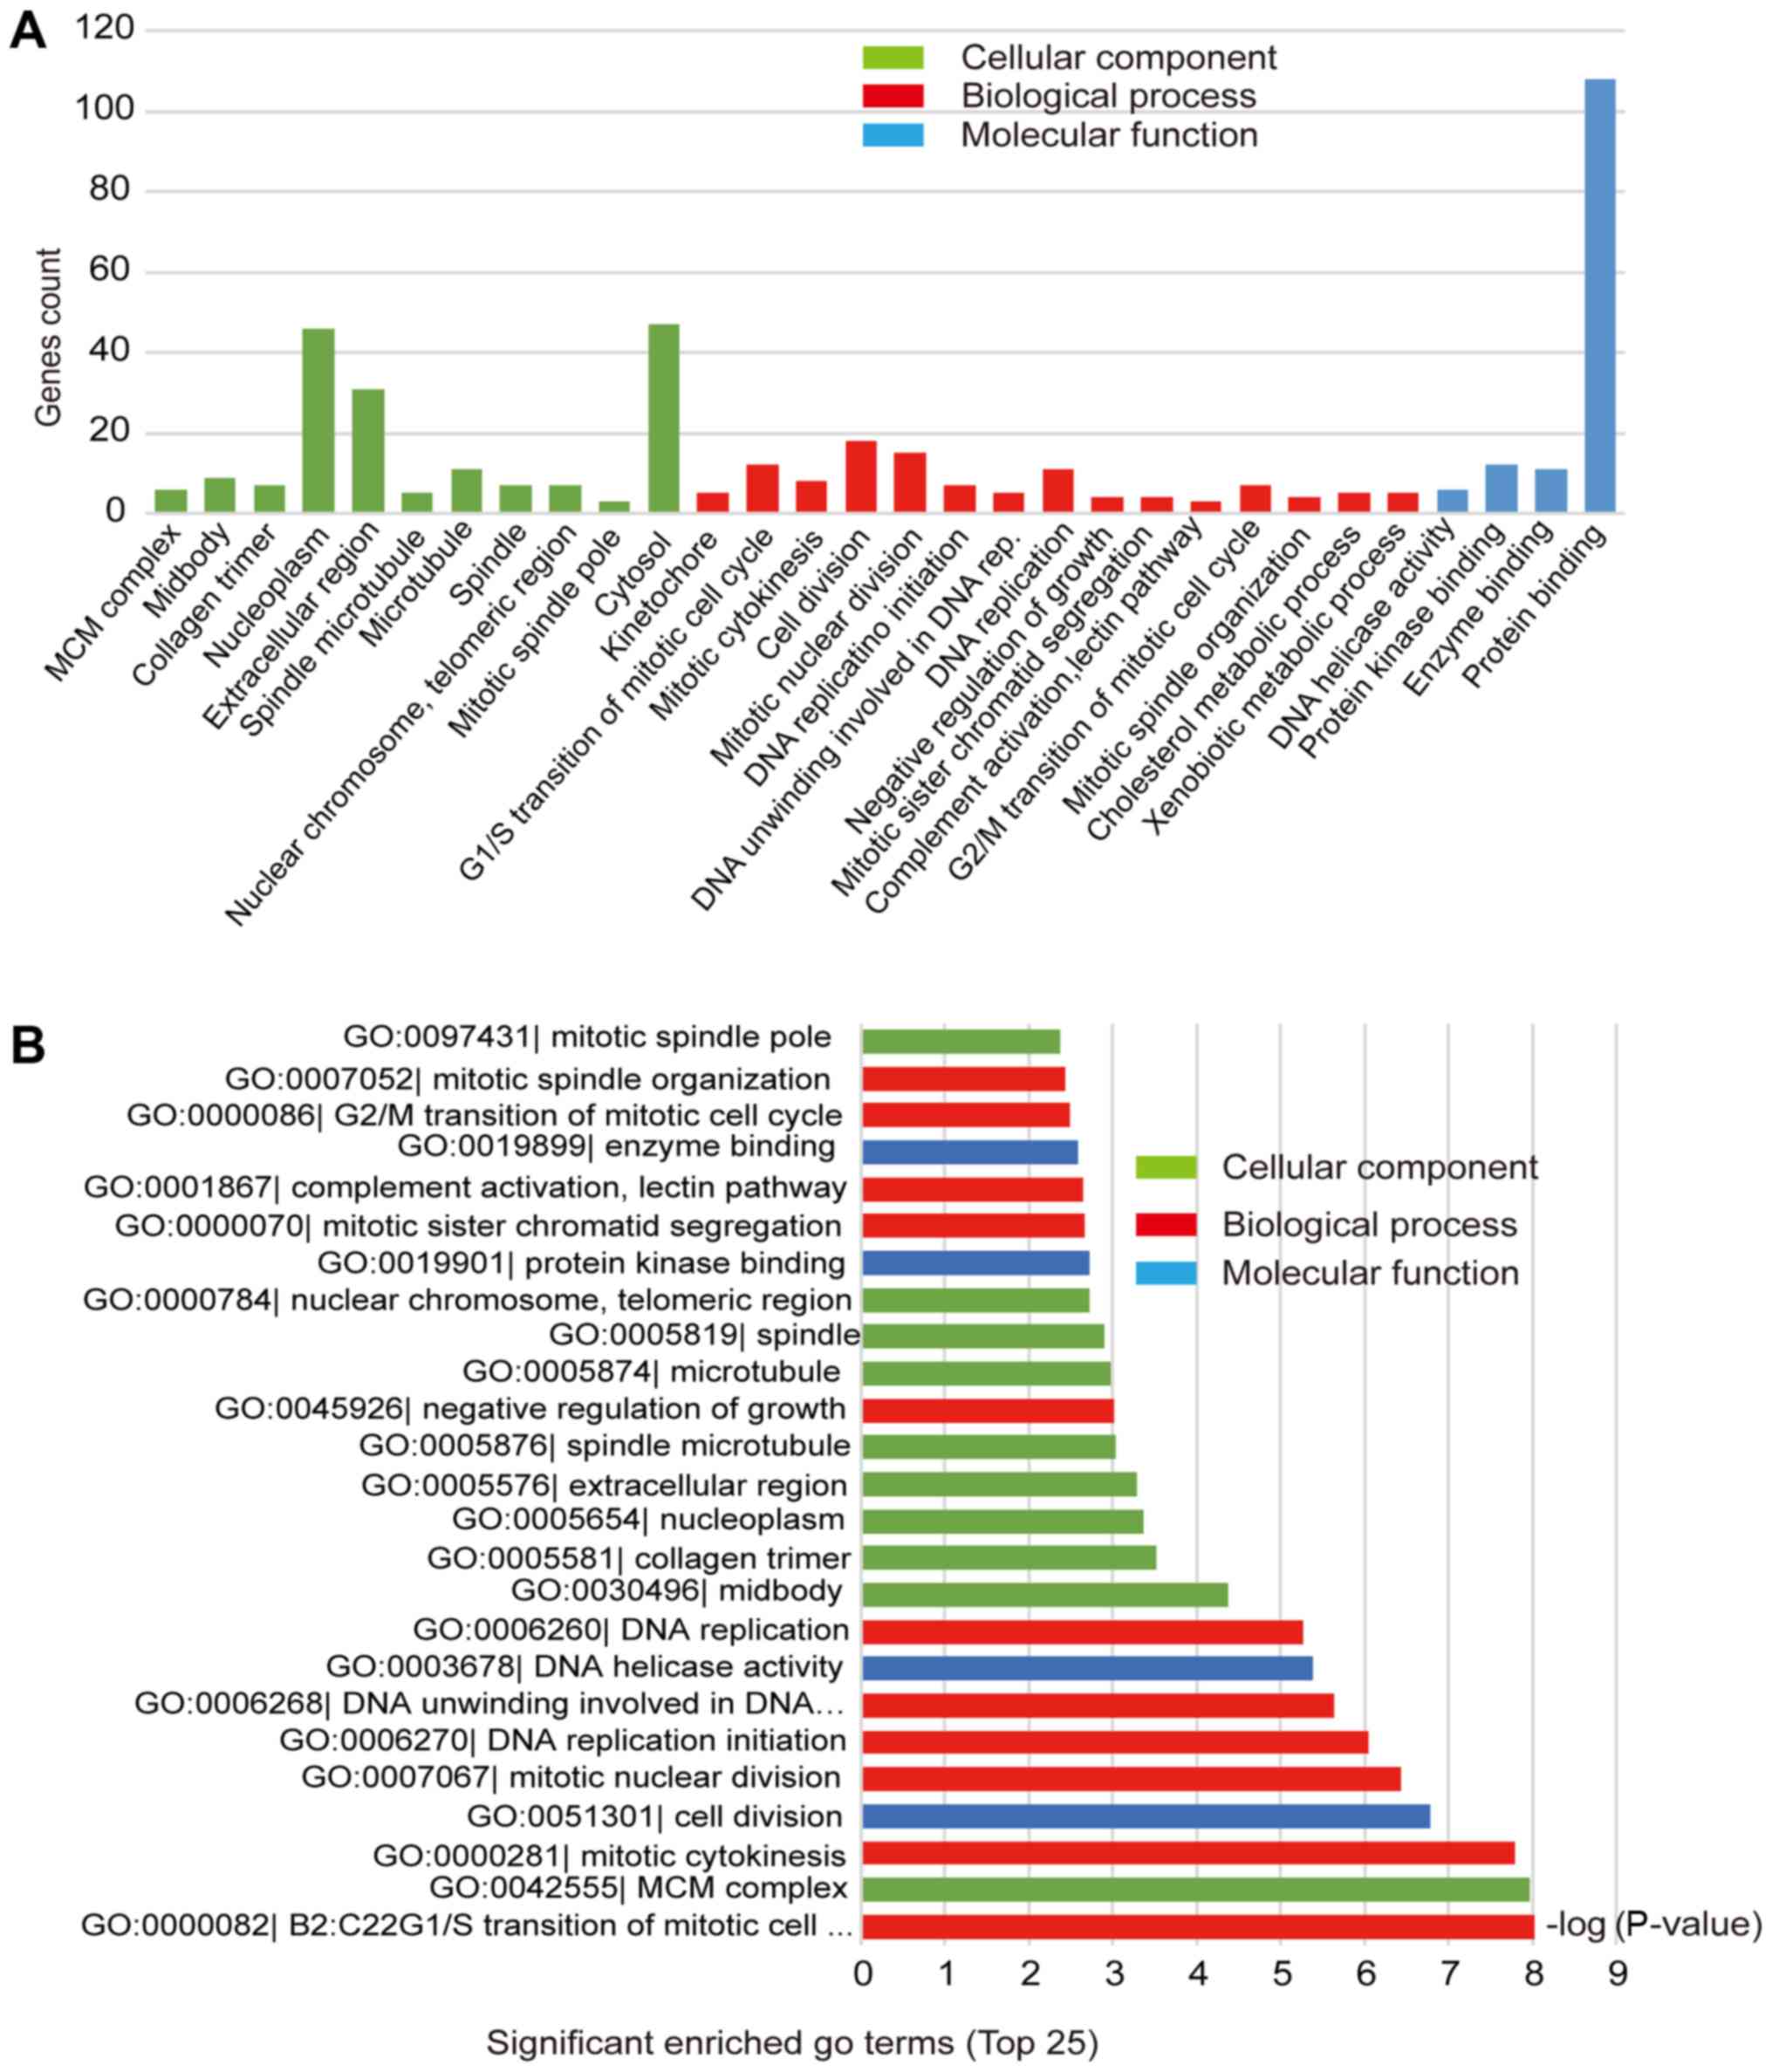
DEGs GO analysis in HCC
DEGs GO analysis was conducted with the online
softwares DAVID and Gene Ontology. The DEGs were classified into
three functional groups: Biological process group, molecular
function group, and cellular component group (Fig. 2A). As shown in Fig. 2B and Table II, cell division, mitotic nuclear
division, and G1/S transition of mitotic cell cycle are the most
abundant groups in the ‘biological process’ category, with each
accounting for about 20% of upregulated genes. In contrast,
downregulated genes were mainly enriched in signal transduction and
proteolysis. For the molecular function category, protein binding
(71.7%) was the predominant group among upregulated genes, followed
by ATP binding (25%) and DNA binding (18.5%), while the
downregulated genes were mainly signed to the calcium ion binding
and serine-type endopeptidase activity groups. For the cellular
component group, upregulated genes were mainly enriched in the
nucleoplasm, nucleus, and cytoplasm, and the downregulated genes
were mainly enriched in the extracellular region, extracellular
space, and extracellular exosome.
| Table II.The significant enriched analysis of
DEGs in hepatocellular carcinoma. |
Table II.
The significant enriched analysis of
DEGs in hepatocellular carcinoma.
| A, Upregulated |
|---|
|
|---|
| Term | Description | Count | P-value |
|---|
| GO:0051301 | Cell division | 18 |
2.36×10⁻¹² |
| GO:0007067 | Mitotic nuclear
division | 15 | 3.38×10⁻¹¹ |
| GO:0000281 | Mitotic
cytokinesis | 8 |
1.12×10⁻¹⁰ |
| GO:0000082 | G1/S transition of
mitotic cell cycle | 11 | 1.18×10⁻¹⁰ |
| GO:0042555 | MCM complex | 6 |
2.90×10⁻¹⁰ |
| GO:0005654 | Nucleoplasm | 37 | 5.64×10–09 |
| GO:0006270 | DNA replication
initiation | 7 |
1.32×10−08 |
| GO:0003678 | DNA helicase
activity | 6 | 1.27×10–07 |
| GO:0006268 | DNA unwinding
involved in DNA replication | 5 |
1.38×10−07 |
| GO:0030496 | Midbody | 9 | 2.03×10–07 |
| GO:0006260 | DNA
replication | 9 |
1.39×10−06 |
| GO:0005524 | ATP binding | 23 | 4.82×10–06 |
| GO:0005829 | Cytosol | 35 |
5.16×10−06 |
| GO:0005515 | Protein
binding | 66 | 1.16×10–05 |
| GO:0005874 | Microtubule | 10 |
1.92×10−05 |
|
| B,
Downregulated |
|
| Term | Description | Count | P-value |
|
| GO:0005576 | Extracellular
region | 28 | 8.07×10–09 |
| GO:0005615 | Extracellular
space | 19 |
8.81×10−05 |
| GO:0005581 | Collagen
trimer | 6 | 9.21×10–05 |
| GO:0004252 | Serine-type
endopeptidase activity | 8 |
3.22×10−04 |
| GO:0001867 | Complement
activation, lectin pathway | 3 | 5.48×10–04 |
| GO:0071276 | Cellular response
to cadmium ion | 3 | 0.003 |
| GO:0071294 | Cellular response
to zinc ion | 3 | 0.004 |
| GO:0045926 | Negative regulation
of growth | 3 | 0.004 |
| GO:0006508 | Proteolysis | 9 | 0.004 |
| GO:0034364 | High-density
lipoprotein particle | 3 | 0.005 |
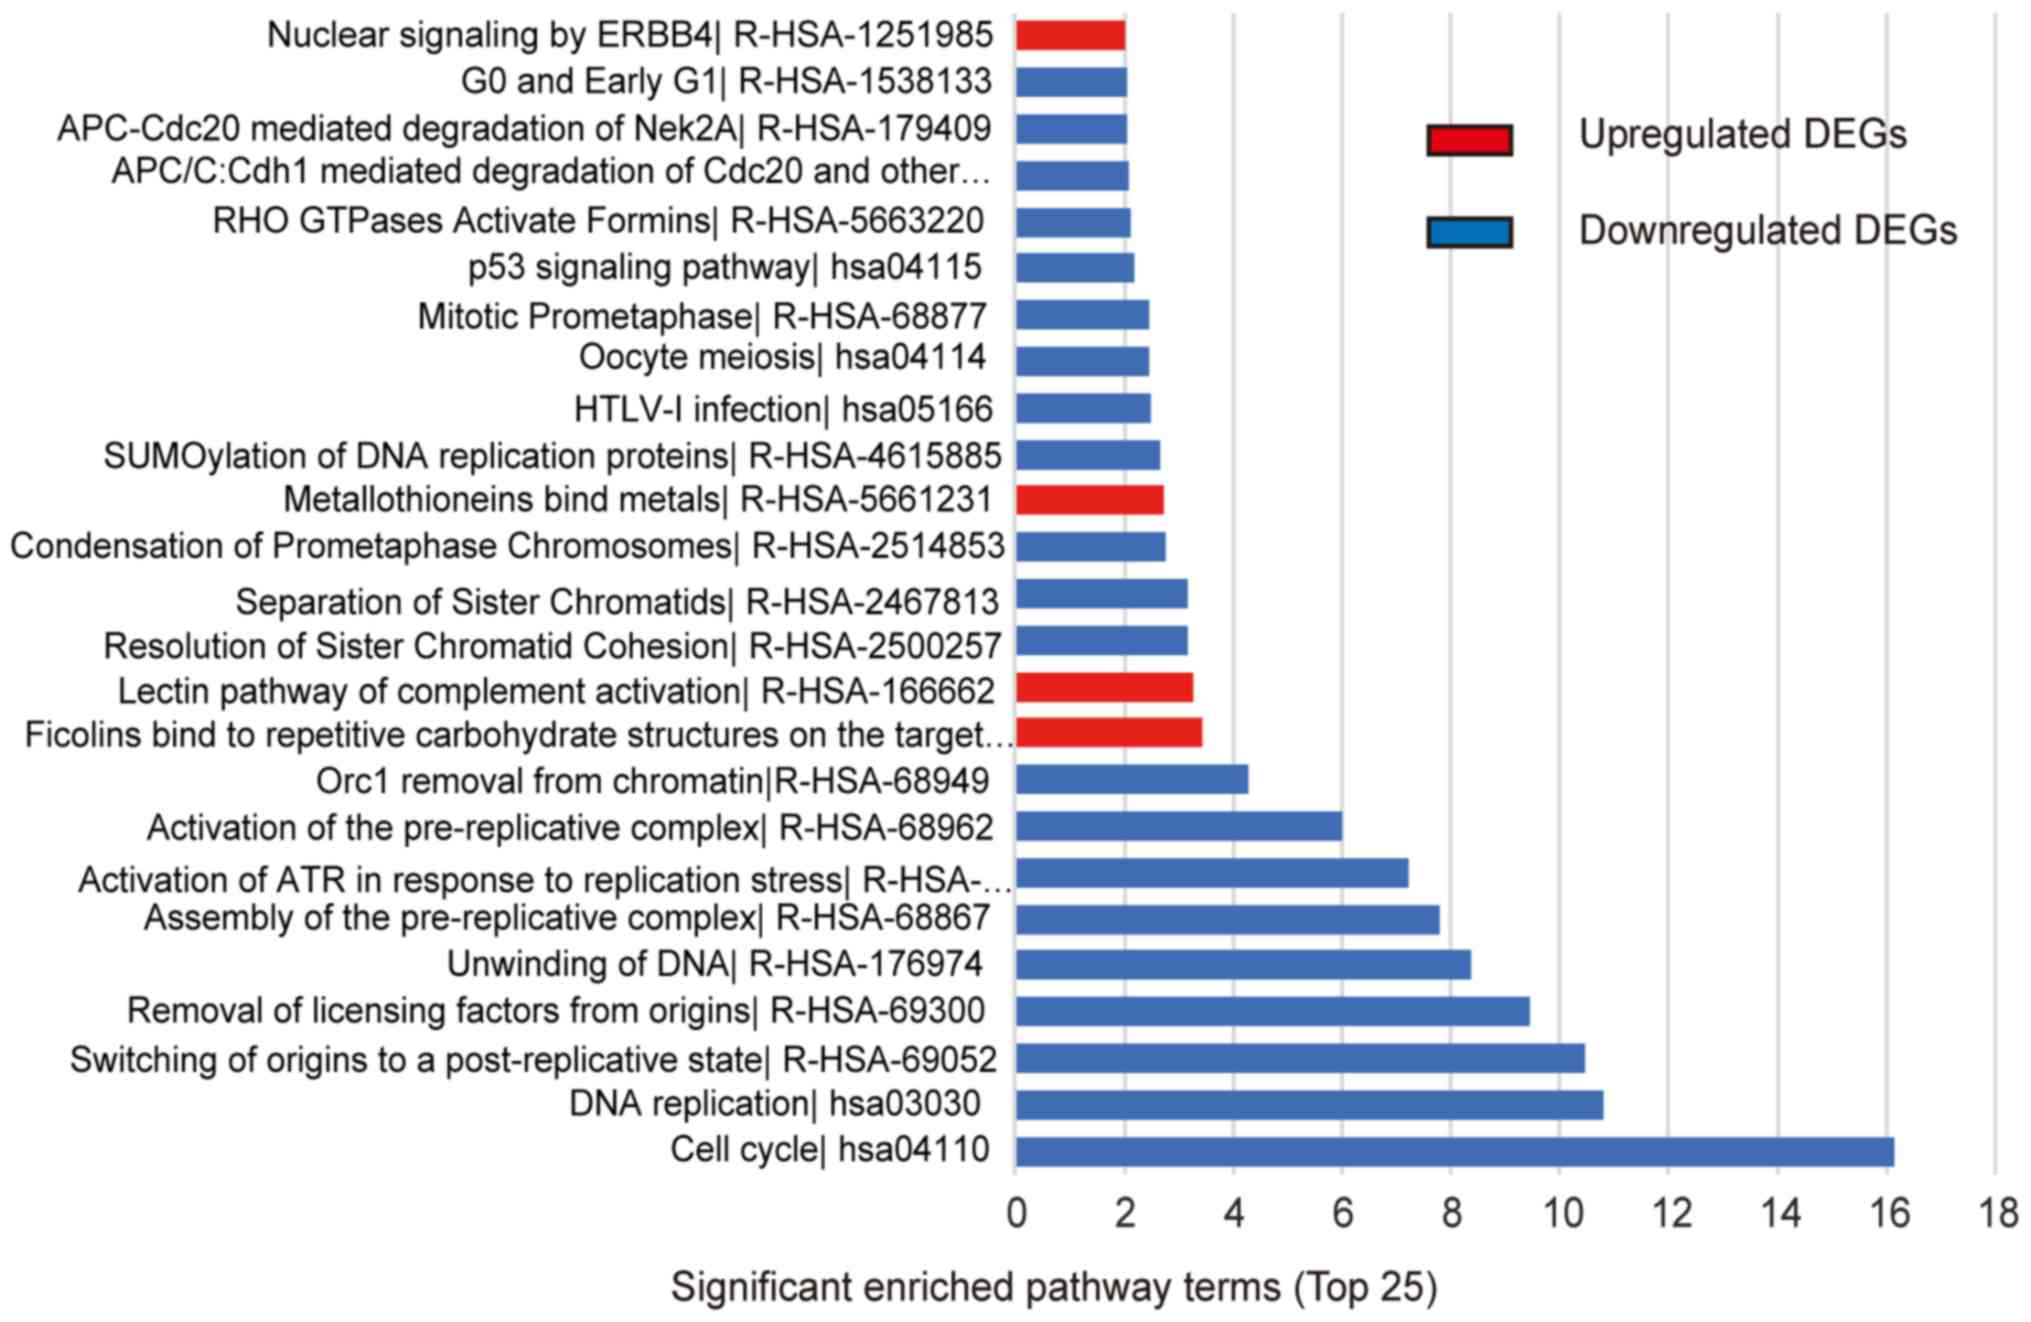
Signaling pathway enrichment
analysis
To investigate functional and signaling pathway
enrichment of the gene signatures, we performed a pathway analysis
using online websites of DAVID and KEGG (http://www.genome.jp/kegg/) pathways and GO. The
upregulated DEGs were mainly enriched in DNA replication, cell
cycle, HTLV-I infection, oocyte meiosis, and p53 signaling pathway,
while the downregulated DEGs were mainly enriched in metabolic
pathways, caffeine metabolism, mineral absorption, thyroid hormone
signaling pathway, and AMPK signaling pathway (Table III, Fig.
3).
| Table III.Signaling pathway enrichment analysis
of DEGs function in hepatocellular carcinoma. |
Table III.
Signaling pathway enrichment analysis
of DEGs function in hepatocellular carcinoma.
| A, Upregulated
DEG |
|---|
|
|---|
| Pathway | Name | Gene count | P-value | Genes |
|---|
| KEGG Pathway:
hsa04110 | Cell cycle | 16 |
7.01×10⁻¹⁷ | E2F3, TTK, CDC20,
PTTG1, MCM2, MCM3, MCM4, MCM5, MCM6, CCNE2, CDKN2A, CCNB2,MCM7,
CDKN2C, BUB1, PCNA |
| KEGG Pathway:
hsa03030 | DNA
replication | 9 |
1.03×10⁻¹¹ | RFC4, MCM7, PCNA,
MCM2, MCM3, RNASEH2A, MCM4, MCM5, MCM6 |
| Reactome:
R-HSA-69052 | Switching of
origins to a post-replicative state | 6 | 3.34×10⁻¹¹ | MCM7, MCM2, MCM3,
MCM4, MCM5, MCM6 |
| Reactome:
R-HSA-69300 | Removal of
licensing factors from origins | 7 |
3.49×10⁻¹⁰ | MCM7, GMNN, MCM2,
MCM3, MCM4, MCM5, MCM6 |
| Reactome:
R-HSA-176974 | Unwinding of
DNA | 6 | 4.30×10–09 | MCM7, MCM2, MCM3,
MCM4, MCM5, MCM6 |
| Reactome:
R-HSA-68867 | Assembly of the
pre-replicative complex | 6 |
1.60×10−08 | MCM7, MCM2, MCM3,
MCM4, MCM5,MCM6 |
| Reactome:
R-HSA-176187 | Activation of ATR
in response to replication stress | 7 | 6.30×10–08 | RFC4, MCM7, MCM2,
MCM3, MCM4, MCM5, MCM6 |
| Reactome:
R-HSA-68962 | Activation of the
pre-replicative complex | 6 |
1.13×10−06 | MCM7, MCM2, MCM3,
MCM4, MCM5, MCM6 |
| Reacto me:
R-HSA-68949 | Orc1 removal from
chromatin | 6 | 5.12×10–05 | MCM7, MCM2, MCM3,
MCM4, MCM5, MCM6 |
| Reactome:
R-HSA-2500257 | Resolution of
Sister Chromatid Cohesion | 6 |
6.32×10−04 | CCNB2, CENPA,
ZWINT, BUB1, NUP37, CDC20 |
| Reactome:
R-HSA-2467813 | Separation of
Sister Chromatids | 7 | 6.54×10–04 | CENPA, ZWINT, BUB1,
NUP37, CDC20, PTTG1, UBE2C |
| Reactome:
R-HSA-2514853 | Condensation of
Pro-metaphase Chromosomes | 3 | 0.001 | CCNB2, NCAPG,
SMC2 |
| Reactome:
R-HSA-4615885 | SUMOylation of DNA
replication proteins | 4 | 0.002 | PCNA, NUP37, AURKA,
TOP2A |
| KEGG Pathway:
hsa05166 | HTLV-I
infection | 7 | 0.003 | E2F3, CDKN2A,
CDKN2C, PCNA, FDPS CDC20, PTTG1 |
| KEGG Pathway:
hsa04114 | Oocyte meiosis | 5 | 0.003 | CCNE2, BUB1, AURKA,
CDC20, PTTG1 |
|
| B, Downregulated
DEGs |
|
| Pathway | Name | Gene count | P-value | Genes |
|
| Reactome:
R-HSA-2855086 | Ficolins bind to
repetitive carbohydrate structures on the target cell surface | 3 |
3.56×10−04 | MASP1, FCN3,
FCN2 |
| Reactome:
R-HSA-166662 | Lectin pathway of
complement activation | 3 |
5.32×10−04 | MASP1, FCN3,
FCN2 |
| Reactome:
R-HSA-5661231 | Metallothioneins
bind metals | 3 | 0.001 | MT1M, MT1X,
MT1F |
| Reactome:
R-HSA-1251985 | Nuclear signaling
by ERBB4 | 3 | 0.009 | ESR1, CXCL12,
NCOR1 |
| Reactome:
R-HSA-166663 | Initial triggering
of complement | 4 | 0.01 | MASP1, FCN3, FCN2,
COLEC10 |
| KEGGPathway:
hsa01100 | Metabolic
pathways | 15 | 0.01 | AADAT, CNDP1,
CYP2C19, ACADS, NAT2, CYP26A1, CYP1A2, DBH, MAN1C1, GCH1, PCK1,
ST3GAL6, DHODH, GSTZ1, SARDH |
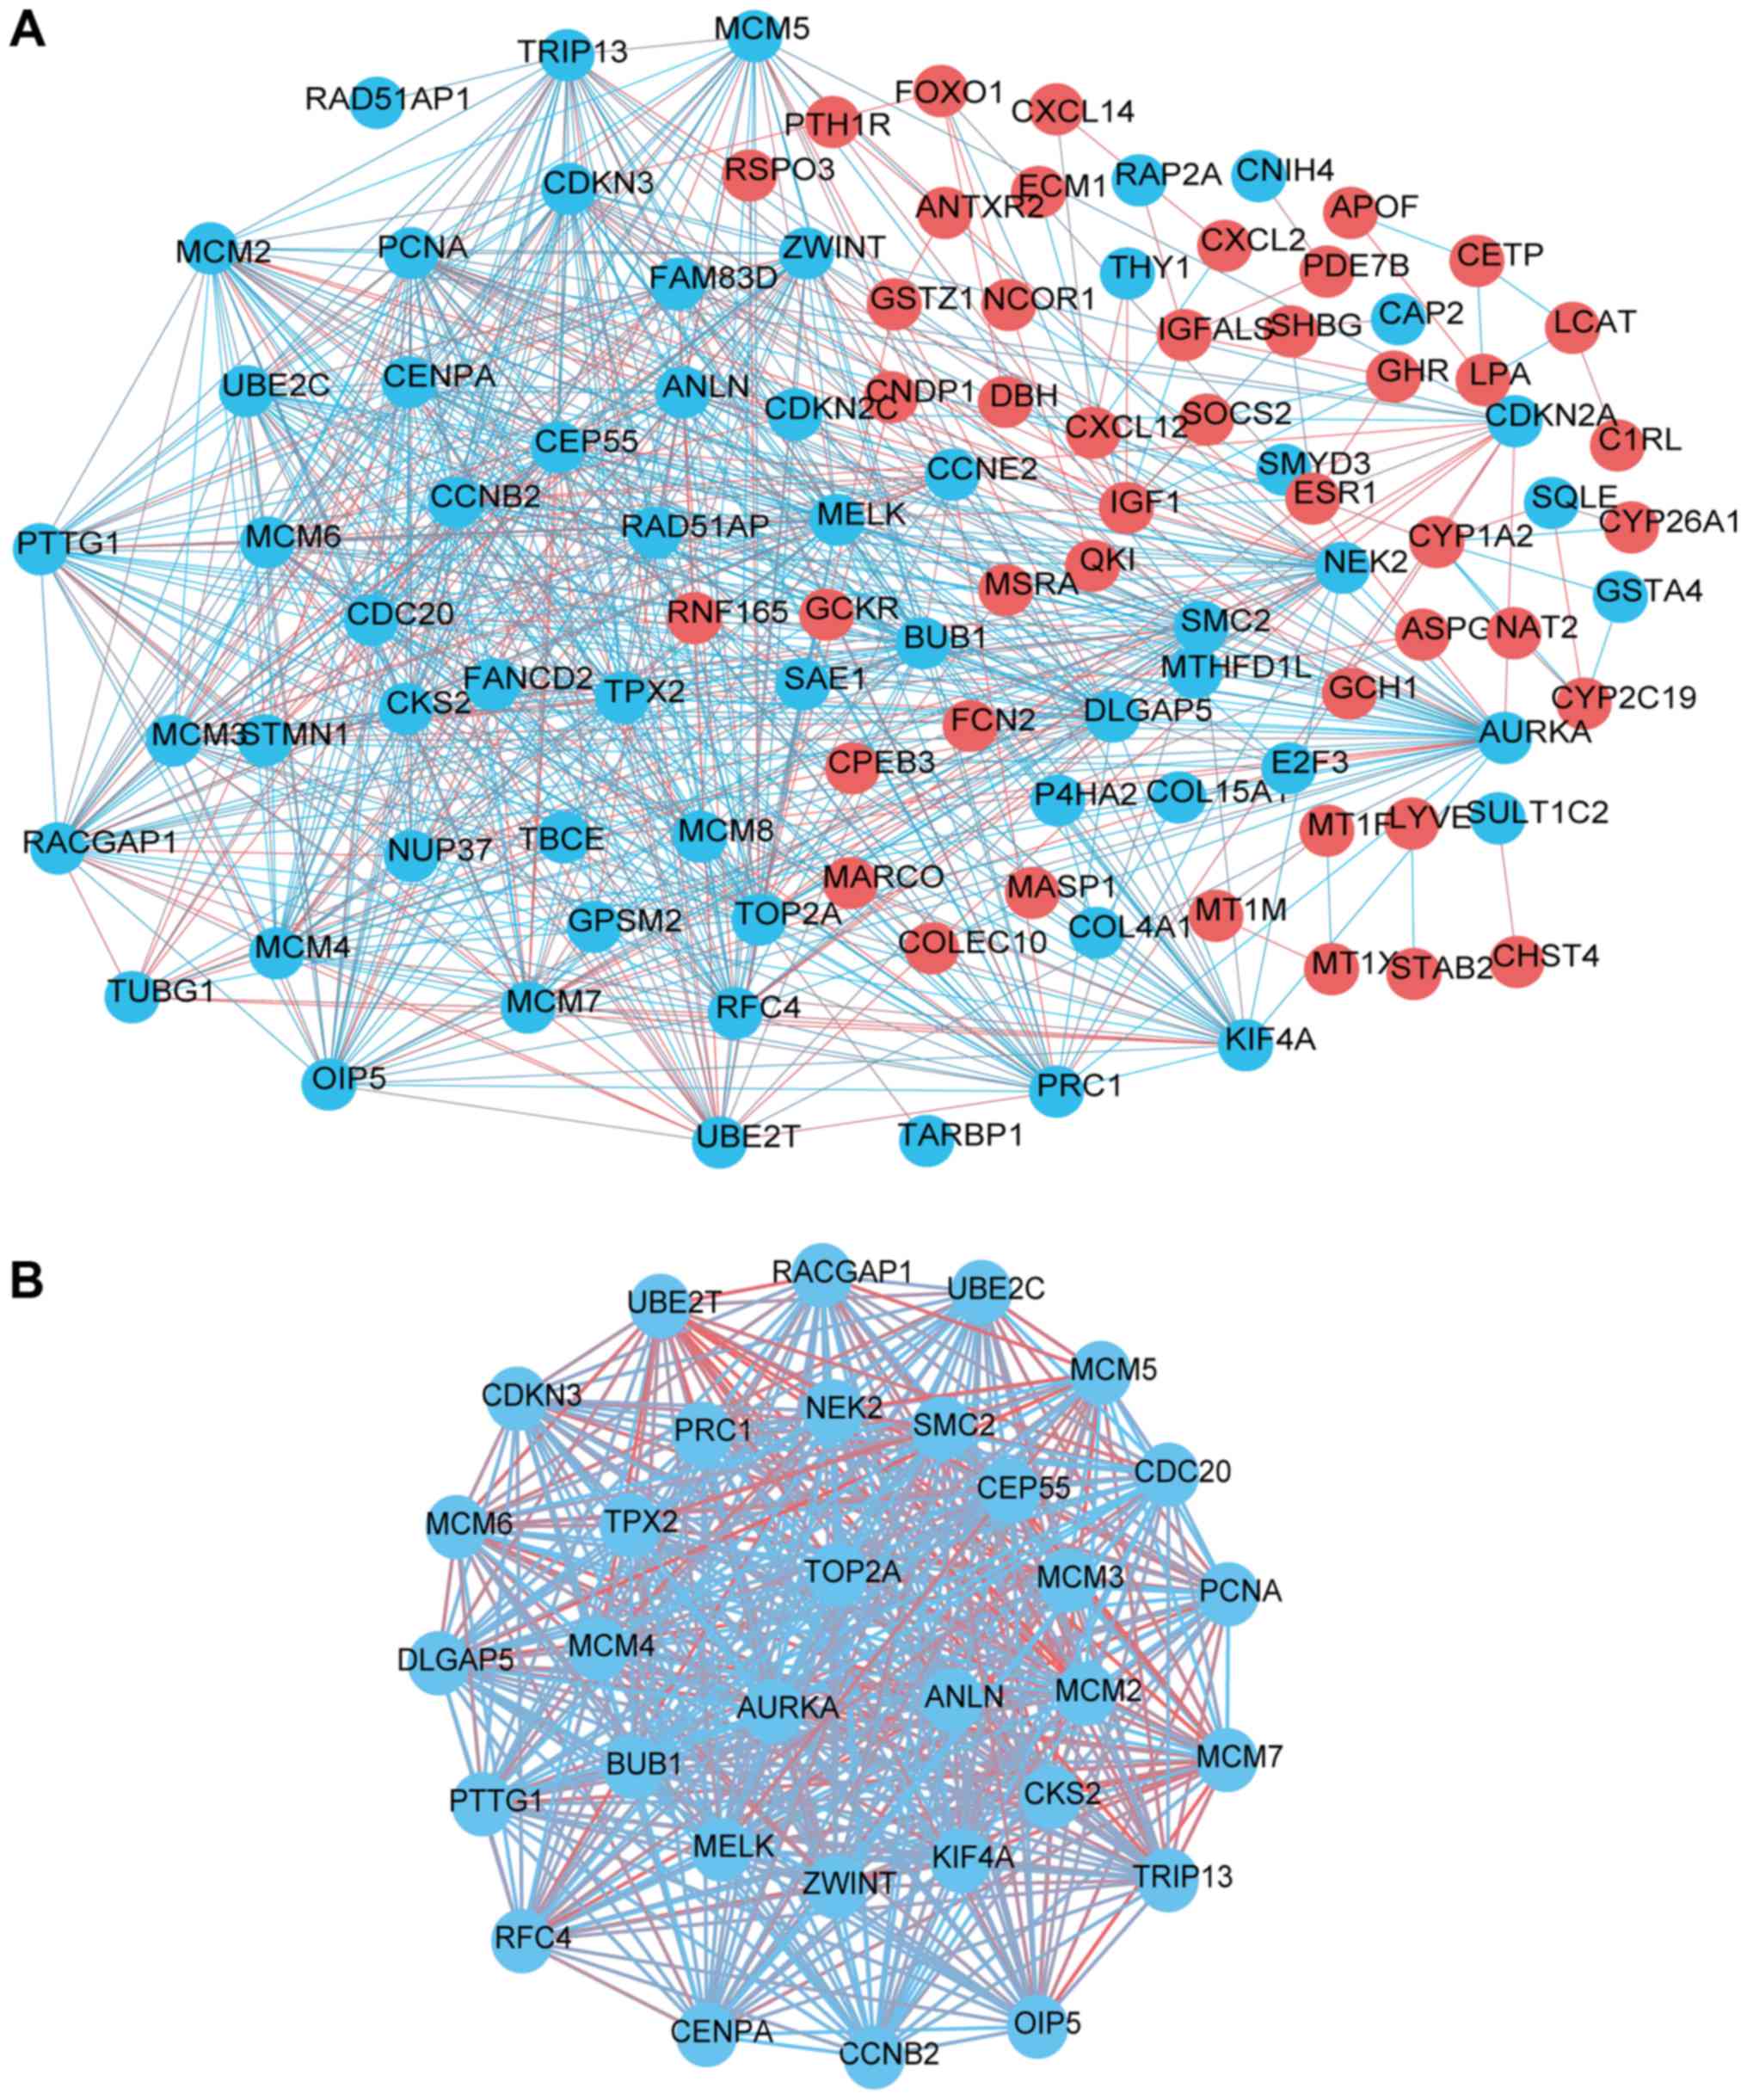
Key candidate genes and pathways
identification with DEGs protein-protein interaction network (PPI)
and modular analysis
Based on the analysis in the STRING database
(Available online: http://string-db.org) (20) and Cytoscape software (17), relevant protein-protein interactions
(PPI) were obtained and visualized, containing 184 nodes and 1166
edges (Fig. 4A). After a topological
analysis, 15 genes with a node degree ≥36 (i.e., each node had more
than 10 connections/interactions) were selected as representative
hub genes. The most significant 15 node degree genes were TOP2A,
PCNA, CCNB2, AURKA, CDKN3, BUB1, RFC4, CEP55, DLGAP5, MCM2, PRC1,
RACGAP1, TPX2, CDC20, and MCM4. Based on the degree of importance,
one significant module was chosen for further analysis through
Cytotype MCODE from the PPI network complex. Pathway enrichment
analysis showed that Module 1 consisted of 33 nodes and 507 edges
(Fig. 4B, Table IV), which are mainly associated with
DNA replication, cell cycle, switching of origins to a
post-replicative state, and activation of ATR in response to
replication stress by pathway enrichment analysis.
| Table IV.Pathway enrichment analysis of Module
1 genes function. |
Table IV.
Pathway enrichment analysis of Module
1 genes function.
| Term | Description | Count | P-value |
|---|
| KEGG:hsa04110 | Cell cycle | 11 | 6.64×10⁻¹⁵ |
| KEGG:hsa03030 | DNA
replication | 8 |
3.50×10⁻¹³ |
| R-HSA-69052 | Switching of
origins to a post-replicative state | 6 | 3.93×10⁻¹³ |
| R-HSA-176974 | Unwinding of
DNA | 6 |
5.14×10⁻¹¹ |
| R-HSA-68867 | Assembly of the
pre-replicative complex | 6 | 1.94×10⁻¹⁰ |
| R-HSA-176187 | Activation of ATR
in response to replication stress | 7 |
2.88×10⁻¹⁰ |
| R-HSA-69300 | Removal of
licensing factors from origins | 6 | 3.98×10⁻¹⁰ |
| R-HSA-68962 | Activation of the
pre-replicative complex | 6 |
1.26×10−08 |
| R-HSA-68949 | Orc1 removal from
chromatin | 6 | 7.66×10–07 |
| R-HSA-2467813 | Separation of
Sister Chromatids | 6 |
8.33×10−05 |
| R-HSA-2500257 | Resolution of
Sister Chromatid Cohesion | 5 | 2.19×10–04 |
| R-HSA-174178 | APC/C:Cdh1 mediated
degradation of Cdc20 and other APC/C:Cdh1 targeted proteins in late
mitosis/early G1 | 4 |
7.57×10−04 |
| KEGG:hsa04114 | Oocyte meiosis | 4 | 0.001 |
| R-HSA-179409 | APC-Cdc20 mediated
degradation of Nek2A | 3 | 0.00179182 |
Validation of the DEGs in cBio portal
dataset
To further confirm the validity of the identified
DEGs, cBio portal, an online integrated data mining system, was
used to analyze the genetic alteration of genes. Among the four HCC
studies analyzed (12,21,22),
alterations ranging from 15.2 to 68.9% were found including the
gene sets submitted for analysis (Fig.
5A). The most pronounced genomic changes observed across
samples from the TCGA study was presented using OncoPrint. Two
genes, UBE2T and CCNE2, with the largest mutation frequency found
based on the TCGA database in HCC were also identified as the hub
genes in this study. The results showed low mutation frequency of
the three hub genes-TOP2A, PCNA, and AURKA in HCC
samples-investigated in the present study (Fig. 5B), but in the TCGA breast cancer, the
three genes showed high alteration frequency (23,24)
(Fig. 5C). Thus, the roles of TOP2A,
PCNA, and AURKA as biomarkers in HCC progression and histological
grading should be investigated more systematically.
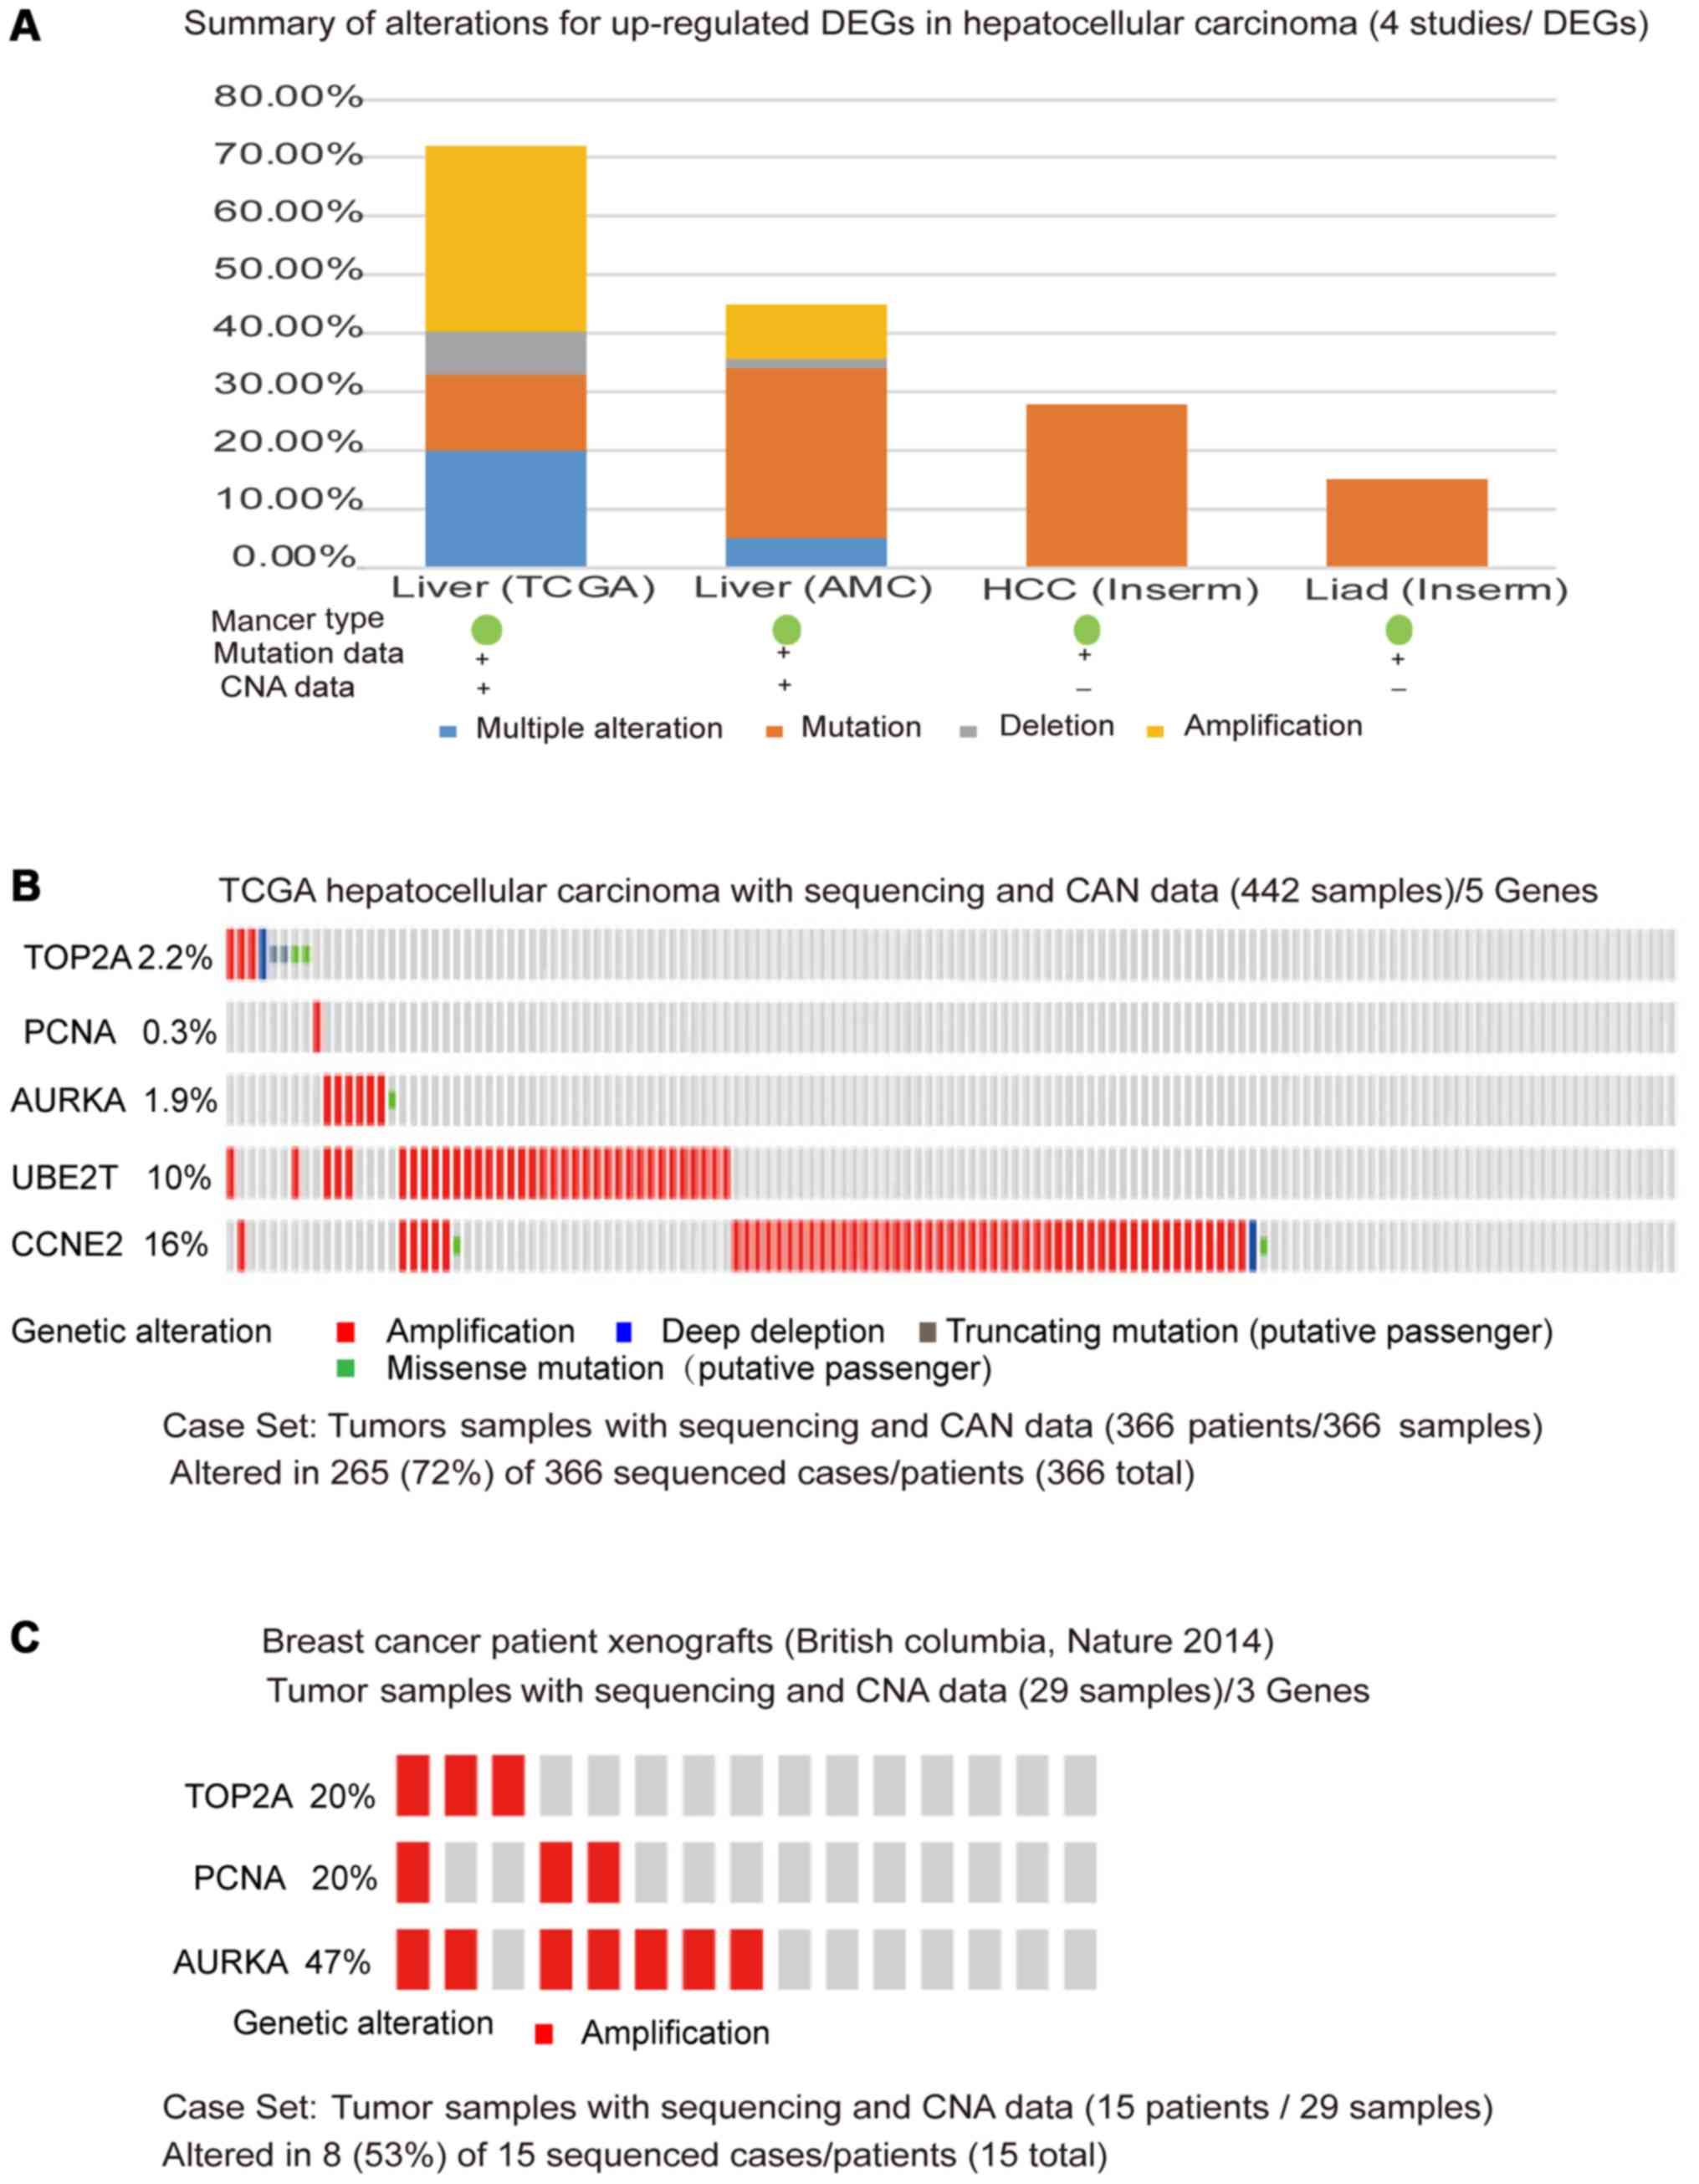 | Figure 5.Validation of the DEGs in cBio portal
Dataset. (A) Overview of changes in the identified DEGs in genomics
data sets available in 4 different HCC studies. (B) OncoPrint: A
visual summary of alteration across TCGA hepatocellular carcinoma
based on a query of DEGs. (C) OncoPrint, A visual summary of
alteration across TCGA breast cancer based on a query of the three
genes-TOP2A, PCNA, and AURKA. Distinct genomic alterations
including mutations and CNAs (exemplified by gene amplifications
and homozygous deletions) are summarized and color coded presented
by % changes in particular affected genes in individual tumor
samples. Each row represents a gene, and each column represents a
tumor sample. Red bars designate gene amplifications, blue bars
represent homozygous deletions, and green squares indicate
nonsynonymous mutations. DEGs, differentially expressed genes; HCC,
hepatocellular carcinoma; CNS, copy number alterations; TCGA, The
Cancer Genome Atlas. |
Discussion
HCC is one of the most common malignant neoplasms
worldwide. Advanced-stage HCC is notoriously difficult to treat.
Although various causes and underlying mechanisms of HCC formation
and progression have been revealed by several basic and clinical
studies in the past several decades, the worldwide incidence and
mortality of HCC is still very high. Different from a single
genetic or cohort study, this study analyzed four original
microarray datasets, including 436 HCC and 94 normal liver tissues.
In total, 185 DEGs were identified in HCC, including 92 upregulated
genes and 92 downregulated genes. GO was performed, which showed
that the upregulated DEGs were mainly enriched in cell division,
mitotic nuclear division, mitotic cytokinesis, and G1/S transition
of the mitotic cell cycle. Pathway enrichment was analyzed based on
the KEGG database to assess the functional relevance of DEGs. On
the basis of the analysis in the STRING database and Cytoscape
software, relevant PPIs were obtained and visualized that contained
184 nodes and 1166 edges. The most significant 15 hub genes were
selected, including TOP2A, PCNA, CCNB2, AURKA, CDKN3, BUB1, RFC4,
CEP55, DLGAP5, MCM2, PRC1, RACGAP1, TPX2, CDC20, and MCM4.
Cell cycle-related gene TOP2A (DNA topoisomerase II
alpha) encodes a DNA topoisomerase, an enzyme that controls and
alters the topologic states of DNA during transcription. In many
cancers including breast, ovarian, colon, and small-cell lung
cancers, TOP2A has also been shown as a valuable prognostic marker
for tumor grading, recurrences, and a predictor of poorer patient
survival (25–27). In this study, TOP2A is the top degree
hub gene and overexpressed in tumor tissue compared to adjacent
non-tumoral or normal tissue. Consistent with our studies, Wong
et al (28), used microarrays
to examine 22 HCC cell lines; their array-based transcriptional
mapping results showed that TOP2A was upregulated in 14/22 cell
lines through DNA copy gains. Furthermore, TMA analysis of 172
liver tumors showed that TOP2A expressions significantly correlated
with advanced histological grading, microvascular invasion,
aggressive biological behavior, and chemotherapy resistance.
High-grade TOP2A expressions showed significantly lower overall
survival. Thus, TOP2A as a biomarker in histological grading and a
target in chemotherapy resistance should be investigated more
systematically. The second hub gene PCNA, proliferating cell
nuclear antigen, encodes the protein which is found in the nucleus
and is a cofactor of DNA polymerase delta and involved in the
RAD6-dependent DNA repair pathway in response to DNA damage. Owing
to its function in cell proliferation, PCNA plays an important role
in cancer progression (29).
Combined hepatocellular-cholangiocarcinoma (CHC) is a malignant
subtype of primary liver tumor containing elements of both HCC and
intrahepatic cholangiocarcinoma (ICC). In patients who underwent
hepatectomy with curative intent, nontumor ductular reactions (DRs)
produced by hepatic progenitor cells (HPCs) in nontumor liver
tissue were an independent prognostic indicator for disease-free
survival (DFS) and overall survival (OS). PCNA could label the
index of the ductular reaction (PI-DR). A higher level of PI-DR
contributes to intratumoral HPC activation (30), fibrosis, hepatocyte replication, and
hepatic inflammation which is predictive of a high recurrence rate.
Moreover, increased PI-DR expression was also associated with
multicentric occurrence (MO) and microvascular invasion (MVI) of
HCC (31). However, several studies
found conflicting results, which showed that PCNA had little
prognostic value in tumor tissue (32,33).
Because one part of PCNA trimers was not engaged in DNA synthesis
(34). Similar to the PCNA function
in maintaining the stability of chromosomal replication and
segregation in cellular mitosis, another gene-aurora kinase A
(AURKA)-was found upregulated in our experiment. AURKA is a cell
cycle regulated kinase that appears to be involved in microtubule
formation. A clinical trial by Jeng et al (35), showed that AURKA was overexpressed in
137 (61%) of 223 patients with HCC. AURKA overexpression coincided
with portal vein tumor invasion, regardless of tumor size.
Furthermore, AURKA was found involved in p53 signaling pathway and
interacted directly with p53 mutation (36). Aurora-A and p53 mutation had a
synergistic effect promoting tumor progression and poor prognosis
(35). In p53-altered (deleted or
mutated) liver cancer, the tumor suppressor protein
p19ARF was activated and mediated G2/M cell cycle
arrest. MYC, a proto-oncogene, was overexpressed and directly bound
to AURKA, which stabilized MYC to overcome G2 to M cell cycle
arrest and promote tumor cell survival. A previous study found
conformation-changing AURKA inhibitors could prevent formation of
MYC-AURKA complexes and hence, degradation of MYC (37). Therefore, therapeutic strategy
targeting MYC-AURKA complexes could be considered for this subtype
of HCCs.
Besides the cycle-related pathways and p53
signaling, T lymphotropic virus type I (HTLV-I) infection-related
biological processes and pathways were also identified in our
study. HTLV-1 infection, especially combined with HCV infection,
increased HCC mortality (38). Tax,
an HTLV-I oncoprotein, contributes to chromosome aneuploidy,
cytokinesis failure, and multinucleated cells primarily by directly
binding and activating the CDC20-associated anaphase promoting
complex (APCCDC20) during S phase to delay mitotic
progression and faulty mitosis (39). Other DEGs in our study associated
with HTLV-I infection-related pathway were FDPS, CDC20, E2F,
CDKN2A, CDK2N2C, PTTG1, and PCNA.
Consistent with our studies, Jin et al
(40), analyzed gene expression
profiles GSE6222, GSE41804, and GSE51401 that contained 117
samples, including 54 cases and 63 controls from which 1347 DEGs
were identified, including 2920 upregulated genes and 2231
downregulated genes. The top 10 hug genes were SPINK1, TOP2A, ASPM,
GPC3, ANLN, SULT1C2, CCNB1, PEG10, CDKN3, and ECT2. The main
pathway of the identified DEGs were those involved in cell cycle
and oocyte meiosis, which were also identified in our study.
However, Jin's study was based on a dataset only generated from
Chinese and Japanese patients. Different from Yin's report, we
analyzed four datasets generated from American, Chinese,
Singaporean, and French patients, thereby representing different
populations. Apart from cell cycle-related pathways, HTLV-I
infection and p53 signaling pathway were identified, because the
incidence of NAFLD and steatohepatitis was high in European and
American patients (41,42).
HCC is a group of complex and heterogeneous tumors.
The mechanism mainly involves chromosomal and microsatellite
instability (43), and the later
involves the inactivation or mutation of DNA mismatch repair genes.
Our study found chromosomal instability-related genes including
BUB, PCNA, CDC20, and AURKA. The characteristics of HCC cannot be
explained only by analysis of gene expression profiles, although
gene expression profiles could reveal some of the underlying
mechanism in cancer progression. Various factors should be
explored, including gene mutation, methylation, miRNA, and lncRNA,
which could likely participate in HCC carcinogenesis and
chemotherapy resistance. For instance, TSLNC8, a long intergenic
noncoding RNA on chromosome 8p12, was characterized as a novel
tumor suppressor by modulating the IL-6/STAT3 signaling pathway and
being inversely correlated with HCC embolus, nodules, and
differentiation stage (44). A
clinical trial based on 2079 cirrhotic patients with long term
follow-up found that the incidence of HCC induced by the etiology
of cirrhosis was different. Chronic viral hepatitis patients had a
higher cumulative risk of HCC than those with primary biliary
cirrhosis and NAFLD, while those with autoimmune liver diseases
(AIH) had the lowest risk (45).
Taken together, in our study we have identified 185
DEG candidate genes using integrated bioinformatical analysis, and
found 15 mostly changed hub genes, which were significantly
enriched in cell cycle process, DNA replication, p53 signaling, and
HTLV-I infection-related biological processes and pathways. These
findings could promote our understanding of the cause and molecular
mechanisms underlying the development of HCC, and these candidate
and signal pathways could be the targets of clinical therapy for
HCC.
Acknowledgements
Not applicable.
Funding
This study was supported by the project of ‘Medical
Professionals Cross Fund’, Shanghai Jiao Tong University, Shanghai,
China (grant no. YG2013MS01), the 863 Program (grant nos.
2012AA02A515 and 2012AA021802), the National Nature Science
Foundation of China (grant nos. 81421061, 81273596, J1210047,
30900799, 81361120389 and 30972823) and the National key research
and development program (grant nos. 2016YFC0905000, 2016YFC1200200
and 2016YFC0906400).
Availability of data and materials
The datasets generated and analyzed during the
current study are available from the corresponding author on
reasonable request.
Authors' contributions
TX was involved in drafting the manuscript, design
of the work, acquisition and analysis of data, and approval of the
final version to be published. TY contributed to conception and
design of the study, and the acquisition of the data. QZ was
responsible for analysis and interpretation of the data. All
authors read and approved the final manuscript.
Ethics approval and consent to
participate
Not applicable.
Consent for publication
Not applicable.
Competing interests
The authors declare that they have no competing
interests.
References
|
1
|
Slotta JE, Kollmar O, Ellenrieder V,
Ghadimi BM and Homayounfar K: Hepatocellular carcinoma: Surgeon's
view on latest findings and future perspectives. World J Hepatol.
7:1168–1183. 2015. View Article : Google Scholar : PubMed/NCBI
|
|
2
|
Chen W, Zheng R, Baade PD, Zhang S, Zeng
H, Bray F, Jemal A, Yu XQ and He J: Cancer statistics in China,
2015. CA Cancer J Clin. 66:115–132. 2016. View Article : Google Scholar : PubMed/NCBI
|
|
3
|
Nair S, Mason A, Eason J, Loss G and
Perrillo RP: Is obesity an independent risk factor for
hepatocellular carcinoma in cirrhosis? Hepatology. 36:150–155.
2002. View Article : Google Scholar : PubMed/NCBI
|
|
4
|
Baffy G, Brunt EM and Caldwell SH:
Hepatocellular carcinoma in non-alcoholic fatty liver disease: An
emerging menace. J Hepatol. 56:1384–1391. 2012. View Article : Google Scholar : PubMed/NCBI
|
|
5
|
Yang JD and Roberts LR: Hepatocellular
carcinoma: A global view. Nat Rev Gastroenterol Hepatol. 7:448–458.
2010. View Article : Google Scholar : PubMed/NCBI
|
|
6
|
Valle JW, Dangoor A, Beech J, Sherlock DJ,
Lee SM, Scarffe JH, Swindell R and Ranson M: Treatment of
inoperable hepatocellular carcinoma with pegylated liposomal
doxorubicin (PLD): Results of a phase II study. Br J Cancer.
92:628–630. 2005. View Article : Google Scholar : PubMed/NCBI
|
|
7
|
Llovet JM and Bruix J: Molecular targeted
therapies in hepatocellular carcinoma. Hepatology. 48:1312–1327.
2008. View Article : Google Scholar : PubMed/NCBI
|
|
8
|
Whittaker S, Marais R and Zhu AX: The role
of signaling pathways in the development and treatment of
hepatocellular carcinoma. Oncogene. 29:4989–5005. 2010. View Article : Google Scholar : PubMed/NCBI
|
|
9
|
Wang XW, Hussain SP, Huo TI, Wu CG,
Forgues M, Hofseth LJ, Brechot C and Harris CC: Molecular
pathogenesis of human hepatocellular carcinoma. Toxicology.
181–182:43–47. 2002. View Article : Google Scholar
|
|
10
|
Rinninella E, Zocco MA, De Gaetano A,
Iezzi R, Campanale M, Cesario V, Barbaro F, Ponziani FR, Caracciolo
G, Triarico S, et al: From small nodule to overt HCC: A multistep
process of carcinogenesis as seen during surveillance. Eur Rev Med
Pharmacol Sci. 16:1292–1294. 2012.PubMed/NCBI
|
|
11
|
Brazma A, Parkinson H, Sarkans U,
Shojatalab M, Vilo J, Abeygunawardena N, Holloway E, Kapushesky M,
Kemmeren P, Lara GG, et al: ArrayExpress-a public repository for
microarray gene expression data at the EBI. Nucleic Acids Res.
31:68–71. 2003. View Article : Google Scholar : PubMed/NCBI
|
|
12
|
Schulze K, Imbeaud S, Letouze E,
Alexandrov LB, Calderaro J, Rebouissou S, Couchy G, Meiller C,
Shinde J, Soysouvanh F, et al: Exome sequencing of hepatocellular
carcinomas identifies new mutational signatures and potential
therapeutic targets. Nat Genet. 47:505–511. 2015. View Article : Google Scholar : PubMed/NCBI
|
|
13
|
Roessler S, Jia HL, Budhu A, Forgues M, Ye
QH, Lee JS, Thorgeirsson SS, Sun Z, Tang ZY, Qin LX and Wang XW: A
unique metastasis gene signature enables prediction of tumor
relapse in early-stage hepatocellular carcinoma patients. Cancer
Res. 70:10202–10212. 2010. View Article : Google Scholar : PubMed/NCBI
|
|
14
|
Tung EK, Mak CK, Fatima S, Lo RC, Zhao H,
Zhang C, Dai H, Poon RT, Yuen MF, Lai CL, et al:
Clinicopathological and prognostic significance of serum and tissue
Dickkopf-1 levels in human hepatocellular carcinoma. Liver Int.
31:1494–1504. 2011. View Article : Google Scholar : PubMed/NCBI
|
|
15
|
Ashburner M, Ball CA, Blake JA, Botstein
D, Butler H, Cherry JM, Davis AP, Dolinski K, Dwight SS, Eppig JT,
et al: Gene ontology: Tool for the unification of biology. The gene
ontology consortium. Nat Genet. 25:25–29. 2000. View Article : Google Scholar : PubMed/NCBI
|
|
16
|
Lebrec JJ, Huizinga TW, Toes RE,
Houwing-Duistermaat JJ and van Houwelingen HC: Integration of gene
ontology pathways with North American Rheumatoid Arthritis
Consortium genome-wide association data via linear modeling. BMC
Proc. 3 Suppl 7:S942009. View Article : Google Scholar : PubMed/NCBI
|
|
17
|
Shannon P, Markiel A, Ozier O, Baliga NS,
Wang JT, Ramage D, Amin N, Schwikowski B and Ideker T: Cytoscape: A
software environment for integrated models of biomolecular
interaction networks. Genome Res. 13:2498–2504. 2003. View Article : Google Scholar : PubMed/NCBI
|
|
18
|
Sung WK, Zheng H, Li S, Chen R, Liu X, Li
Y, Lee NP, Lee WH, Ariyaratne PN, Tennakoon C, et al: Genome-wide
survey of recurrent HBV integration in hepatocellular carcinoma.
Nat Genet. 44:765–769. 2012. View
Article : Google Scholar : PubMed/NCBI
|
|
19
|
Mah WC, Thurnherr T, Chow PK, Chung AY,
Ooi LL, Toh HC, Teh BT, Saunthararajah Y and Lee CG: Methylation
profiles reveal distinct subgroup of hepatocellular carcinoma
patients with poor prognosis. PLoS One. 9:e1041582014. View Article : Google Scholar : PubMed/NCBI
|
|
20
|
Franceschini A, Szklarczyk D, Frankild S,
Kuhn M, Simonovic M, Roth A, Lin J, Minguez P, Bork P, von Mering C
and Jensen LJ: STRING v9.1: Protein-protein interaction networks,
with increased coverage and integration. Nucleic Acids Res.
41:D808–D815. 2013. View Article : Google Scholar : PubMed/NCBI
|
|
21
|
Pilati C, Letouze E, Nault JC, Imbeaud S,
Boulai A, Calderaro J, Poussin K, Franconi A, Couchy G, Morcrette
G, et al: Genomic profiling of hepatocellular adenomas reveals
recurrent FRK-activating mutations and the mechanisms of malignant
transformation. Cancer Cell. 25:428–441. 2014. View Article : Google Scholar : PubMed/NCBI
|
|
22
|
Ahn SM, Jang SJ, Shim JH, Kim D, Hong SM,
Sung CO, Baek D, Haq F, Ansari AA, Lee SY, et al: Genomic portrait
of resectable hepatocellular carcinomas: Implications of RB1 and
FGF19 aberrations for patient stratification. Hepatology.
60:1972–1982. 2014. View Article : Google Scholar : PubMed/NCBI
|
|
23
|
Ejlertsen B, Tuxen MK, Jakobsen EH, Jensen
MB, Knoop AS, Højris I, Ewertz M, Balslev E, Danø H, Vestlev PM, et
al: Adjuvant cyclophosphamide and docetaxel with or without
epirubicin for early TOP2A-normal breast cancer: DBCG 07-READ, an
open-label, phase III, randomized trial. J Clin Oncol.
35:2639–2646. 2017. View Article : Google Scholar : PubMed/NCBI
|
|
24
|
Di Leo A, Desmedt C, Bartlett JM, Piette
F, Ejlertsen B, Pritchard KI, Larsimont D, Poole C, Isola J, Earl
H, et al: HER2 and TOP2A as predictive markers for
anthracycline-containing chemotherapy regimens as adjuvant
treatment of breast cancer: A meta-analysis of individual patient
data. Lancet Oncol. 12:1134–1142. 2011. View Article : Google Scholar : PubMed/NCBI
|
|
25
|
Fritz P, Cabrera CM, Dippon J, Gerteis A,
Simon W, Aulitzky WE and van der Kuip H: c-erbB2 and topoisomerase
IIalpha protein expression independently predict poor survival in
primary human breast cancer: A retrospective study. Breast Cancer
Res. 7:R374–R384. 2005. View
Article : Google Scholar : PubMed/NCBI
|
|
26
|
Lazaris AC, Kavantzas NG, Zorzos HS,
Tsavaris NV and Davaris PS: Markers of drug resistance in relapsing
colon cancer. J Cancer Res Clin Oncol. 128:114–118. 2002.
View Article : Google Scholar : PubMed/NCBI
|
|
27
|
Costa MJ, Hansen CL, Holden JA and Guinee
D Jr: Topoisomerase II alpha: Prognostic predictor and cell cycle
marker in surface epithelial neoplasms of the ovary and peritoneum.
Int J Gynecol Pathol. 19:248–257. 2000. View Article : Google Scholar : PubMed/NCBI
|
|
28
|
Wong N, Yeo W, Wong WL, Wong NL, Chan KY,
Mo FK, Koh J, Chan SL, Chan AT, Lai PB, et al: TOP2A overexpression
in hepatocellular carcinoma correlates with early age onset,
shorter patients survival and chemoresistance. Int J Cancer.
124:644–652. 2009. View Article : Google Scholar : PubMed/NCBI
|
|
29
|
Stoimenov I and Helleday T: PCNA on the
crossroad of cancer. Biochem Soc Trans. 37:605–613. 2009.
View Article : Google Scholar : PubMed/NCBI
|
|
30
|
Yoon SM, Gerasimidou D, Kuwahara R,
Hytiroglou P, Yoo JE, Park YN and Theise ND: Epithelial cell
adhesion molecule (EpCAM) marks hepatocytes newly derived from
stem/progenitor cells in humans. Hepatology. 53:964–973. 2011.
View Article : Google Scholar : PubMed/NCBI
|
|
31
|
Cai X, Zhai J, Kaplan DE, Zhang Y, Zhou L,
Chen X, Qian G, Zhao Q, Li Y, Gao L, et al: Background progenitor
activation is associated with recurrence after hepatectomy of
combined hepatocellular-cholangiocarcinoma. Hepatology.
56:1804–1816. 2012. View Article : Google Scholar : PubMed/NCBI
|
|
32
|
Visakorpi T: Proliferative activity
determined by DNA flow cytometry and proliferating cell nuclear
antigen (PCNA) immunohistochemistry as a prognostic factor in
prostatic carcinoma. J Pathol. 168:7–13. 1992. View Article : Google Scholar : PubMed/NCBI
|
|
33
|
Dworakowska D, Gozdz S, Jassem E, Badzio
A, Kobierska G, Urbaniak A, Skokowski J, Damps I and Jassem J:
Prognostic relevance of proliferating cell nuclear antigen and p53
expression in non-small cell lung cancer. Lung Cancer. 35:35–41.
2002. View Article : Google Scholar : PubMed/NCBI
|
|
34
|
Wang SC, Nakajima Y, Yu YL, Xia W, Chen
CT, Yang CC, McIntush EW, Li LY, Hawke DH, Kobayashi R and Hung MC:
Tyrosine phosphorylation controls PCNA function through protein
stability. Nat Cell Biol. 8:1359–1368. 2006. View Article : Google Scholar : PubMed/NCBI
|
|
35
|
Jeng YM, Peng SY, Lin CY and Hsu HC:
Overexpression and amplification of Aurora-A in hepatocellular
carcinoma. Clin Cancer Res. 10:2065–2071. 2004. View Article : Google Scholar : PubMed/NCBI
|
|
36
|
Chen SS, Chang PC, Cheng YW, Tang FM and
Lin YS: Suppression of the STK15 oncogenic activity requires a
transactivation-independent p53 function. EMBO J. 21:4491–4499.
2002. View Article : Google Scholar : PubMed/NCBI
|
|
37
|
Dauch D, Rudalska R, Cossa G, Nault JC,
Kang TW, Wuestefeld T, Hohmeyer A, Imbeaud S, Yevsa T, Hoenicke L,
et al: A MYC-aurora kinase A protein complex represents an
actionable drug target in p53-altered liver cancer. Nat Med.
22:744–753. 2016. View
Article : Google Scholar : PubMed/NCBI
|
|
38
|
Tokunaga M, Uto H, Oda K, Tokunaga M,
Mawatari S, Kumagai K, Haraguchi K, Oketani M, Ido A, Ohnou N, et
al: Influence of human T-lymphotropic virus type 1 coinfection on
the development of hepatocellular carcinoma in patients with
hepatitis C virus infection. J Gastroenterol. 49:1567–1577. 2014.
View Article : Google Scholar : PubMed/NCBI
|
|
39
|
Liu B, Hong S, Tang Z, Yu H and Giam CZ:
HTLV-I Tax directly binds the Cdc20-associated anaphase-promoting
complex and activates it ahead of schedule. Proc Natl Acad Sci USA.
102:63–68. 2005. View Article : Google Scholar : PubMed/NCBI
|
|
40
|
Jin B, Wang W, Du G, Huang GZ, Han LT,
Tang ZY, Fan DG, Li J and Zhang SZ: Identifying hub genes and
dysregulated pathways in hepatocellular carcinoma. Eur Rev Med
Pharmacol Sci. 19:592–601. 2015.PubMed/NCBI
|
|
41
|
Calle EE and Kaaks R: Overweight, obesity
and cancer: Epidemiological evidence and proposed mechanisms. Nat
Rev Cancer. 4:579–591. 2004. View
Article : Google Scholar : PubMed/NCBI
|
|
42
|
White DL, Kanwal F and El-Serag HB:
Association between nonalcoholic fatty liver disease and risk for
hepatocellular cancer, based on systematic review. Clin
Gastroenterol Hepatol. 10:1342–1359.e2. 2012. View Article : Google Scholar : PubMed/NCBI
|
|
43
|
Lengauer C, Kinzler KW and Vogelstein B:
Genetic instabilities in human cancers. Nature. 396:643–649. 1998.
View Article : Google Scholar : PubMed/NCBI
|
|
44
|
Zhang J, Li Z, Liu L, Wang Q, Li S, Chen
D, Hu Z, Yu T, Ding J, Li J, et al: Long noncoding RNA TSLNC8 is a
tumor suppressor that inactivates the IL-6/STAT3 signaling pathway.
Hepatology. 67:171–187. 2017. View Article : Google Scholar : PubMed/NCBI
|
|
45
|
Sharma SA, Kowgier M, Hansen BE, Brouwer
WP, Maan R, Wong D, Shah H, Khalili K, Yim C, Heathcote EJ, et al:
Toronto HCC risk index: A validated scoring system to predict
10-year risk of HCC in patients with cirrhosis. J hepatol. Aug
24–2017.doi: 10.1016/j.jhep.2017.07.033.
|