Introduction
Magnesium (Mg), as well as its alloys, is a new type
of biodegradable metallic material used in bone repair and
regeneration (1). Compared with
the currently approved metallic agents, such as titanium and
stainless steel, Mg alloys possess improved osteo-inductive and
osteo-conductive capacities, well adapted for bone healing in
vivo and in vitro (2-4),
hence Mg alloys are of great interest for orthopedic applications
(5). One of the degradation
products of Mg alloy implants in vivo, H2, is a
physiologically inert gas. A previous study demonstrated that
H2 has a variety of physiological functions and
therapeutic effects, which have been studied in ~166 human disease
models thus far (6). For
musculoskeletal applications, the results of animal experiments
have revealed that H2 can alleviate bone loss caused by
microgravity (7,8) and that H2-rich water can
inhibit the resorption of alveolar bone (9).
Osteoclasts originate from bone marrow mononuclear
cells (BMMCs), which are derived from hematopoietic stem cells and
they can differentiate into osteoclasts in vitro through
Rankl-induced NF-кB, MAPK and AKT signaling pathways (10,11).
These highly specialized cells can degrade and digest the bone
matrix (12-14).
Furthermore, the aberrant production and/or the abnormal lifespan
of osteoclasts have been found to be the cause(s) of benign or
malignant bone diseases (15,16).
As such, osteoclasts have important roles in bone formation and
remodeling (17).
Our previous study revealed that H2 can
inhibit BMMC osteoclastogenesis in mice (18). It was observed that treatment with
50% H2 for 7 days could inhibit osteoclast formation,
osteoclast function and osteoclast-related gene expression of
osteoclast-induced BMMCs and that treatment with 50% H2
could reduce proliferation, promote apoptosis and inhibit the
expression of osteoclast-related proteins in BMMCs cultured in
osteoclast-induced medium.
Briefly, in pit formation assays, there was no
difference among the three groups (25, 50 and 75% H2)
when exposed to this inert gas for 5, 7 or 10 days. In reverse
transcription-quantitative (RT-q) PCR analyses, when BMMCs were
treated with H2 for 5 days, the expression of the three
osteoclast-related genes could not be inhibited. When BMMCs were
induced for 7 or 10 days, treatment with 2% H2 had no
inhibitory effect on the expression of osteoclast-related genes,
while treatment with 25, 50, or 75% H2 (especially 50
and 75% H2) significantly reduced the expression levels
of the osteoclast-related genes Ctsk, Calcr and
Mmp9. Therefore, based on these findings and the results of
a previous study (19), treatment
with 50% H2 for 7 days was selected as the optimal
condition to investigate the role of H2 in BMMC
proliferation and apoptosis. However, the mechanism by which this
occurs, which is critical for the translational research of
H2 and Mg alloys and the treatment of osteoporosis,
remains to be elucidated. The present study used transcriptome
sequencing to identify the possible mechanism behind the
H2-mediated inhibition of osteoclastogenesis and
revealed the key genes and signaling pathways involved, thereby
providing a theoretical basis for the anti-osteoporosis function of
H2.
Materials and methods
BMMC culture and osteoclast
induction
BMMCs were isolated as previously reported (20,21).
In brief, four-week-old C57BL/6 mice (~20 g) were purchased
(Changzhou Cavens Laboratory Animal Co., Ltd.). After the animals
(3 weeks old) were received, adaptive feeding was performed for 1
week. Food and water were freely available throughout the
experiment. The animals were maintained at 20-25˚C, with a 12:12 h
light and dark cycle and a relative humidity of 45-60%. When the
animals were 4 weeks old, they were sacrificed by neck-dislocation
and disinfected with 75% alcohol. Under sterile conditions, the
bilateral femurs and tibias were removed. The metaphyses of the
long bones were obtained and the bone marrow cavities were gently
and repeatedly irrigated with serum-free α-minimum essential medium
(α-MEM; HyClone; Cytiva). The collected washes were filtered
through a 200-mesh sieve and centrifuged (Sigma 3K15; Sigma
Laborzentrifugen GmbH) at 232 x g for 5 min at 20˚C. The
supernatant was discarded and the pelleted cells were resuspended
in sterile BL503A erythrocyte medium (Biosharp Life Sciences),
gently mixed by inversion and lysed on ice for 5 min. Subsequently,
the cell suspension was centrifuged at 161 x g for 5 min at 20˚C.
and the supernatant containing the lysed red blood cells was
discarded. The pelleted cells were resuspended, washed twice in
serum-free α-MEM and resuspended in 3 ml of α-MEM containing 10%
fetal bovine serum (FBS; Gibco; Thermo Fisher Scientific, Inc.).
The cells were statically inoculated in 60-mm culture dishes and
incubated overnight in a humidified atmosphere of 5% CO2
at 37˚C. Thereafter, the supernatant was collected and centrifuged
at 232 x g for 3 min at 20˚C to obtain the mouse BMMCs. The BMMCs
were resuspended in α-MEM containing 10% FBS, appropriately diluted
and inoculated in 3.5 cm diameter culture dishes at
~1x10⁵ primary cells per well. The medium was replaced
every two days.
Depending on the H2 concentration in the
incubator, the primary cells (P1) were divided into two groups as
follows: The experimental group (BMMCs + 50% H2 + 20%
O2 + 5% CO2 + 25% N2) and the
control group (BMMCs + 20% O2 + 5% CO2 + 75%
N2). The H2 in the incubator entered the cell
culture medium by dissolution-diffusion. To induce osteoclast
differentiation, 20 ng/ml macrophage colony stimulating factor
(Csf1; PeproTech China) and 50 ng/ml receptor activator of NF-κB
ligand (Rankl; R&D Systems, Inc.) were used. The BMMCs were
cultured in separate incubators at 37˚C with or without 50%
H2 as aforementioned for 7 days and six repetitions were
tested for each treatment group. Therefore, a total of 12 samples
were collected; and six C57BL/6 mice, half male and half female,
were used in this experiment.
Ethics statement
The present study was conducted in accordance with
the ethical standards of the Ethics Committee of Peking University
Shenzhen Hospital, who approved the experimental protocols.
Total RNA extraction
Total RNA was extracted from the cells using
TRIzol® (Thermo Fisher Scientific, Inc.), according to
the manufacturer's instructions. In brief, 1.5 ml of
TRIzol® was added to the pelleted cells, followed
homogenization for 2 min and a 5-min horizontal rest period to
permit the complete dissociation of nucleoprotein complexes. The
mix was centrifuged at 12,000 x g for 5 min at 4˚C. The upper phase
was transferred into new tubes and 0.3 ml of chloroform/isoamyl
alcohol (24:1) was added. The samples were vortexed and centrifuged
at 12,000 x g for 10 min at 4˚C. Thereafter, the upper aqueous
phase was transferred into a new tube and an equivalent volume of
isopropyl alcohol (Xilong Science Co., Ltd.) was added, followed by
vortexing, precipitation and centrifuged at 17,500 x g for 20 min
at 4˚C. The pelleted RNA was washed twice with 75% ethanol,
air-dried and resuspended in 25 µl of diethyl pyrocarbonate-treated
water. The RNA was qualified and quantified using an Agilent 2100
bioanalyzer (Agilent Technologies, Inc.) and a Nanodrop
spectrophotometer (Thermo Fisher Scientific, Inc.),
respectively.
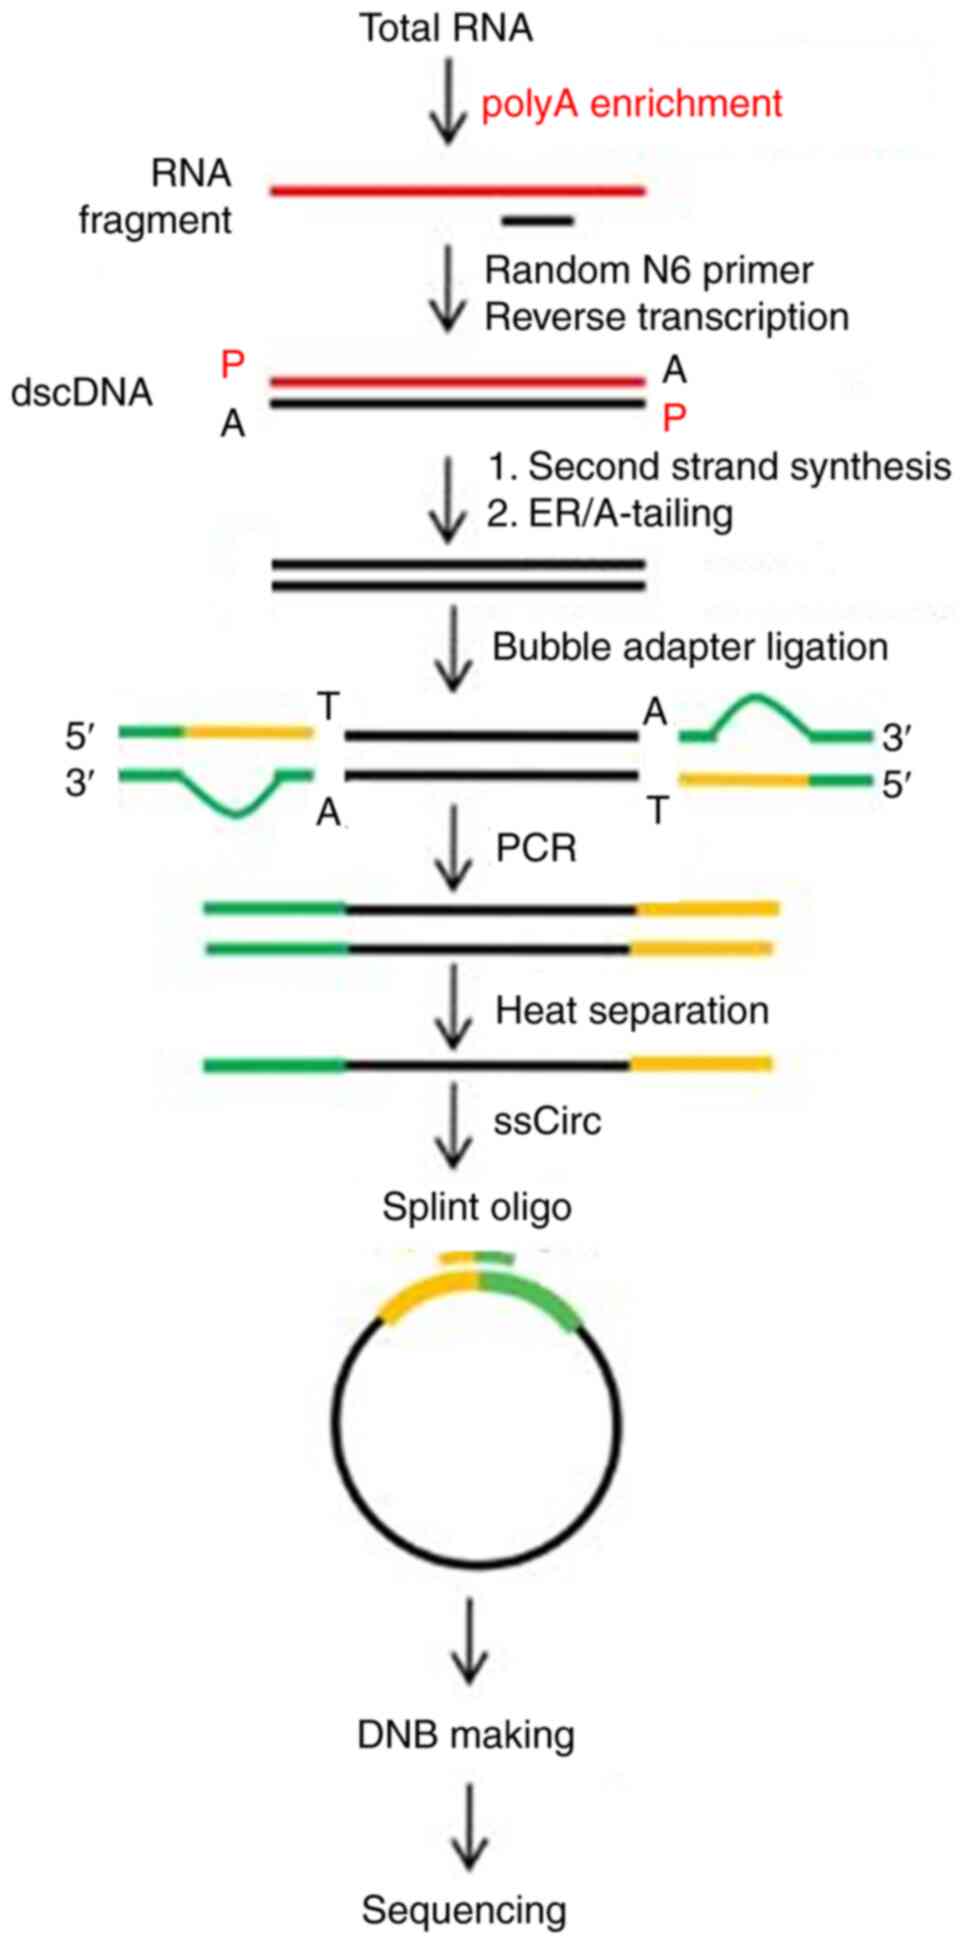
mRNA library construction
mRNA library construction and transcriptome
sequencing were performed at the Beijing Genomics Institution
(Fig. 1). Oligo(dT) magnetic beads
were used to obtain the purified mRNA, which was divided into
smaller fragments. First-strand cDNA was generated by random
hexamer-primed reverse transcription, followed by second-strand
cDNA synthesis. The synthesized cDNA was subjected to end-repair
and 3' adenylation and the adapters were ligated to the ends of the
3' adenylated cDNA fragments. The cDNA was amplified by PCR and the
products were purified using Ampure XP beads (Agencourt; Beckman
Coulter, Inc.) and dissolved in ethidium bromide solution. The
double-stranded PCR products were denatured and circularized
according to the splint oligo sequence to obtain the final library.
Single-stranded circular DNA was designated as the final library.
For quality control (QC), the library was validated using the
Agilent Technologies 2100 bioanalyzer (Agilent Technologies, Inc.).
The Standard Sensitivity RNA Analysis Kit (15 nt, DNF-471; Agilent
Technologies, Inc.) was used as a detection kit for this
section.
Transcriptome sequencing
The final library was amplified with φ29 DNA
polymerase to make DNA nanoballs (DNBs), which had more than 300
copies of each molecule. The DNBs were loaded onto the patterned
nanoarray and 150 paired-end base reads were generated using
combinatorial probe-anchor synthesis on the BGIseq500 platform (BGI
Group).
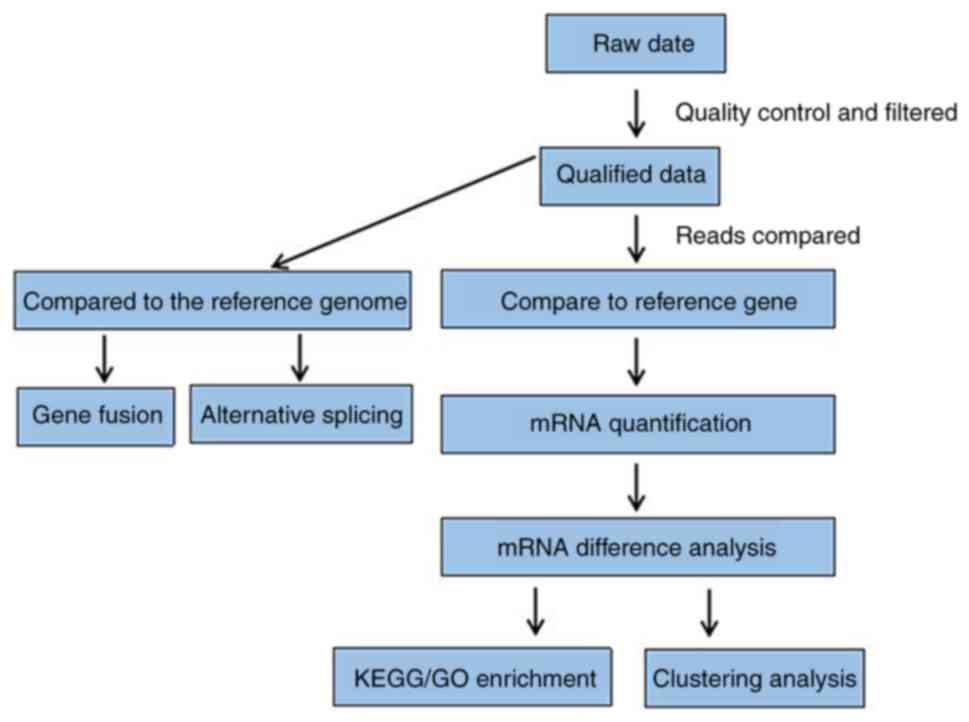
Bioinformatics analysis
The mouse (Mus_musculus; GCF_000001635.26_GRCm38.p6;
NCBI) genome served as the reference genome. The sequencing reads
were compared against the reference genome to annotate and quantify
the genes.
The sequencing data were designated as raw reads or
raw data. QC was performed on the raw reads and the qualified data
was used for subsequent analyses. After QC, the filtered clean
reads were compared to the reference sequences. Using the
statistical comparison rate and the distribution of reads of the
reference sequences, we determined whether the comparison results
passed the second QC (QC of alignment). After the QC was qualified,
the quantitative analysis of genes and the analysis of gene
expression levels (principal components, correlation scores,
differential gene screening) were performed. Additional analyses
were carried out for selected differentially expressed genes (DEGs)
such as Gene Ontology (GO; http://geneontology.org/) term enrichment analysis,
Kyoto Encyclopedia of Genes and Genomes (KEGG; https://www.genome.jp/kegg/) pathway enrichment
analysis, gene expression clustering analysis, SNP (single
nucleotide polymorphism) and InDell analyses and splicing gene
event analysis (Fig. 2).
The sequencing data were filtered using SOAPnuke
software (v1.5.2, https://github.com/BGI-flexlab/SOAPnuke) as follows:
i) Reads containing a junction (junction contamination) were
removed; ii) reads containing >5% of unknown bases were
eliminated; and iii) low quality reads (reads with a mass value
<10, accounting for >20% of the total bases as low quality
reads) were removed. The filtered ‘clean reads’ were saved in FASTQ
format.
Sample correlation analysis
Pearson correlation coefficients for all gene
expression levels between the two samples were calculated and
presented as heat maps to reflect the correlations between the gene
expression levels (the higher the correlation coefficient, the more
similar the gene expression level).
Gene expression distribution
analysis
The distribution of gene expression levels was
presented as box plots and the dispersion of the distributed data
was observed. The trends in the gene abundance and the expression
level were presented as density maps and the intervals of the gene
expression concentration areas were also analyzed. At the same
time, the gene number of the expected number of fragments per
kilobase of transcript sequence per million base pairs sequenced
(FPKM; FPKM ≤1, FPKM=1-10, FPKM ≥10) in the three cases was counted
using stacked bar graphs, so as to visually display the gene
numbers in different FPKM intervals for each sample.
Differential expression analysis
Differential expression analysis of the paired
groups was performed using the DESeq 2 method (22). The screening conditions were as
follows: the difference multiple |log2FC| ≥1 and Q value ≤0.05.
Volcano maps were generated and analyzed to identify the
upregulated and downregulated DEGs.
Differential cluster analysis
According to the results of the identified DEGs, the
R project pheatmap tool (v1.0.12, https://cran.r-project.org/web/packages/pheatmap/) was
used for hierarchical clustering analysis. In terms of the gene
expression, Bowtie 2 software (v2.2.5, http://bowtie-bio.sourceforge.net/bowtie2/index.shtml)
(23) was used to compare the
clean reads to the reference gene sequences and RSEM software
(v1.2.8, http://deweylab.biostat.wisc.edu/rsem/rsem-calculate-expression.html)
was used to calculate the gene expression level of each sample
(24).
GO term enrichment analysis and GO
annotation classification of DEGs
Enrichment analysis was used to determine whether
each DEG was significantly enriched in terms of a specific
molecular function, biological process, or metabolic pathway.
According to the results of the GO annotations, the DEGs were
classified according to their function. The phyper function within
R software (v4.1.0, https://stat.ethz.ch/R-manual/R-devel/library/stats/html/Hypergeometric.html)
was used for enrichment analysis and P-values were calculated. The
false discovery rate (FDR) correction was performed using the
P-value (v2.26.0, https://bioconductor.org/packages/release/bioc/html/qvalue.html)
to obtain the Q-value. The GO terms that satisfied the
Q-value ≤0.05 criterion were defined as significantly
enriched and DEGs were assigned different biological functions.
According to the results of the GO annotations, the DEGs were
divided into three functional categories; molecular functions,
cellular components and biological processes.
KEGG pathway enrichment analysis and
KEGG annotation classification of DEGs
According to the results of the KEGG pathway
annotations, the phyper function within R software was used for
enrichment analysis. The FDR correction was performed using the
P-value to obtain the Q-value. The unigenes that satisfied
the Q-value ≤0.05 criterion were significantly expressed in
GO term and KEGG pathway analyses. KEGG metabolic pathways related
to DEGs were divided into seven categories: Cellular processes,
environmental information processing, genetic information
processing, human diseases (animal only), metabolic processes,
organic systems and drug development. Pathway enrichment analysis
determined the main biochemical metabolic pathways and signal
transduction pathways related to the DEGs.
Alternative splicing and differential
alternative splicing analysis
Following filtering, the clean reads were compared
with the reference genome for reference genome alignment using
HISAT 2 software (v2.0.4, http://www.ccb.jhu.edu/software/hisat) (25). The alternative splicing events and
the differential alternative splicing events between the two groups
were identified by rMATS software (v3.2.5, http://rnaseq-mats.sourceforge.net) (26). The alternative splicing events were
skipped exons (SE), alternative 5' splicing sites, alternative 3'
splicing sites (A3SS), mutually exclusive exons and retained
introns (RI).
Gene fusion analysis
Gene fusion is the process by which a portion or the
whole sequence of one gene is fused with that of another gene to
form a new gene. Ericscript software (v0.5.5, http://ericscript.sourceforge.net/) (27) was used for gene fusion analysis and
gene fusion events were identified by comparing the sequences of
paired-end relationships between the genome and the transcript. The
mechanisms of gene fusion were chromosome translocations,
intermediate deletions, chromosome inversions and trans
splicing.
Target gene analysis
According to the expression and the enrichment of
the DEGs, the target genes and related signaling pathways involved
in the H2-mediated inhibition of BMMC osteoclastogenesis
were predicted and analyzed.
Statistical analysis
Continuous variables were presented as the mean ±
standard deviation (X ± S). The results were analyzed
by one-way ANOVA, followed by LSD or Dunnett's multiple comparison
test, or by Student's t-test using SPSS 19.0 software (IBM
Corp.). P<0.05 was considered to indicate a statistically
significant difference.
Results
In the present study, 12 samples were sequenced and
analyzed using the BGISEQ-500 platform. On average, each sample
yielded 6.71G of data and a total of 17,267 genes were detected.
For the clean reads of the H2 group and the control
group, the average comparison rates to the reference genome were
92.54 and 93.29%, respectively; and the average comparison rates to
the reference gene set were 75.75 and 76.84%, respectively. All the
rates were >70.00%, indicating that the reference genome
selection was appropriate. According to the clean reads sequencing
data of the H2 group and the control group, the 99.00%
base correct recognition rates (Q20) were 96.05 and 96.49%,
respectively and the 99.90% base correct recognition rates (Q30)
were 86.78 and 87.79%, respectively. The sequencing quality met the
requirements of subsequent analysis.
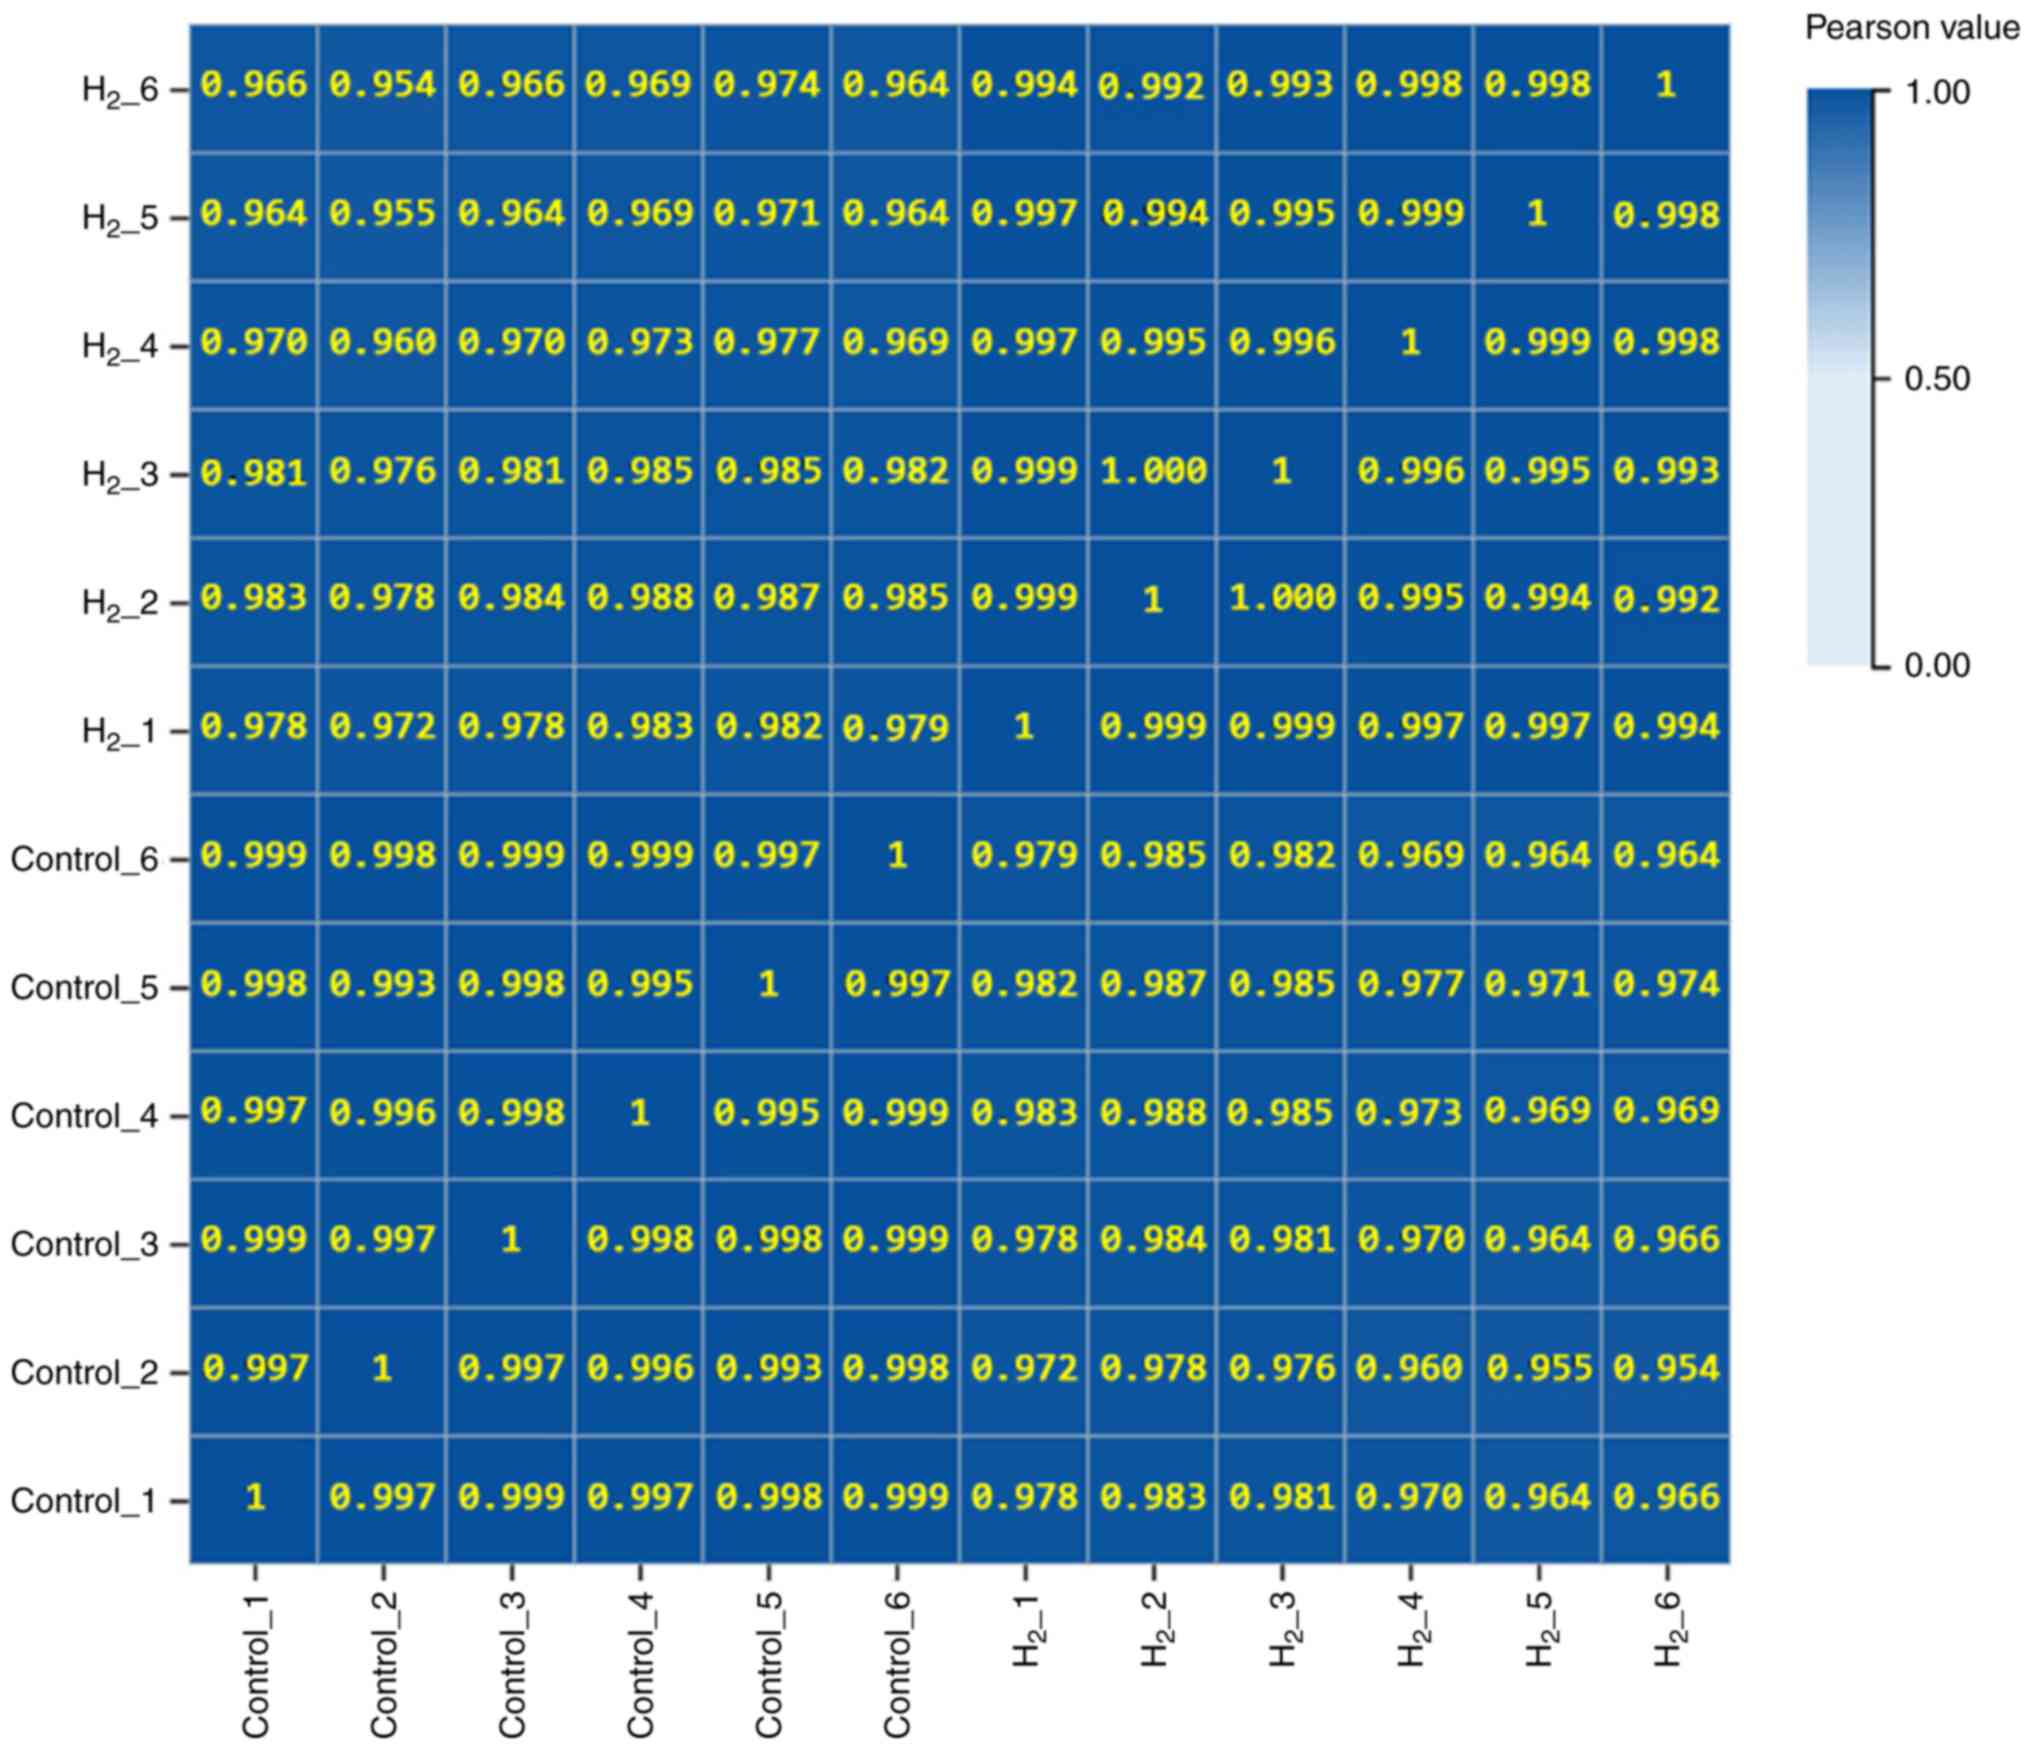
Samples show good biological
repetition
As shown in Fig. 3,
Pearson correlation coefficient analysis revealed that the
correlation coefficient between any two samples was >0.95,
indicating that the gene expression levels among the samples were
very similar and the samples showed good biological repetition.
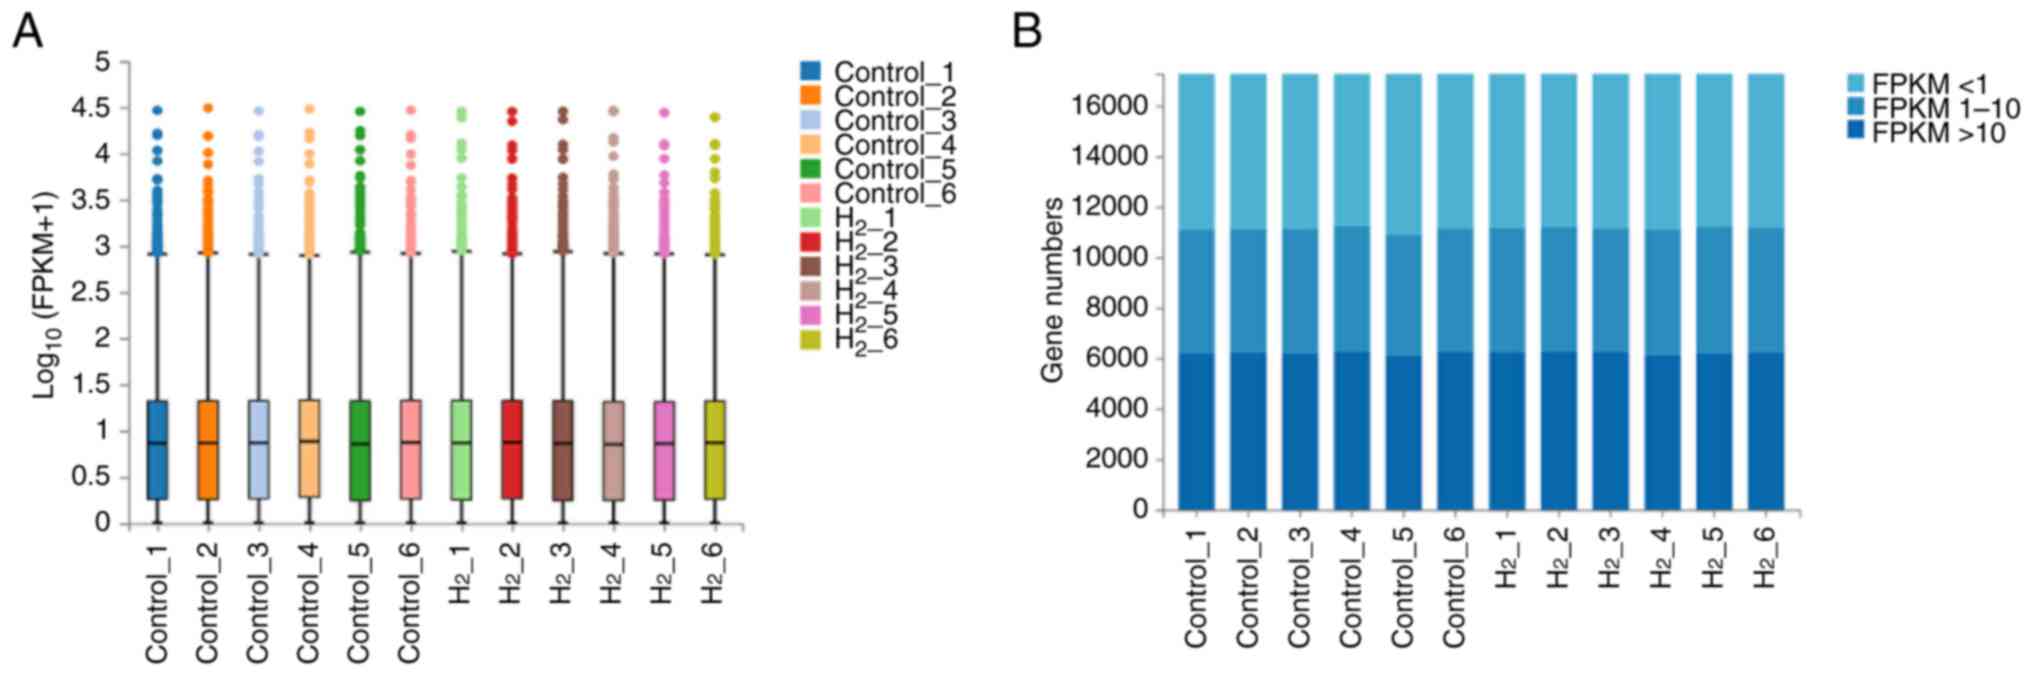
Gene expression distribution analysis
shows that the sequencing data are well standardized
The sequencing data were standardized and a box plot
distribution of the gene expression levels of each sample is shown
in Fig. 4A. The median of the box
plot of each sample was aligned. The stacked histogram results of
the gene number accumulation in different FPKM intervals of the
H2 group and the control group were shown in Fig. 4B and Table I. The differences in the gene
number of the medium-high expression level (t=-0.564; P=0.585), low
expression level (t=-1.779; P=0.106), or very low expression level
(t=1.318; P=0.217) were not statistically significant. The gene
expression box plot and the gene number stacked histogram showed
that the sequencing data were well standardized and met the
experimental requirements.
 | Table IGene number distribution of both
groups in different FPKM intervals. |
Table I
Gene number distribution of both
groups in different FPKM intervals.
| FPKM intervals | ≥10 | ~1-10 | ≤1 |
|---|
| H2
group | 6,234.3±51.52 | 4,945.3±30.98 | 6,087.0±41.17 |
| Control group | 6,215.0±66.37 | 4,900.5±53.39 | 6,151.5±111.92 |
DEGs identified and their expression
levels
In this experiment, the criteria for identifying the
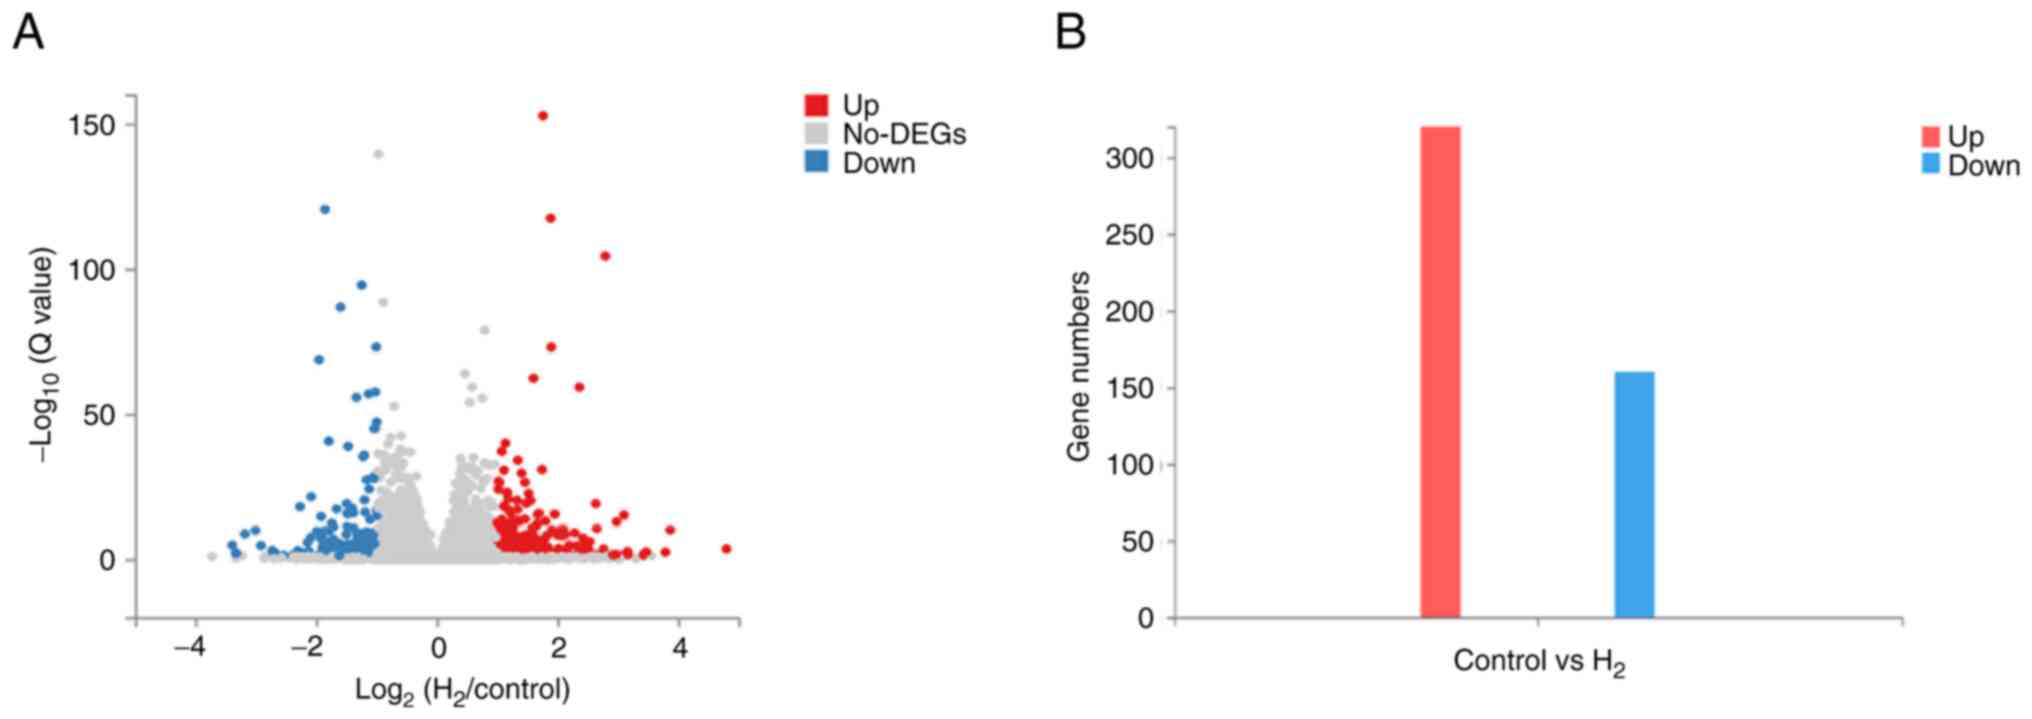
DEGs were as follows: |log2FC| ≥1 and Q-value ≤0.05. The
results showed that there were 480 DEGs between the H2
group and the control group. Among them, 320 DEGs were upregulated
and 160 DEGs were downregulated (Fig.
5).
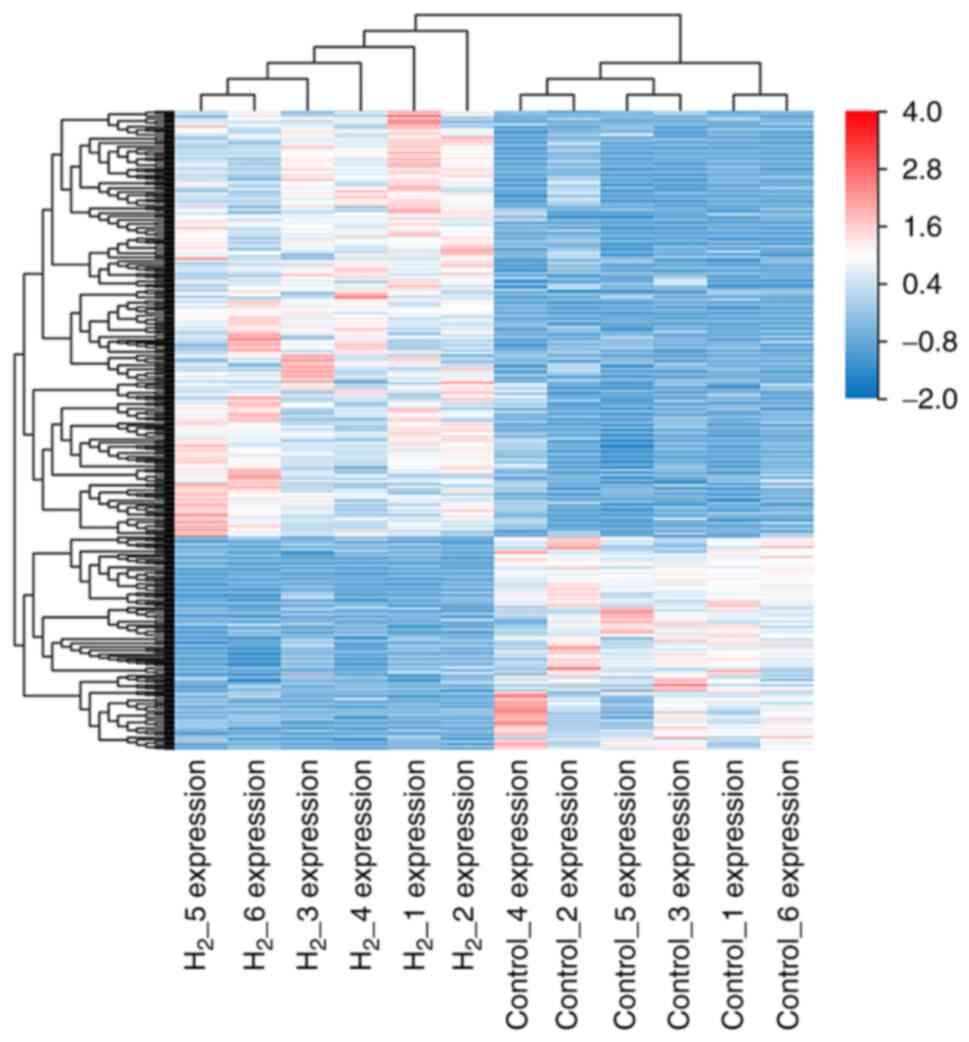
As shown in Fig. 6,
the results of RNA-seq cluster analysis showed that the
H2 group and the control group could be completely
separated and the corresponding gene expression patterns of the two
groups were significantly different. The high expression values of
the DEGs in the grouped samples are represented in red and the low
expression values of the DEGs in the grouped samples are
represented in blue.
GO term enrichment and KEGG pathway
enrichment of DEGs
As shown in Table
II, among the GO enriched terms, the top five enriched gene
terms for cellular components were mainly related to extracellular
region, extracellular space, extracellular matrix,
collagen-containing extracellular matrix and collagen trimer. The
top five enriched gene terms for molecular functions were mainly
related to extracellular matrix structural constituent, growth
factor activity, heparin binding, extracellular matrix structural
constituent conferring tensile strength and aldehyde dehydrogenase
activity. The top five enriched gene terms for biological processes
were mainly related to regulation of signaling receptor activity,
immune response, positive regulation of angiogenesis, cholesterol
biosynthesis and sterol biosynthesis.
| Table IIGO enrichment analysis of
differentially expressed genes. |
Table II
GO enrichment analysis of
differentially expressed genes.
| Term type | Term ID | Term
description | Term candidate gene
num | Rich ratio | Q-value |
|---|
| GO_C | GO:0005576 | Extracellular
region | 99 | 0.052519894 |
1.41x10⁻¹⁵ |
| | GO:0005615 | Extracellular
space | 87 | 0.050464037 |
1.25x10⁻¹² |
| | GO:0031012 | Extracellular
matrix | 30 | 0.107142857 |
2.78x10⁻¹¹ |
| | GO:0062023 | Collagen-containing
extracellular matrix | 27 | 0.088815789 |
2.56x10⁻⁸ |
| | GO:0005581 | Collagen
trimer | 13 | 0.141304348 |
4.34x10⁻⁶ |
| GO_F | GO:0005201 | Extracellular
matrix structural constituent | 16 | 0.130081301 |
5.22x10⁻⁶ |
| | GO:0008083 | Growth factor
activity | 16 | 0.101910828 |
6.58x10⁻⁵ |
| | GO:0008201 | Heparin
binding | 17 | 0.094972067 |
6.58x10⁻⁵ |
| | GO:0030020 | Extracellular
matrix structural constituent conferring tensile strength | 8 | 0.205128205 |
2.24x10⁻⁴ |
| | GO:0004030 | Aldehyde
dehydrogenase [NAD(P)+] activity | 3 | 0.75 |
3.26x10⁻³ |
| GO_P | GO:0010469 | Regulation of
signaling receptor activity | 35 | 0.079726651 |
3.22x10⁻⁸ |
| | GO:0006955 | Immune
response | 26 | 0.083601286 |
1.80x10⁻⁶ |
| | GO:0045766 | Positive regulation
of angiogenesis | 18 | 0.120805369 |
1.80x10⁻⁶ |
| | GO:0006695 | Cholesterol
biosynthetic process | 9 | 0.264705882 |
1.35x10⁻⁵ |
| | GO:0016126 | Sterol biosynthetic
process | 8 | 0.275862069 |
4.35x10⁻⁵ |
As shown in Table
III, among the KEGG pathway enriched terms, the top five
enriched pathway terms were mainly related to ECM-receptor
interactions, protein digestion and absorption, TNF signaling
pathway, terpenoid backbone biosynthesis and sesquiterpenoid and
triterpenoid biosynthesis.
| Table IIIKEGG pathway enrichment analysis of
differentially expressed genes. |
Table III
KEGG pathway enrichment analysis of
differentially expressed genes.
| Term ID | Term
description | Term candidate gene
number | Rich ratio | Q-value |
|---|
| 04512 | ECM-receptor
interaction | 12 | 0.130434783 |
3.22x10⁻⁴ |
| 04974 | Protein digestion
and absorption | 12 | 0.12244898 |
3.22x10⁻⁴ |
| 04668 | TNF signaling
pathway | 13 | 0.092198582 |
1.94x10⁻³ |
| 00900 | Terpenoid backbone
biosynthesis | 5 | 0.185185185 |
1.80x10⁻² |
| 00909 | Sesquiterpenoid and
triterpenoid biosynthesis | 2 | 1 |
1.96x10⁻² |
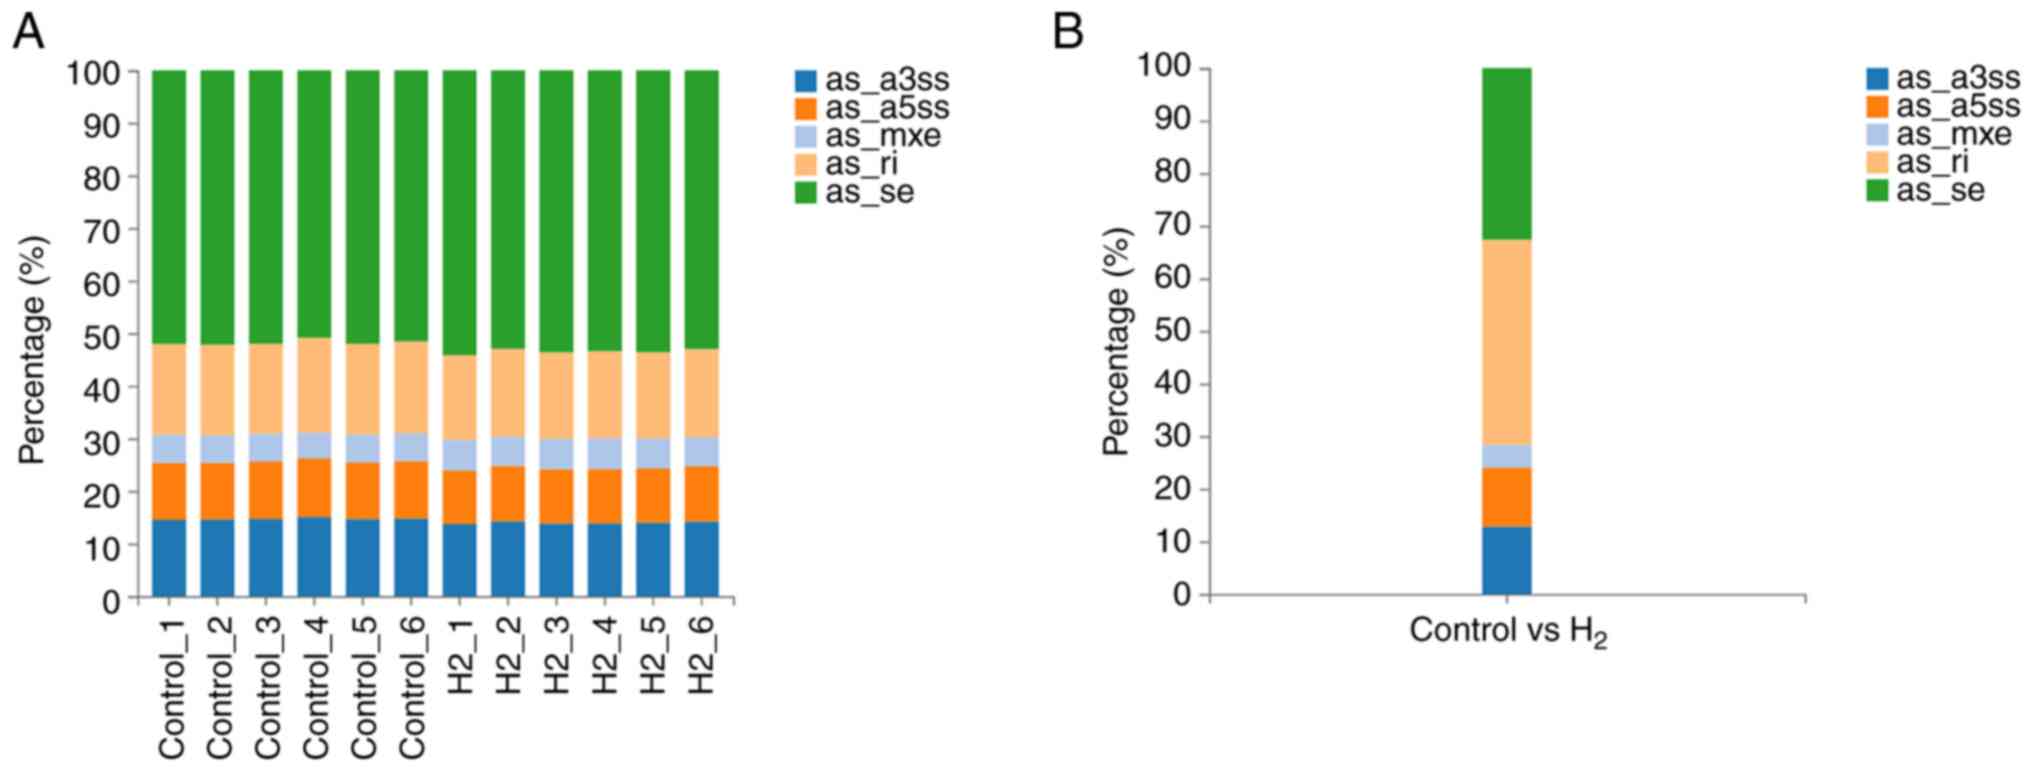
Main types of gene variations
The results showed that the main alternative
splicing events between the H2 group and the control
group were RI and SE, which accounted for 39.04 and 32.62% of
splicing events, respectively (Fig.
7 and Table IV).
| Table IVDifferent alternative splicing events
between groups. |
Table IV
Different alternative splicing events
between groups.
| Type | SE | A5SS | A3SS | MXE | RI |
|---|
| Percentage | 32.62% | 11.23% | 12.83% | 4.28% | 39.04% |
| Number | 61 | 21 | 24 | 8 | 73 |
As shown in Table
V, the analysis of gene fusion events in the H2
group and the control group showed that different degrees of gene
fusion occurred in both groups. The most common type of gene fusion
event was inter-chromosomal, in addition to a small number of
intra-chromosomal and read-through events.
| Table VGene fusion events. |
Table V
Gene fusion events.
| Sample | Upstream fusion
gene | Downstream fusion
gene | Types |
|---|
|
H2_1 | 14593,
NC_000079.6 | 235184,
NC_000075.6 |
Inter-chromosomal |
| | 18733,
NC_000073.6 | 100038909,
NC_000073.6 |
Intra-chromosomal |
|
H2_2 | 104662,
NC_000077.6 | 27364,
NC_000077.6 | Read-Through |
| | 20363,
NC_000081.6 | 13030,
NC_000080.6 |
Inter-chromosomal |
|
H2_3 | 66713,
NC_000077.6 | 11816,
NC_000073.6 |
Inter-chromosomal |
| | 75826,
NC_000082.6 | 228880,
NC_000068.7 |
Inter-chromosomal |
| | 14127,
NC_000067.6 | 242341,
NC_000070.6 |
Inter-chromosomal |
|
H2_4 | 215449,
NC_000076.6 | 268566,
NC_000078.6 |
Inter-chromosomal |
| | 18787,
NC_000071.6 | 12846,
NC_000082.6 |
Inter-chromosomal |
|
H2_5 | 72543,
NC_000068.7 | 13135,
NC_000080.6 |
Inter-chromosomal |
| | 19025,
NC_000068.7 | 19156,
NC_000076.6 |
Inter-chromosomal |
|
H2_6 | None | None | None |
| Control_1 | None | None | None |
| Control_2 | 238564,
NC_000079.6 | 21354,
NC_000083.6 |
Inter-chromosomal |
| | 233895,
NC_000073.6 | 15042,
NC_000083.6 |
Inter-chromosomal |
| | 70750,
NC_000067.6 | 114893,
NC_000069.6 |
Inter-chromosomal |
| | 50911,
NC_000069.6 | 12428,
NC_000069.6 | Read-Through |
| Control_3 | 67707,
NC_000069.6 | 55982,
NC_000071.6 |
Inter-chromosomal |
| Control_4 | 14127,
NC_000067.6 | 20583,
NC_000082.6 |
Inter-chromosomal |
| | 100042025,
NC_000087.7 | 19156,
NC_000076.6 |
Inter-chromosomal |
| Control_5 | None | None | None |
| Control_6 | 17876,
NC_000068.7 | 67179,
NC_000080.6 |
Inter-chromosomal |
| | 12986,
NC_000070.6 | 223658,
NC_000081.6 |
Inter-chromosomal |
| | 66129,
NC_000079.6 | 21804,
NC_000073.6 |
Inter-chromosomal |
Target genes and possible signaling
pathways
The analysis of the expression of DEGs, as well as
GO terms and KEGG pathways, identified a variety of targets
involved in the H2-mediated inhibition of BMMC
osteoclastogenesis as follows: Fos, Dusp1,
Cxcl1, Reln, Itga2b, Plin2, Lif,
Thbs1, Vegfa and Gadd45a (all upregulated) and
Hspa1b, Gm4951, F830016B08Rik, Fads2,
Hspa1a, Slc27a6, Cacna1b, Scd2,
Lama3 and Col4a5 (all downregulated). The analysis
also identified a variety of signaling pathways involved in
immunity, inflammation, oxidative stress and apoptosis as follows:
osteoclast differentiation cascades, as well as PI3K-AKT, FoxO,
MAPK, PPAR, TNF, TGF-β, JAK-STAT, RAS, VEGF, HIF-1 and AMPK
signaling pathways (Table
VI).
| Table VIDifferentially expressed genes and
signaling pathways. |
Table VI
Differentially expressed genes and
signaling pathways.
| Type | Gene ID | Gene symbol | log2
(H2/Control) | Q-value | KEGG pathway |
|---|
| Up | 14281 | Fos | 1.882 |
3.41x10-118 | MAPK signaling
pathway |
| | | | | | TNF signaling
pathway |
| | 19252 | Dusp1 | 1.756 |
1.72x10-153 | MAPK signaling
pathway |
| | 14825 | Cxcl1 | 1.474 |
4.02x10⁻²⁰ | TNF signaling
pathway |
| | 19699 | Reln | 1.388 |
3.41x10⁻⁸ | PI3K-Akt |
| | 16399 | Itga2b | 1.359 |
7.16x10⁻¹⁴ | PI3K-Akt signaling
pathway |
| | 11520 | Plin2 | 1.340 |
6.69x10⁻³⁵ | PPAR signaling
pathway |
| | 16878 | Lif | 1.332 |
5.84x10⁻¹⁸ | Jak-STAT signaling
pathway |
| | | | | | TNF signaling
pathway |
| | 21825 | Thbs1 | 1.217 |
5.06x10⁻¹⁷ | PI3K-Akt signaling
pathway |
| | | | | | TGF-β signaling
pathway |
| | 22339 | Vegfa | 1.111 |
4.04x10⁻¹⁹ | Ras signaling
pathway |
| | | | | | MAPK signaling
pathway |
| | | | | | VEGF signaling
pathway |
| | | | | | HIF-1 signaling
pathway |
| | | | | | PI3K-Akt signaling
pathway |
| | 13197 | Gadd45a | 1.034 |
3.56x10⁻²⁷ | FoxO signaling
pathway |
| | | | | | MAPK signaling
pathway |
| | | | | | p53 signaling
pathway |
| Down | 15511 | Hspa1b | -1.201 |
3.10x10⁻²¹ | MAPK signaling
pathway |
| | 240327 | Gm4951 | -1.222 |
3.78x10-36 | TNF signaling
pathway |
| | 240328 | F830016B08Rik | -1.334 |
1.61x10-56 | TNF signaling
pathway |
| | 56473 | Fads2 | -1.381 |
7.36x10⁻¹⁷ | PPAR signaling
pathway |
| | 193740 | Hspa1a | -1.478 |
1.76x10⁻¹⁶ | MAPK signaling
pathway |
| | 225579 | Slc27a6 | -1.500 |
2.42x10⁻⁹ | PPAR signaling
pathway |
| | 12287 | Cacna1b | -1.710 |
6.22x10⁻¹² | MAPK signaling
pathway |
| | 20250 | Scd2 | -1.793 |
1.67x10-41 | AMPK signaling
pathway |
| | | | | | PPAR signaling
pathway |
| | 16774 | Lama3 | -1.793 |
2.24x10⁻⁶ | PI3K-Akt signaling
pathway |
| | 12830 | Col4a5 | -1.905 |
1.56x10⁻⁸ | PI3K-Akt signaling
pathway |
Discussion
RNA-sequencing (quantification) is based on
next-generation high-throughput sequencing technologies that
provide accurate digital expression profiling information by
measuring transcript sequence levels and performing comparative
analyses to study the expression pattern of eukaryotic genes.
Transcriptome research is the basis and the starting point of gene
function and structure research, through which researchers can
comprehensively and quickly obtain almost all the transcript
sequence information for a specific tissue or organ of a certain
species under specific conditions.
In the present study, RNA-seq was used to study the
transcriptome of mouse BMMCs exposed to H2 in an
osteoclast-induced environment. The main signaling pathways of DEGs
were identified and they were involved in immunity, inflammation,
apoptosis and cell differentiation. Our previous study reported
that H2 could inhibit BMMC osteoclastogenesis in mice
(18). H2 can penetrate
membranes and enter cells, where it behaves as an antioxidant,
inhibiting the differentiation of BMMCs to osteoclasts (28-30).
It is well known that reactive oxygen species (ROS) (31), such as hydrogen peroxide (32) and superoxide dismutase (33), are osteoclast inducing factors, but
they are reversely regulated by H2, possibly due to its
strong reducing agent effect. Although several studies have
reported that ROS regulate osteoclastogenesis (34-37),
the existing studies have not reported the possible signaling
pathways that are involved in this process.
Fan et al (38) demonstrated that H2-rich
saline could decrease the expression levels of IL-6, JAK, STAT-3
and other signaling proteins by inhibiting the JAK-STAT signaling
pathway, thereby inhibiting myocardial hypertrophy in rats. Chen
et al (39) reported that
H2 exerts anti-apoptotic effects by inhibiting
Ras-ERK1/2-MEK1/2 and AKT signaling pathways in rat vascular smooth
muscle cells. At the same time, other studies have shown that
H2 could alleviate the damage induced by
lipopolysaccharides in an acute lung injury model (40); H2 can also upregulate
the expression of claudin-5 by activating the PI3K/AKT signaling
pathway in alveolar epithelial cells, thereby reducing cell
permeability and improving pulmonary edema (41). Other studies have demonstrated that
H2 can exert antioxidant, anti-inflammatory and
anti-apoptotic effects by inhibiting p38-MAPK (42), JNK-caspase 3(40) and NF-kB (11,43)
signaling pathways, in addition to NRF2, WNT/β-catenin, thioredoxin
interaction protein/NLR3 inflammasome and RHO/ROCK signaling
pathways.
The results of the above studies using different
cell or animal models were basically consistent with the results of
the present study. However, based on the results of gene enrichment
analysis, the present study identified new signaling pathways that
may have roles in BMMC osteoclastogenesis, including FoxO, PPAR,
TNF, TGF-β, VEGF, HIF-1 and AMPK signaling pathways. These
signaling pathways have roles in immunity, inflammation,
proliferation, differentiation, apoptosis, cell cycle regulation
and metabolism. At the same time, the findings of the present study
were different from those of previous studies. For example, the
studies of Takayanagi et al (44), Grigoriadis et al (45) and Jiao et al (46) showed that the Fos gene was
an osteoclast-inducible gene, but the present study showed that
H2 inhibited osteoclast differentiation and the
Fos gene was highly expressed. The reason for this
difference may be due to the different cells and culture methods
used in the different experiments, or it may be due to other
reasons that are currently unknown. Therefore, further studies are
needed to determine whether these genes have biological effects on
BMMCs through specific signaling pathways in an osteoclast-induced
environment and the results should be compared with those of
previous studies.
It is well known that osteoclasts serve an important
role in the occurrence and development of osteoporosis and the
present study showed that H2 could inhibit the
differentiation of osteoclasts by acting on related genes through
certain signaling pathways. This may be the mechanism by which
H2 exerts its anti-osteoporosis effects. H2
is generated during the degradation of Mg alloys and the formation
of osteoclasts can be inhibited by H2, so Mg alloys
indirectly exert their anti-osteoporosis effects. Our previous
study revealed that H2 can inhibit BMMC
osteoclastogenesis in mice (18).
However, the mechanism by which this occurs, which is critical for
the translational research of H2 and Mg alloys and the
treatment of osteoporosis, is still unclear. The present study used
transcriptome sequencing to identify the possible mechanism behind
the H2-mediated inhibition of osteoclastogenesis and
revealed the key genes and signaling pathways involved, thereby
providing a theoretical basis for the significance of H2
and an experimental basis for the application of Mg alloys in the
treatment of fractures, bone defects and osteoporosis.
There were several limitations to the present study.
First, although the primary mouse BMMCs used in this study were
isolated as previously described (20,21),
the cell populations were not well identified. Second, the possible
molecular mechanism by which H2 inhibits BMMC
osteoclastogenesis was not thoroughly studied. Thus, further
studies are needed to determine whether H2 inhibits BMMC
osteoclastogenesis through these pathways.
The present study is the first to investigate the
transcriptome of mouse BMMCs exposed to H2 in an
osteoclast-induced environment by RNA-seq, to the best of the
authors' knowledge. The results showed that there were 480 DEGs
between the H2 group and the control group. Among them,
320 DEGs were upregulated (Fos, Dusp1, Cxcl1,
Reln, Itga2b, Plin2, Lif, Thbs1,
Vegfa and Gadd45a) and 160 DEGs were downregulated
(Hspa1b, Gm4951, F830016B08Rik, Fads2,
Hspa1a, Slc27a6, Cacna1b, Scd2,
Lama3 and Col4a5). Comprehensive analysis of DEGs, as
well as GO terms and KEGG pathways, revealed that these DEGs were
mainly involved in osteoclast differentiation cascades, as well as
PI3K-AKT, FoxO, MAPK, PPAR, TNF, TGF-β, JAK-STAT, RAS, VEGF, HIF-1
and AMPK signaling pathways, which are involved in immunity,
inflammation, apoptosis and cell differentiation. At the same time,
the main alternative splicing events between the H2
group and the control group were RI and SE. Gene fusion occurred in
both groups and inter-chromosomal fusion was the main way by which
genes were fused. Therefore, the results of the present study
revealed the possible target genes and signaling pathways of
H2-mediated BMMC osteoclastogenesis and provided a
theoretical basis for exploring the feasibility of H2 in
the treatment of osteoporosis.
Acknowledgements
Not applicable.
Funding
Funding: The present study was supported by the State Key
Laboratory of Metal Matrix Composites, Shanghai Jiao Tong
University (grant no. mmc-kf20-02) and the San-Ming Project of
Medicine in Shenzhen (grant no. SZSM201612092).
Availability of data and materials
The datasets generated and/or analyzed during the
current study are available in the NCBI repository, https://www.ncbi.nlm.nih.gov/sra/PRJNA865067.
Authors' contributions
YL, WW, YZ and HZ developed the concepts in this
study. YL performed the experiments, collected and analyzed the
data and wrote the manuscript. YL and WW confirm the authenticity
of all the raw data. All authors read and approved the final
manuscript.
Ethics approval and consent to
participate
The present study was conducted in accordance with
the ethical standards of the Ethics Committee of Peking University
Shenzhen Hospital, who approved the experimental protocols.
Patient consent for publication
Not applicable.
Competing interests
The authors declare that they have no competing
interests.
References
|
1
|
Agarwal S, Curtin J, Duffy B and Jaiswal
S: Biodegradable magnesium alloys for orthopaedic applications: A
review on corrosion, biocompatibility and surface modifications.
Mater Sci Eng C Mater Biol Appl. 68:948–963. 2016.PubMed/NCBI View Article : Google Scholar
|
|
2
|
Maradze D, Musson D, Zheng Y, Cornish J,
Lewis M and Liu Y: High magnesium corrosion rate has an effect on
osteoclast and mesenchymal stem cell role during bone remodelling.
Sci Rep. 8(10003)2018.PubMed/NCBI View Article : Google Scholar
|
|
3
|
Zhang Y, Xu J, Ruan YC, Yu MK, O'Laughlin
M, Wise H, Chen D, Tian L, Shi D, Wang J, et al: Implant-derived
magnesium induces local neuronal production of CGRP to improve
bone-fracture healing in rats. Nat Med. 22:1160–1169.
2016.PubMed/NCBI View Article : Google Scholar
|
|
4
|
Zhai Z, Qu X, Li H, Yang K, Wan P, Tan L,
Ouyang Z, Liu X, Tian B, Xiao F, et al: The effect of metallic
magnesium degradation products on osteoclast-induced osteolysis and
attenuation of NF-κB and NFATc1 signaling. Biomaterials.
35:6299–6310. 2014.PubMed/NCBI View Article : Google Scholar
|
|
5
|
Luo Y, Wang J, Ong MTY, Yung PS, Wang J
and Qin L: Update on the research and development of
magnesium-based biodegradable implants and their clinical
translation in orthopaedics. Biomater Transl. 2:188–196.
2021.PubMed/NCBI View Article : Google Scholar
|
|
6
|
Lin Y, Ohkawara B, Ito M, Misawa N,
Miyamoto K, Takegami Y, Masuda A, Toyokuni S and Ohno K: Molecular
hydrogen suppresses activated Wnt/β-catenin signaling. Sci Rep.
6(31986)2016.PubMed/NCBI View Article : Google Scholar
|
|
7
|
Guo JD, Li L, Shi YM, Wang HD and Hou SX:
Hydrogen water consumption prevents osteopenia in ovariectomized
rats. Br J Pharmacol. 168:1412–1420. 2013.PubMed/NCBI View Article : Google Scholar
|
|
8
|
Sun Y, Shuang F, Chen DM and Zhou RB:
Treatment of hydrogen molecule abates oxidative stress and
alleviates bone loss induced by modeled microgravity in rats.
Osteoporos Int. 24:969–978. 2013.PubMed/NCBI View Article : Google Scholar
|
|
9
|
Yoneda T, Tomofuji T, Kunitomo M, Ekuni D,
Irie K, Azuma T, Machida T, Miyai H, Fujimori K and Morita M:
Preventive effects of drinking hydrogen-rich water on gingival
oxidative stress and alveolar bone resorption in rats fed a
high-fat diet. Nutrients. 9(64)2017.PubMed/NCBI View Article : Google Scholar
|
|
10
|
Callaway DA and Jiang JX: Reactive oxygen
species and oxidative stress in osteoclastogenesis, skeletal aging
and bone diseases. J Bone Miner Metab. 33:359–370. 2015.PubMed/NCBI View Article : Google Scholar
|
|
11
|
Li DZ, Zhang QX, Dong XX, Li HD and Ma X:
Treatment with hydrogen molecules prevents RANKL-induced osteoclast
differentiation associated with inhibition of ROS formation and
inactivation of MAPK, AKT and NF-κB pathways in murine RAW264.7
cells. J Bone Miner Metab. 32:494–504. 2014.PubMed/NCBI View Article : Google Scholar
|
|
12
|
Boyde A, Ali NN and Jones SJ: Resorption
of dentine by isolated osteoclasts in vitro. Br Dent J.
156:216–220. 1984.PubMed/NCBI View Article : Google Scholar
|
|
13
|
Chambers TJ, Revell PA, Fuller K and
Athanasou NA: Resorption of bone by isolated rabbit osteoclasts. J
Cell Sci. 66:383–399. 1984.PubMed/NCBI View Article : Google Scholar
|
|
14
|
Destaing O, Saltel F, Géminard JC, Jurdic
P and Bard F: Podosomes display actin turnover and dynamic
self-organization in osteoclasts expressing actin-green fluorescent
protein. Mol Biol Cell. 14:407–416. 2003.PubMed/NCBI View Article : Google Scholar
|
|
15
|
Parfitt AM: Targeted and nontargeted bone
remodeling: Relationship to basic multicellular unit origination
and progression. Bone. 30:5–7. 2002.PubMed/NCBI View Article : Google Scholar
|
|
16
|
Manolagas SC: Birth and death of bone
cells: Basic regulatory mechanisms and implications for the
pathogenesis and treatment of osteoporosis. Endocr Rev. 21:115–137.
2000.PubMed/NCBI View Article : Google Scholar
|
|
17
|
Toor SM, Wani S and Albagha OME:
Comprehensive transcriptomic profiling of murine osteoclast
differentiation reveals novel differentially expressed genes and
LncRNAs. Front Genet. 12(781272)2021.PubMed/NCBI View Article : Google Scholar
|
|
18
|
Liu Y, Wang DL, Huang YC, Wang TB and Zeng
H: Hydrogen inhibits the osteoclastogenesis of mouse bone marrow
mononuclear cells. Mater Sci Eng C Mater Biol Appl.
110(110640)2020.PubMed/NCBI View Article : Google Scholar
|
|
19
|
Chen X, Cui J, Zhai X, Zhang J, Gu Z, Zhi
X, Weng W, Pan P, Cao L, Ji F, et al: Inhalation of hydrogen of
different concentrations ameliorates spinal cord injury in mice by
protecting spinal cord neurons from apoptosis, oxidative injury and
mitochondrial structure damages. Cell Physiol Biochem. 47:176–190.
2018.PubMed/NCBI View Article : Google Scholar
|
|
20
|
Zhang Y, Guan H, Li J, Fang Z, Chen W and
Li F: Amlexanox suppresses osteoclastogenesis and prevents
Ovariectomy-Induced bone loss. Sci Rep. 5(13575)2015.PubMed/NCBI View Article : Google Scholar
|
|
21
|
Chen X, Zhi X, Cao L, Weng W, Pan P, Hu H,
Liu C, Zhao Q, Zhou Q, Cui J and Su J: Matrine derivate MASM
uncovers a novel function for ribosomal protein S5 in
osteoclastogenesis and postmenopausal osteoporosis. Cell Death Dis.
8(e3037)2017.PubMed/NCBI View Article : Google Scholar
|
|
22
|
Love MI, Huber W and Anders S: Moderated
estimation of fold change and dispersion for RNA-seq data with
DESeq2. Genome Biol. 15(550)2014.PubMed/NCBI View Article : Google Scholar
|
|
23
|
Langmead B and Salzberg SL: Fast
gapped-read alignment with Bowtie 2. Nat Methods. 9:357–359.
2012.PubMed/NCBI View Article : Google Scholar
|
|
24
|
Li B and Dewey CN: RSEM: Accurate
transcript quantification from RNA-Seq data with or without a
reference genome. BMC Bioinformatics. 12(323)2011.PubMed/NCBI View Article : Google Scholar
|
|
25
|
Kim D, Langmead B and Salzberg SL: HISAT:
A fast spliced aligner with low memory requirements. Nat Methods.
12:357–360. 2015.PubMed/NCBI View Article : Google Scholar
|
|
26
|
Shen S, Park JW, Lu ZX, Lin L, Henry MD,
Wu YN, Zhou Q and Xing Y: rMATS: Robust and flexible detection of
differential alternative splicing from replicate RNA-Seq data. Proc
Natl Acad Sci USA. 111:5593–5601. 2014.PubMed/NCBI View Article : Google Scholar
|
|
27
|
Benelli M, Pescucci C, Marseglia G,
Severgnini M, Torricelli F and Magi A: Discovering chimeric
transcripts in paired-end RNA-seq data by using EricScript.
Bioinformatics. 28:3232–3239. 2012.PubMed/NCBI View Article : Google Scholar
|
|
28
|
Guo J, Dong W, Jin L, Wang P, Hou Z and
Zhang Y: Hydrogen-rich saline prevents bone loss in diabetic rats
induced by streptozotocin. Int Orthop. 41:2119–2128.
2017.PubMed/NCBI View Article : Google Scholar
|
|
29
|
Ohsawa I, Ishikawa M, Takahashi K,
Watanabe M, Nishimaki K, Yamagata K, Katsura K, Katayama Y, Asoh S
and Ohta S: Hydrogen acts as a therapeutic antioxidant by
selectively reducing cytotoxic oxygen radicals. Nat Med.
13:688–694. 2007.PubMed/NCBI View
Article : Google Scholar
|
|
30
|
Wu D, Liang M, Dang H, Fang F, Xu F and
Liu C: Hydrogen protects against hyperoxia-induced apoptosis in
type II alveolar epithelial cells via activation of PI3K/Akt/Foxo3a
signaling pathway. Biochem Biophys Res Commun. 495:1620–1627.
2018.PubMed/NCBI View Article : Google Scholar
|
|
31
|
Chen K, Liu Y, He J, Pavlos N, Wang C,
Kenny J, Yuan J, Zhang Q, Xu J and He W: Steroid-induced
osteonecrosis of the femoral head reveals enhanced reactive oxygen
species and hyperactive osteoclasts. Int J Biol Sci. 16:1888–1900.
2020.PubMed/NCBI View Article : Google Scholar
|
|
32
|
Bartell SM, Kim HN, Ambrogini E, Han L,
Iyer S, Serra Ucer S, Rabinovitch P, Jilka RL, Weinstein RS, Zhao
H, et al: FoxO proteins restrain osteoclastogenesis and bone
resorption by attenuating H2O2 accumulation.
Nat Commun. 5(3773)2014.PubMed/NCBI View Article : Google Scholar
|
|
33
|
Kim H, Lee YD, Kim HJ, Lee ZH and Kim HH:
SOD2 and Sirt3 control osteoclastogenesis by regulating
mitochondrial ROS. J Bone Miner Res. 32:397–406. 2017.PubMed/NCBI View Article : Google Scholar
|
|
34
|
Lee NK, Choi YG, Baik JY, Han SY, Jeong
DW, Bae YS, Kim N and Lee SY: A crucial role for reactive oxygen
species in RANKL-induced osteoclast differentiation. Blood.
106:852–859. 2005.PubMed/NCBI View Article : Google Scholar
|
|
35
|
Kim MS, Yang YM, Son A, Tian YS, Lee SI,
Kang SW, Muallem S and Shin DM: RANKL-mediated reactive oxygen
species pathway that induces long lasting Ca2+
oscillations essential for osteoclastogenesis. J Biol Chem.
285:6913–6921. 2010.PubMed/NCBI View Article : Google Scholar
|
|
36
|
Ha H, Kwak HB, Lee SW, Jin HM, Kim HM, Kim
HH and Lee ZH: Reactive oxygen species mediate RANK signaling in
osteoclasts. Exp Cell Res. 301:119–127. 2004.PubMed/NCBI View Article : Google Scholar
|
|
37
|
Bhatt NY, Kelley TW, Khramtsov VV, Wang Y,
Lam GK, Clanton TL and Marsh CB: Macrophage-colony-stimulating
factor-induced activation of extracellular-regulated kinase
involves phosphatidylinositol 3-kinase and reactive oxygen species
in human monocytes. J Immunol. 169:6427–6434. 2002.PubMed/NCBI View Article : Google Scholar
|
|
38
|
Fan Z, Gao Y, Huang Z, Xue F, Wu S, Yang
J, Zhu L and Fu L: Protective effect of hydrogen-rich saline on
pressure overload-induced cardiac hypertrophyin rats: Possible role
of JAK-STAT signaling. BMC Cardiovasc Disord. 18(32)2018.PubMed/NCBI View Article : Google Scholar
|
|
39
|
Chen Y, Jiang J, Miao H, Chen X, Sun X and
Li Y: Hydrogen-rich saline attenuates vascular smooth muscle cell
proliferation and neointimal hyperplasia by inhibiting reactive
oxygen species production and inactivating the Ras-ERK1/2-MEK1/2
and Akt pathways. Int J Mol Med. 31:597–606. 2013.PubMed/NCBI View Article : Google Scholar
|
|
40
|
Qiu X, Li H, Tang H, Jin Y, Li W, YuSun
PingFeng, Sun X and Xia Z: Hydrogen inhalation ameliorates
lipopolysaccharide-induced acute lung injury in mice. Int
Immunopharmacol. 11:2130–2137. 2011.PubMed/NCBI View Article : Google Scholar
|
|
41
|
Wang K, Song X, Duan S, Fang W, Huan X,
Cao Y, Tang J and Wang L: Hydrogen-rich saline prevents the down
regulation of claudin-5 protein in septic rat lung via the PI3K/Akt
signaling pathway. Int J Clin Exp Med. 10:11717–11727. 2017.
|
|
42
|
Zhang Y, Liu Y and Zhang J: . Saturated
hydrogen saline attenuates endotoxin-induced lung dysfunction. J
Surg Res. 198:41–49. 2015.PubMed/NCBI View Article : Google Scholar
|
|
43
|
Liu H, Liang X, Wang D, Zhang H, Liu L,
Chen H, Li Y, Duan Q and Xie K: Combination therapy with nitric
oxide and molecular hydrogen in a murine model of acute lung
injury. Shock. 43:504–511. 2015.PubMed/NCBI View Article : Google Scholar
|
|
44
|
Takayanagi H, Kim S, Matsuo K, Suzuki H,
Suzuki T, Sato K, Yokochi T, Oda H, Nakamura K, Ida N, et al: RANKL
maintains bone homeostasis through c-Fos-dependent induction of
interferon-β. Nature. 416:744–749. 2002.PubMed/NCBI View Article : Google Scholar
|
|
45
|
Grigoriadis AE, Wang ZQ, Cecchini MG,
Hofstetter W, Felix R, Fleisch HA and Wagner EF: c-Fos: A key
regulator of osteoclast-macrophage lineage determination and bone
remodeling. Science. 266:443–448. 1994.PubMed/NCBI View Article : Google Scholar
|
|
46
|
Jiao Z, Xu W, Zheng J, Shen P, Qin A,
Zhang S and Yang C: Kaempferide prevents titanium particle induced
osteolysis by suppressing JNK activation during osteoclast
formation. Sci Rep. 7(16665)2017.PubMed/NCBI View Article : Google Scholar
|