Introduction
Hyperlipidemia is also referred to as lipid
metabolism disorder or lipid metabolism abnormality. Hyperlipidemia
is a systemic disorder of lipid metabolism caused by various
factors, such as elevated triglycerides (TG), total cholesterol
(TC) and/or low-density lipoprotein cholesterol (LDL-C), and the
reduction of high-density lipoprotein cholesterol (HDL-C) (1). Unhealthy diet and excessive energy
intake make hyperlipidemia a chronic disease with an increasing
incidence worldwide (1,2). Hyperlipidemia is a strong risk factor
for numerous diseases, such as diabetes, atherosclerosis and
cardiovascular disease (3-5).
Therefore, preventing and treating hyperlipidemia are effective and
common methods to reduce the incidence of cardiovascular disease
and other chronic diseases (6).
Hyperlipidemia should be prevented and treated as early as possible
to reduce the incidence of associated diseases (7).
MicroRNAs (miRNAs/miRs) have emerged as critically
important post-transcriptional regulators of disease pathogenesis.
A number of miRNAs have been identified as critical regulators of
cellular lipid and lipoprotein metabolism (8), including the miR-33 family (9). The miRNAs of this family comprise
miR-33a and miR-33b, which are encoded within the introns of the
sterol regulatory element-binding protein (SREBP)2 and 1 genes,
respectively (10,11). Although the miR-33 isoforms differ
in two nucleotides in their mature forms, they share the same seed
sequence and repress the same target genes (12). The miR-33 family is one of the most
well-studied miRNA families as a potential therapeutic target to
treat numerous diseases, including atherosclerosis, obesity and
diabetes (13-15).
Specifically, the miR-33 family serves key roles in regulating
cholesterol and fatty acid homeostasis, controlling HDL-C
biogenesis and cholesterol efflux by regulating ATP binding
cassette subfamily A member 1 (ABCA1) gene expression, and
regulating cellular functions, such as macrophage activation,
mitochondrial biogenesis and autophagy (16). Furthermore, in the liver, miR-33
regulates reverse cholesterol transport by targeting factors
involved in HDL-C biogenesis (ABCA1) and the cholesterol reverse
transport process, and bile acid secretion and synthesis (17,18).
Hepatic miR-33 deficiency not only improves regulation of glucose
homeostasis but also prevents the development of fibrosis and
inflammation (19,20). Thus, miR-33 deficiency can
attenuate non-alcoholic fatty liver disease-non-alcoholic
steatohepatitis-hepatocellular carcinoma progression (21,22).
Recent research has revealed that dietary
polyphenols, including curcumin (23), resveratrol (Res) (24) and epigallocatechin gallate
(25), modulate miRNA expression.
Among these, Res is a non-flavonoid polyphenol organic compound and
has now been identified in >70 plants, including grapes,
Polygonum cuspidatum and Veratrum nigrum (26,27).
Multiple studies have confirmed that Res has multiple biological
functions, including regulating lipid metabolism, anti-inflammatory
effects, mitochondrial protection and/or autophagy induction, and
anti-oxidation (28-35).
The liver is essential for energy homeostasis and
serves an active role in synthesis, storage and redistribution of
glucose and free fatty acids (36). Res and atorvastatin have been used
to treat high-fat diet (HFD) intake-induced non-alcoholic fatty
liver disease by targeting genes involved in cholesterol metabolism
and miR-33(37). Additionally, Res
and epigallocatechin gallate bind directly and distinctively to
miR-33a and miR-122, and modulate their levels in hepatocytes
(38). Therefore, the specific
molecular mechanism underlying the effects of miR-33 and its role
in hepatic lipid metabolism are unclear. Hence, the aim of the
present study was to elucidate how Res improves hepatic lipid
metabolism by targeting miR-33.
Materials and methods
Study subjects
The present study was performed at the Physical
Examination Center of Hebei General Hospital (Shijiazhuang, China)
and was approved by the Hebei General Hospital Ethics Committee
(2018 Scientific Research Ethics Review; approval no. 39;
Shijiazhuang, China). All of the clinical samples were obtained
from the Physical Examination Center of Hebei General Hospital. A
total of 36 subjects with elevated blood lipids in the physical
examination population between May 1, 2021 and November 30, 2021
were randomly selected as the hyperlipidemia group (27 men, 9
women; mean age, 65.50±7.71 years; age range, 50-83 years). Another
36 healthy subjects matched for age and sex with the subjects in
the hyperlipidemia group were randomly selected during the same
period from the Physical Examination Center of Hebei General
Hospital as the normal control group (CG group; 27 men, 9 women;
mean age, 69.11±8.81 years; age range, 43-83 years). All
participants provided written informed consent. The diagnostic
criteria for hyperlipidemia were in accordance with the Guidelines
for the Prevention and Treatment of Dyslipidemia in Chinese Adults
(Revised Edition 2016) (2), which
are as follows: Plasma TC ≥6.2 mmol/l (240 mg/dl), TG ≥2.3 mmol/l
(200 mg/dl), LDL-C ≥4.1 mmol/l (160 mg/dl) or HDL-C <1.0 mmol/l
(40 mg/dl) in adults after a 12-h fast. Hyperlipidemia was
diagnosed if any one criterion was met. Participants taking
aspirin, angiotensin-converting enzyme inhibitors, angiotensin
receptor blockers or statins within the previous 2 months were
excluded from the study. Participants with chronic liver disease
(including hepatitis B virus carriers), kidney disease, thyroid
insufficiency or abnormalities, hypertension, diabetes, blood
system disorders, mental disorders, acute and chronic infectious
diseases, autoimmune diseases, tumors, pregnancy, lactation,
long-term oral contraceptive use, and/or recent surgical history
were excluded. The inclusion criteria for the CG group were as
follows: No history of hypertension, diabetes mellitus and other
chronic diseases; blood glucose 3.9-6.1 mmol/l; and the following
blood lipid concentration levels: TC <5.2 mmol/l, TG <1.7
mmol/l and LDL-C <3.4 mmol/l.
Blood samples
Fasting blood samples (5 ml) were collected from
each participant and placed in a BD Vacutainer SST tube (Becton,
Dickinson and Company). Peripheral blood mononuclear cells (PBMCs)
were isolated from fasting blood samples by Ficoll-Paque density
gradient centrifugation (20˚C; 500 x g; 25 min) for miR-33 and
sirtuin 6 (SIRT6) detection by reverse transcription-quantitative
PCR (RT-qPCR). Biochemical tests [TC, TG, HDL-C, LDL-C, aspartate
aminotransferase (AST), alanine aminotransferase (ALT) and fasting
blood glucose (FBG)] were performed using an automatic biochemical
detection instrument at the Clinical Laboratory of Hebei General
Hospital. Glycated hemoglobin (HbA1c) was analyzed at Hebei Key
Laboratory of Metabolic Diseases (Shijiazhuang, China) using an
automatic glycohemoglobin analyzer (ADAMS A1c HA-8180; ARKRAY,
Inc.) at 25˚C.
Animal experiments
A total of 24 C57BL/6J mice (male; age, 8 weeks;
weight, 22.0±2.0 g) were purchased from Beijing Vital River
Laboratory Animal Technology Co., Ltd. The mice were housed in the
animal laboratory at the Hebei Key Laboratory of Metabolic Diseases
(temperature, 21-23˚C; humidity, 40-60%; and 12/12-h light/dark
cycle) with constant access to food and water. All experimental
procedures were approved (2022 Scientific Research Ethics Review;
approval no. 217) by the Animal Care and Use Committee of Hebei
General Hospital (Shijiazhuang, China) and complied with the Animal
(Scientific Procedures) Act 1986 and associated guidelines
(39).
After 1 week of adaptive feeding, the mice were
randomly divided into three groups, with 8 mice in each group. The
diet for the normal diet (ND) group was an ordinary diet (D12450J
formula, consisting of 20% protein, 70% carbohydrate, 10% fat and
3.85 kcal/g). The model mice were fed a HFD (D12492 formula,
consisting of 20% protein, 20% carbohydrate, 60% fat and 5.24
kcal/g). The Res mice were fed a HFD and a Res-based dietary
supplement (60 mg/kg). All feed was purchased from Beijing
Huafukang Biotechnology Co., Ltd. All mice were fed the respective
diets for 6 weeks, after which they were euthanized by
CO2 asphyxiation (flow rate, 4 l/min; 30% vol/min)
(40,41), and cervical dislocation was
performed when the mice exhibited respiratory arrest and
unconsciousness. Complete death was confirmed by cardiac arrest and
dilated pupils. Blood samples were collected in tubes containing
ethylenediaminetetraacetic acid (1.5 mg/ml) and centrifuged at
1,375 x g at 4˚C for 15 min. The plasma was collected and stored at
-80˚C. Mice livers were quickly removed. Part of the liver tissues
were snap-frozen in liquid nitrogen after washing with cold
phosphate-buffered saline and stored at -80˚C for further analysis.
Part of the liver tissues were fixed in 4% paraformaldehyde at 25˚C
for 24 h for H&E staining.
Body weight and food intake
measurement
The body weight and food intake of the mice in each
group were measured at baseline and weekly thereafter until 6 weeks
after baseline.
Detection of serum glucose and lipids
in mice
Serum glucose levels were determined using a glucose
assay kit (cat. no. 60408ES60; Shanghai Yeasen Biotechnology Co.,
Ltd.). The TG content assay kit (cat. no. D799796-0100; Sangon
Biotech Co., Ltd.) was used to detect TG levels. The TC assay kit
(cat. no. A111-1-1), LDL-C assay kit (cat. no. A113-2-1), HDL-C
assay kit (cat. no. A112-1-1), ALT assay kit (cat. no. C009-3-1)
and AST assay kit (cat. no. C010-3-1) were purchased from Nanjing
Jiancheng Bioengineering Institute, and were used to detect the
concentrations of TC, LDL-C, HDL-C, ALT and AST. Serum
malondialdehyde (MDA) concentration levels were measured using a
lipid peroxidation MDA assay kit (cat. no. S0131S; Beyotime
Institute of Biotechnology). All protocols were performed in
accordance with the manufacturers' instructions.
Oral glucose tolerance test (OGTT) and
insulin tolerance test (ITT)
After feeding for 6 weeks, glucose (1 g/kg) was
given to each mouse via an orogastric tube for the OGTT. Blood
glucose was measured immediately after glucose administration and
15, 30, 60 and 120 min after administration. A total of 24 h after
the OGTT, the ITT was performed after a 12-h fast. The mice were
injected intraperitoneally with insulin (1.5 IU/40 g; Tonghua
Dongbao Pharmaceutical Co., Ltd.), and blood glucose was measured
immediately after injection and 15, 30, 60 and 120 min after
injection. The area under the receiver operating characteristic
curve (AUC) for the OGTT was calculated using the trapezoidal
method. The quantitative insulin sensitivity check index (QUICKI)
was used to assess insulin sensitivity, as follows: QUICKI=1/[(log
fasting blood glucose (mmol/l) + log fasting plasma insulin
(µU/ml)].
Histomorphometric comparison of mouse
liver tissues. H&E staining
Parts of the liver tissues were taken and fixed in
4% paraformaldehyde at 25˚C for 24 h. Subsequently, the tissues
were embedded in paraffin wax, cut into 5-µm-thick sections,
deparaffinized in xylene at 25˚C and rehydrated in a
reverse-gradient series of ethyl alcohol (100, 95, 80 and 75%). The
sections were stained with hematoxylin at 25˚C for 10 min and
stained with eosin at 25˚C for 3 min, and visualized under a light
microscope.
Oil Red O staining. Parts of the fresh liver
tissues were taken and embedded in optimum cutting temperature
compound, quickly frozen, and then sliced into 6-µm tissue
sections. The sections were washed with PBS, stained with Oil red O
working solution (6:4, oil red stock solution:distilled water; Oil
red O: WSIG20100803; Sinopharm Chemical Reagent Co., Ltd.) at room
temperature for 15 min and washed three times with PBS to remove
the excess Oil red O dye. Subsequently, the sections were stained
with Harris's hematoxylin (20151216; Nanjing Jiancheng
Bioengineering Institute) for 3 min at 25˚C. The morphological
features of the liver sections were observed under a light
microscope.
Cell culture
HepG2 cells (human liver cancer cells) were
purchased from Procell Life Science & Technology Co., Ltd., and
cultured in complete DMEM (Gibco; Thermo Fisher Scientific, Inc.)
supplemented with 10% fetal bovine serum (Sangon Biotech Co., Ltd.)
and 1% penicillin/streptomycin (Sangon Biotech Co., Ltd.) at 37˚C
with 5% CO2. HepG2 cells were immersed in normal medium
and medium containing 0.25 mmol/l palmitate (PA) for 24 h. At the
end of the stimulation period, the cells were washed three times
with PBS and fixed with 4% paraformaldehyde for 10 min at 37˚C.
Subsequently, cells were washed twice with PBS, then stained with
0.5% Oil red O for 30 min at 37˚C. After staining, the cells were
washed once with 60% isopropanol, washed with PBS until a colorless
solution was obtained, and observed under a fluorescence inverted
microscope at a magnification of x50. Short tandem repeat profiling
was used for authentication of HepG2 cells. HepG2 cells cultured in
normal medium and transfected with miR-33 mimics, and HepG2 cells
cultured in medium containing 0.25 mmol/l PA for 24 h after
transfection with miR-33 inhibitor or SIRT6-pcDNA 3.1 were used to
analyze the effect of transfection on lipid metabolism-related
genes and lipid deposition.
Cell transfection
miR-33 mimics, inhibitor and the corresponding
controls were synthesized by Shanghai GenePharma Co., Ltd. For
miR-33 mimics transfection, the HepG2 cells were seeded in 6-well
plates at a density of 5x10⁵ cells/well. When 70-80%
confluence was reached, cells were divided into three groups: CON
(liposome), NC mimics (liposome + mimics control sequence) and
miR-33 mimics (liposome + miR-33 mimics). The CON group was the
control group, in which cells were transfected without any
sequence. The NC mimics group was the scrambled negative control.
The sequence of the corresponding controls (100 nmol/l) was
5'-GGUCUUACGUCAGUCACAAUAUCUG-3'. Cells were transfected using
Lipofectamine® 3000 Transfection Reagent (cat. no.
L3000015; Thermo Fisher Scientific, Inc.) according to the
manufacturer's protocol. The cells were transfected for 6 h at 37˚C
in a cell incubator with 5% CO2, and then the medium was
replaced with fresh DMEM. In the miR-33 mimics group, the cells
were transfected with 100 nmol/l miR-33 mimics
(5'-GUGCAUUGUAGUUGCAUUGCA-3') using Lipofectamine® 3000
Transfection Reagent (cat. no. L3000015; Thermo Fisher Scientific,
Inc.) according to the manufacturer's protocol. Cells were
transfected for 6 h at 37˚C in a cell incubator with 5%
CO2, and then the medium was replaced with fresh DMEM.
Subsequently, cells were incubated for 24 h in an incubator with 5%
CO2 at 37˚C, and the cells were collected for subsequent
experiments.
To investigate the effect of miR-33 inhibitor
transfection, HepG2 cells were divided into three groups: CON
(liposome), NC inhibitor (liposome + inhibitor control sequence)
and miR-33 inhibitor (liposome + miR-33 inhibitor). The CON group
was the control group, in which cells were transfected without any
sequence. The NC inhibitor group was transfected with 100 nmol/l
scrambled negative controls (5'-GGUCUUACGUCAGUCACAAUAUCUG-3') using
Lipofectamine® 3000 Transfection Reagent (cat. no.
L3000015; Thermo Fisher Scientific, Inc.) according to the
manufacturer's protocol. Cells were transfected for 6 h at 37˚C in
a cell incubator with 5% CO2, and then the medium was
replaced with fresh DMEM. In the miR-33 inhibitor group, cells were
transfected with 100 nmol/l inhibitor (5'-UGCAAUGCAACUACAAUGCAC-3')
using Lipofectamine® 3000 Transfection Reagent (cat. no.
L3000015; Thermo Fisher Scientific, Inc.) according to the
manufacturer's protocol. Cells were transfected for 6 h at 37˚C in
a cell incubator with 5% CO2, and then the medium was
replaced with fresh DMEM. Subsequently, cells were incubated for 48
h in an incubator with 5% CO2 at 37˚C, and the cells
were collected for subsequent experiments.
To investigate the effect of miR-33 inhibitor on
intracellular lipid metabolism, cells were divided into three
groups: PA + lipo (liposome), PA + NC inhibitor (liposome +
inhibitor control sequence) and PA + miR-33 inhibitor (liposome +
miR-33 inhibitor). miR-33 inhibitor or NC inhibitor (scramble
control) transfection was performed as aforementioned. After
transfection for 6 h at 37˚C, cells were incubated with PA (0.25
mmol/l) for 24 h in an incubator with 5% CO2 at 37˚C and
then collected for the subsequent experiments.
To investigate the effect of SIRT6 overexpression,
HepG2 cells were divided into the pcDNA 3.1 group (transfected with
500 ng pcDNA 3.1) and the SIRT6-pcDNA 3.1 group (transfected with
500 ng SIRT6-pcDNA 3.1). Cells were transfected in an incubator
with 5% CO2 at 37˚C for 6 h with the aforementioned
plasmids using Lipofectamine® 3000 Transfection Reagent
(cat. no. L3000015; Thermo Fisher Scientific, Inc.) according to
the manufacturer's protocol, and then the medium was replaced with
fresh DMEM. Subsequently, cells were incubated for 24 h in an
incubator with 5% CO2 at 37˚C, and then collected for
subsequent experiments.
To investigate the effect of SIRT6 overexpression on
lipid metabolism, HepG2 cells divided into three groups: PA + lipo
(liposome), PA + pcDNA 3.1 (liposome + 500 ng pcDNA 3.1) and PA +
SIRT6-pcDNA 3.1 (liposome + 500 ng SIRT6-pcDNA 3.1). SIRT6-pcDNA
3.1 or pcDNA 3.1 transfection was performed as aforementioned.
After transfection for 6 h at 37˚C, cells were incubated with PA
(0.25 mmol/l) for 24 h in an incubator with 5% CO2 at
37˚C and then collected for subsequent experiments. The human
SIRT6-pcDNA 3.1 (cat. no. V38520) was purchased from Thermo Fisher
Scientific, Inc.
RNA isolation and RT-qPCR
RNAs from PBMCs of participants with hyperlipidemia,
three randomly selected mouse liver tissues or cultured HepG2 cells
were isolated using a total RNA purification kit (Sangon Biotech
Co., Ltd.). Complementary DNA synthesis was performed using the
Goscript Reverse Transcriptase System (Promega Corporation) and
All-in-One™ miRNA First-Strand cDNA Synthesis kit
(GeneCopoeia, Inc.). The aforementioned operations were carried out
in strict accordance with the manufacturer's instructions. qPCR was
performed using an Applied Biosystems 7500 system (Thermo Fisher
Scientific, Inc.) to detect mRNA levels using GoTaq®
qPCR Master Mix (Promega Corporation) and miRNA levels using the
All-in-One™ miRNA RT-qPCR detection kit (fluorophore,
SYBR® Green I; GeneCopoeia, Inc.). The thermocycling
conditions were as follows: Polymerase activation for 1 cycle at
95˚C for 2 min; followed by 40 cycles of 95˚C for 15 sec and 60˚C
for 1 min. Relative fold changes in RNA expression were calculated
using the 2-ΔΔCt method (42). mRNA levels were normalized to GAPDH
gene expression, and miRNA levels were normalized to U6 small
nuclear RNA levels. The primer sequences used were as follows:
Mouse (m-)SIRT6 forward, 5'-CCGGGACCTGATGCTCGCTGATGA-3' and
reverse, 5'-AGCCGTGGATGCGCAGGTCAG-3'; m-FASN forward,
5'-CGGTCCCTGTGCGCCTTCC-3' and reverse,
5'TGGGGTTGTGGAAGTGCAGGTTAGG-3'; m-PPARγ forward,
5'-CCGAAGAACCATCCGATTGAAGC-3' and reverse,
5'-CCGCCAACAGCTTCTCCTTCTCG-3'; m-PGC1α forward,
5'-AAGCGAAGAGCATTTGTCAACAGCA-3' and reverse,
5'-GCGGTTGTGTATGGGACTTCTTTTT-3'; m-CPT1 forward,
5'-AGCGCTGGCAAATGACTTCCTGAG-3' and reverse,
5'-CCTGCAGCGGTGTGGGGGTGAC-3'; m-SREBP1 forward,
5'-CGCAAGGCCATCGACTACATCCG-3' and reverse,
5'-CGGCGTCTGAGGGTGGAGGGGTAA-3'; m-ACC forward,
5'-GCCCCCGAGCCAGAGGACAGTAT-3' and reverse,
5'-CCGGGAGGAGTTCTGGAAGGAGC-3'; human (h-)SIRT6 forward,
5'-CGGCCCACGCAGACCCACATG-3' and reverse,
5'-TGGGGAAGCCTGAGCGCACAT-3'; h-FASN forward,
5'-GCGGCTGCTGCTGGAAGTCACCTAT-3' and reverse,
5'-GCCGCTCACGCCCACCCAGA-3'; h-PPARγ forward,
5'-GGCCGAGAAGGAGAAGCTGTTGG-3' and reverse,
5'-CGCCCTCGCCTTTGCTTTGGT-3'; h-PGC1α forward,
5'-CCCAGAACCATGCAAATCACAATCA-3' and reverse,
5'-GACGTCTTTGTGGCTTTTGCTGTTG-3'; h-CPT1 forward,
5'-CCCGGCAAGCCCCTCCAGTT-3' and reverse,
5'-GGACATGCAGTTGGCCGTTTC-3'; h-SREBP1 forward,
5'-CGCCCTCACCCCTGTCCCCTCC-3' and reverse,
5'-GGGGCTGTGGGGTGGGGGTC-3'; h-ACC forward,
5'-CCCCACTATGAGGCCGAGCA-3' and reverse,
5'-AGCGGGAGAAGCCACGGTAAAGT-3'; m/h-GAPDH forward,
5'-TGAACGGGAAGCTCACTG-3' and reverse, 5'-GCTTCACCACCTTCTTGATG-3';
m/h-miR-33 forward, 5'-GTGCATTGTAGTTGCATTGC-3' and reverse,
5'-GTCGTATCCAGTGCAGGGT-3'; m/h-U6 forward, 5'-CTCGCTTCGGCAGCACA-3'
and reverse, 5'-AACGCTTCACGAATTTGCGT-3'.
Western blotting
Liver tissues of three randomly selected mice or
cultured HepG2 cells were lysed in radioimmunoprecipitation assay
lysis buffer (Thermo Fisher Scientific, Inc.; 25 mM Tris, HCl pH
7.6, 150 mM NaCl, 1% NP-40, 1% sodium deoxycholate and 0.1% SDS),
and the total soluble protein was quantified using a BCA Protein
Assay kit (Beijing Solarbio Science & Technology Co., Ltd.).
Protein (20 µg/lane) from cell lysates was separated by 10% sodium
dodecyl sulfate-polyacrylamide gel electrophoresis. Following
transfer of the proteins onto polyvinylidene fluoride membranes,
the membranes were blocked at room temperature for 60 min in 5%
skim milk and probed with the primary antibodies overnight at 4˚C:
Acetyl-CoA carboxylase (ACC; dilution, 1:2,000; cat. no. 3676; Cell
Signaling Technology, Inc.), fatty acid synthase (FASN; dilution,
1:1,000; cat. no. ab128870; Abcam), SREBP1 (dilution, 1:2,000; cat.
no. 557036; BD Biosciences), peroxisome proliferator-activated
receptor-γ (PPARγ; dilution, 1:1,000; cat. no. 16,643-1-AP;
Proteintech Group, Inc.), anti-PPARγ-coactivator 1 α (PGC1α;
dilution 1:1,000; cat. no. 66,369-1-Ig; Proteintech Group, Inc.),
carnitine palmitoyltransferase 1 (CPT1; dilution 1:1,000; cat. no.
AF6558; Beyotime Institute of Biotechnology), SIRT6 (dilution,
1:1,000; cat. no. ab191385; Abcam) and anti-β-actin (dilution,
1:1,000; cat. no. 60008-1; Proteintech Group, Inc.). The membranes
were incubated with the secondary antibodies for 2 h at room
temperature. The secondary antibodies included the HRP-conjugated
goat anti-rabbit antibody (dilution, 1:5,000; cat. no. ZDR-5306;
OriGene Technologies, Inc.) and the HRP-conjugated goat anti-mouse
antibody (dilution, 1:10,000, cat. no. ZDR-5307; OriGene
Technologies, Inc.). Protein bands were visualized using enhanced
chemiluminescent substrate (Pierce ECL Western Blotting substrate;
Thermo Fisher Scientific, Inc.), and the band intensities were
evaluated using Image J software (V1.8; National Institutes of
Health).
Dual luciferase assay
The synthesized SIRT6 3'-untranslated region (UTR)
was inserted into the pmirGLO vector (Promega Corporation). The
mutation in the miR-33 seed-matching sequences was designed using
the SIRT6 wild-type (WT) sequence generated by overlap extension
PCR. SIRT6 WT and SIRT6 mutant-type (MT) reporter plasmids were
designed and constructed by Guangzhou RiboBio Co., Ltd. 293T cells
(Shanghai GeneChem Co., Ltd.) were cultured in High Glucose DMEM
(Gibco; Thermo Fisher Scientific, Inc.) supplemented with 10% fetal
bovine serum (Sangon Biotech Co., Ltd.) and 1%
penicillin/streptomycin at 37˚C with 5% CO2. The WT and
MT sequences were co-transfected with the miR-33 mimic
(5'-GUGCAUUGUAGUUGCAUUGCA-3'; 100 nM) or corresponding control
(5'-GGUCUUACGUCAGUCACAAUAUCUG-3'; 100 nM) into 293T cells using
Lipofectamine® 3000 (Invitrogen; Thermo Fisher
Scientific, Inc.) at 37˚C for 6 h. After transfection for 24 h, the
cells were lysed and subjected to a Dual-Luciferase Reporter Assay
(Promega Corporation). Luciferase activity was measured and
calculated as the ratio of firefly luciferase activity to
Renilla luciferase activity. The experiment was repeated
three times.
Statistical analysis
All experimental data are presented as the mean ±
SD. All experiments were repeated at least three times to verify
the trends. One-way ANOVA with Tukey's post hoc test was used for
comparisons among multiple groups. Comparisons between groups were
performed using an unpaired Student's t-test. Sex differences were
compared using the Pearson χ2 test. SPSS (version 25.0;
IBM Corp.) was used for all analyses. P<0.05 was considered to
indicate a statistically significant difference.
Results
Clinical and metabolic characteristics
of the participants
Demographic, clinical and biochemical data were
obtained from 36 participants with hyperlipidemia and 36 healthy
control participants. As shown in Table I, BMI, weight, TC, TG, LDL-C, FBG,
HbA1c, ALT and AST concentration levels were significantly higher,
while HDL-C levels were significantly lower, in participants with
hyperlipidemia compared with CG participants. No significant
differences in sex, age or height were observed between the
groups.
 | Table IComparison of the clinical
characteristics and metabolic parameters between the hyperlipidemia
group and CG. |
Table I
Comparison of the clinical
characteristics and metabolic parameters between the hyperlipidemia
group and CG.
|
Characteristics | Hyperlipidemia
group (n=36) | CG (n=36) | P-value |
|---|
| Sex, n | | | 1.000 |
|
Male | 27 | 27 | |
|
Female | 9 | 9 | |
| Age, years | 65.50±7.71 | 69.11±8.81 | 0.068 |
| BMI,
kg/m2 |
24.53±2.34a | 23.26±2.53 | 0.030 |
| Weight, kg |
72.11±9.80a | 67.18±10.19 | 0.040 |
| Height, cm | 171.39±7.41 | 169.65±6.98 | 0.310 |
| TC, mmol/l |
6.43±0.76a | 4.72±0.76 | <0.001 |
| TG, mmol/l |
2.53±2.97a | 0.90±0.30 | 0.002 |
| LDL-C, mmol/l |
4.04±0.54a | 2.79±0.54 | <0.001 |
| HDL-C, mmol/l |
1.29±0.31a | 1.52±0.23 | 0.001 |
| FBG, mmol/l |
5.55±0.46a | 5.19±0.47 | 0.002 |
| HbA1c, % |
6.05±0.74a | 5.64±0.26 | 0.002 |
| ALT, U/l |
20.978±8.67a | 17.08±4.71 | 0.020 |
| AST, U/l |
26.19±7.73a | 22.92±5.19 | 0.039 |
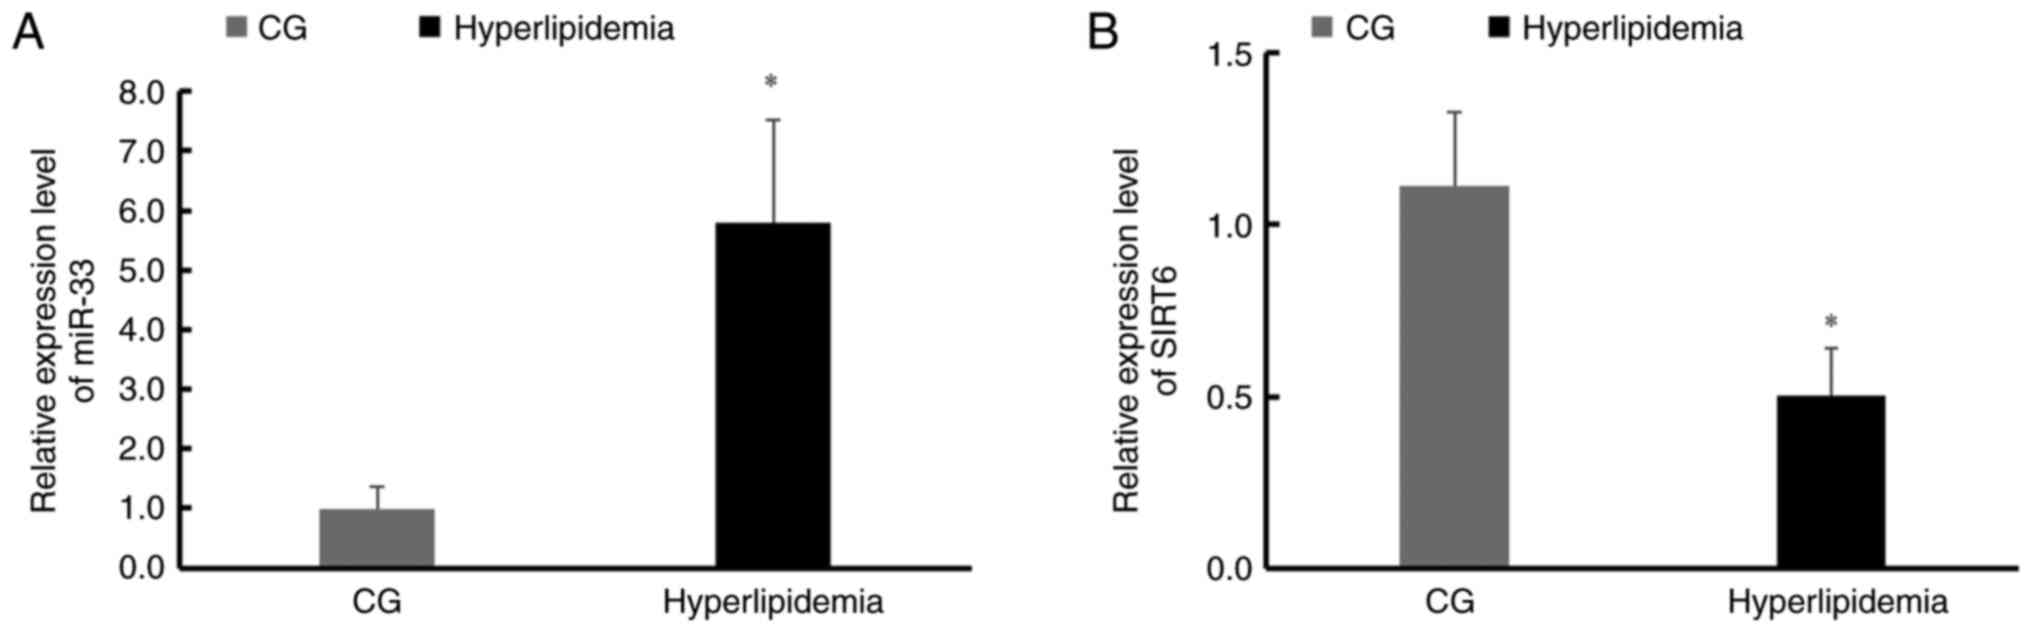
miR-33 and SIRT6 expression levels
differ between participants with hyperlipidemia and CG
participants
PBMCs from the hyperlipidemia group and CG were
tested for miR-33 and SIRT6 expression levels and it was identified
that miR-33 expression levels were significantly higher (Fig. 1A), and SIRT6 expression was
significantly lower in the hyperlipidemia group compared with the CG
(Fig. 1B).
Res reverses the changes in lipid
metabolism and expression of miR-33 and SIRT6 in the HFD mouse
model
Before investigating the underlying mechanism of Res
in lipid metabolism, the mice in the HFD group were used to
investigate lipid metabolism and miRNA expression in blood or liver
tissues, respectively. After 6 weeks, body weights were
significantly higher in the HFD group compared with the ND group.
From 5 weeks, body weights were decreased significantly in the HFD
+ Res group compared with the HFD group (Fig. 2A). There was no significant
difference in the daily food intake among the three groups
(Fig. 2B). TC, TG, LDL-C, MDA, ALT
and AST concentration levels were significantly higher in mice in
the HFD group compared with mice in the ND group, and these levels
were decreased significantly in the HFD + Res group compared with
the HFD group (Fig. 2C and
D). By contrast, HDL-C
concentration levels were significantly lower in the HFD group
compared with the ND group, and significantly increased in the HFD
+ Res group compared with the HFD group (Fig. 2C). Blood glucose levels were also
recorded, and OGTT and ITT results are shown in Fig. 2E and G. In the OGTT, there was a significant
decrease in the AUC in the HFD + Res group compared with the HFD
group (Fig. 2F). Consistently,
there was a statistically significant difference in QUICKI values
between the HFD + Res and HFD groups (Fig. 2H).
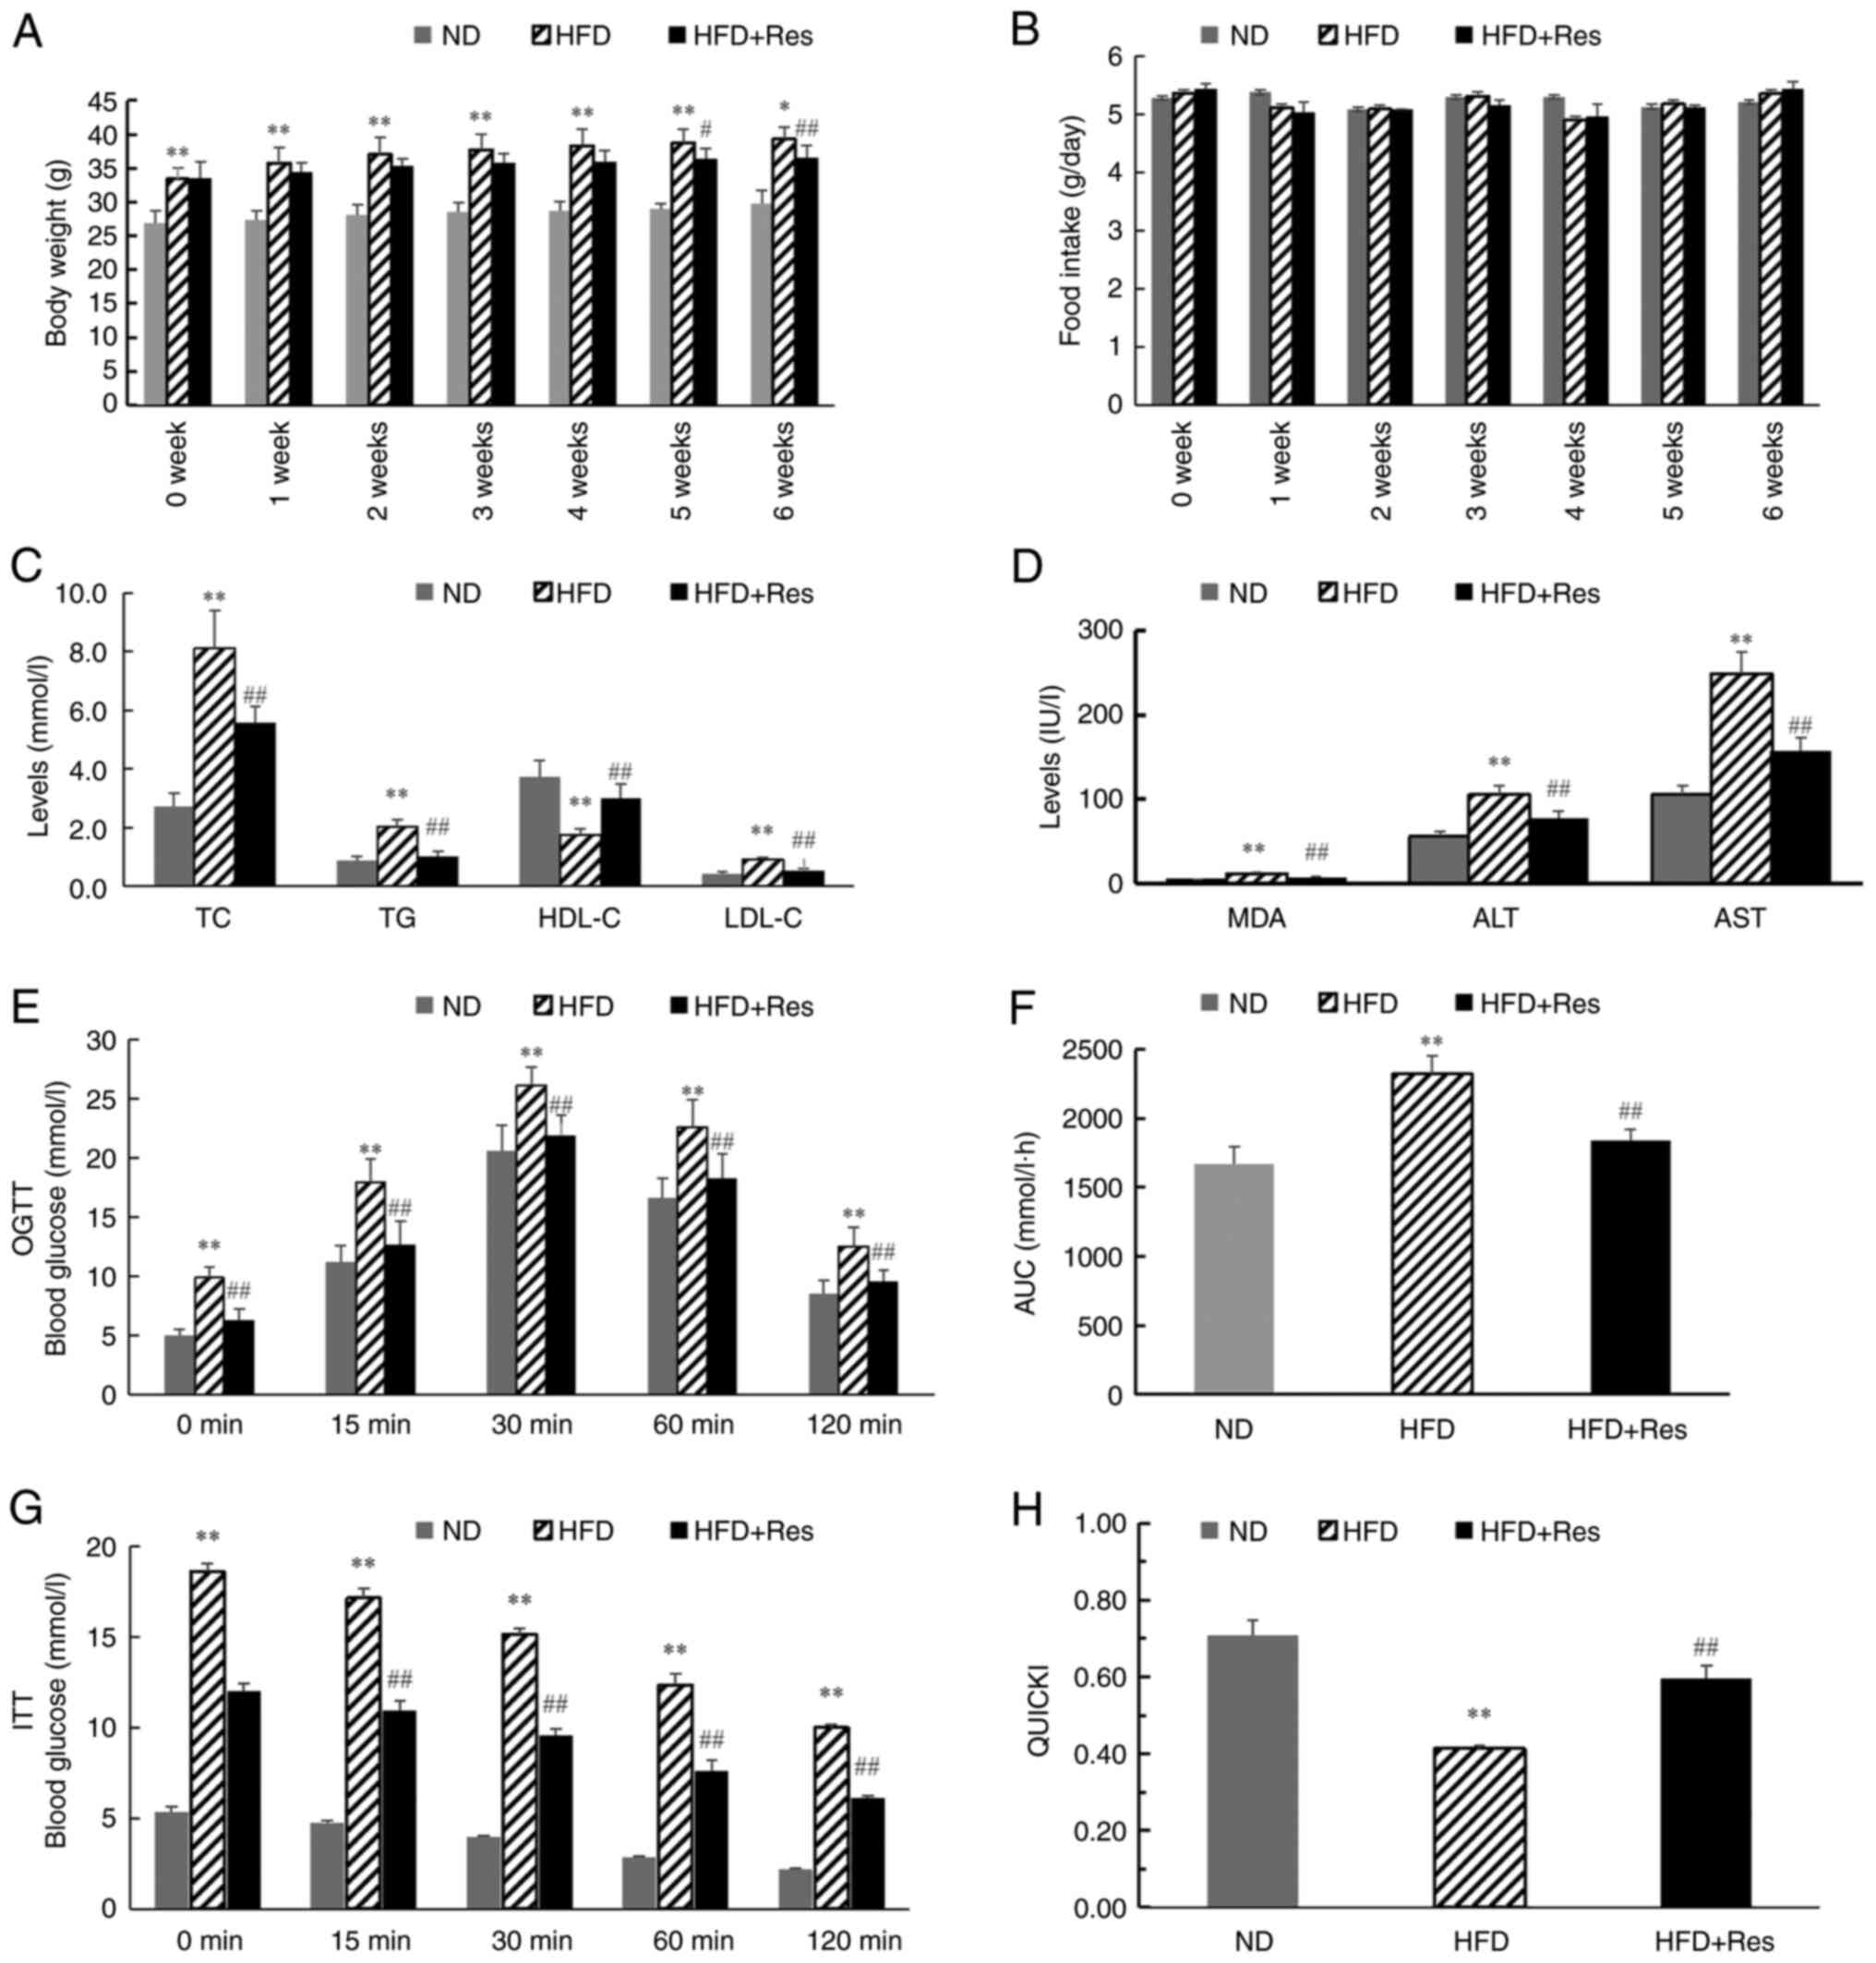 | Figure 2Effect of Res on lipid metabolism.
(A) Body weights of the mice in the three groups (ND mice, and mice
that received a HFD or a HFD + Res diet for 6 weeks). (B) Average
daily food intake in the three groups. (C) Levels of TC, TG, HDL-C
and LDL-C in the three groups after Res treatment for 6 weeks. (D)
Levels of MDA, ALT and AST in the three groups after Res treatment
for 6 weeks. (E) Results of OGTT. (F) AUC for OGTT. (G) Results of
ITT and (H) QUICKI calculations. Data are presented as the mean ±
SD (n=8 per group). *P<0.05 and
**P<0.001 vs. ND group; #P<0.05 and
##P<0.001 vs. HFD group (one-way ANOVA with Tukey's
multiple comparison test). ALT, alanine aminotransferase; AST,
aspartate aminotransferase; AUC, area under the receiver operating
characteristic curve; HDL-C, high-density lipoprotein; HFD,
high-fat diet; HFD + Res, high-fat diet supplemented with Res; ITT,
insulin tolerance test; LDL-C, low-density lipoprotein cholesterol;
MDA, malondialdehyde; ND, normal diet; OGTT, oral glucose tolerance
test; QUICKI, quantitative insulin sensitivity check index; Res,
resveratrol; TG, triglycerides; TC, total cholesterol. |
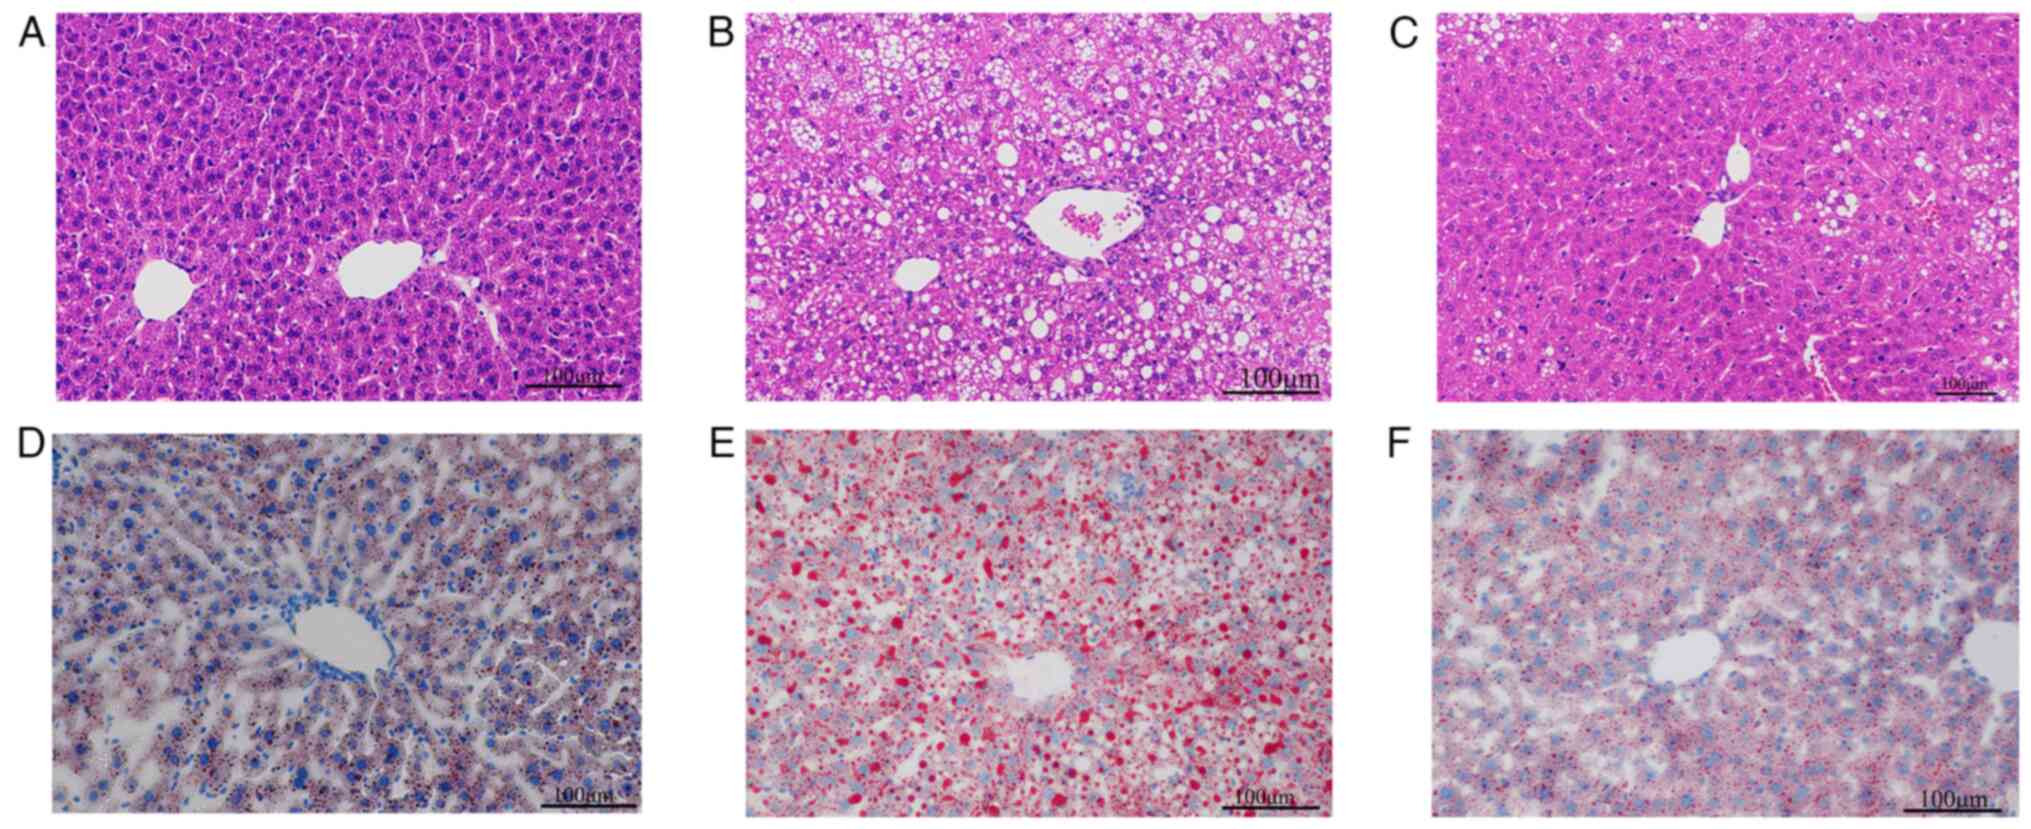
To investigate the effect of Res on hepatic lipid
deposition in mice, H&E staining and oil red O staining were
performed using mouse liver tissues. H&E staining of mouse
liver tissues revealed uniform cell cytoplasm in ND mice and fewer
lipid droplets (Fig. 3A). In
comparison, hepatocyte staining in the HFD group revealed
disordered cellular structure and more lipid droplets (Fig. 3B). In the HFD + Res group, the
morphology of the liver tissue and the number of lipid droplets
were intermediate to those of the ND and HFD groups (Fig. 3C). Liver cell staining with oil red
O showed that cells from the ND group contained blue nuclei with a
small number of orange-red lipid droplets (Fig. 3D). The HFD group exhibited numerous
orange-red lipid droplets (Fig.
3E), whereas after Res treatment, the number of lipid droplets
decreased (Fig. 3F).
To gain further insights, the effect of Res on lipid
metabolism and gene expression was investigated. The results
revealed that miR-33 expression was significantly higher (Fig. 4A) and SIRT6 mRNA expression was
significantly lower (Fig. 4B) in
liver tissue of the HFD group compared with the ND group. Western
blot analysis to assess SIRT6 expression in tissues revealed a
significant decrease in the HFD group (Fig. 4C and D). In the HFD + Res group, Res reversed
the increase in miR-33 expression and the decrease in SIRT6
expression. It was also found that mRNA expression levels (Fig. 4E) and protein expression levels
(Fig. 4F and G) of ACC, FASN and SREBP1 were increased
in the HFD group compared with the ND group, whereas PPARγ, PGC1α
and CPT1 mRNA and protein expression levels were decreased.
However, these changes in the expression levels of liver genes and
proteins were reversed in the HFD + Res group (Fig. 4E-G). These findings indicated that
Res improved basic metabolic parameters and changed the expression
levels of metabolism-related genes in mice fed a HFD supplemented
with Res.
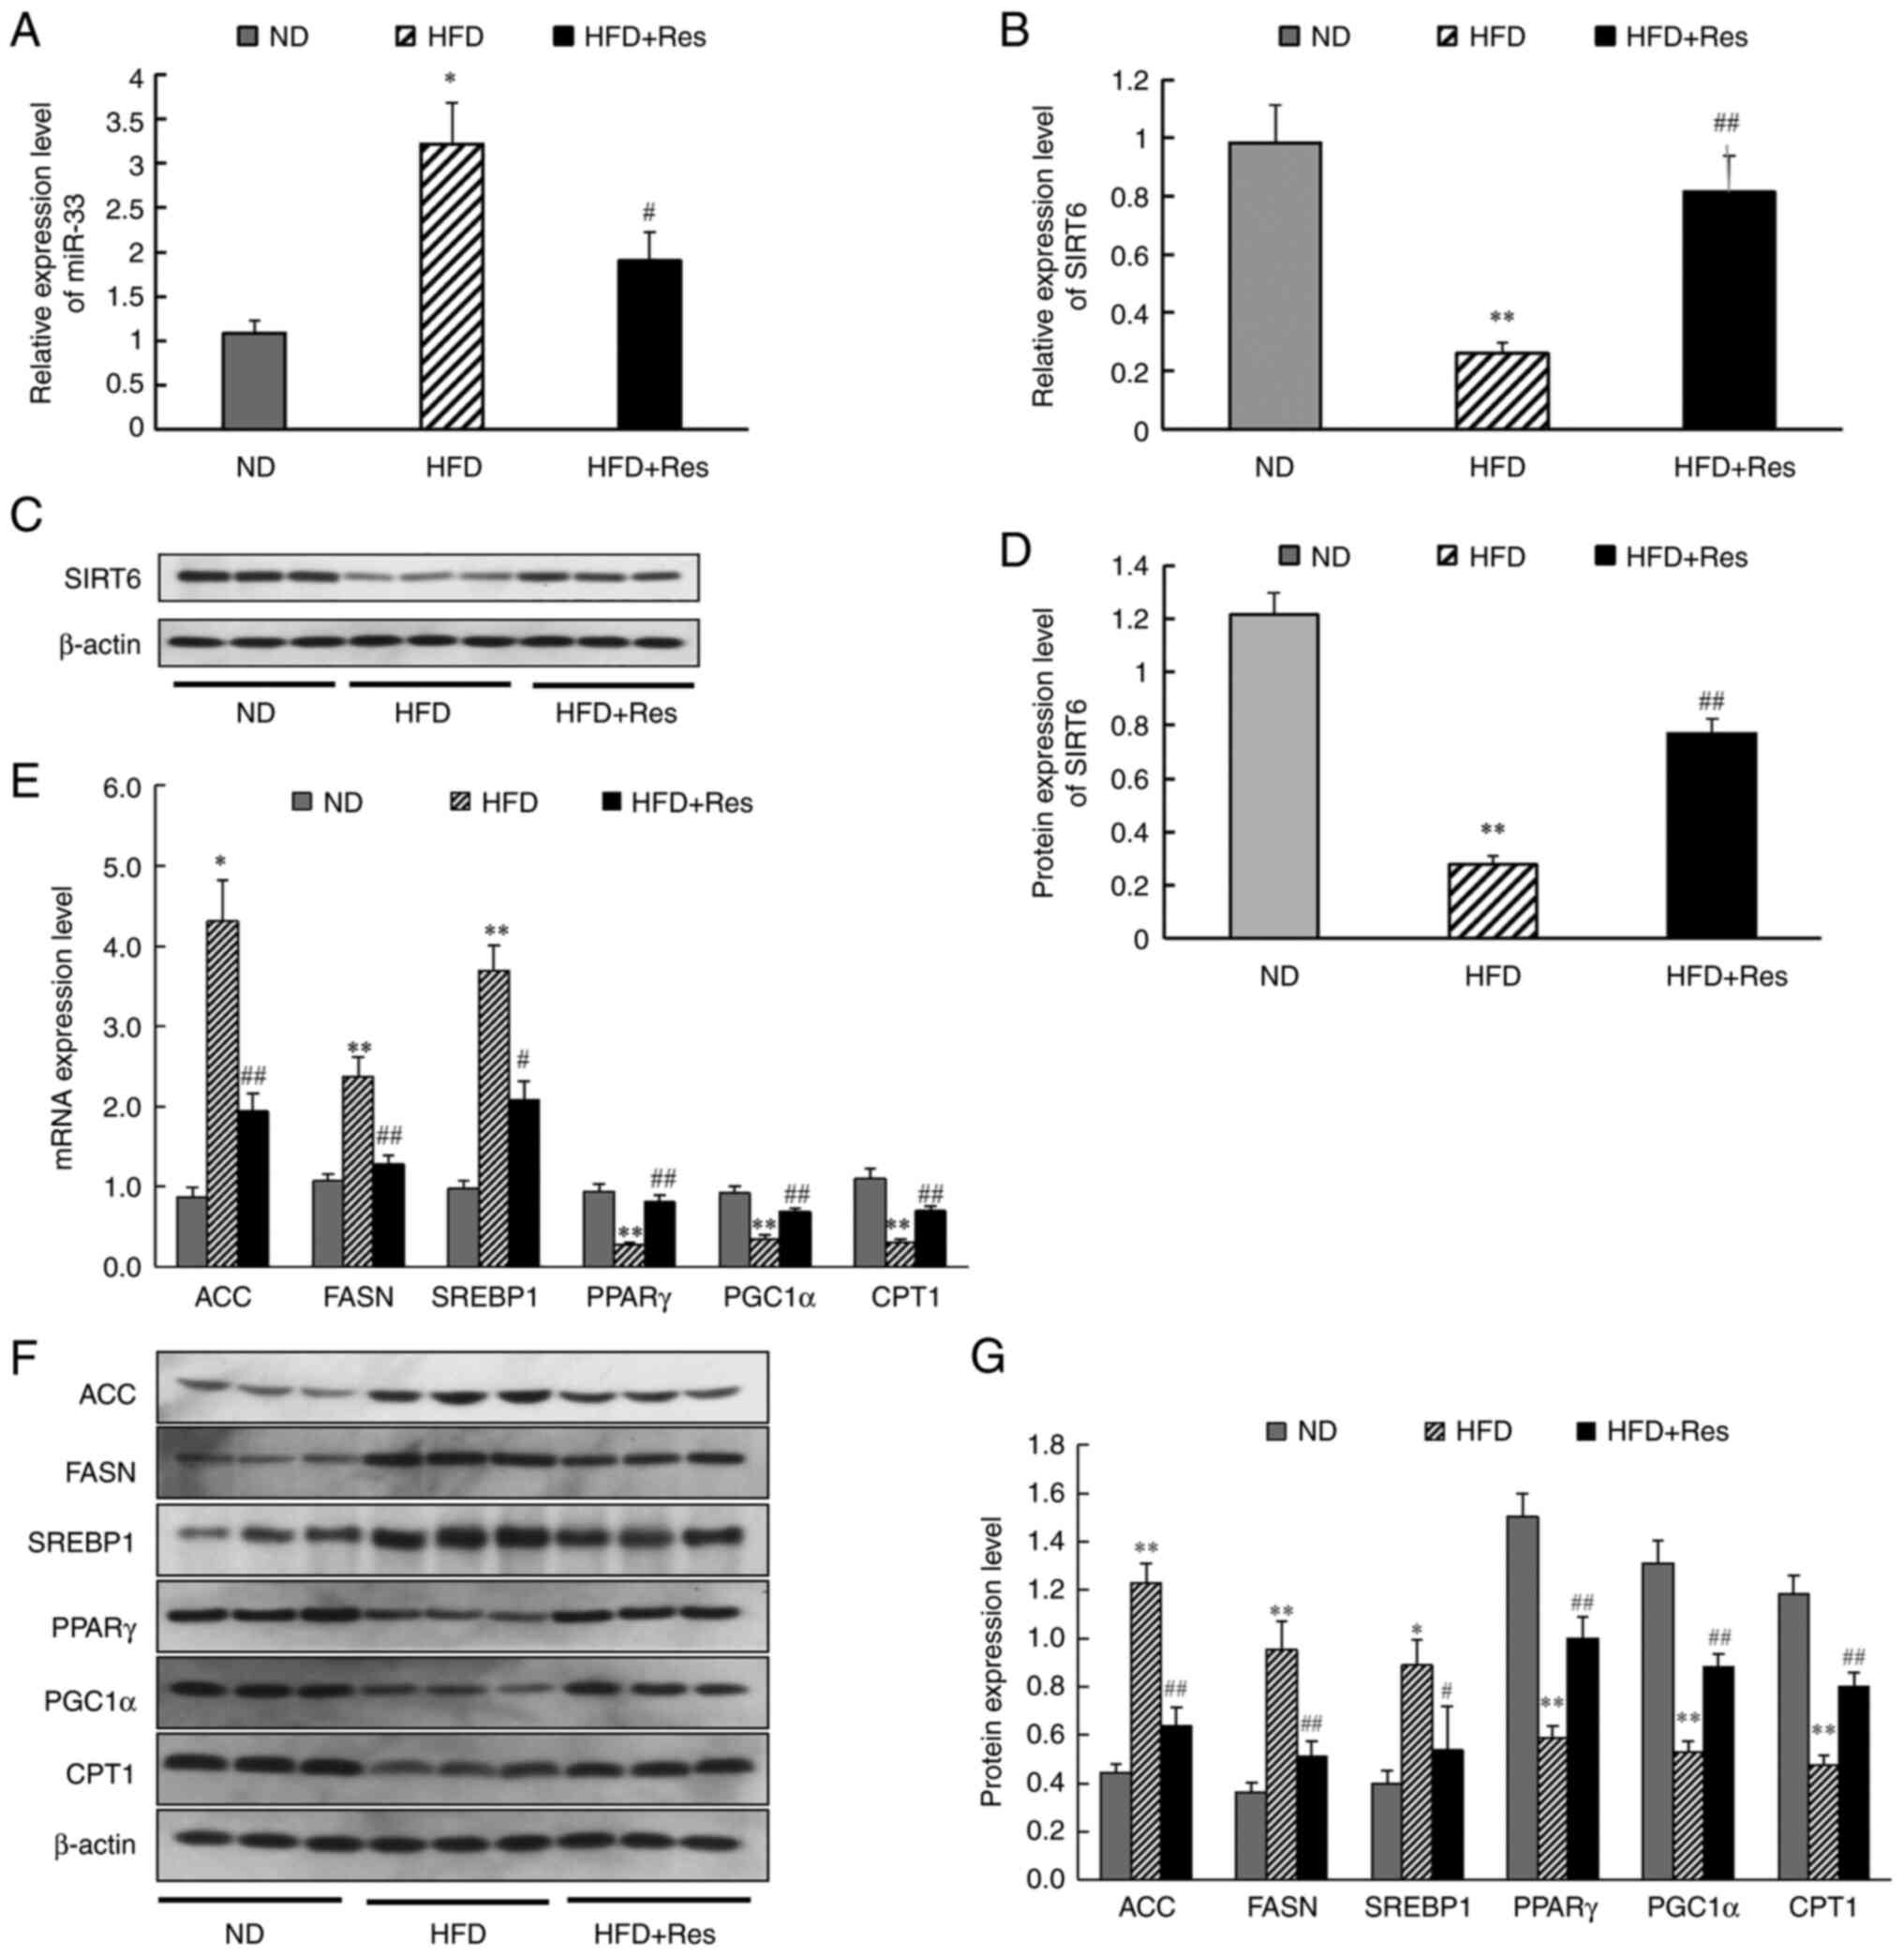 | Figure 4Effect of Res on the expression
levels of miR-33, SIRT6 and genes involved in fatty acid synthesis
and fatty acid β-oxidation in vivo. (A) Relative expression
levels of miR-33 in liver tissues. (B) Relative expression levels
of SIRT6 in liver tissue. (C) Protein levels of SIRT6. (D) Western
blot analysis of SIRT6. (E) mRNA expression levels of genes
involved in fatty acid synthesis and fatty acid β-oxidation in
liver tissues. (F) Western blot analysis of ACC, FASN, SREBP1,
PPARγ, PGC1α and CPT1. (G) Expression levels of proteins involved
in fatty acid synthesis and fatty acid β-oxidation in liver
tissues. β-actin was used as a control for the normalization of
samples for western blotting. Data are presented as the mean ± SD
(n=3). *P<0.05 and **P<0.001 vs. ND
group; #P<0.05 and ##P<0.001 vs. HFD
group (one-way ANOVA with Tukey's multiple comparison test). ACC,
acetyl-CoA carboxylase; CPT1, carnitine palmitoyl transferase 1;
FASN, fatty acid synthase; HFD, high-fat diet; HFD + Res, HFD
supplemented with Res; miR, microRNA; ND, normal diet; PGC1α,
PPARγ-coactivator 1α; PPARγ, peroxisome proliferator-activated
receptor-γ; Res, resveratrol; SIRT6, sirtuin 6; SREBP1, sterol
regulatory element-binding protein 1. |
Res reverses the changes in lipid
metabolism and expression of miR-33 and SIRT6 in PA-induced HepG2
cells
To further examine the underlying mechanism,
PA-induced HepG2 cells were used to investigate the effect of Res
on lipid metabolism and expression levels of miR-33 and SIRT6 in
vitro. First, a high-fat model was constructed by inducing
HepG2 cells with PA, and changes after Res treatment were observed.
It was found that lipid deposition in HepG2 cells improved after
the addition of Res (Fig. 5A).
Next, changes in miR-33 and SIRT6 mRNA expression were detected in
PA-induced HepG2 cells. RT-qPCR analysis demonstrated that miR-33
expression was increased significantly (Fig. 5B) and mRNA levels of SIRT6
decreased significantly (Fig. 5C)
in PA-induced HepG2 cells compared with CON cells. Additionally,
treatment with Res decreased miR-33 expression and increased SIRT6
expression in PA-induced HepG2 cells (Fig. 5B and C). Furthermore, western blotting
indicated that, with Res supplementation, protein expression levels
of SIRT6, PPARγ, PGC1α and CPT1 (Fig.
5F and G) were increased
compared with those in PA-induced HepG2 cells, whereas the
expression levels of ACC, FASN and SREBP1 were decreased (Fig. 5F and G). Additionally, RT-qPCR results revealed
that incubation with Res reversed mRNA expression levels of the
aforementioned genes in PA-induced HepG2 cells (Fig. 5H). These results indicated that Res
significantly changed the expression of metabolism-related genes
in vitro.
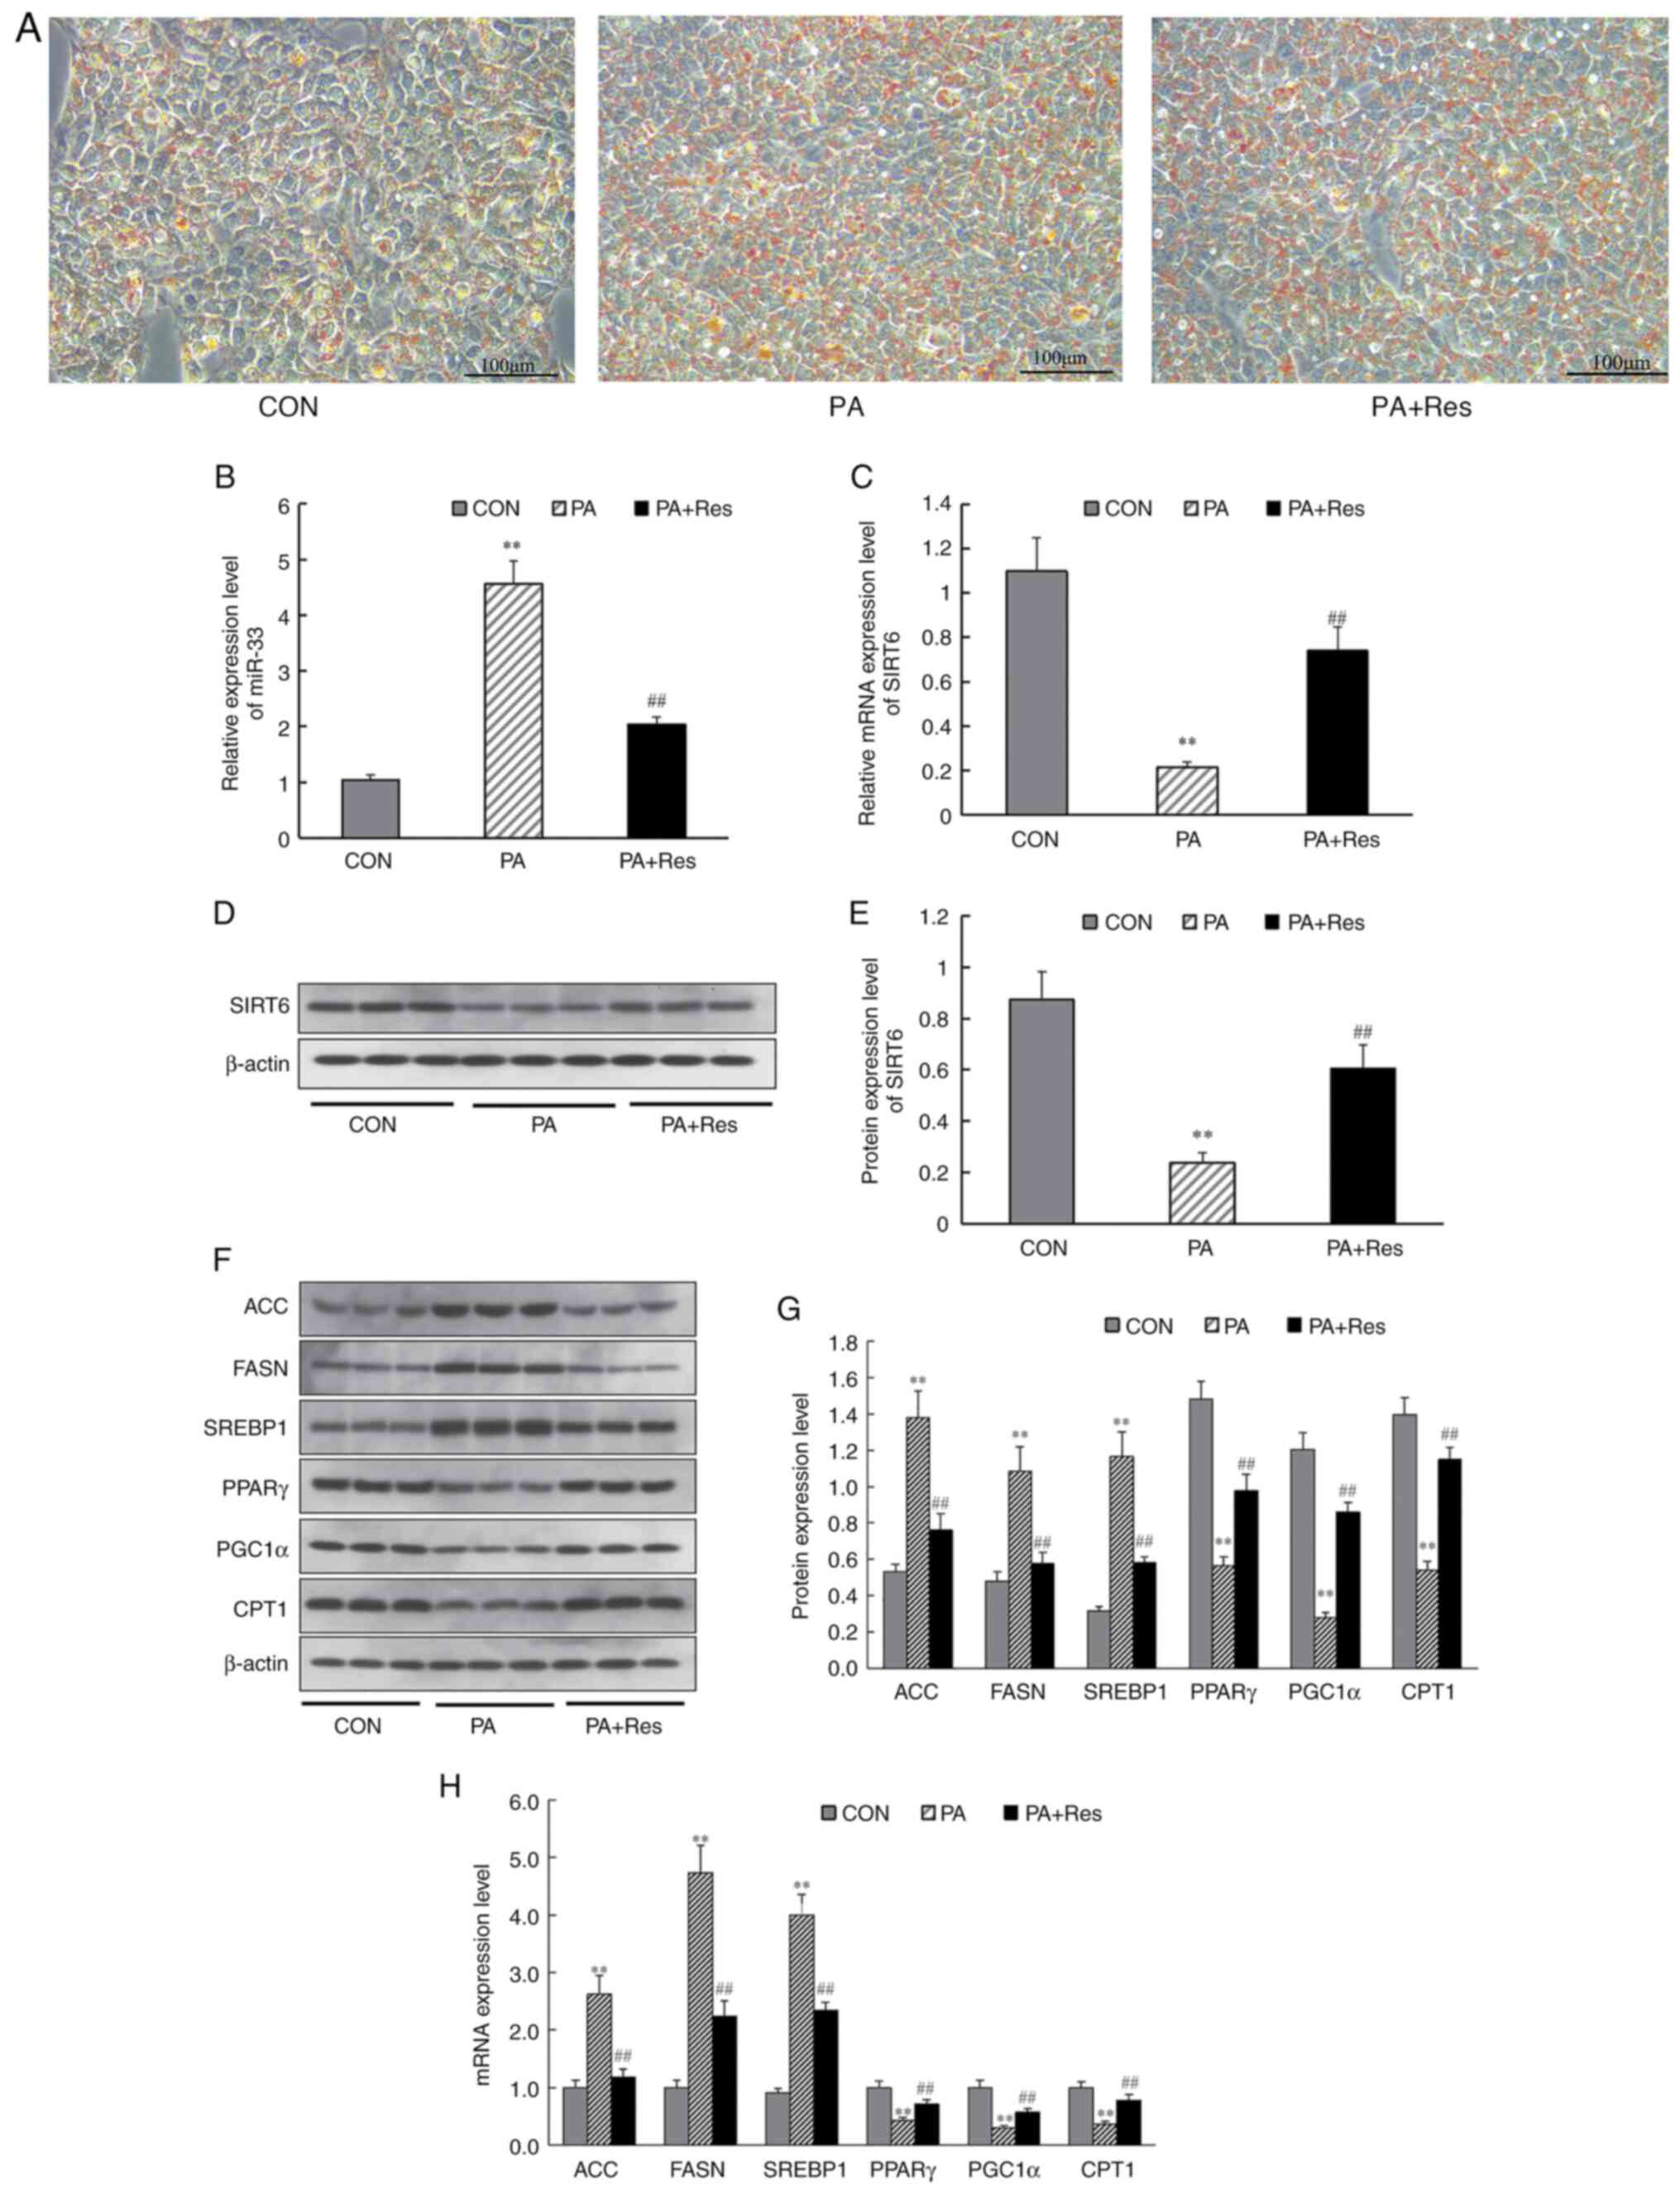 | Figure 5Effect of Res on the expression
levels of miR-33, SIRT6 and genes involved in fatty acid synthesis
and fatty acid β-oxidation in vitro. (A) Oil Red O staining
of HepG2 cells. Pale blue cytosol and a small amount of orange
lipid droplets were visible in CON cells. Numerous orange lipid
droplets were visible in PA-treated cells. After Res treatment, the
numbers of lipid droplets were decreased compared with those in
PA-treated cells (Scale bar, 100 µm). (B) Relative expression
levels of miR-33. (C) Relative expression level of SIRT6. (D)
Western blot analysis of SIRT6. (E) Protein levels of SIRT6. (F)
Western blot analysis of ACC, FASN, SREBP1, PPARγ, PGC1α and CPT1.
(G) Expression levels of proteins involved in fatty acid synthesis
and fatty acid β-oxidation. (H) Genes involved in fatty acid
synthesis and fatty acid β-oxidation. β-actin was used as a control
for the normalization of samples for western blotting. Data are
presented as the mean ± SD (n=3). **P<0.001 vs. CON
group; ##P<0.001 vs. the PA group (one-way ANOVA with
Tukey's multiple comparison test). ACC, acetyl-CoA carboxylase;
CON, control; CPT1, carnitine palmitoyl transferase 1; FASN, fatty
acid synthase; miR, microRNA; PA, palmitate; PGC1α,
PPARγ-coactivator 1α; PPARγ, peroxisome proliferator-activated
receptor-γ; Res, resveratrol; SIRT6, sirtuin 6; SREBP1, sterol
regulatory element-binding protein 1. |
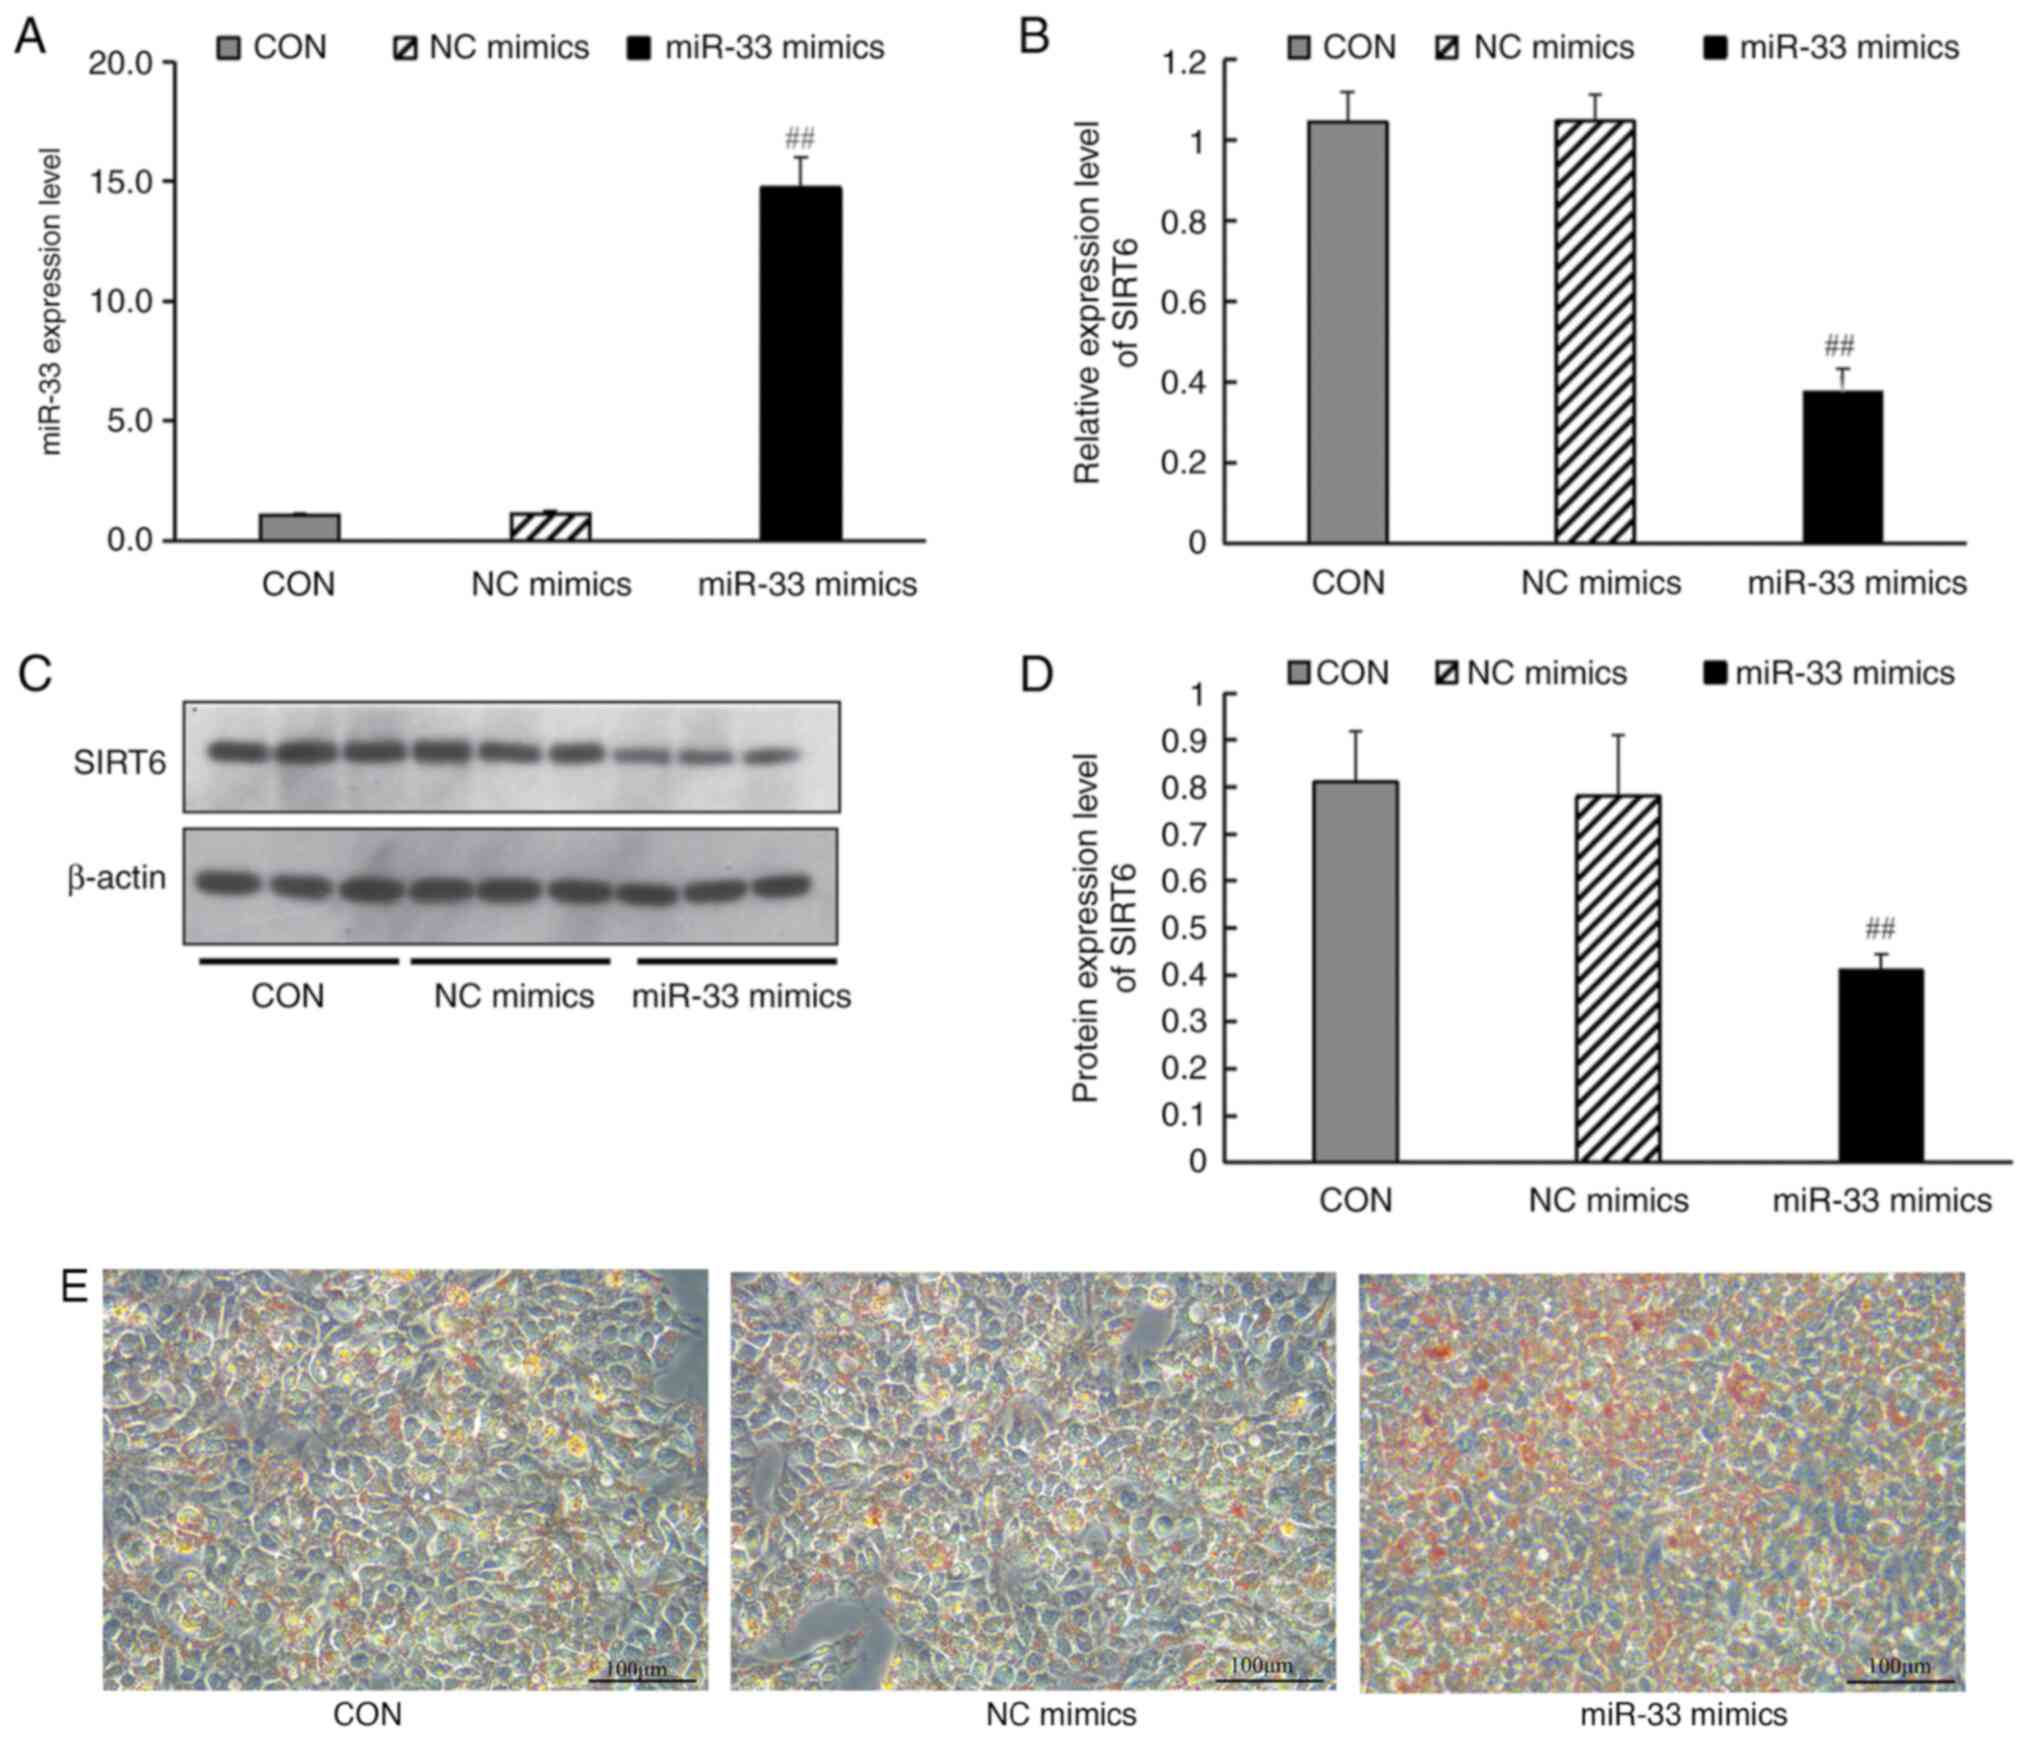
miR-33 mimics transfection affects the
expression of SIRT6 and lipid metabolism-related genes
100 nmol/l miR-33 mimics or mimic controls were
transfected into HepG2 cells. The results demonstrated that, after
transfection with miR-33 mimic, the expression levels of miR-33 in
cells were significantly increased (Fig. 6A). Transfection of miR-33 mimics
(but not a negative control miRNA) led to a significant decrease in
SIRT6 mRNA (Fig. 6B) and protein
expression levels (Fig. 6C and
D), and promoted lipid deposition
in HepG2 cells (Fig. 6E).
miR-33 inhibitor transfection affects
the expression of SIRT6 and lipid metabolism-related genes
miR-33 inhibitor or inhibitor controls (100 nmol/l)
were transfected into HepG2 cells. The results demonstrated that,
after transfection with miR-33 inhibitor, the expression levels of
miR-33 in cells were significantly decreased (Fig. 7A). Similarly, miR-33 inhibition
significantly increased SIRT6 mRNA expression (Fig. 7B) and protein expression compared
with those in the inhibitor control group (Fig. 7C and D). HepG2 cells were induced by PA for 24
h after transfection, and then RT-qPCR was used to analyze the
effect of miR-33 inhibitor transfection on lipid metabolism-related
genes, and Oil Red O staining was used to analyze the effect of
miR-33 inhibitor on lipid deposition. RT-qPCR results revealed that
transfection with the miR-33 inhibitor significantly increased the
mRNA expression levels of PPARγ, PGC1α and CPT1, decreased the mRNA
expression levels of ACC, FASN and SREBP1 (Fig. 7E), Simultaneously, Oil Red O
staining revealed decreased lipid deposition in HepG2 cells after
miR-33 inhibitor transfection (Fig.
7F).
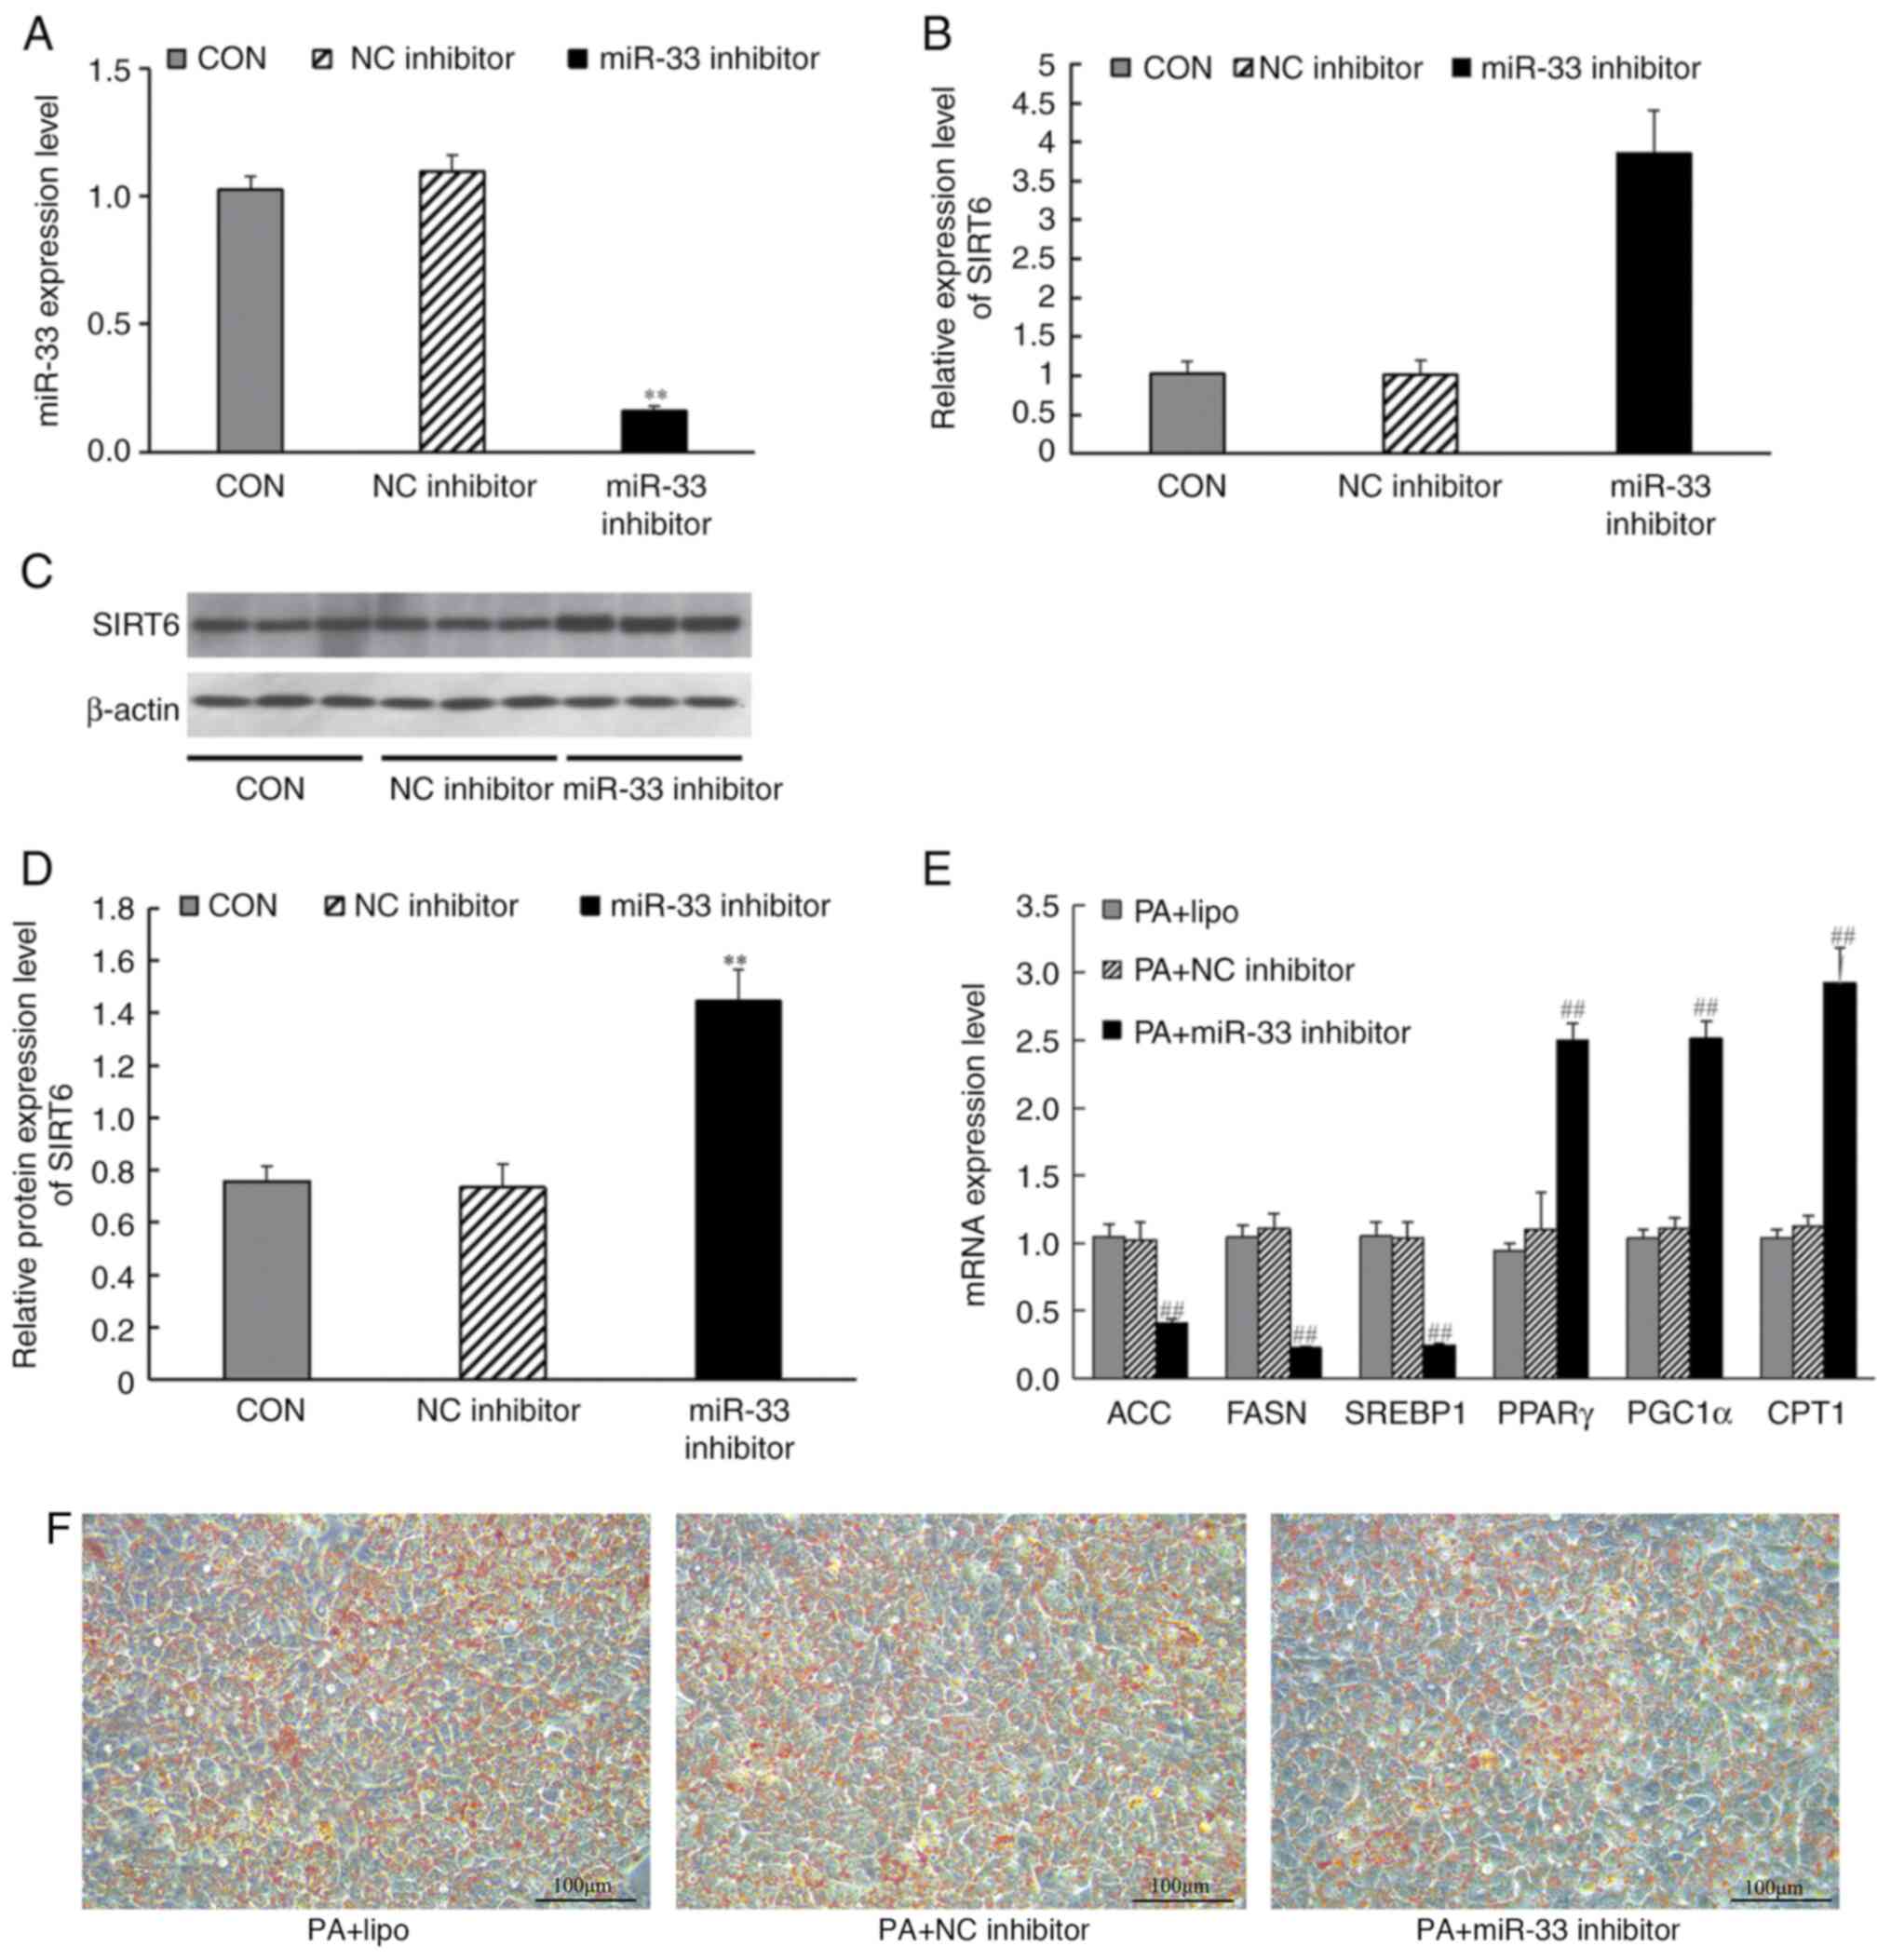 | Figure 7Effects of miR-33 inhibitor
transfection on the mRNA and protein expression levels of SIRT6,
and expression levels of mRNAs involved in fatty acid synthesis and
fatty acid β-oxidation. HepG2 cells were transfected with miR-33
inhibitors for 24 h before harvesting. (A) Expression levels of
miR-33 after transfection with miR-33 inhibitors. (B) mRNA levels
of SIRT6. (C) Western blot analysis of SIRT6. (D) Protein levels of
SIRT6. CON group (liposome); NC inhibitor group (liposome +
inhibitor control sequence); miR-33 inhibitor group (liposome +
miR-33 inhibitor). **P<0.001 vs. NC inhibitor group
(one-way ANOVA with Tukey's multiple comparison test). (E) mRNA
expression levels of ACC, FASN, SREBP1, PPARγ, PGC1α and CPT1,
which are involved in fatty acid synthesis and fatty acid
β-oxidation, in PA + HepG2 cells following miR-33 inhibitor
transfection. (F) Effects of miR-33 inhibitor on intracellular
lipid deposition. PA + lipo group (liposome); PA + NC inhibitor
group (liposome + inhibitor control sequence); PA + miR-33
inhibitor group (liposome + miR-33 inhibitor);
##P<0.001 vs. PA + NC inhibitor group (one-way ANOVA
with Tukey's multiple comparison test). β-actin was used as a
control for the normalization of samples for western blotting,
respectively. Scale bar, 100 µm. Data are presented as the mean ±
SD (n=3). ACC, acetyl-CoA carboxylase; CPT1, carnitine palmitoyl
transferase 1; FASN, fatty acid synthase; miR, microRNA; PA,
palmitate; PGC1α, PPARγ-coactivator 1α; PPARγ, peroxisome
proliferator-activated receptor-γ; SIRT6, sirtuin 6; SREBP1, sterol
regulatory element-binding protein 1. |
SIRT6 overexpression affects the
expression of lipid metabolism-related genes
To further analyze the effect of SIRT6
overexpression on intracellular lipid metabolism, SIRT6-pcDNA 3.1
was transfected into HepG2 cells. The results demonstrated that,
after transfection with SIRT6-pcDNA 3.1, the expression levels of
SIRT6 mRNA were significantly increased (Fig. 8A) and the protein expression levels
of SIRT6 were also significantly increased compared with those in
the pcDNA 3.1 group (Fig. 8B and
C). HepG2 cells were induced by PA
for 24 h after transfection, and RT-qPCR and western blotting were
used to analyze the effect of SIRT6 overexpression on its
downstream lipid metabolism-related genes, and Oil Red O staining
was used to analyze the effect of SIRT6 overexpression on lipid
deposition. The results revealed that transfection of HepG2 cells
with SIRT6 overexpression vector increased PPARγ, PGC1α and CPT1
expression, and decreased ACC, FASN and SREBP1 mRNA (Fig. 8D) and protein expression levels
(Fig. 8E and F). Simultaneously, Oil Red O staining
revealed decreased lipid deposition in HepG2 cells after SIRT6
overexpression (Fig. 8G).
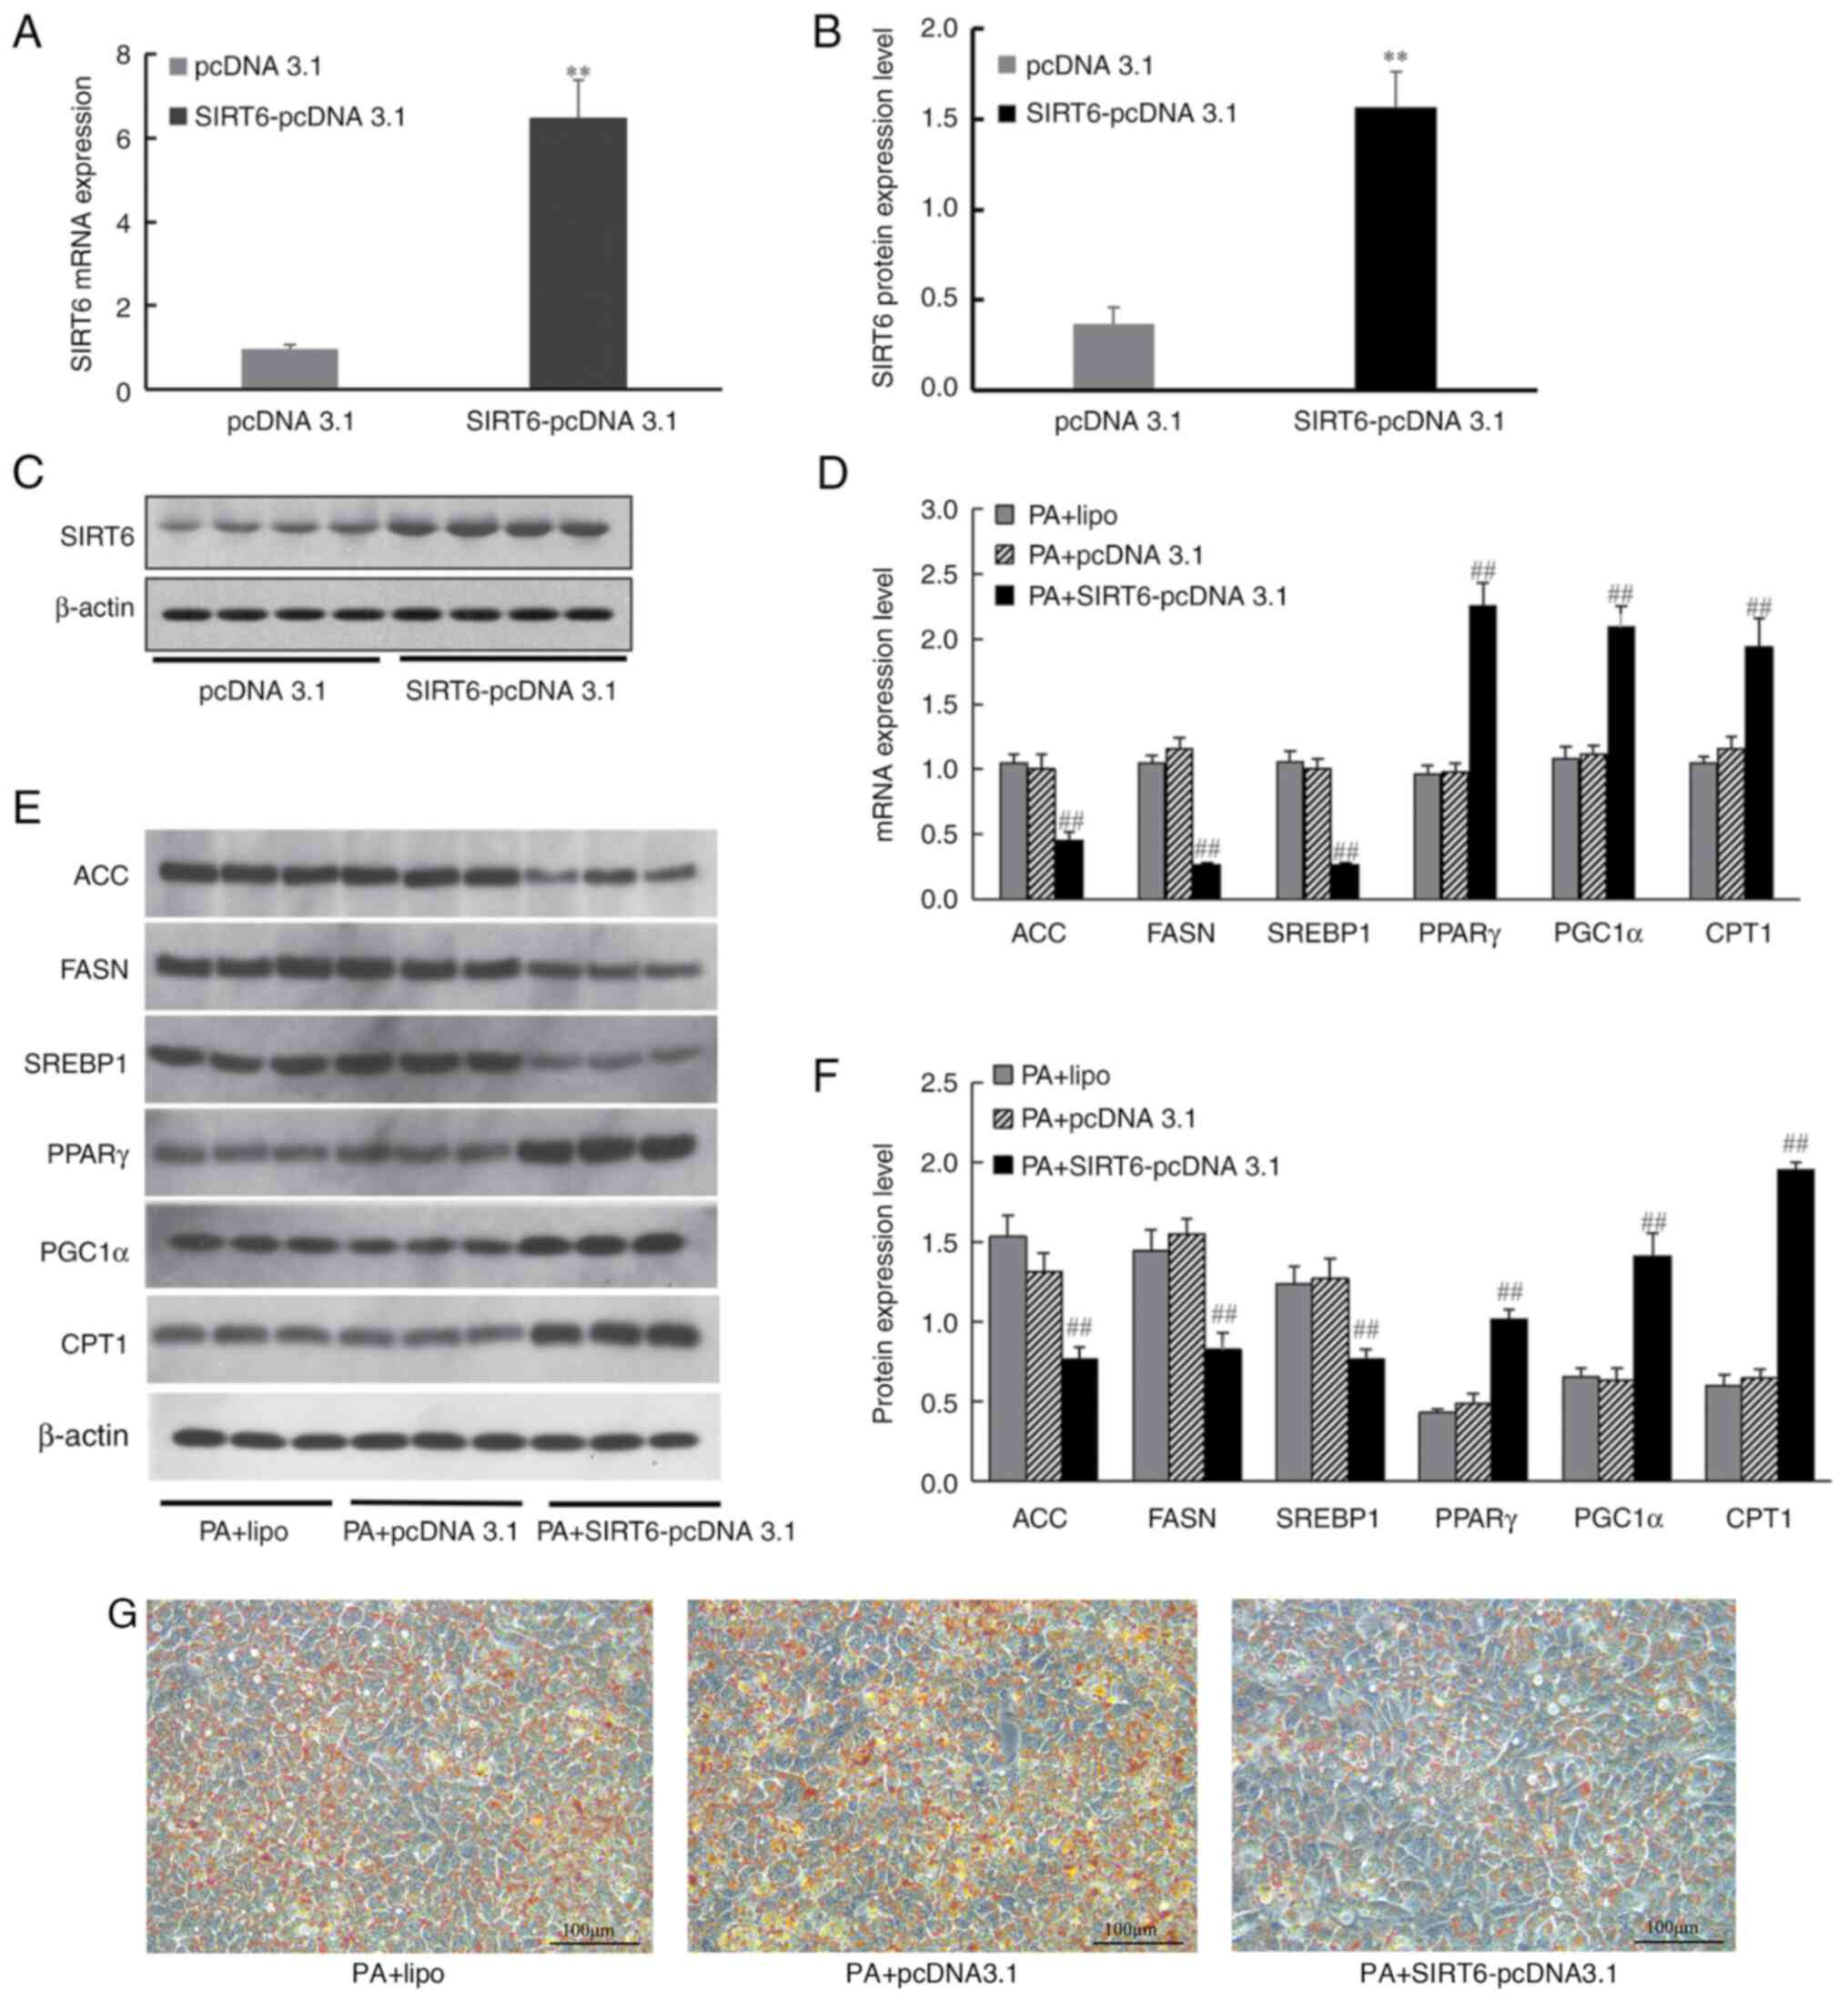 | Figure 8Effect of SIRT6 overexpression on the
expression of genes involved in fatty acid synthesis and fatty acid
β-oxidation. (A) mRNA expression levels of SIRT6. (B) Protein
expression levels of SIRT6. (C) Western blot analysis of SIRT6.
pcDNA 3.1 group (transfected with pcDNA 3.1); SIRT6-pcDNA 3.1 group
(transfected with SIRT6-pcDNA 3.1) (n=3; **P<0.001
vs. pcDNA 3.1 group; unpaired t-test). (D) mRNA levels of ACC,
FASN, SREBP1, PPARγ, PGC1α and CPT1 in HepG2 cells following
transfection. (E) Western blot analysis of ACC, FASN, SREBP1,
PPARγ, PGC1α and CPT1. (F) Protein expression levels of ACC, FASN,
SREBP1, PPARγ, PGC1α and CPT1 in HepG2 cells following
transfection. (G) Effects of SIRT6 overexpression on intracellular
lipid deposition. PA + lipo group (liposome); PA + pcDNA 3.1 group
(liposome + pcDNA 3.1); PA + SIRT6-pcDNA 3.1 group (liposome +
SIRT6-pcDNA 3.1). β-actin was used as a control for the
normalization of samples for western blotting. Scale bar, 100 µm.
Data are presented as the mean ± SD, n=3, ##P<0.001
vs. PA + pcDNA 3.1 group (one-way ANOVA with Tukey's multiple
comparison test). ACC, acetyl-CoA carboxylase; CPT1, carnitine
palmitoyl transferase; FASN, fatty acid synthase; NC, negative
control; PA, palmitate; PGC1α, PPARγ-coactivator 1α; PPARγ,
peroxisome proliferator-activated receptor-γ; SIRT6, sirtuin 6;
SREBP1, sterol regulatory element-binding protein 1. |
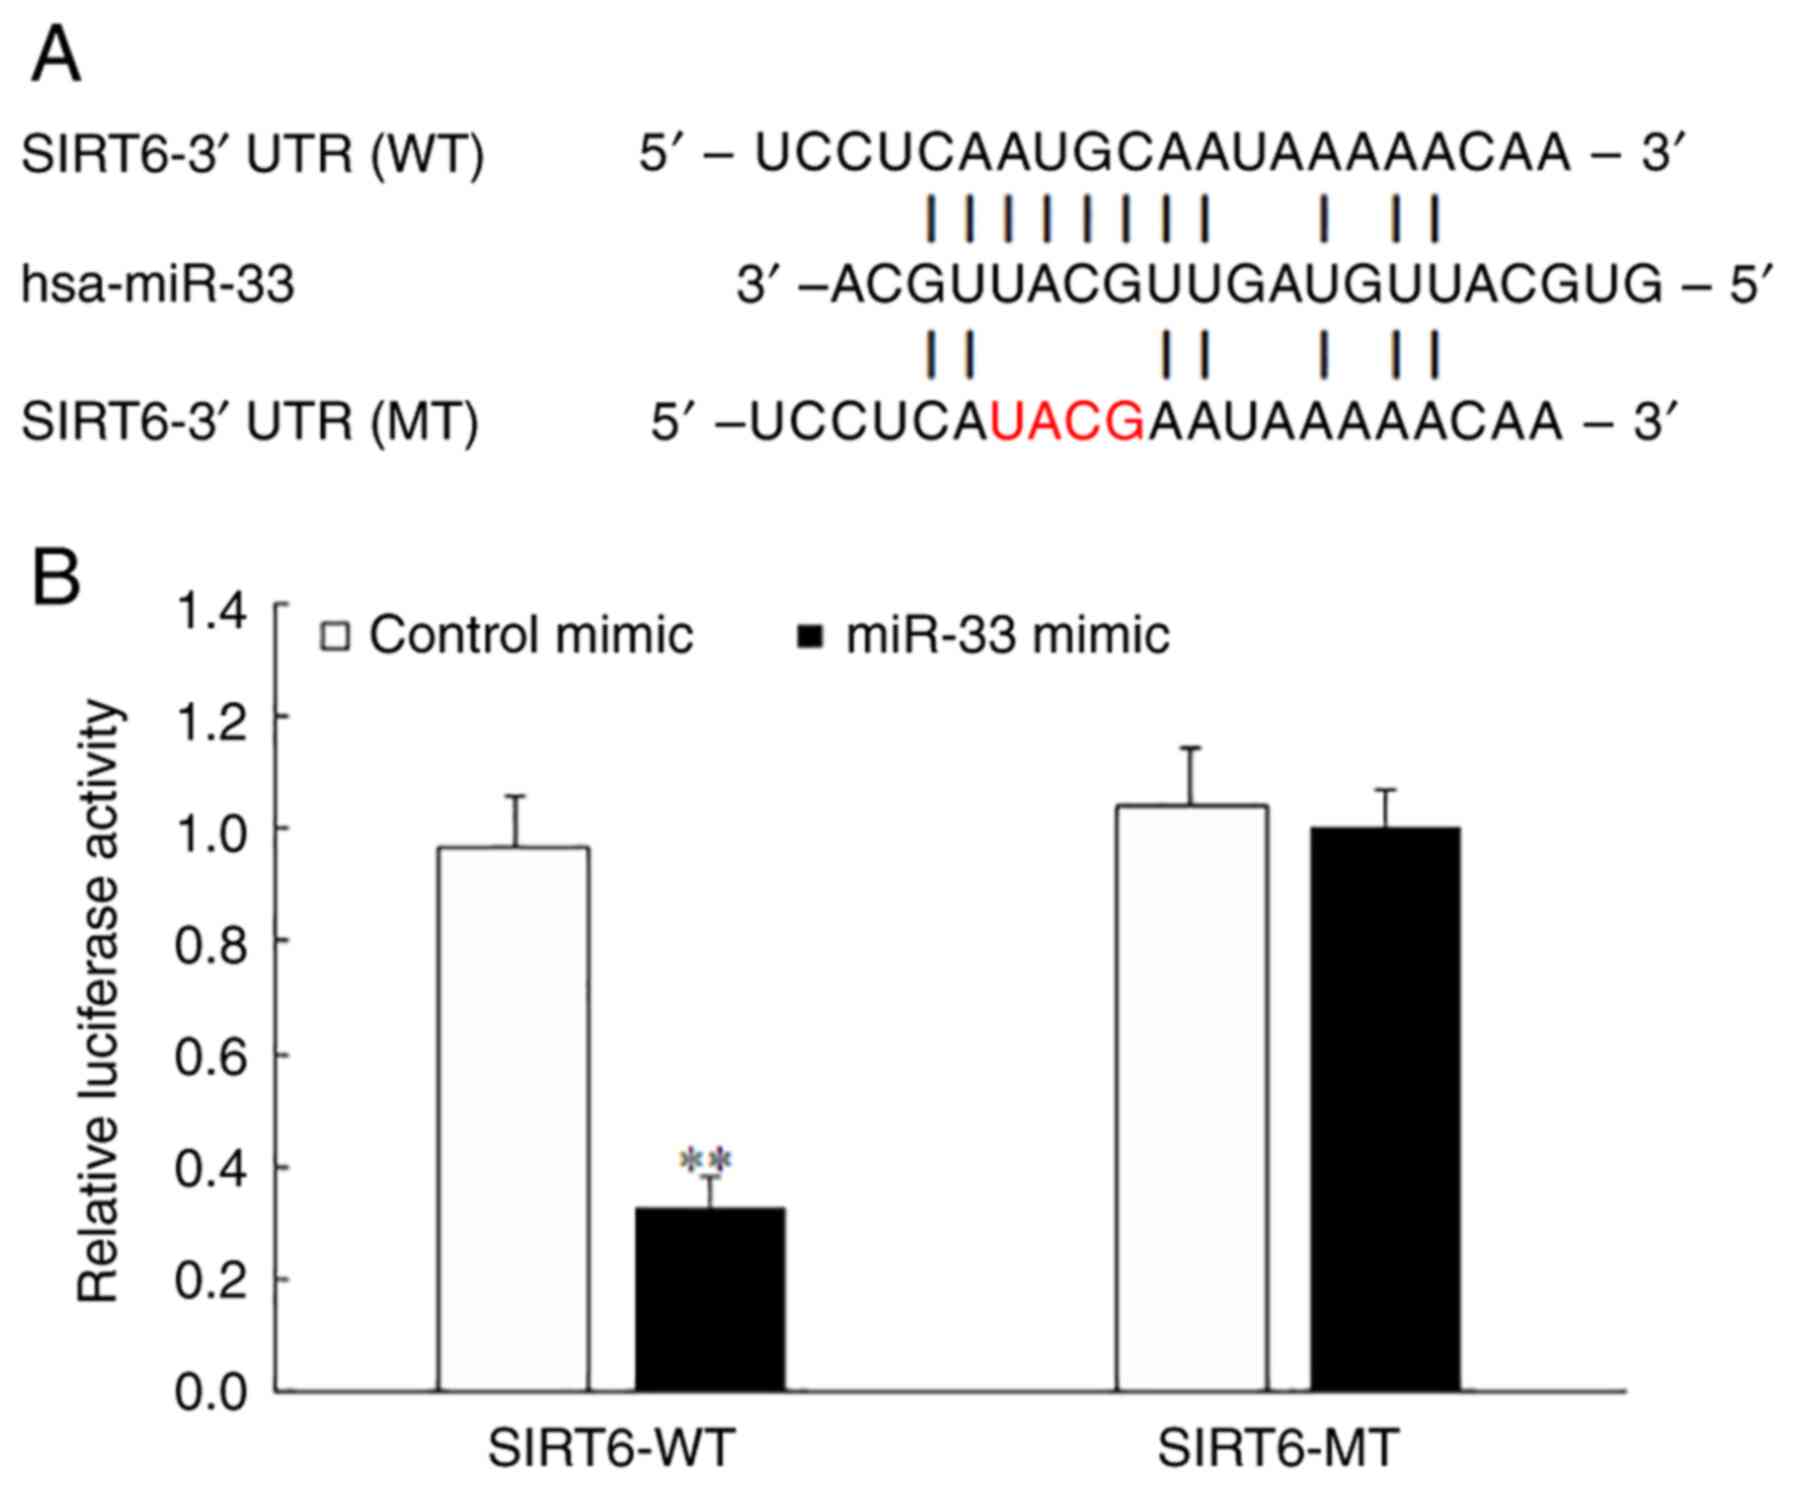
miR-33 binds to the 3'-UTR of SIRT6
mRNA and inhibits SIRT6 expression
To confirm the direct binding of miR-33 to the
3'-UTR of SIRT6 mRNA, luciferase reporter constructs were generated
containing the miR-33 binding site (SIRT6-WT) and its mutant
sequence (SIRT6-MT). The results of the luciferase reporter assay
demonstrated that the miR-33 mimic significantly decreased the
luciferase activity in the SIRT6-WT group (Fig. 9A and B) and had no obvious effect in the
SIRT6-MT group (Fig. 9B),
indicating that SIRT6 was a direct target of miR-33.
Discussion
miRNAs represent a novel level of regulation that
could provide novel therapeutic targets for the treatment of
numerous human diseases (11,43-47).
Manipulating the expression of miRNAs has good potential for
treating lipid metabolism (48).
miR-33 is one of the most well-studied miRNAs and regulates hepatic
lipoprotein metabolism, fibrosis and regeneration (49). Previous studies have reported that
short-term treatment with miR-33 inhibitors markedly increased
plasma HDL-C levels (50-52).
Numerous studies (53-57)
have confirmed that Chinese herbal medicines or their active
components can target miRNAs in the treatment of diseases. However,
few studies (58-60)
have focused on the treatment of lipid metabolism disorders with
traditional Chinese medicines or their active components targeting
miR-33. To this end, in the current study, the in vivo and
in vitro effects of Res were investigated in a HFD mouse
model and PA-induced HepG2 cells. The results indicated that Res
antagonized abnormal lipid metabolism by targeting miR-33. A
further search for downstream genes found that Res inhibited miR-33
expression in the liver and upregulated SIRT6, a key regulator of
hepatic lipid metabolism and liver health (61,62).
Res also altered the expression levels of genes involved in fatty
acid synthesis and fatty acid β-oxidation. Thus, the present study
indicated that Res should be further studied for its potential
clinical use to prevent or treat hyperlipidemia and associated
diseases.
Although multiple animal experiments have confirmed
that miR-33 is an important small RNA in regulating lipid
metabolism, few studies have been conducted on its expression
levels in circulating blood in individuals with hyperlipidemia
(20,58,63-67).
A total of two studies have confirmed upregulation of miR-33
expression in circulating blood using different methods in
participants with hyperlipidemia compared with participants without
hyperlipidemia (68,69). Therefore, in the present study, the
serum levels of miR-33 were detected in participants with
hyperlipidemia. The results showed significant upregulation of
miR-33 expression in participants with hyperlipidemia, consistent
with previous research findings.
The expression levels of SIRT6, a known target gene
of miR-33(62), were lower in
participants with hyperlipidemia compared with participants without
hyperlipidemia. SIRT6 is a member of the class III histone
deacetylase family and serves an important role in regulating
hepatic TG, TC and LDL-C homeostasis (70-76).
SIRT6 also increases hepatic fatty acid oxidation (77). The present findings demonstrated
that Res improved the basic metabolic parameters of mice fed a HFD.
Res also inhibited miR-33 expression and promoted SIRT6 expression
in the HFD mouse models and PA-induced HepG2 cells in the present
study. Furthermore, Res treatment altered the expression levels of
other genes involved in fatty acid synthesis and fatty acid
β-oxidation. Among these genes, SREBP1 can regulate fatty acid
homeostasis, and SREBP1 upregulation can lead to lipid metabolism
disorders, subsequently causing insulin resistance, obesity,
non-alcoholic fatty liver disease and hepatocellular carcinoma
(78-81).
The activities of both FASN and ACC are an indirect indicator of
lipid synthesis in the liver (82). Previous studies have reported that
increased activation of FASN and ACC could accelerate lipid
synthesis (83,84). In the present study, Res
downregulated the protein expression levels of SREBP1, ACC and FASN
in the liver of mice fed a HFD. These results indicated that Res
decreased lipid synthesis, which prevents excessive accumulation of
fat (37). Res also upregulated
the protein expression levels of PGC1α, PPARγ and CPT1 in the
livers of mice fed a HFD. The aforementioned genes are involved in
fatty acid β-oxidation. For example, CPT1 participates in hepatic
lipid metabolism and adipocyte differentiation (85,86).
CPT1 activation can reduce the number of adipocytes, facilitate
adipocyte differentiation and control lipid peroxidation (87). Upregulation of PPARγ in
subcutaneous adipose tissue can combat HFD-induced obesity and
promote β-oxidation of fatty acids (85,88).
PGC1α, as a key PPARγ coactivator, regulates fatty acid catabolism
(89). The present results
indicated a direct interaction between miR-33 and the SIRT6-3'-UTR.
It was also demonstrated that miR-33 negatively regulated SIRT6
protein expression at the post-translational level in vitro,
and SIRT6 overexpression changed the expression levels of genes
involved in fatty acid synthesis and fatty acid β-oxidation. The
present results suggested that Res improved lipid metabolism by
regulating the miR-33/SIRT6 signaling pathway.
In conclusion, the present study revealed a negative
association between miR-33 and SIRT6 expression in hyperlipidemia.
miR-33 negatively regulated lipid metabolism by targeting SIRT6.
Res improved lipid metabolism by regulating the miR-33/SIRT6
signaling pathway. However, how Res regulated miR-33 expression
remains uncertain and requires further investigation in subsequent
studies. It is expected that further research can provide
additional insights into potential therapeutics for lipid
metabolism disorders, such as miR-33 antagonists to reduce the harm
caused by elevated blood lipids.
Acknowledgements
Not applicable.
Funding
Funding: The present study was supported by the Natural Science
Foundation of Hebei (grant no. H201830-7071).
Availability of data and materials
The data generated in the present study may be
requested from the corresponding author.
Authors' contributions
CL and GS conceived and designed the study. CL, XP,
ZH, XW and CW acquired and analyzed the data. CL, CW and GS confirm
the authenticity of all the raw data. CL prepared the draft of the
manuscript. All authors read and approved the final manuscript.
Ethics approval and consent to
participate
Written informed consent was provided by all
participants. Patient studies (2018 Scientific Research Ethics
Review; approval no. 39) and animal experiments (2022 Scientific
Research Ethics Review; approval no. 217) were approved by the
Hebei General Hospital Ethics Committee (Shijiazhuang, China).
Animal experiments complied with the Animal (Scientific Procedures)
Act 1986 and associated guidelines.
Patient consent for publication
Not applicable.
Competing interests
The authors declare that they have no competing
interests.
References
|
1
|
Joint Committee on Revision of Guidelines
for the Prevention and Treatment of Dyslipidemia in Adults.
Guidelines for the prevention and treatment of dyslipidemia in
Chinese adults (revised edition 2016). Chin Circul J. 31:937–950.
2016.
|
|
2
|
Mensah GA, Fuster V and Roth GA: A
heart-healthy and stroke-free world: Using data to inform global
action. J Am Coll Cardiol. 82:2343–2349. 2023.PubMed/NCBI View Article : Google Scholar
|
|
3
|
Nelson RH: Hyperlipidemia as a risk factor
for cardiovascular disease. Prim Care. 40:195–211. 2013.PubMed/NCBI View Article : Google Scholar
|
|
4
|
Klop B, Elte JW and Cabezas MC:
Dyslipidemia in obesity: Mechanisms and potential targets.
Nutrients. 5:1218–1240. 2013.PubMed/NCBI View Article : Google Scholar
|
|
5
|
Chen MY, Meng XF, Han YP, Yan JL, Xiao C
and Qian LB: Profile of crosstalk between glucose and lipid
metabolic disturbance and diabetic cardiomyopathy: Inflammation and
oxidative stress. Front Endocrinol (Lausanne).
13(983713)2022.PubMed/NCBI View Article : Google Scholar
|
|
6
|
Song R, Hu M, Qin X, Qiu L, Wang P, Zhang
X, Liu R and Wang X: The roles of lipid metabolism in the
pathogenesis of chronic diseases in the elderly. Nutrients.
15(3433)2023.PubMed/NCBI View Article : Google Scholar
|
|
7
|
Michos ED, McEvoy JW and Blumenthal RS:
Lipid management for the prevention of atherosclerotic
cardiovascular disease. N Engl J Med. 381:1557–1567.
2019.PubMed/NCBI View Article : Google Scholar
|
|
8
|
Agbu P and Carthew RW: MicroRNA-mediated
regulation of glucose and lipid metabolism. Nat Rev Mol Cell Biol.
22:425–438. 2021.PubMed/NCBI View Article : Google Scholar
|
|
9
|
Rayner KJ, Suárez Y, Dávalos A, Parathath
S, Fitzgerald ML, Tamehiro N, Fisher EA, Moore KJ and
Fernández-Hernando C: MiR-33 contributes to the regulation of
cholesterol homeostasis. Science. 328:1570–1573. 2010.PubMed/NCBI View Article : Google Scholar
|
|
10
|
Marquart TJ, Allen RM, Ory DS and Baldán
A: miR-33 links SREBP-2 induction to repression of sterol
transporters. Proc Natl Acad Sci USA. 107:12228–12232.
2010.PubMed/NCBI View Article : Google Scholar
|
|
11
|
Najafi-Shoushtari SH, Kristo F, Li Y,
Shioda T, Cohen DE, Gerszten RE and Näär AM: MicroRNA-33 and the
SREBP host genes cooperate to control cholesterol homeostasis.
Science. 328:1566–1569. 2010.PubMed/NCBI View Article : Google Scholar
|
|
12
|
Price NL, Goedeke L, Suárez Y and
Fernández-Hernando C: miR-33 in cardiometabolic diseases: Lessons
learned from novel animal models and approaches. EMBO Mol Med.
13(e12606)2021.PubMed/NCBI View Article : Google Scholar
|
|
13
|
Deng X, Qin S, Chen Y, Liu H, Yuan E, Deng
H and Liu S: B-RCA revealed circulating miR-33a/b associates with
serum cholesterol in type 2 diabetes patients at high risk of
ASCVD. Diabetes Res Clin Pract. 140:191–199. 2018.PubMed/NCBI View Article : Google Scholar
|
|
14
|
Price NL, Singh AK, Rotllan N, Goedeke L,
Wing A, Canfrán-Duque A, Diaz-Ruiz A, Araldi E, Baldán Á, Camporez
JP, et al: Genetic ablation of miR-33 increases food intake,
enhances adipose tissue expansion, and promotes obesity and insulin
resistance. Cell Rep. 22:2133–2145. 2018.PubMed/NCBI View Article : Google Scholar
|
|
15
|
Price NL, Rotllan N, Canfrán-Duque A,
Zhang X, Pati P, Arias N, Moen J, Mayr M, Ford DA, Baldán Á, et al:
Genetic dissection of the impact of miR-33a and miR-33b during the
progression of atherosclerosis. Cell Rep. 21:1317–1330.
2017.PubMed/NCBI View Article : Google Scholar
|
|
16
|
Näär AM: miR-33: A metabolic conundrum.
Trends Endocrinol Metab. 29:667–668. 2018.PubMed/NCBI View Article : Google Scholar
|
|
17
|
Li T, Francl JM, Boehme S and Chiang JYL:
Regulation of cholesterol and bile acid homeostasis by the
cholesterol 7α-hydroxylase/steroid response element-binding protein
2/microRNA-33a axis in mice. Hepatology. 58:1111–1121.
2013.PubMed/NCBI View Article : Google Scholar
|
|
18
|
Allen RM, Marquart TJ, Albert CJ, Suchy
FJ, Wang DQH, Ananthanarayanan M, Ford DA and Baldán A: miR-33
controls the expression of biliary transporters, and mediates
statin- and diet-induced hepatotoxicity. EMBO Mol Med. 4:882–895.
2012.PubMed/NCBI View Article : Google Scholar
|
|
19
|
Ouimet M, Ediriweera HN, Gundra UM, Sheedy
FJ, Ramkhelawon B, Hutchison SB, Rinehold K, van Solingen C,
Fullerton MD, Cecchini K, et al: MicroRNA-33-dependent regulation
of macrophage metabolism directs immune cell polarization in
atherosclerosis. J Clin Invest. 125:4334–4348. 2015.PubMed/NCBI View Article : Google Scholar
|
|
20
|
Tomita K, Teratani T, Suzuki T, Shimizu M,
Sato H, Narimatsu K, Okada Y, Kurihara C, Irie R, Yokoyama H, et
al: Free cholesterol accumulation in hepatic stellate cells:
Mechanism of liver fibrosis aggravation in nonalcoholic
steatohepatitis in mice. Hepatology. 59:154–169. 2014.PubMed/NCBI View Article : Google Scholar
|
|
21
|
Price NL, Zhang X, Fernández-Tussy P,
Singh AK, Burnap SA, Rotllan N, Goedeke L, Sun J, Canfrán-Duque A,
Aryal B, et al: Loss of hepatic miR-33 improves metabolic
homeostasis and liver function without altering body weight or
atherosclerosis. Proc Natl Acad Sci USA.
118(e2006478118)2021.PubMed/NCBI View Article : Google Scholar
|
|
22
|
Fernández-Tussy P, Sun J, Cardelo MP,
Price NL, Goedeke L, Xirouchaki CE, Yang X, Pastor-Rojo O, Bennett
AM, Tiganis T, et al: Hepatocyte-specific miR-33 deletion
attenuates NAFLD-NASH-HCC progression. bioRxiv [Preprint]:
2023.01.18.523503, 2023.
|
|
23
|
Kang J, Kim H, Mun D, Yun N and Joung B:
Co-delivery of curcumin and miRNA-144-3p using heart-targeted
extracellular vesicles enhances the therapeutic efficacy for
myocardial infarction. J Control Release. 331:62–73.
2021.PubMed/NCBI View Article : Google Scholar
|
|
24
|
Alharris E, Alghetaa H, Seth R, Chatterjee
S, Singh NP, Nagarkatti M and Nagarkatti P: Corrigendum:
Resveratrol attenuates allergic asthma and associated inflammation
in the lungs through regulation of miRNA-34a that targets FoxP3 in
mice. Front Immunol. 14(1130947)2023.PubMed/NCBI View Article : Google Scholar
|
|
25
|
Chen WT, Yang MJ, Tsuei YW, Su TC, Siao
AC, Kuo YC, Huang LR, Chen Y, Chen SJ, Chen PC, et al: Green tea
epigallocatechin gallate inhibits preadipocyte growth via the
microRNA-let-7a/HMGA2 signaling pathway. Mol Nutr Food Res.
67(e2200336)2023.PubMed/NCBI View Article : Google Scholar
|
|
26
|
Pezzuto JM: Resveratrol: Twenty years of
growth, development and controversy. Biomol Ther (Seoul). 27:1–14.
2019.PubMed/NCBI View Article : Google Scholar
|
|
27
|
Huang X and Zhu H: Resveratrol and its
analogues: Promising antitumor agents. Anticancer Agents Med Chem.
11:479–490. 2011.PubMed/NCBI View Article : Google Scholar
|
|
28
|
Rauf A, Imran M, Suleria HAR, Ahmad B,
Peters DG and Mubarak MS: A comprehensive review of the health
perspectives of resveratrol. Food Funct. 8:4284–4305.
2017.PubMed/NCBI View Article : Google Scholar
|
|
29
|
Zhang W, Yu H, Lin Q, Liu X, Cheng Y and
Deng B: Anti-inflammatory effect of resveratrol attenuates the
severity of diabetic neuropathy by activating the Nrf2 pathway.
Aging (Albany NY). 13:10659–10671. 2021.PubMed/NCBI View Article : Google Scholar
|
|
30
|
Bagul PK, Middela H, Matapally S, Padiya
R, Bastia T, Madhusudana K, Reddy BR, Chakravarty S and Banerjee
SK: Attenuation of insulin resistance, metabolic syndrome and
hepatic oxidative stress by resveratrol in fructose-fed rats.
Pharmacol Res. 66:260–268. 2012.PubMed/NCBI View Article : Google Scholar
|
|
31
|
Most J, Timmers S, Warnke I, Jocken JW,
van Boekschoten M, de Groot P, Bendik I, Schrauwen P, Goossens GH
and Blaak EE: Combined epigallocatechin-3-gallate and resveratrol
supplementation for 12 wk increases mitochondrial capacity and fat
oxidation, but not insulin sensitivity, in obese humans: A
randomized controlled trial. Am J Clin Nutr. 104:215–227.
2016.PubMed/NCBI View Article : Google Scholar
|
|
32
|
Auger C, Teissedre PL, Gérain P, Lequeux
N, Bornet A, Serisier S, Besançon P, Caporiccio B, Cristol JP and
Rouanet JM: Dietary wine phenolics catechin, quercetin, and
resveratrol efficiently protect hypercholesterolemic hamsters
against aortic fatty streak accumulation. J Agric Food Chem.
53:2015–2021. 2005.PubMed/NCBI View Article : Google Scholar
|
|
33
|
Fogacci F, Tocci G, Presta V, Fratter A,
Borghi C and Cicero AFG: Effect of resveratrol on blood pressure: A
systematic review and meta-analysis of randomized, controlled,
clinical trials. Crit Rev Food Sci Nutr. 59:1605–1618.
2019.PubMed/NCBI View Article : Google Scholar
|
|
34
|
Singh AP, Singh R, Verma SS, Rai V,
Kaschula CH, Maiti P and Gupta SC: Health benefits of resveratrol:
Evidence from clinical studies. Med Res Rev. 39:1851–1891.
2019.PubMed/NCBI View Article : Google Scholar
|
|
35
|
Onuki J, Almeida EA, Medeiros MHG and Di
Mascio P: Inhibition of 5-aminolevulinic acid-induced DNA damage by
melatonin, N1-acetyl-N2-formyl-5-methoxykynuramine, quercetin or
resveratrol. J Pineal Res. 38:107–115. 2005.PubMed/NCBI View Article : Google Scholar
|
|
36
|
Fujimoto M, Shimizu N, Kunii K, Martyn
JAJ, Ueki K and Kaneki M: A role for iNOS in fasting hyperglycemia
and impaired insulin signaling in the liver of obese diabetic mice.
Diabetes. 54:1340–1348. 2005.PubMed/NCBI View Article : Google Scholar
|
|
37
|
Yarahmadi S, Farahmandian N, Fadaei R,
Koushki M, Bahreini E, Karima S, Barzin Tond S, Rezaei A,
Nourbakhsh M and Fallah S: Therapeutic potential of resveratrol and
atorvastatin following high-fat diet uptake-induced nonalcoholic
fatty liver disease by targeting genes involved in cholesterol
metabolism and miR33. DNA Cell Biol. 42:82–90. 2023.PubMed/NCBI View Article : Google Scholar
|
|
38
|
Baselga-Escudero L, Blade C, Ribas-Latre
A, Casanova E, Suárez M, Torres JL, Salvado MJ, Arola L and
Arola-Arnal A: Resveratrol and EGCG bind directly and distinctively
to miR-33a and miR-122 and modulate divergently their levels in
hepatic cells. Nucleic Acids Res. 42:882–892. 2014.PubMed/NCBI View Article : Google Scholar
|
|
39
|
Ferdowsian H: Human and animal research
guidelines: Aligning ethical constructs with new scientific
developments. Bioethics. 25:472–478. 2011.PubMed/NCBI View Article : Google Scholar
|
|
40
|
Hickman DL: Minimal exposure times for
irreversible euthanasia with carbon dioxide in mice and rats. J Am
Assoc Lab Anim Sci. 61:283–286. 2022.PubMed/NCBI View Article : Google Scholar
|
|
41
|
American Veterinary Medical Association.
[Internet]. 2020. AVMA guidelines for the euthanasia of animals.
[Cited 12 January 2022.] Available at: https://www.avma.org/sites/default/files/2020-01/2020-Euthanasia-Final-1-17-20.pdf.
|
|
42
|
Livak KJ and Schmittgen TD: Analysis of
relative gene expression data using real-time quantitative PCR and
the 2(-Delta Delta C(T)) method. Methods. 25:402–408.
2001.PubMed/NCBI View Article : Google Scholar
|
|
43
|
Horie T, Nishino T, Baba O, Kuwabara Y,
Nakao T, Nishiga M, Usami S, Izuhara M, Sowa N, Yahagi N, et al:
MicroRNA-33 regulates sterol regulatory element-binding protein 1
expression in mice. Nat Commun. 4(2883)2013.PubMed/NCBI View Article : Google Scholar
|
|
44
|
Barwari T, Joshi A and Mayr M: MicroRNAs
in cardiovascular disease. J Am Coll Cardiol. 68:2577–2584.
2016.PubMed/NCBI View Article : Google Scholar
|
|
45
|
Olson EN: MicroRNAs as therapeutic targets
and biomarkers of cardiovascular disease. Sci Transl Med.
6(239ps3)2014.PubMed/NCBI View Article : Google Scholar
|
|
46
|
Mahtal N, Lenoir O, Tinel C, Anglicheau D
and Tharaux PL: MicroRNAs in kidney injury and disease. Nat Rev
Nephrol. 18:643–662. 2022.PubMed/NCBI View Article : Google Scholar
|
|
47
|
Wonnacott A, Denby L, Coward RJM, Fraser
DJ and Bowen T: MicroRNAs and their delivery in diabetic fibrosis.
Adv Drug Deliv Rev. 182(114045)2022.PubMed/NCBI View Article : Google Scholar
|
|
48
|
Ji C and Guo X: The clinical potential of
circulating microRNAs in obesity. Nat Rev Endocrinol. 15:731–743.
2019.PubMed/NCBI View Article : Google Scholar
|
|
49
|
Gerlach CV and Vaidya VS: MicroRNAs in
injury and repair. Arch Toxicol. 91:2781–2797. 2017.PubMed/NCBI View Article : Google Scholar
|
|
50
|
Alrob OA, Khatib S and Naser SA: MicroRNAs
33, 122, and 208: A potential novel targets in the treatment of
obesity, diabetes, and heart-related diseases. J Physiol Biochem.
73:307–314. 2017.PubMed/NCBI View Article : Google Scholar
|
|
51
|
Baselga-Escudero L, Bladé C, Ribas-Latre
A, Casanova E, Salvadó MJ, Arola L and Arola-Arnal A: Grape seed
proanthocyanidins repress the hepatic lipid regulators miR-33 and
miR-122 in rats. Mol Nutr Food Res. 56:1636–1646. 2012.PubMed/NCBI View Article : Google Scholar
|
|
52
|
Rayner KJ, Esau CC, Hussain FN, McDaniel
AL, Marshall SM, van Gils JM, Ray TD, Sheedy FJ, Goedeke L, Liu X,
et al: Inhibition of miR-33a/b in non-human primates raises plasma
HDL and lowers VLDL triglycerides. Nature. 478:404–407.
2011.PubMed/NCBI View Article : Google Scholar
|
|
53
|
Dong Y, Chen H, Gao J, Liu Y, Li J and
Wang J: Bioactive ingredients in Chinese Herbal medicines that
target non-coding RNAs: Promising new choices for disease
treatment. Front Pharmacol. 10(515)2019.PubMed/NCBI View Article : Google Scholar
|
|
54
|
Guo G, Zhou J, Yang X, Feng J, Shao Y, Jia
T, Huang Q, Li Y, Zhong Y, Nagarkatti PS and Nagarkatti M: Role of
MicroRNAs induced by Chinese Herbal medicines against
hepatocellular carcinoma: A brief review. Integr Cancer Ther.
17:1059–1067. 2018.PubMed/NCBI View Article : Google Scholar
|
|
55
|
Huang Z, Huang Q, Ji L, Wang Y, Qi X, Liu
L, Liu Z and Lu L: Epigenetic regulation of active Chinese herbal
components for cancer prevention and treatment: A follow-up review.
Pharmacol Res. 114:1–12. 2016.PubMed/NCBI View Article : Google Scholar
|
|
56
|
Xin H, Kong Y, Wang Y, Zhou Y, Zhu Y, Li D
and Tan W: Lignans extracted from Vitex negundo possess cytotoxic
activity by G2/M phase cell cycle arrest and apoptosis induction.
Phytomedicine. 20:640–647. 2023.PubMed/NCBI View Article : Google Scholar
|
|
57
|
Wu Z, Zhu Q, Yin Y, Kang D, Cao R, Tian Q,
Zhang Y, Lu S and Liu P: Traditional Chinese medicine CFF-1 induced
cell growth inhibition, autophagy, and apoptosis via inhibiting
EGFR-related pathways in prostate cancer. Cancer Med. 7:1546–1559.
2018.PubMed/NCBI View Article : Google Scholar
|
|
58
|
Cao R, Bai Y, Sun L, Zheng J, Zu M, Du G
and Ye P: Xuezhikang therapy increases miR-33 expression in
patients with low HDL-C levels. Dis Markers.
2014(781780)2014.PubMed/NCBI View Article : Google Scholar
|
|
59
|
Su D, Liu H, Qi X, Dong L, Zhang R and
Zhang J: Citrus peel flavonoids improve lipid metabolism by
inhibiting miR-33 and miR-122 expression in HepG2 cells. Biosci
Biotechnol Biochem. 83:1747–1755. 2019.PubMed/NCBI View Article : Google Scholar
|
|
60
|
Yang X, Wang L, Zhang Z, Hu J, Liu X, Wen
H, Liu M, Zhang X, Dai H, Ni M, et al: Ginsenoside Rb1
enhances plaque stability and inhibits adventitial vasa vasorum via
the modulation of miR-33 and PEDF. Front Cardiovasc Med.
8(654670)2021.PubMed/NCBI View Article : Google Scholar
|
|
61
|
Kim HS, Xiao C, Wang RH, Lahusen T, Xu X,
Vassilopoulos A, Vazquez-Ortiz G, Jeong WI, Park O, Ki SH, et al:
Hepatic-specific disruption of SIRT6 in mice results in fatty liver
formation due to enhanced glycolysis and triglyceride synthesis.
Cell Metab. 12:224–236. 2010.PubMed/NCBI View Article : Google Scholar
|
|
62
|
He J, Zhang G, Pang Q, Yu C, Xiong J, Zhu
J and Chen F: SIRT6 reduces macrophage foam cell formation by
inducing autophagy and cholesterol efflux under ox-LDL condition.
FEBS J. 284:1324–1337. 2017.PubMed/NCBI View Article : Google Scholar
|
|
63
|
Rayner KJ, Sheedy FJ, Esau CC, Hussain FN,
Temel RE, Parathath S, van Gils JM, Rayner AJ, Chang AN, Suarez Y,
et al: Antagonism of miR-33 in mice promotes reverse cholesterol
transport and regression of atherosclerosis. J Clin Invest.
121:2921–2931. 2011.PubMed/NCBI View Article : Google Scholar
|
|
64
|
Shao F, Wang X, Yu J, Jiang H, Zhu B and
Gu Z: Expression of miR-33 from an SREBF2 intron targets the FTO
gene in the chicken. PLoS One. 9(e91236)2014.PubMed/NCBI View Article : Google Scholar
|
|
65
|
Zheng Y, Jiang S, Zhang Y, Zhang R and
Gong D: Detection of miR-33 expression and the verification of its
target genes in the fatty liver of geese. Int J Mol Sci.
16:12737–12752. 2015.PubMed/NCBI View Article : Google Scholar
|
|
66
|
D'Onofrio N, Sardu C, Paolisso P,
Minicucci F, Gragnano F, Ferraraccio F, Panarese I, Scisciola L,
Mauro C, Rizzo MR, et al: MicroRNA-33 and SIRT1 influence the
coronary thrombus burden in hyperglycemic STEMI patients. J Cell
Physiol. 235:1438–1452. 2020.PubMed/NCBI View Article : Google Scholar
|
|
67
|
Gnanaguru G, Wagschal A, Oh J, Saez-Torres
KL, Li T, Temel RE, Kleinman ME, Näär AM and D'Amore PA: Targeting
of miR-33 ameliorates phenotypes linked to age-related macular
degeneration. Mol Ther. 29:2281–2293. 2021.PubMed/NCBI View Article : Google Scholar
|
|
68
|
Yerlikaya FH, Can U, Alpaydin MS and
Aribas A: The relationship between plasma microRNAs and serum trace
elements levels in primary hyperlipidemia. Bratisl Lek Listy.
120:344–348. 2019.PubMed/NCBI View Article : Google Scholar
|
|
69
|
Simionescu N, Niculescu LS, Sanda GM,
Margina D and Sima AV: Analysis of circulating microRNAs that are
specifically increased in hyperlipidemic and/or hyperglycemic sera.
Mol Biol Rep. 41:5765–5773. 2014.PubMed/NCBI View Article : Google Scholar
|
|
70
|
Marmorstein R: Structure and chemistry of
the Sir2 family of NAD+-dependent histone/protein deactylases.
Biochem Soc Trans. 32:904–909. 2004.PubMed/NCBI View Article : Google Scholar
|
|
71
|
Kanfi Y, Peshti V, Gil R, Naiman S, Nahum
L, Levin E, Kronfeld-Schor N and Cohen HY: SIRT6 protects against
pathological damage caused by diet-induced obesity. Aging Cell.
9:162–173. 2010.PubMed/NCBI View Article : Google Scholar
|
|
72
|
Hong J, Mei C, Abbas Raza SH, Khan R,
Cheng G and Zan L: SIRT6 cooperates with SIRT5 to regulate bovine
preadipocyte differentiation and lipid metabolism via the AMPKα
signaling pathway. Arch Biochem Biophys. 681(108260)2020.PubMed/NCBI View Article : Google Scholar
|
|
73
|
Yang Q, Hu J, Yang Y, Chen Z, Feng J, Zhu
Z, Wang H, Yang D, Liang W and Ding G: Sirt6 deficiency aggravates
angiotensin II-induced cholesterol accumulation and injury in
podocytes. Theranostics. 10:7465–7479. 2020.PubMed/NCBI View Article : Google Scholar
|
|
74
|
Tao R, Xiong X, DePinho RA, Deng CX and
Dong XC: Hepatic SREBP-2 and cholesterol biosynthesis are regulated
by FoxO3 and Sirt6. J Lipid Res. 54:2745–2753. 2013.PubMed/NCBI View Article : Google Scholar
|
|
75
|
Elhanati S, Kanfi Y, Varvak A, Roichman A,
Carmel-Gross I, Barth S, Gibor G and Cohen HY: Multiple regulatory
layers of SREBP1/2 by SIRT6. Cell Rep. 4:905–912. 2013.PubMed/NCBI View Article : Google Scholar
|
|
76
|
Guo Z, Li P, Ge J and Li H: SIRT6 in
aging, metabolism, inflammation and cardiovascular diseases. Aging
Dis. 13:1787–1822. 2022.PubMed/NCBI View Article : Google Scholar
|
|
77
|
Naiman S, Huynh FK, Gil R, Glick Y, Shahar
Y, Touitou N, Nahum L, Avivi MY, Roichman A, Kanfi Y, et al: SIRT6
promotes hepatic beta-oxidation via activation of PPARα. Cell Rep.
29:4127–4143.e8. 2019.PubMed/NCBI View Article : Google Scholar
|
|
78
|
Ambele MA, Dhanraj P, Giles R and Pepper
MS: Adipogenesis: A complex interplay of multiple molecular
determinants and pathways. Int J Mol Sci. 21(4283)2020.PubMed/NCBI View Article : Google Scholar
|
|
79
|
Brewer M, Lange D, Baler R and Anzulovich
A: SREBP-1 as a transcriptional integrator of circadian and
nutritional cues in the liver. J Biol Rhythms. 20:195–205.
2005.PubMed/NCBI View Article : Google Scholar
|
|
80
|
Prodanović R, Korićanac G, Vujanac I,
Djordjević A, Pantelić M, Romić S, Stanimirović Z and Kirovski D:
Obesity-driven prepartal hepatic lipid accumulation in dairy cows
is associated with increased CD36 and SREBP-1 expression. Res Vet
Sci. 107:16–19. 2016.PubMed/NCBI View Article : Google Scholar
|
|
81
|
Feng T, Li S, Zhao G, Li Q, Yuan H, Zhang
J, Gu R, Ou D, Guo Y, Kou Q, et al: DDX39B facilitates the
malignant progression of hepatocellular carcinoma via activation of
SREBP1-mediated de novo lipid synthesis. Cell Oncol (Dordr).
46:1235–1252. 2023.PubMed/NCBI View Article : Google Scholar
|
|
82
|
Abukhalil MH, Hussein OE, Bin-Jumah M,
Saghir SAM, Germoush MO, Elgebaly HA, Mosa NM, Hamad I, Qarmush MM,
Hassanein EM, et al: Farnesol attenuates oxidative stress and liver
injury and modulates fatty acid synthase and acetyl-CoA carboxylase
in high cholesterol-fed rats. Environ Sci Pollut Res Int.
27:30118–30132. 2020.PubMed/NCBI View Article : Google Scholar
|
|
83
|
Kastaniotis AJ, Autio KJ, Kerätär JM,
Monteuuis G, Mäkelä AM, Nair RR, Pietikäinen LP, Shvetsova A, Chen
Z and Hiltunen JK: Mitochondrial fatty acid synthesis, fatty acids
and mitochondrial physiology. Biochim Biophys Acta Mol Cell Biol
Lipids. 1862:39–48. 2017.PubMed/NCBI View Article : Google Scholar
|
|
84
|
Peng X, Li J, Wang M, Qu K and Zhu H: A
novel AMPK activator improves hepatic lipid metabolism and
leukocyte trafficking in experimental hepatic steatosis. J
Pharmacol Sci. 140:153–161. 2019.PubMed/NCBI View Article : Google Scholar
|
|
85
|
Mørkholt AS, Oklinski MK, Larsen A,
Bockermann R, Issazadeh-Navikas S, Nieland JGK, Kwon TH, Corthals
A, Nielsen S and Nieland JDV: Pharmacological inhibition of
carnitine palmitoyl transferase 1 inhibits and reverses
experimental autoimmune encephalitis in rodents. PLoS One.
15(e0234493)2020.PubMed/NCBI View Article : Google Scholar
|
|
86
|
Song S, Attia RR, Connaughton S, Niesen
MI, Ness GC, Elam MB, Hori RT, Cook GA and Park EA: Peroxisome
proliferator activated receptor alpha (PPARalpha) and PPAR gamma
coactivator (PGC-1alpha) induce carnitine palmitoyltransferase IA
(CPT-1A) via independent gene elements. Mol Cell Endocrinol.
325:54–63. 2010.PubMed/NCBI View Article : Google Scholar
|
|
87
|
Schlaepfer IR and Joshi M: CPT1A-mediated
fat oxidation, mechanisms, and therapeutic potential.
Endocrinology. 161(bqz046)2020.PubMed/NCBI View Article : Google Scholar
|
|
88
|
Sabry MM, Dawood AF, Rashed LA, Sayed SM,
Hassan S and Younes SF: Relation between resistin, PPAR-γ, obesity
and atherosclerosis in male albino rats. Arch Physiol Biochem.
126:389–398. 2020.PubMed/NCBI View Article : Google Scholar
|
|
89
|
Zhang Y, Ma K, Song S, Elam MB, Cook GA
and Park EA: Peroxisomal proliferator-activated receptor-gamma
coactivator-1 alpha (PGC-1 alpha) enhances the thyroid hormone
induction of carnitine palmitoyltransferase I (CPT-I alpha). J Biol
Chem. 279:53963–53971. 2004.PubMed/NCBI View Article : Google Scholar
|