Introduction
Obstructive sleep apnea (OSA) is a clinical
condition characterized by complete or partial collapse of the
upper airway during sleep, resulting in reduced intrathoracic
pressure, intermittent hypoxia and sleep disturbances (1), and it is an important risk factor for
cardiovascular disease and mortality (2,3). The
prevalence of OSA is high (4),
affecting 20-30% of the general population (5), nearly 1 billion individuals worldwide
(6). Currently, the treatment for
OSA relies on lifestyle changes, ventilator therapy and surgery;
however, these treatments are either poorly adhered to by patients
or are costly, traumatic and do not change the nature of the
disease. Therefore, it is necessary to explore the mechanisms of
OSA occurrence and progression and to identify targeted
therapeutics that allow for the early prevention and treatment of
OSA.
OSA-induced apoptosis has been the focus of previous
studies and ferroptosis is a form of programmed cell death distinct
from apoptosis and necrosis, characterized by the lethal
accumulation of lipid peroxides (7,8).
When the cellular cysteine transporter is inhibited, the reduction
of intracellular glutathione can lead to the accumulation of lipid
peroxidation, which can induce cellular ferroptosis after reaching
a certain level. Previous studies have shown that iron death plays
a key role in the pathology of the development of diseases such as
myocardial infarction, stroke, cerebral ischemia, autoimmune
diseases, respiratory diseases and cancer (9). Studies have shown that the
administration of iron death inhibitors in diseased tissues reduces
the observed cell death and that control of iron death may
influence disease onset and progression (10). Therefore, exploring the role of
iron death in various diseases by data screening of iron
death-related genes is important for the prevention and treatment
of these diseases. Ferroptosis has been found to play an important
role in OSA-induced myocardial injury, liver injury and cognitive
impairment in previous studies (11-13),
suggesting that inhibition of ferroptosis is a new direction for
combating the progression of OSA. Therefore, it is important to
explore the mechanism of ferroptosis in patients with OSA and find
specific diagnostic markers related to ferroptosis for the
diagnosis and treatment of OSA.
With the rapid development of bioinformatics,
compared with time-consuming and expensive traditional experimental
studies, bioinformatics analysis can screen a large number of
potentially valuable genes faster and more accurately, and provide
exploratory predictions at a much lower cost to inform subsequent
biological experiments and clinical applications (14). Machine learning is an important
branch of bioinformatics that has significant advantages in
handling large amounts of data. Machine learning algorithms are
capable of automatically extracting valuable information from
massive data, improving prediction accuracy and real-time decision
support. In this paper, a bioinformatics approach was used to
collect data from the Gene Expression Omnibus (GEO) database to
screen for differentially expressed genes (DEGs), followed by
functional/pathway enrichment analysis, weighted gene co-expression
network analysis (WGCNA) and module analysis and genomic enrichment
analysis (GSEA). This was followed by screening of key biomarkers
using two methods of machine learning: the least absolute shrinkage
and selection operator (LASSO) and random forest (RF). In addition,
the expression levels and diagnostic value of the key differential
genes were analyzed and the expression levels of key biomarkers
were examined in mononuclear cells collected from patient blood
samples. Finally, the prediction of targeted drugs for key marker
genes and a competing endogenous (ce)RNA network analysis
identified some long non-coding (lnc)RNAs that can regulate the
disease progression of OSA. Using these data, the study aimed to
explore new potential diagnostic and therapeutic targets for
patients with OSA. The flowchart of this study design is shown in
Fig. 1.
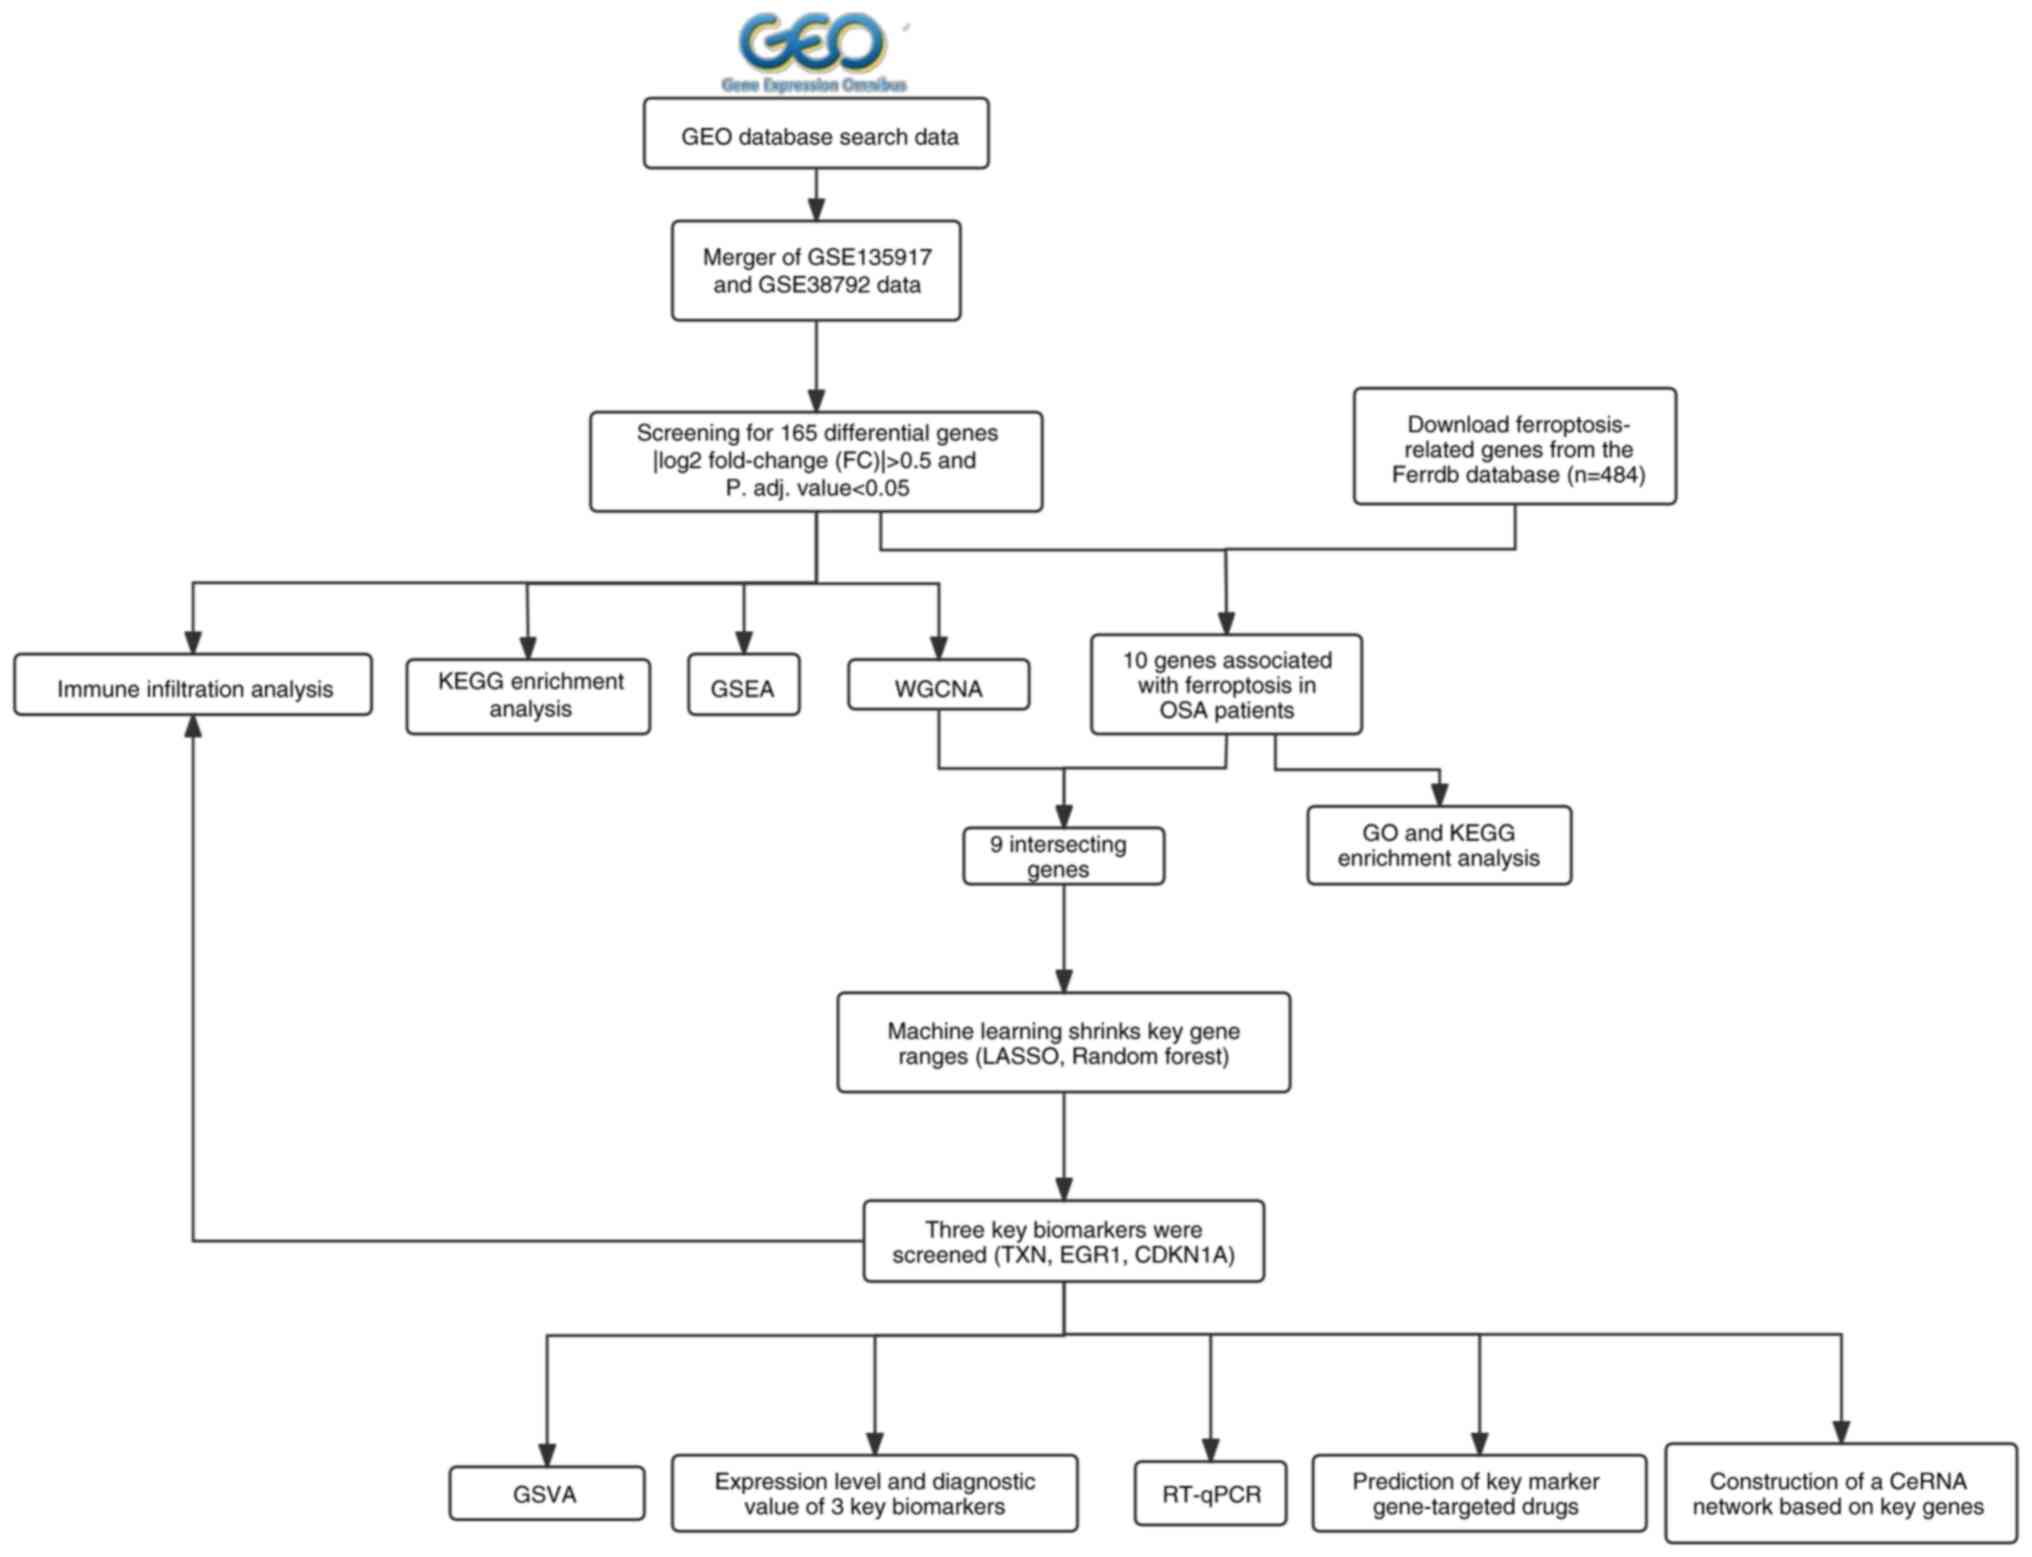 | Figure 1Study flowchart. GEO, gene expression
omnibus; WGCNA, weighted gene co-expression network analysis; DEG,
differentially expressed gene; LASSO, the least absolute shrinkage
and selection operators; adj., adjusted; KEGG, Kyoto Encyclopedia
of Genes and Genomes; GO, Gene Ontology; ceRNA, competing
endogenous RNA; RT-qPCR, reverse transcription-quantitative PCR;
GSVA, gene set variation analysis; GSEA, gene set enrichment
analysis; OSA, obstructive sleep apnea. |
Materials and methods
Data acquisition and processing
The GEO database (http://www.ncbi.nlm.nih.gov/geo/) was used to search
and download qualified expression datasets. The datasets GSE135917
(https://www.ncbi.nlm.nih.gov/geo/query/acc.cgi?acc=GSE135917)
and GSE38792 (https://www.ncbi.nlm.nih.gov/geo/query/acc.cgi?acc=GSE38792)
were used for the present study. The annotation information was
transformed into a gene expression matrix by means of a platform
file. The GSE135917 and GSE38792 data were also merged using the
‘sva’ package of the R software (version 4.2.1; https://cran.r-project.org/bin/windows/base/).
Specific information about batch effects was visualized by
principal component analysis (PCA). The gene list file for
ferroptosis-related genes downloaded from the Ferrdb v2 database
(http://www.zhounan.org/ferrdb/current/) on June 28,
2023 comprised a total of 484 genes (drivers, suppressors and
markers).
Screening for differential
expression
DEGs were identified from the merged dataset. The
‘limma’ R package was used to screen DEGs and |log2 fold change
(FC)|>0.5 and adjusted P<0.05 were selected as the cut-off
standard. The ‘ggplot2’ package was employed for creating the
volcano map to visualize these DEGs. The ‘pheatmap’ package was
used to create a heat map of DEGs and screen for expression
differences between the experimental and control groups. The genes
in the overlap between the differential genes and the
ferroptosis-related genes were considered the OSA
ferroptosis-related differential genes.
Functional and pathway enrichment
analyses
Gene Ontology (GO) terms were determined and a Kyoto
Encyclopedia of Genes and Genomes (KEGG) pathway enrichment
analysis of DEGs associated with ferroptosis was performed using
clusterProfiler. Terms were derived from KEGG pathway and GO
analyses, including functional terms in the categories molecular
function, biological process and cellular components. To select the
relevant pathways, the adjusted statistical threshold criteria of
P<0.05 were used. Finally, important signaling pathways were
further explored using the clusterProfile package and the gene set
variation analysis (GSVA) package from the R software. The gene
expression matrix of OSA was analyzed by GSEA to explore its
possible regulatory pathways. In addition, function and pathway
files containing mainly GSVA scores of the corresponding functional
pathways were obtained for each sample. The ‘limma’ package was
used to compare the GSVA scores of OSA and normal samples and the
criteria for screening differential GSVA scores were P<0.05 and
|log FC|>0.2(15).
Construction and module analysis of
WGCNA
WGCNA is a bioinformatics analysis method used to
describe gene association patterns among different samples. The
WGCNA software package in R.4.2.1 was used to perform WGCNA
analysis. The WGCNA R package was utilized to construct a
co-expression network corresponding to the clinical features of
DEGs in OSA. First, hierarchical clustering analysis was performed
using the Hclust function in R to exclude outlier samples.
Subsequently, according to the criteria of a scale-free network,
the ‘pickSoftThreshold’ function in the WGCNA software package was
utilized to select the appropriate soft power β (ranging from 1 to
20) for automatic network construction. The results were clustered
by topological overlap matrix analysis, which contains module
assignments labeled by color and module eigengene (ME). In
addition, Pearson correlation analysis was used to calculate the
correlation between ME and clinical features. Modules with R>0.3
and P<0.05 were considered significant in terms of the
interaction with clinical features.
Screening of feature genes
Disease prediction was performed using two machine
learning algorithms to identify significant key marker genes. LASSO
is an important method for regression that uses an ℓ1 penalty to
achieve a sparse solution (16).
RF is a machine learning method that provides higher accuracy,
sensitivity and specificity compared with traditional machine
learning methods such as single decision tree (17), logistic regression (18) and K-nearest neighbor (19). It can be used to predict continuous
variables and provide predictions without significant differences
(20). The ‘glmnet’ (21) and ‘randomForest’ (22) R packages were used to perform LASSO
regression and RF analysis. The intersection of the genes screened
by LASSO and the genes screened by RF were measured and the shared
genes were considered as candidate hub genes.
Candidate biomarker expression levels
and diagnostic value
The expression levels of key shared genes in the
GSE135917 dataset were detected using the ggplot2 package of R
software (P<0.05 was considered statistically different in the
OSA group compared to the control group) and the corresponding box
plots were plotted using R software. The area under the curve (AUC)
of the receiver operating characteristic (ROC) was utilized to
determine the diagnostic value of potential biomarkers in the
combined dataset using the pROC R package.
Single-sample (ss)GSEA
ssGSEA analysis was performed using the ‘GSVA’ R
package to analyze the infiltration of 28 immune cells in lesions
and normal samples. To analyze the association between immune cell
content and feature gene expression, the ‘ggplot2’ package was used
for correlation analysis and visualization. The relationship
between feature genes and differentially infiltrating immune cells
was investigated using Spearman correlation analysis. Pearson's
correlation coefficient (r)>0.6 and P<0.05 were used to
verify the correlation between the feature genes and immune
infiltrating cells.
Drug regulatory network
The Drug Gene Interaction Database (DGIdb;
https://dgidb.org/) is used to predict drugs that
interact with hub genes. An online tool called Cytoscape
(https://cytoscape.org/) was used to construct
interaction networks between potential drugs and hub genes and
visualize the results.
Constructing ceRNA networks
Three databases were used to predict miRNA target
genes, including miRanda (http://www.microrna.org/microrna/home.do), miRDB
(http://mirdb.org/) and TargetScan (http://www.targetscan.org/). LncRNA-miRNA interactions
were predicted by the spongeScan database (http://spongescan.rc.ufl.edu/). Cytoscape was used to
construct ceRNA networks.
Extraction of peripheral blood
mononuclear cells (PBMC)
Between May and June 2024, 3 OSA and 3 control
patients were recruited at the First Hospital of Hebei Medical
University (Shijiazhuang, China). All patients were male, ranging
in age from 42 to 57 years, with a median age of 49 years.
Inclusion criteria for the control group: Healthy individuals
matched with the age and sex of the study population and signed an
informed consent form. Exclusion criteria: i) Those with serious
comorbidities (for example, cardiovascular disease, severe hepatic
or renal insufficiency); ii) patients who are using drugs that may
affect the results of the study or have received related
treatments; and iii) pregnant or breastfeeding women, or patients
with psychiatric disorders who are unable to cooperate in the
study. According to the diagnostic guidelines for patients with OSA
(23)/hypopnoea syndrome (OSAHS),
the inclusion criteria were as follows: i) Adults over the age of
18; ii) patients with symptoms of OSA, such as nocturnal snoring
with apnea and daytime somnolence (24); and iii) examination showing upper
airway stenosis and obstruction, with >30 recurrent apneas and
hypopneas or a sleep apnea-hypopnea index (AHI) of ≥5 episodes/h
during a 7-h sleep cycle per night. The exclusion criteria were as
follows: i) Patients with pulmonary hypertension, bronchial asthma,
chronic obstructive pulmonary disease and other pulmonary diseases
and other sleep apnea disorders diagnosed before or during
hospitalization; ii) patients with heart disease, chronic kidney
disease, liver dysfunction or respiratory failure, mental disorders
or other systemic illnesses; iii) patients who had taken or were
taking medications affecting sleep and respiration within a short
period before the consultation; iv) patients who have taken or are
taking drugs that affect the sleep and respiratory system within a
short period before the consultation; v) patients with upper
respiratory tract infection within a short period before the
consultation; vi) patients who did not agree to sign the informed
consent form. In the present study, 10 ml whole blood samples from
each of three patients with OSA and three normal controls were
collected using anticoagulated blood tubes. The whole blood sample
and phosphate buffer were mixed in a homogeneous 1:1 ratio (by
adding 10 ml of phosphate buffer to 10 ml of whole blood sample and
mixing). Subsequently, 10 ml of lymphocyte isolate (cat. no. 10771;
Sigma-Aldrich; Merck KGaA) was added to each of six 50-ml
centrifuge tubes, followed by the gentle addition of 20 ml of whole
blood-phosphate mixture to the upper surface of the lymphocyte
isolate. The tubes were then centrifuged for 30 min (447 x g;
20˚C). Finally, carefully the turbid layer at the junction of the
middle and upper layers was collected and transfered to a new 50 ml
centrifuge tube. Finally, the cloudy layer was washed three times
with phosphate buffer, centrifuged repeatedly to precipitate the
cells and the supernatant was discarded. This study was approved by
the Ethics Committee of the First Hospital of Hebei Medical
University (Shijiazhuang, China, approval number: 2024-082Y) in May
2024, and all subjects provided written informed consent to
participate in the study. The study was conducted by the relevant
guidelines and regulations.
Reverse transcription-quantitative PCR
(RT-qPCR)
Total RNA samples were extracted from the PBMCs
using the Eastep® Super Total RNA Extraction Kit
(Promega Shanghai Ltd.), which was used accordance with the
manufacturer's instructions. The purity and concentration of total
RNA were measured using a Nanodrop 1000 (Thermo Fisher Scientific,
Inc.). Total RNA was reverse transcribed into cDNA using the
GoScript™ Reverse Transcription kit (Promega
Corporation) according to the manufacturer's protocol. qPCR was
subsequently performed using the BlazeTaq™
SYBR® Green qPCR Mix 2.0 (GeneCopoeia) (Table I). The following thermocycling
conditions were used for qPCR: 1 cycle at 95˚C for 30 sec, followed
by 40 cycles of 10 sec at 95˚C, 20 sec at 60˚C and 30 sec at 72˚C.
Relative mRNA levels were normalized to the level of GAPDH using
the 2-ΔΔCq method (25).
 | Table ISequences of primers for quantitative
PCR. |
Table I
Sequences of primers for quantitative
PCR.
| Direction | Primer sequence
(5'-3') |
|---|
| TXN | |
|
Forward |
AGACTCCAGCAGCCAAGATG |
|
Reverse |
GCAACATCATGAAAGAAAGGCT |
| EGR1 | |
|
Forward |
CCCACCATGGACAACTACCC |
|
Reverse |
AAAGACTCTGCGGTCAGGTG |
| CDKN1A | |
|
Forward |
TGCCGAAGTCAGTTCCTTGT |
|
Reverse |
CATTAGCGCATCACAGTCGC |
| GAPDH | |
|
Forward |
GGAGCGAGATCCCTCCAAAAT |
|
Reverse |
GGCTGTTGTCATACTTCTCATGG |
Statistical analysis
SPSS software version 26 (IBM Corp.) was used for
statistical analysis. The data were tested for normality using the
Shapiro-Wilk test and all data conformed to a normal distribution
(P>0.05). Therefore, independent samples t-test was used to
analyze the data. Data are expressed as mean ± SEM and the
experiment was repeated at least 3 times. P<0.05 was considered
a statistically significant difference.
Results
Screening for differential genes
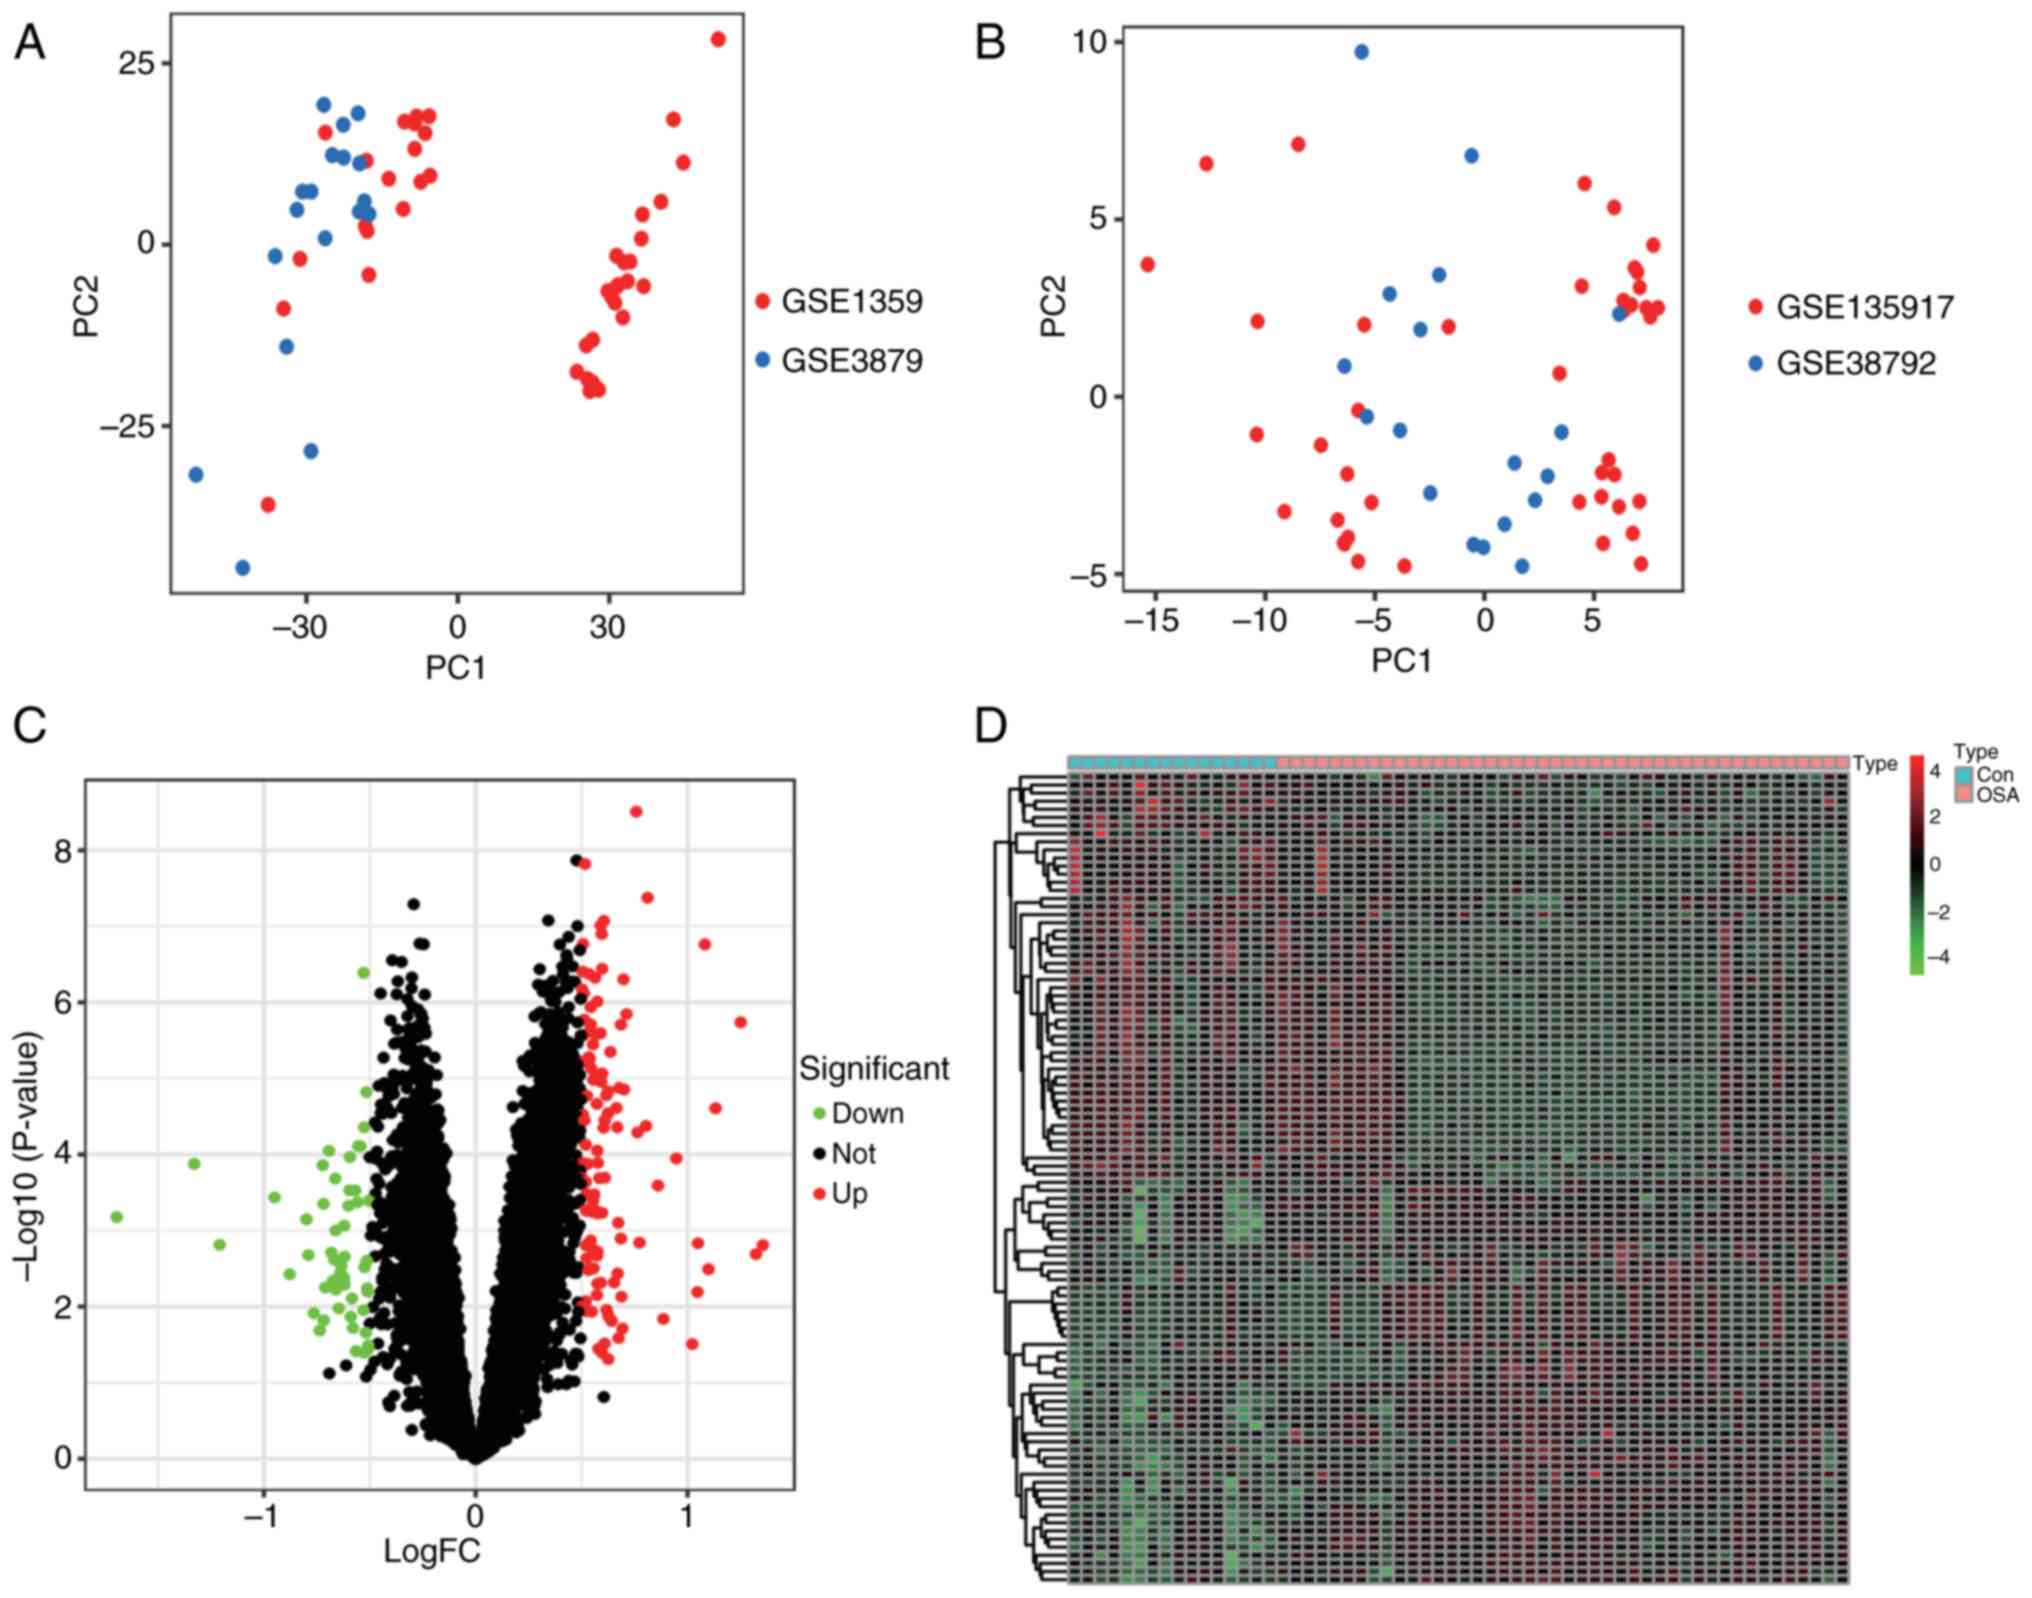
Two datasets, GSE135917 and GSE38792, were merged
into one. There was a batch effect between the different datasets
(Fig. 2A) and the normalization
eliminated the between-batch variations. The results are shown in
the PCA plots before and after normalization (Fig. 2B). After data merging and
processing, the genes were obtained after data correction and
standardization. A total of 165 DEGs (Table SI) were identified between OSA and
normal controls, and 114 upregulated genes and 51 downregulated
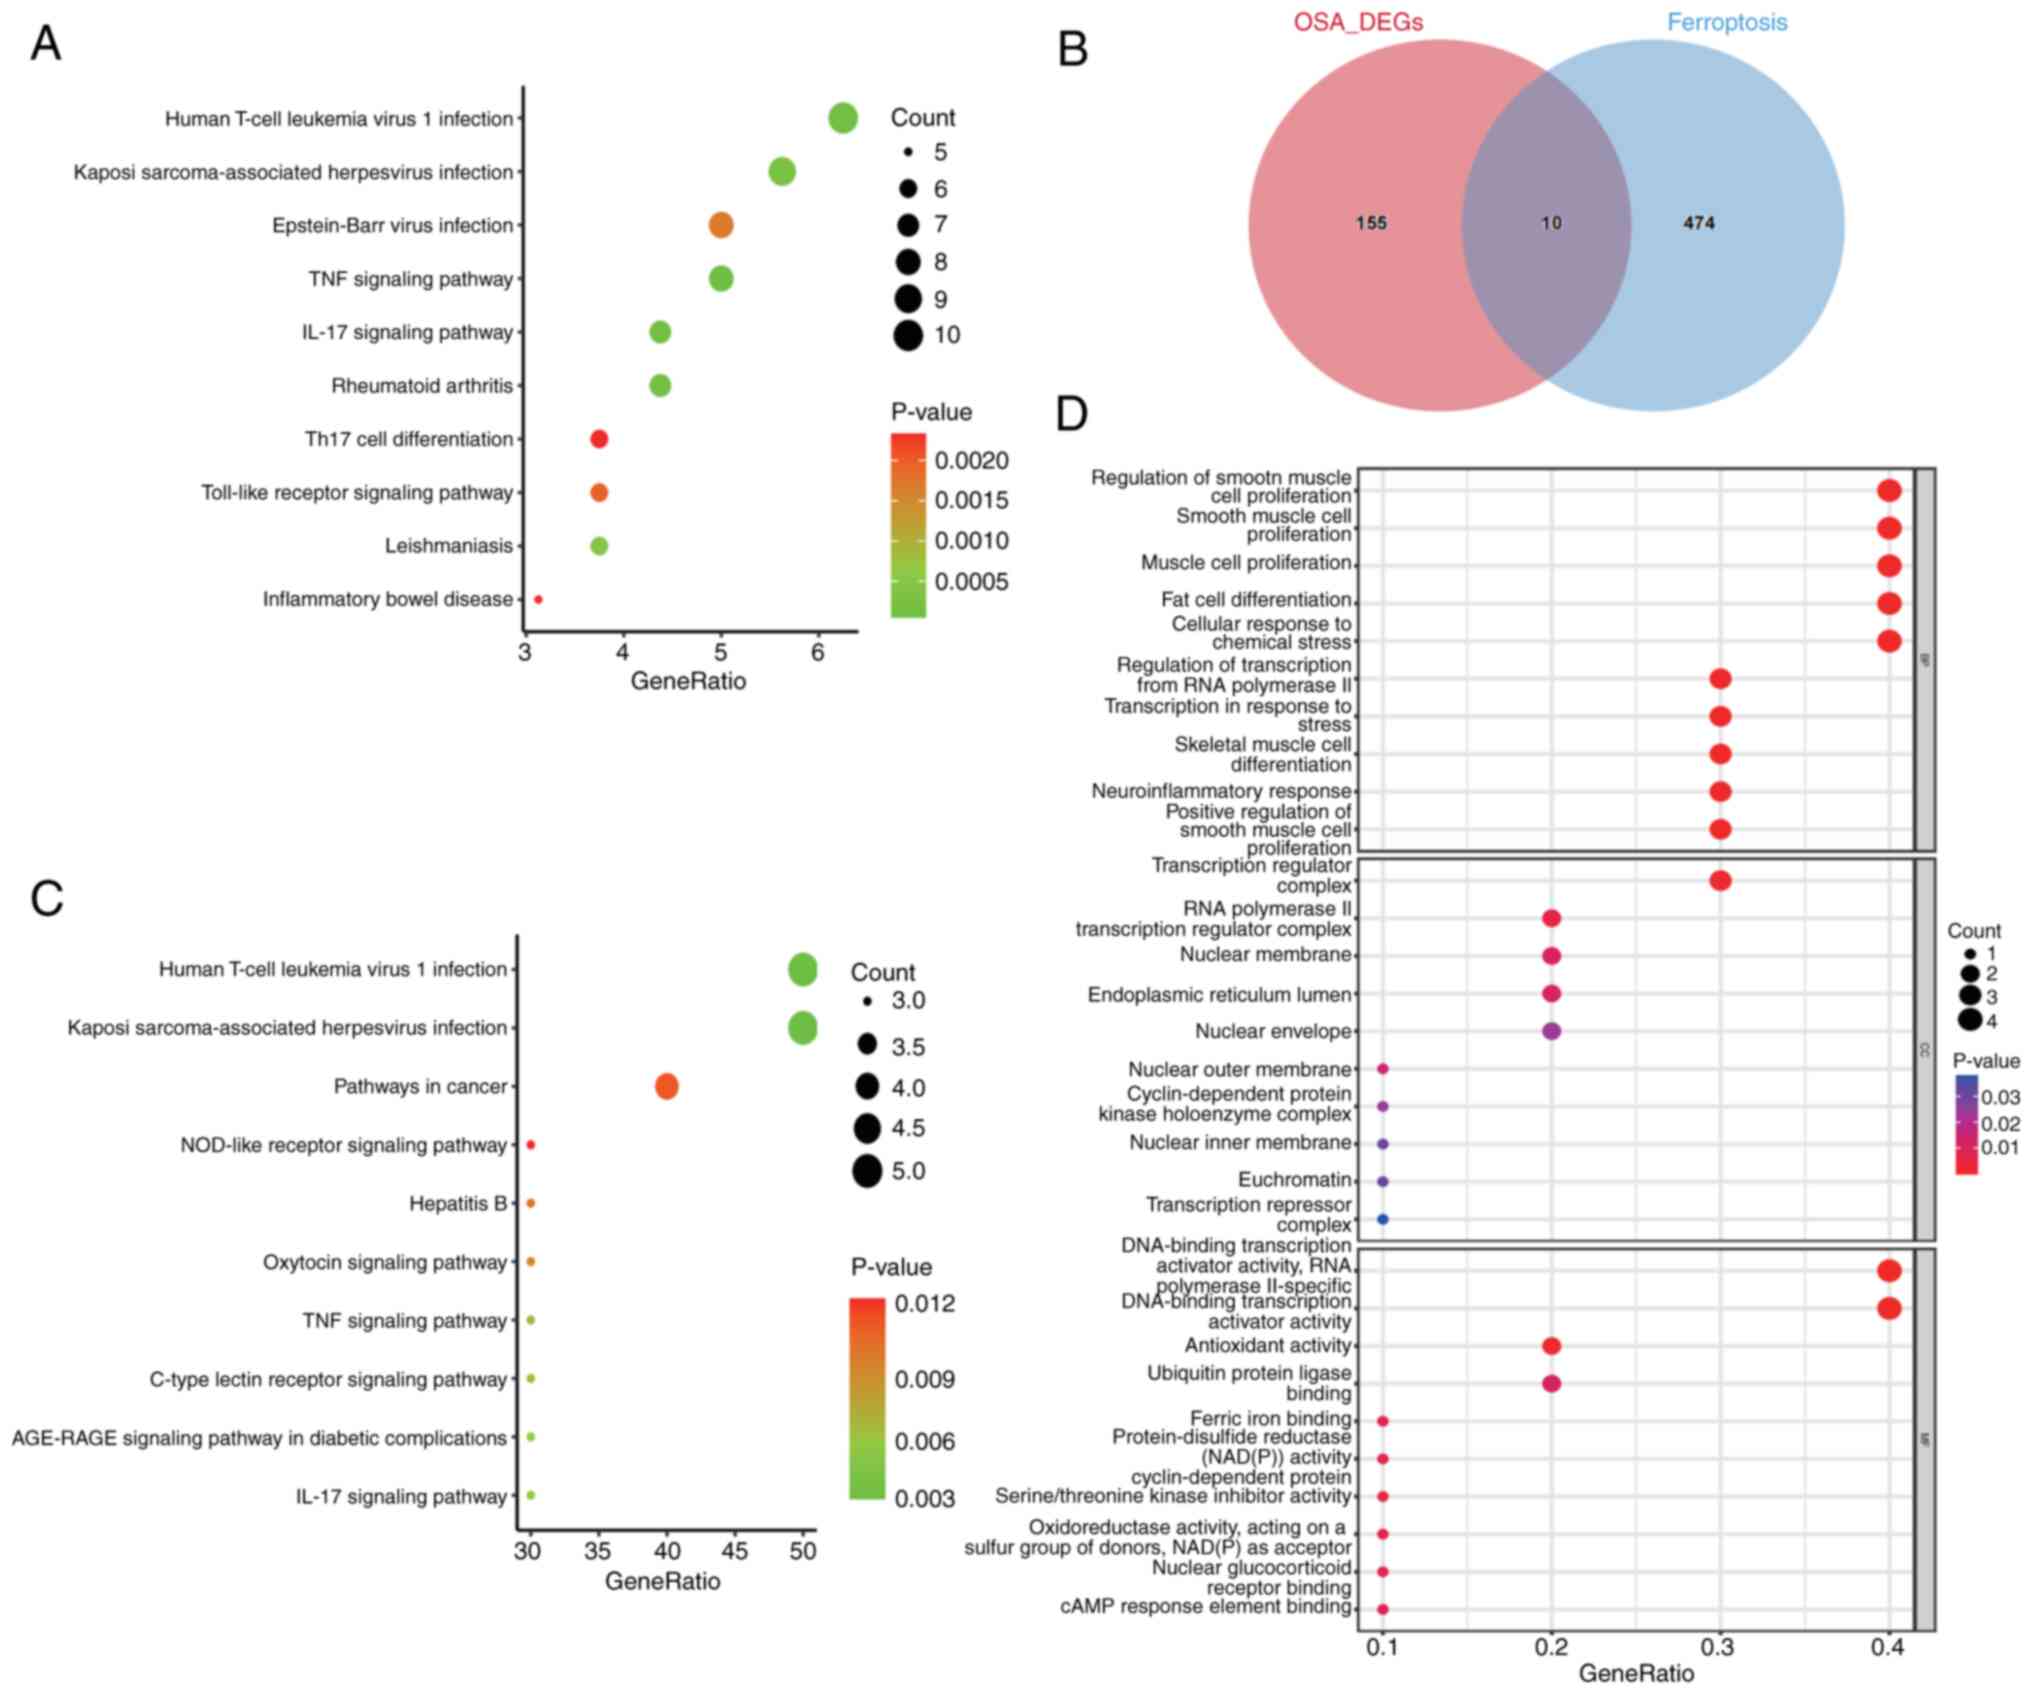
genes were shown in the volcano plot and heatmap (Fig. 2C and D). KEGG pathway enrichment analysis was
used to analyze DEGs. KEGG analysis showed that DEGs were enriched
in the metabolic pathway (Fig. 3A;
Table SII). The intersection of
484 ferroptosis-related genes and DEGs was taken to obtain OSA
ferroptosis-related DEGs, totaling 10 genes (Fig. 3B; Table SIII). KEGG and GO analyses were
performed on the intersecting DEGs, and GO analyses (Fig. 3D) revealed the involvement of a
number of notable processes, such as ‘regulation of smooth muscle
cell proliferation’ and ‘regulation of smooth muscle cell
proliferation’. Whereas the KEGG analysis (Fig. 3C; Table SIV) revealed processes mainly
involved in immune infiltration, such as ‘Human T-cell leukemia
virus 1 infection’ and ‘Kaposi sarcoma-associated herpesvirus
infection’.
Construction and module analysis of
weighted gene co-expression network (WGCNA)
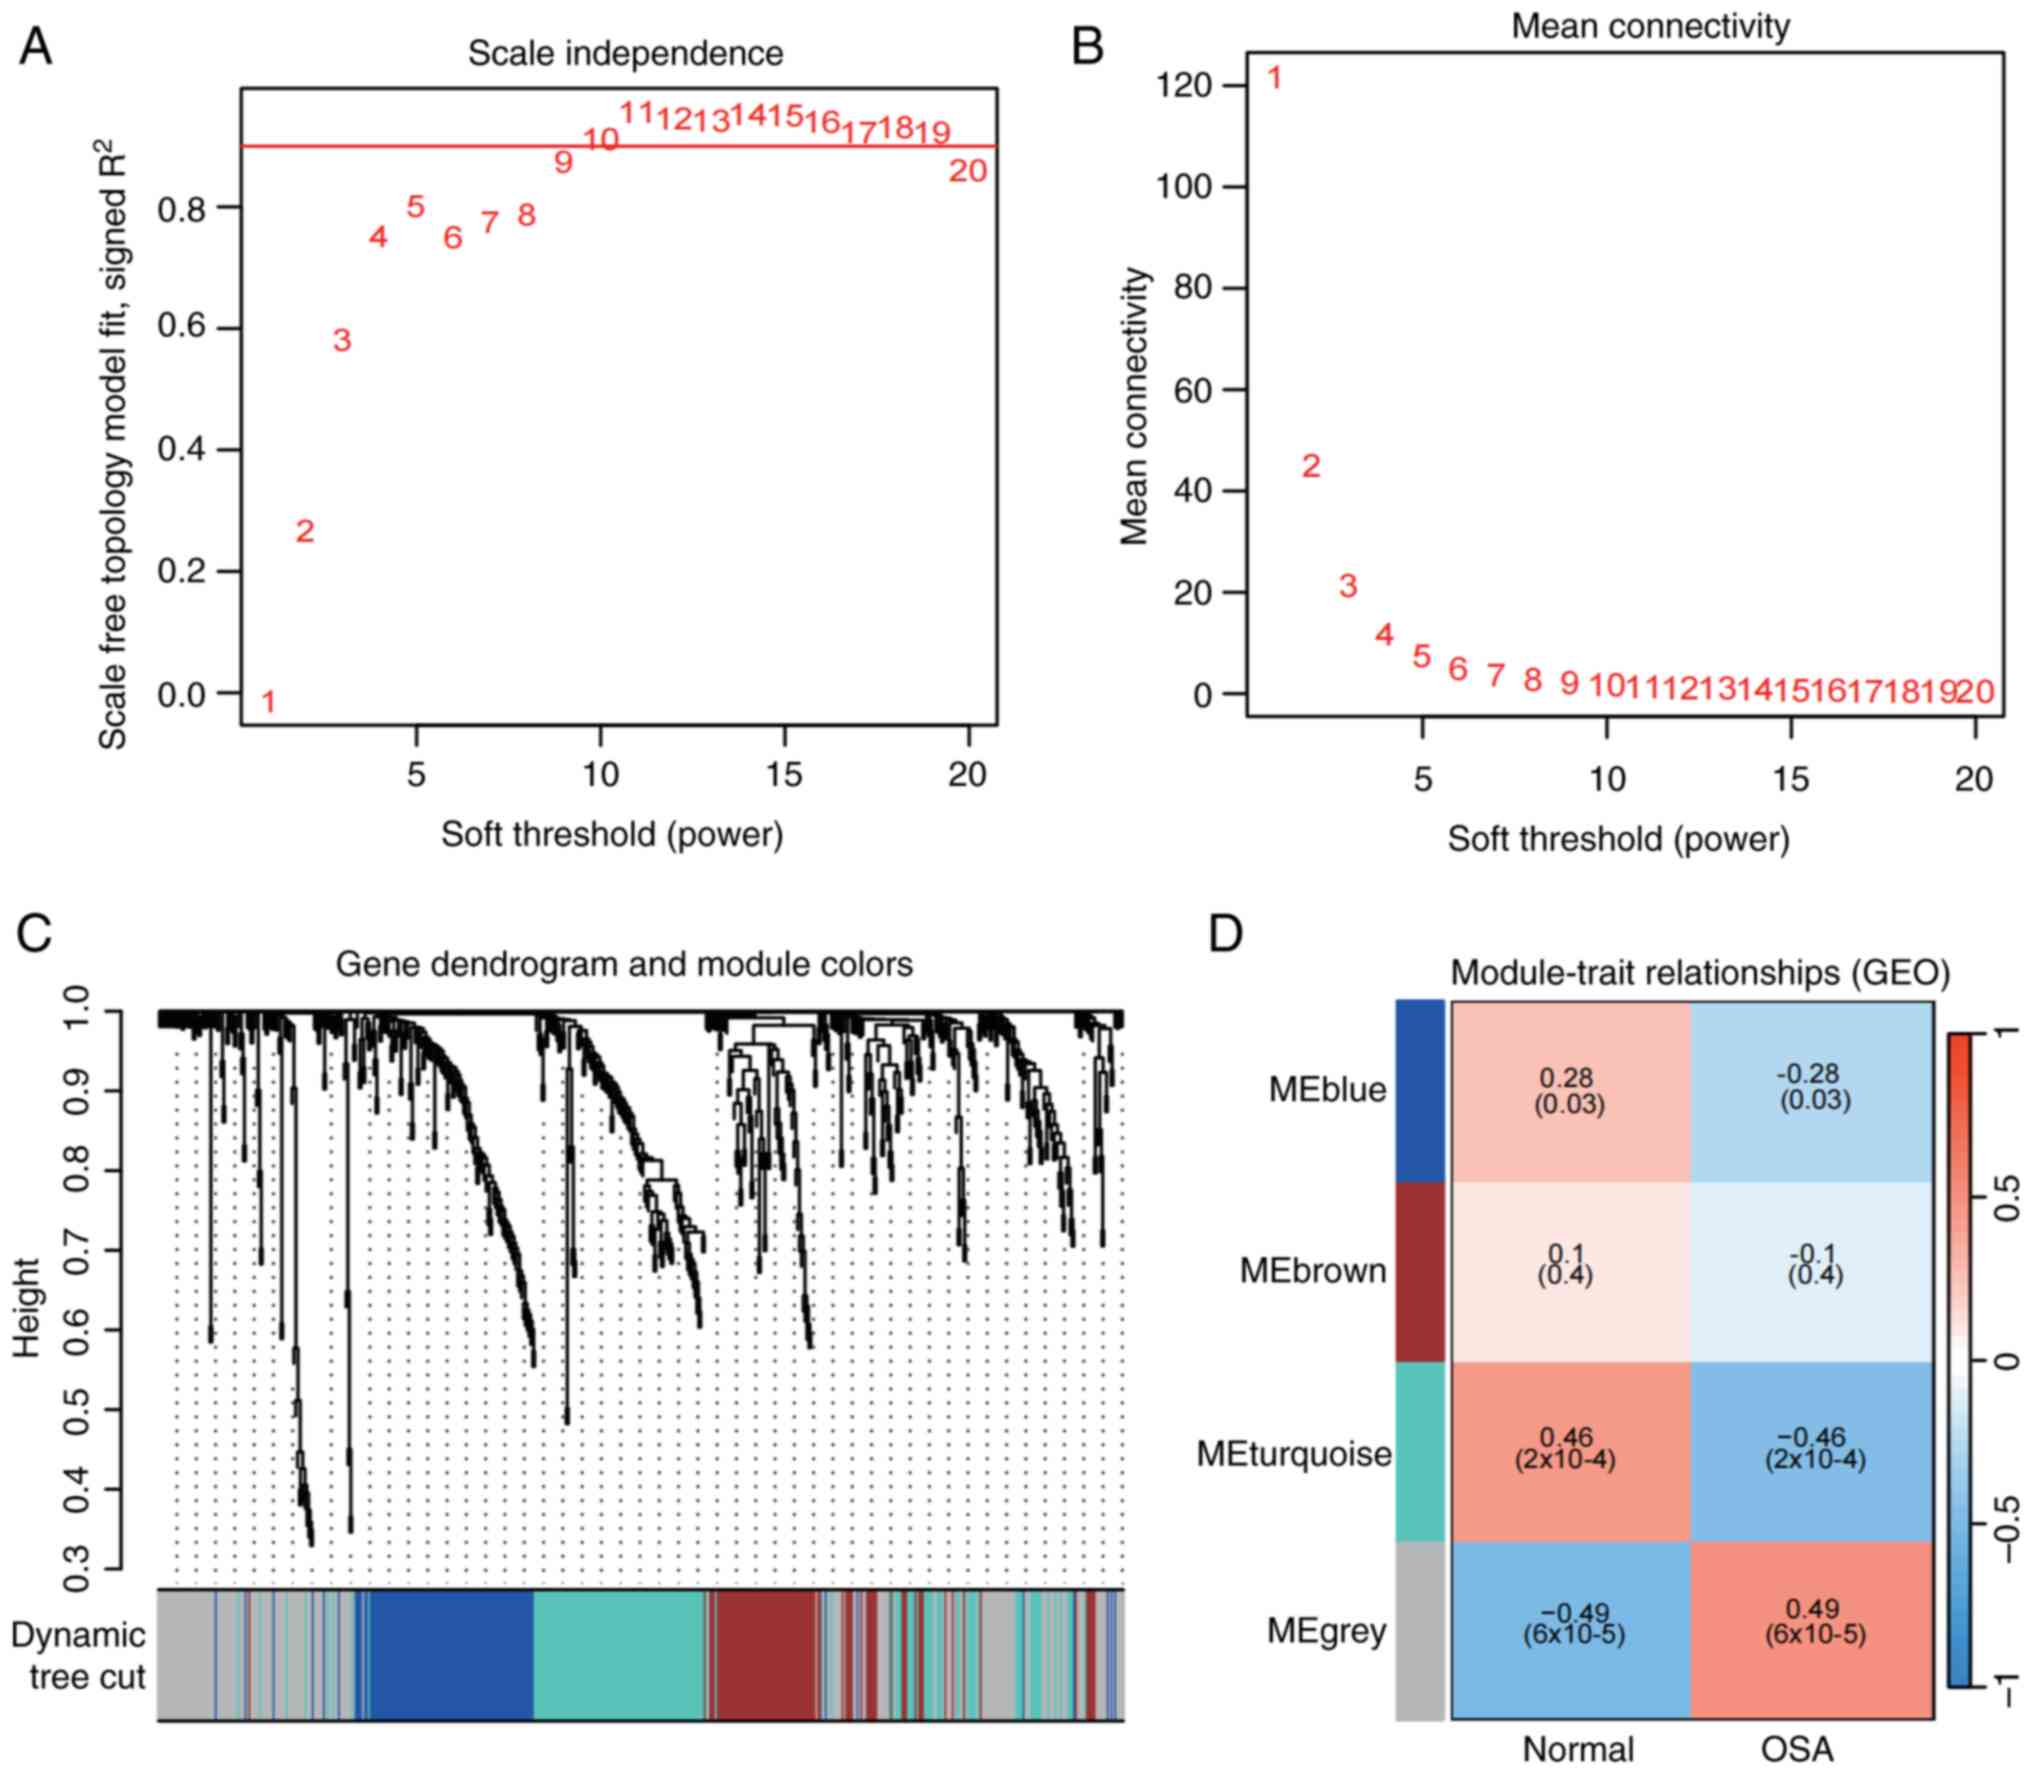
WGCNA was used to identify clusters of co-expressed
genes in OSA and to calculate the correlation between the combined
modules and disease characterization. WGCNA analysis was performed
using combined data from GSE135917 and GSE38792. Outliers were
checked by sample clustering and no samples were removed from the
combined data (Fig. S1).
According to the approximate scale-free topology criterion, β=10
was chosen to determine the soft threshold in the OSA model
(Fig. 4A and B). A hierarchical clustering tree was
further developed, with each branch representing genes with similar
expression and biological functions (Fig. 4C). After merging similar gene
modules, four modules were identified in the OSA, as shown in
Fig. 4D. Among the OSA modules,
the grey module had the strongest positive correlation with OSA
(r=0.49), and the turquoise module had the strongest negative
correlation with the occurrence of OSA (r=-0.46) (Table SV).
Identification of shared genes and
shared pathways
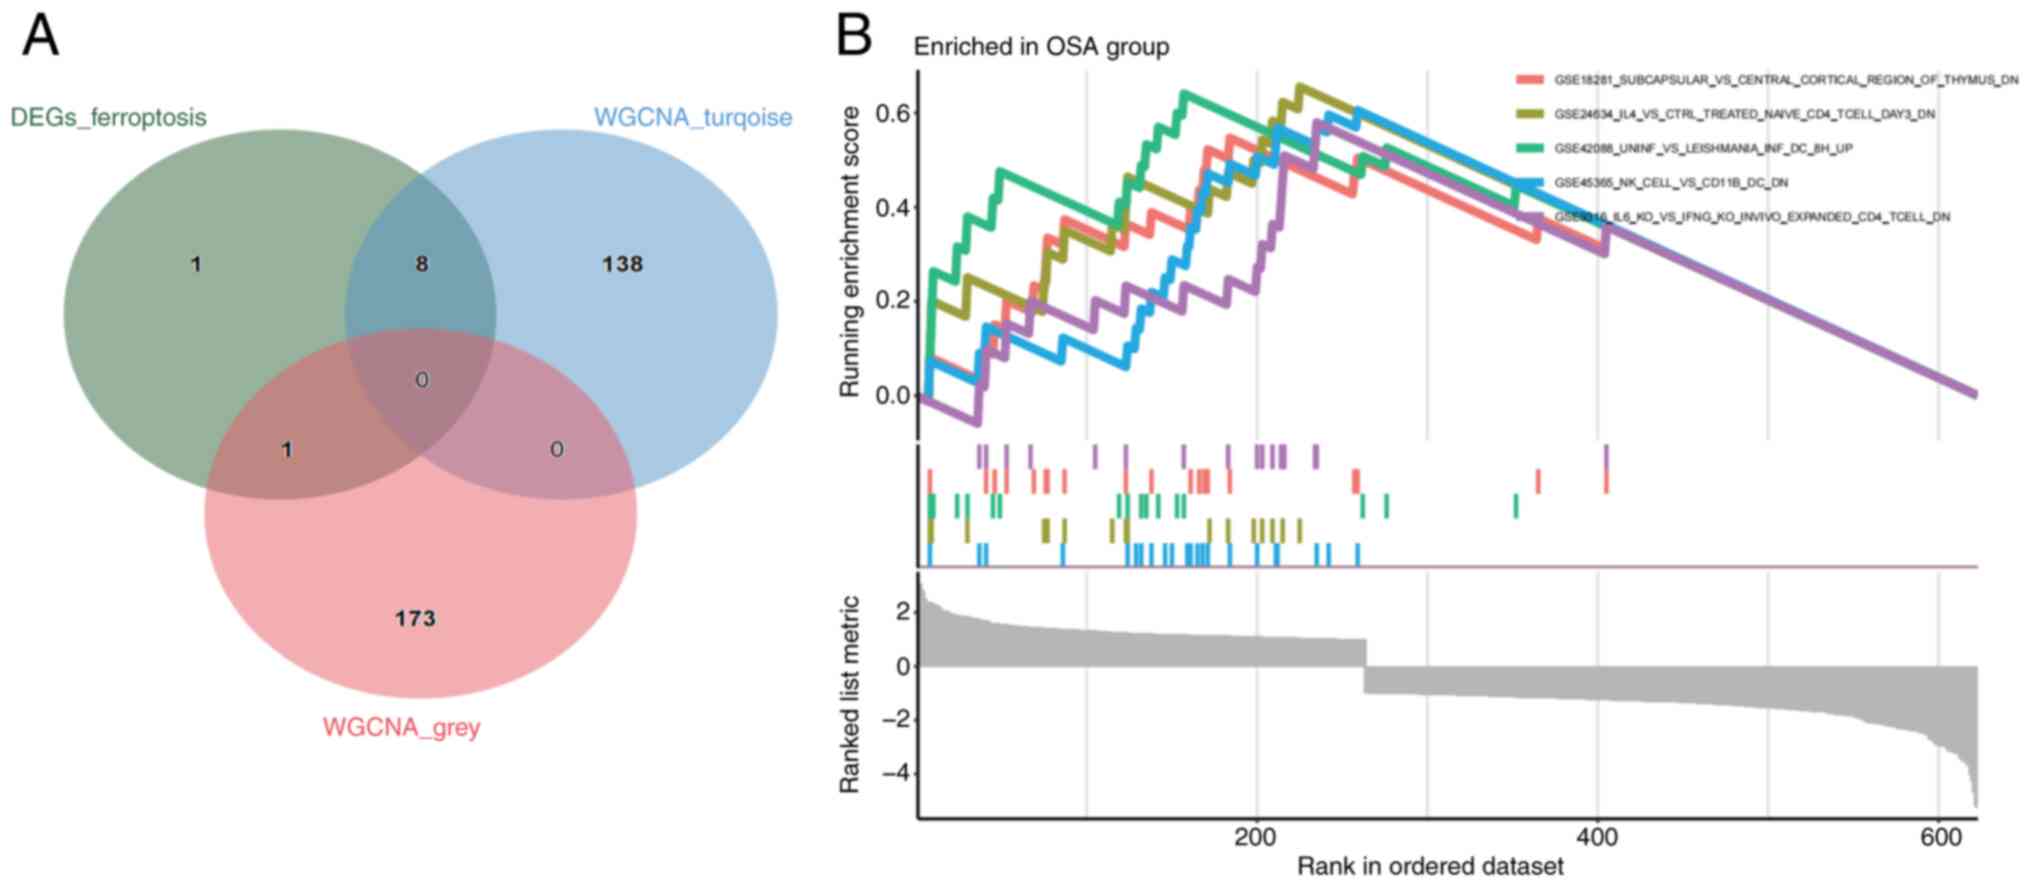
A total of nine genes overlapped in the strongest
modules of OSA ferroptosis genes and WGCNA (Fig. 5A; Table SVI) Subsequently, GSEA analysis
was performed on the OSA samples and it was found that the immune
response was involved in common pathogenic processes (Fig. 5B).
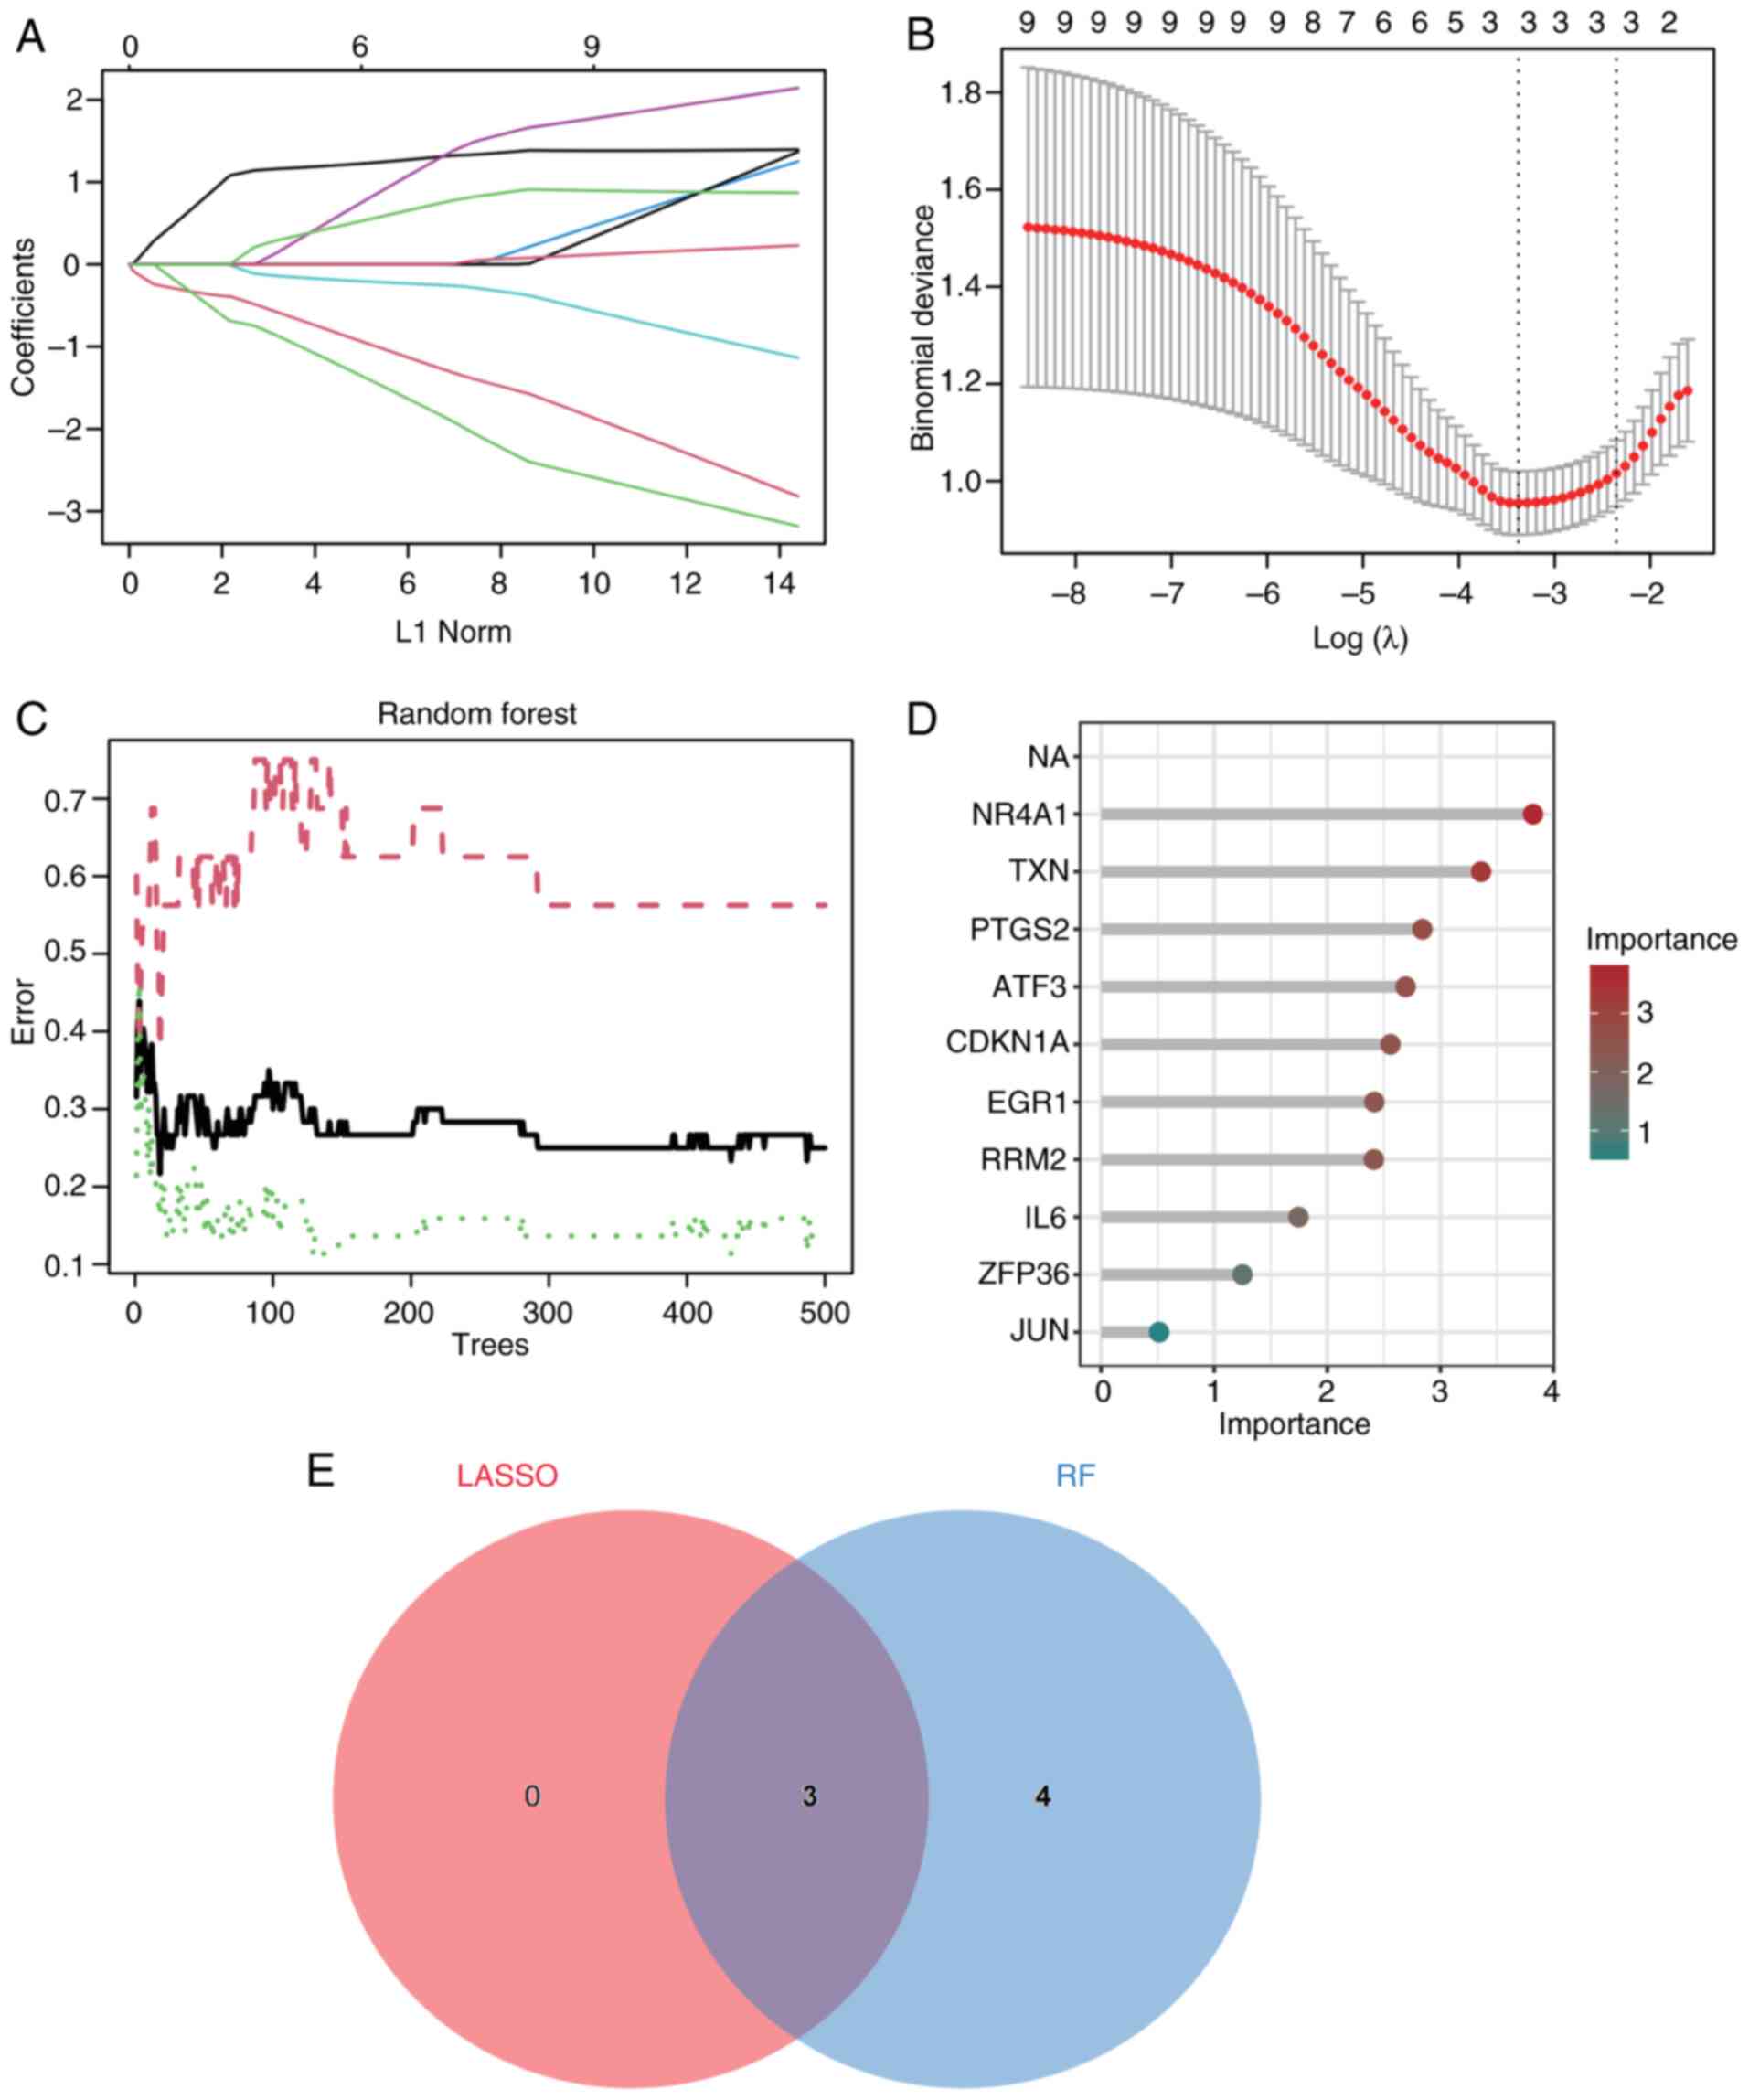
Screening of feature genes
To narrow down the potential shared diagnostic gene
biomarkers among the 9 DEGs, the LASSO (Fig. 6A and B) and RF (Fig. 6C and D) methods were used. With the help of
LASSO regression and RF, 3 key genes were mined (Fig. 6E; Table SVII), namely TXN, EGR1 and
CDKN1A.
Candidate biomarker expression levels
and diagnostic value
The expression of the three key genes was identified
in the merged dataset. Differential expression analysis showed that
TXN was significantly highly expressed in OSA (Fig. 7A), and EGR1 and CDKN1A were
significantly downregulated in OSA (Fig. 7B and C). The diagnostic ability of these three
key markers was further determined based on ROC analysis, and the
AUCs obtained for all three genes were >0.7 (Fig. 7D-F), showing relatively
satisfactory diagnostic efficiency.
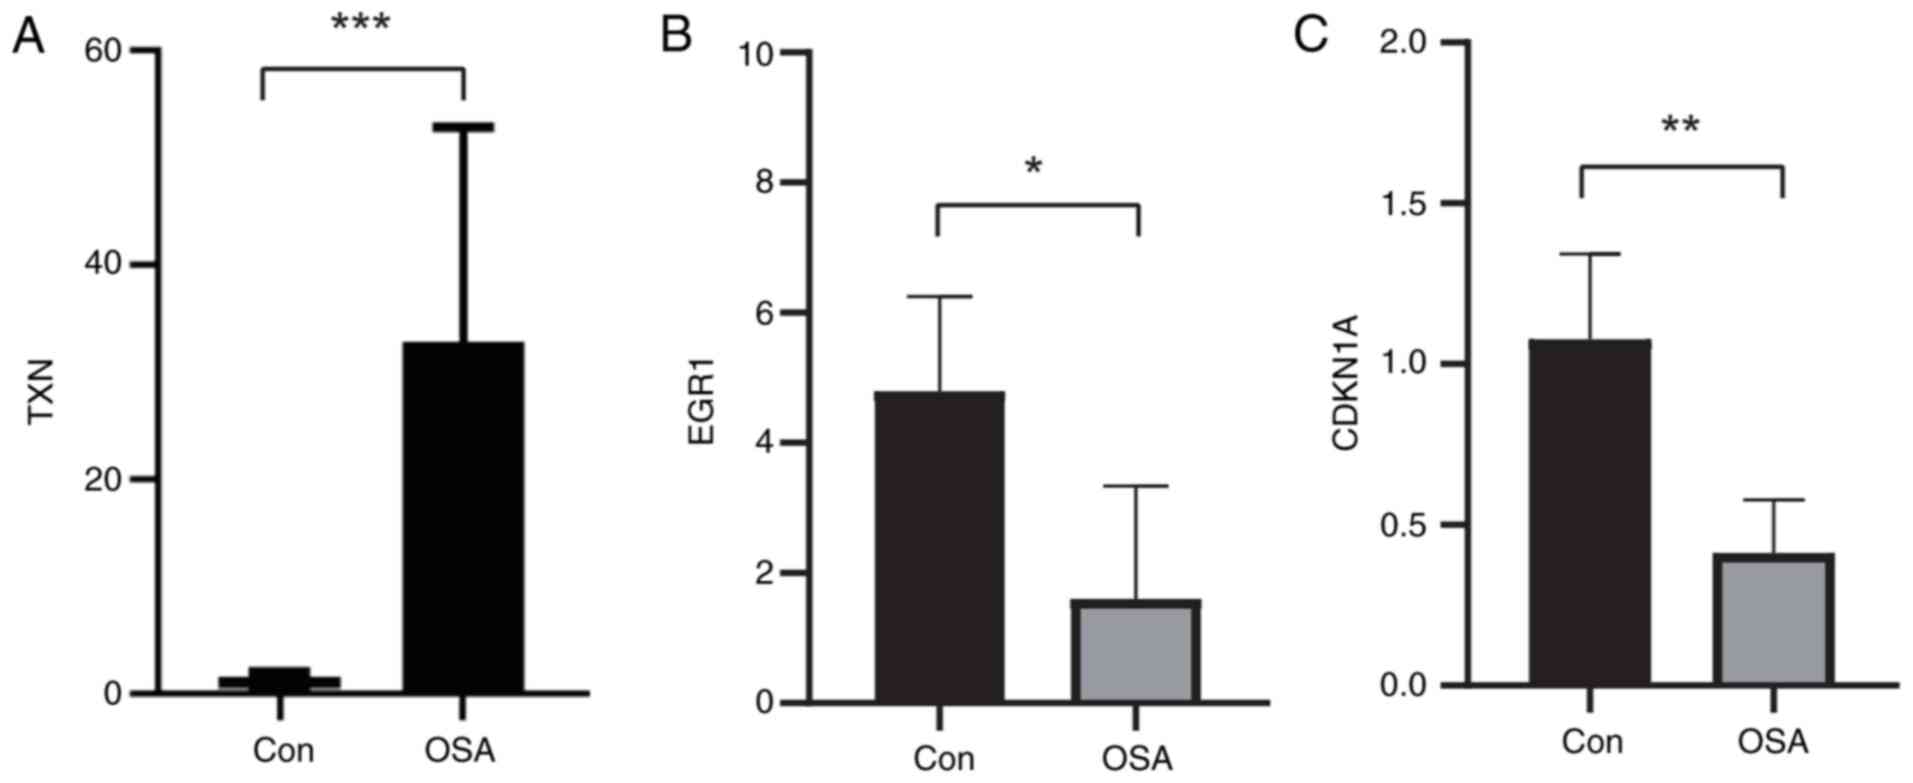
RT-qPCR
To verify the expression of the above key marker
genes, fresh whole-blood samples were collected from 6 patients (3
OSA, 3 controls), PBMCs were extracted and RT-qPCR analysis was
performed to verify the differential expression of TXN, EGR1 and
CDKN1A in the patient samples. The results showed increased TXN
expression (Fig. 8A), decreased
EGR1 expression (Fig. 8B) and
decreased CDKN1A expression (Fig.
8C) in patients with OSA compared with normal subjects,
consistent with the above analysis.
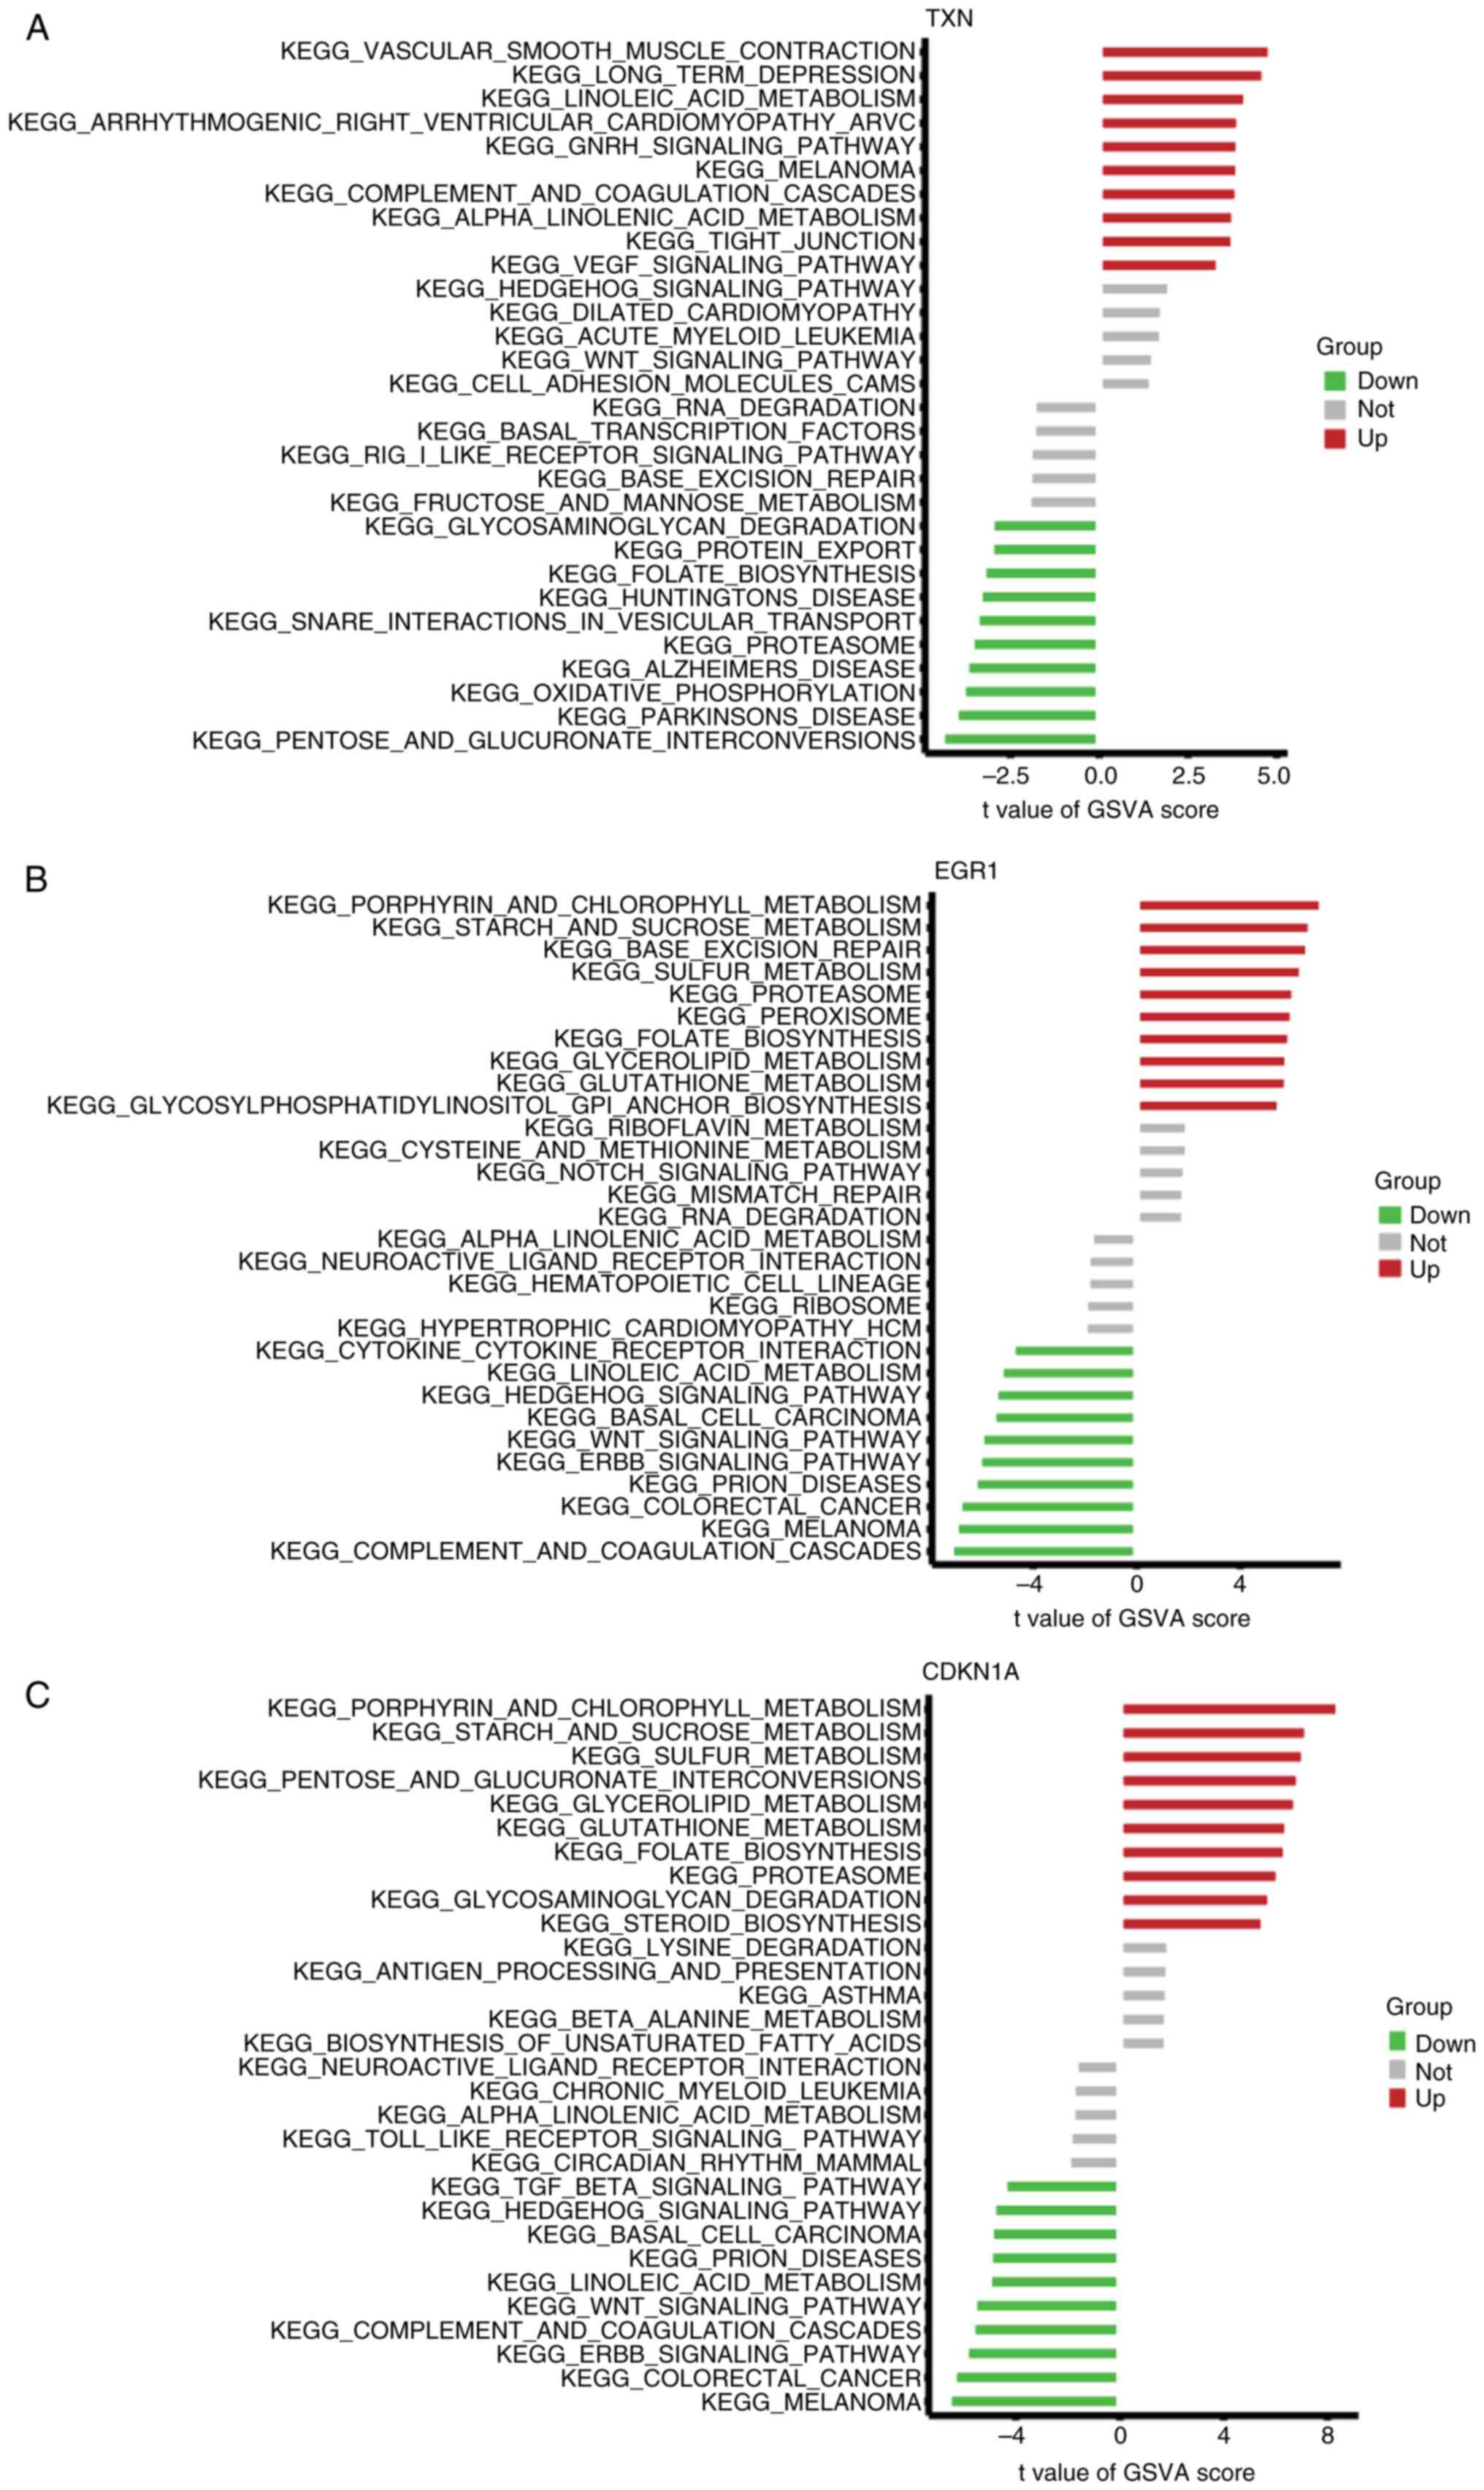
Key marker genes are closely
associated with various pathways related to ferroptosis in OSA
GSVA analysis was used to compare the activation
pathways caused by the differential expression of each marker gene.
The results indicated that elevated TXN transcript levels inhibited
glucose metabolism, whereas previous studies have shown that TXN
and linoleic and linolenic acid metabolism are closely related
(26,27), and its overexpression may induce
ferroptosis in OSA through linoleic and linolenic acid metabolism
(Fig. 9A). Upregulation of EGR1
activates glucose metabolism, inhibits lipid metabolism, suppresses
lipolytic processes leading to fat accumulation and also inhibits
complement and clotting pathways (Fig.
9B). Low expression of CDKN1A is associated with complement and
coagulation pathways, and low expression of this gene inhibits
purine and glucose metabolism (Fig.
9C). In the high expression group of these genes, a series of
OSA ferroptosis pathways relevant to pathogenesis was enriched.
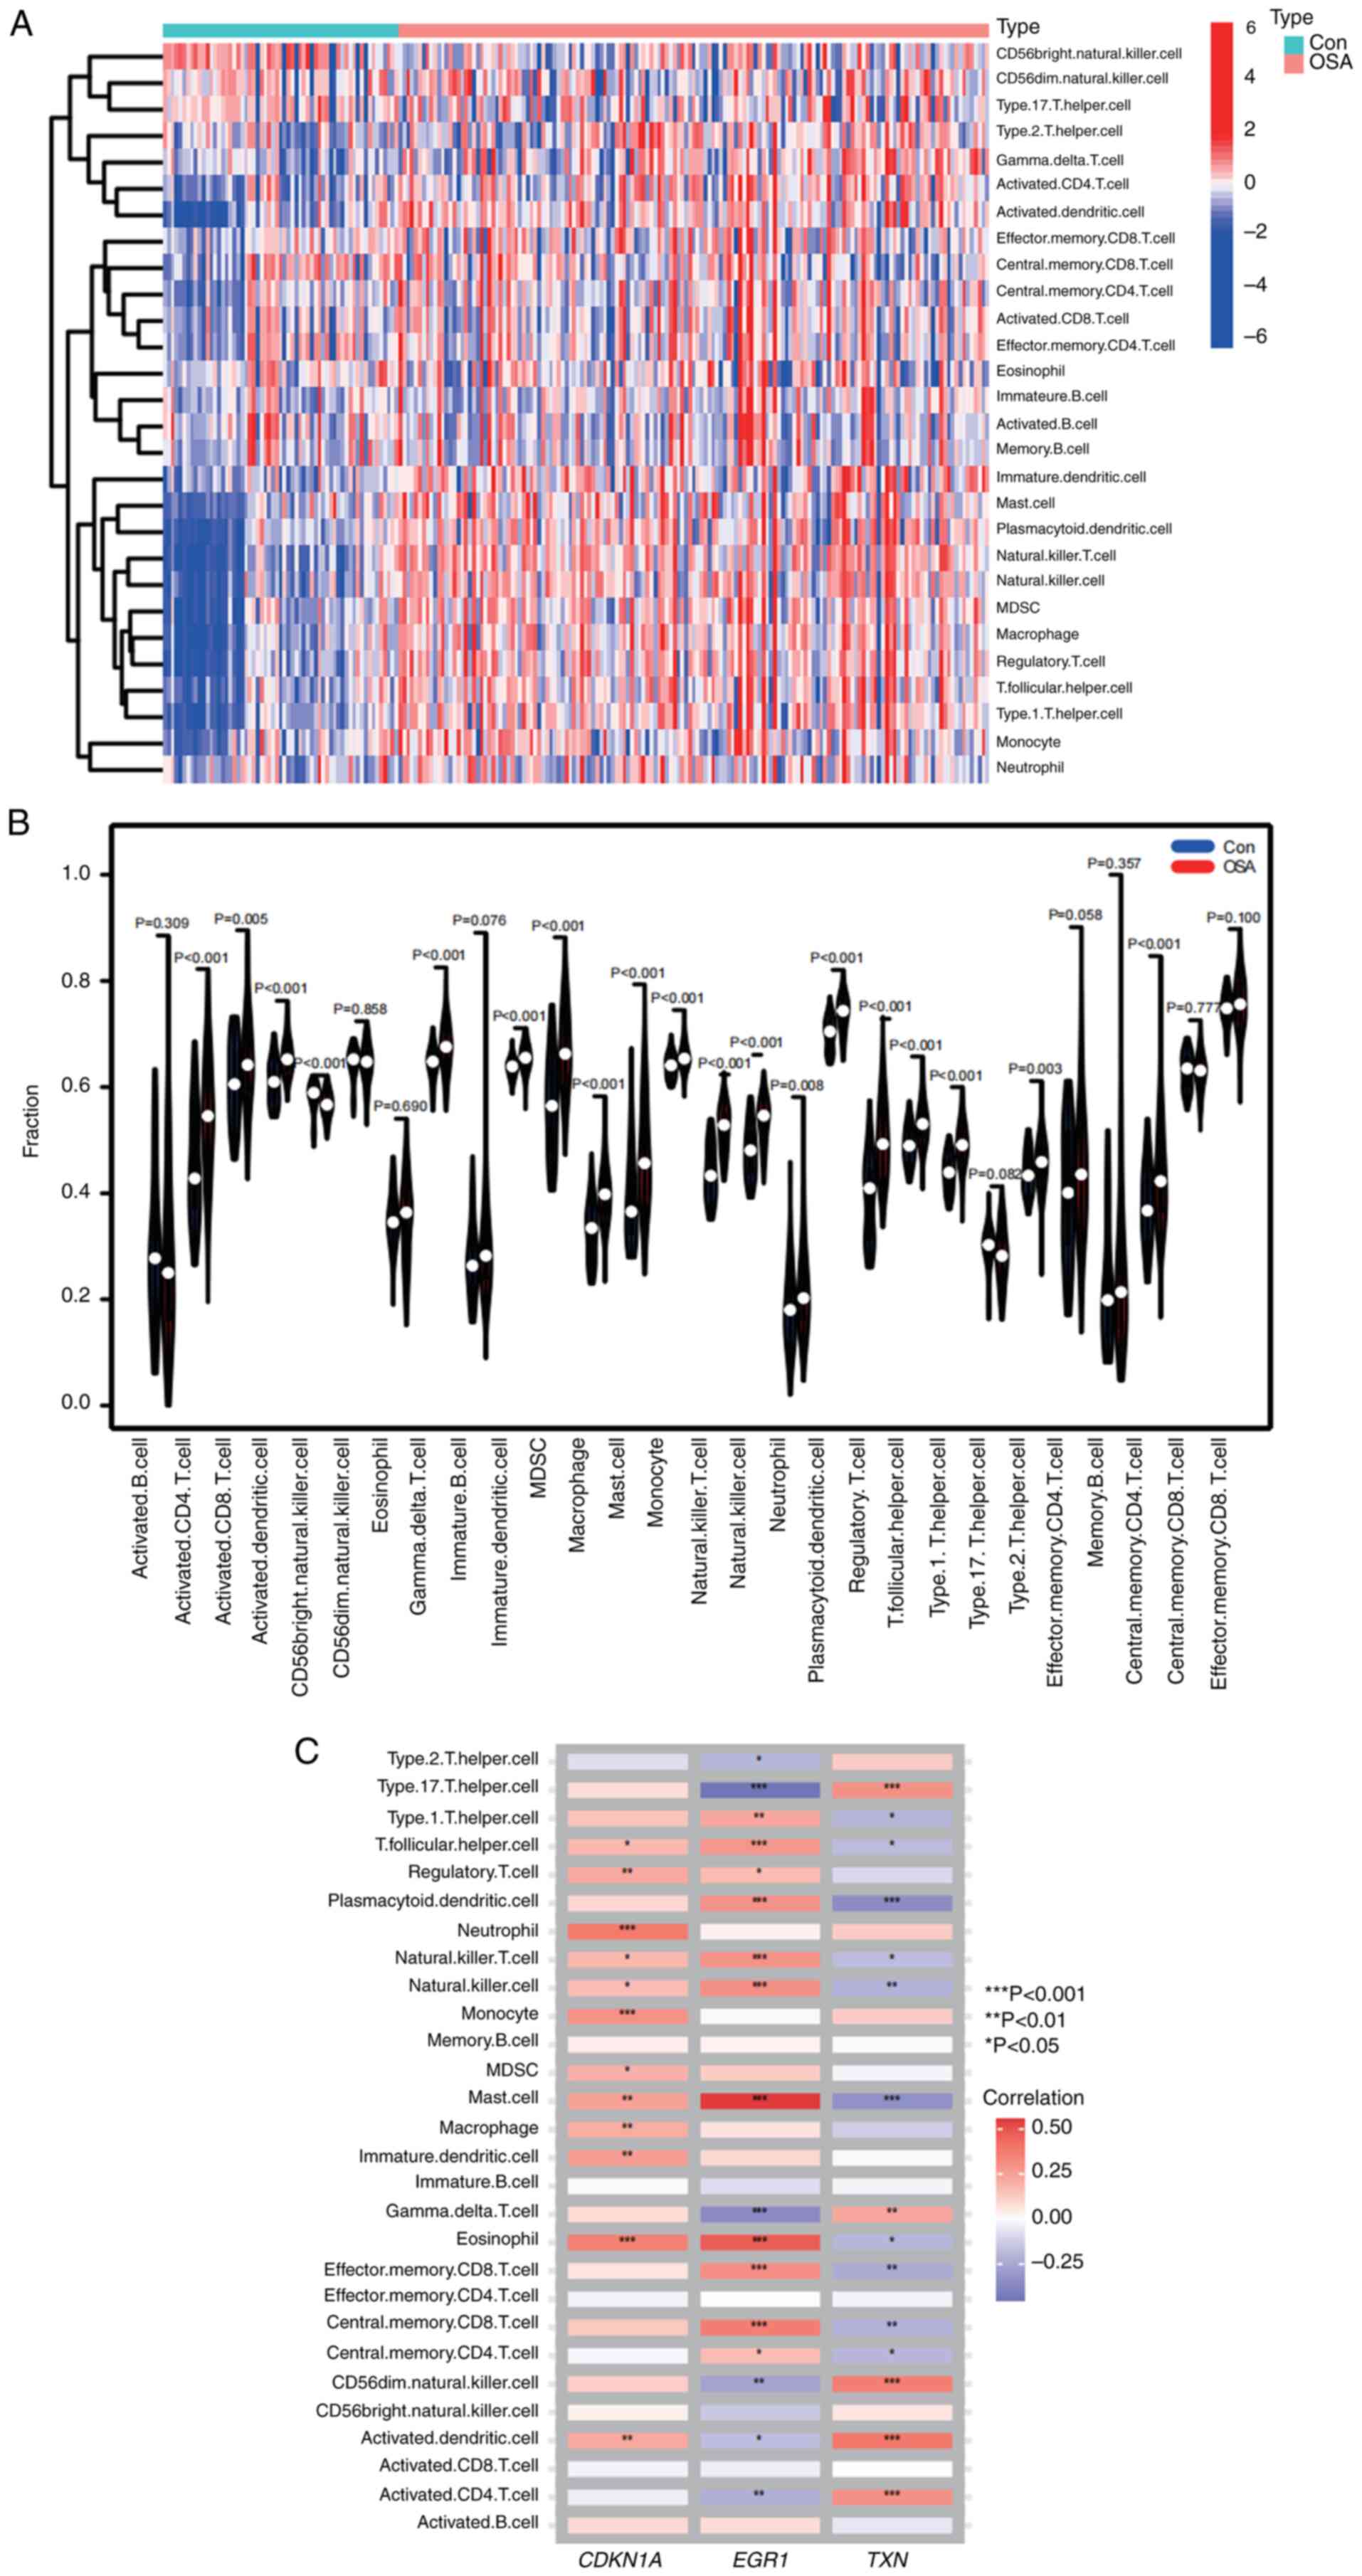
Immune cell infiltration and its
correlation with candidate biomarkers
Considering the important role of the immune
response in the development of OSA, the differences in immune cell
infiltration in the samples were further investigated. A total of
28 immune cell types were identified in the samples and are shown
in the heatmap and violin plot (Fig.
10A and B). Compared to the
healthy controls, activated CD4 T cells, activated CD8 T cells,
activated dendritic cells, CD56 bright natural killer (NK) cells,
gamma delta T cells, immature dendritic cells, myeloid-derived
suppressor cells, macrophages, mast cells, monocytes, NK T cells,
NK cells, neutrophils, plasmacytoid dendritic cells, regulatory T
cells, T follicular helper cells, type I T helper cells, effector
memory CD4 T cells, central memory CD4 T cells and 17 other immune
cell types were differentially infiltrated in patients with OSA and
were upregulated in OSA tissues. In addition, the key biomarkers
screened were closely associated with immune cells (Fig. 10C). In OSA samples, TXN expression
was significantly correlated with type 17 T helper cells,
plasmacytoid dendritic cells, mast cells, CD56 dim NK cells,
activated dendritic cells and activated CD4 T cells; EGR1
expression was significantly correlated with mast cells,
eosinophils, effector memory CD8 T cells, central memory CD8 T
cells, type 17 T helper cells, T follicular helper cells,
plasmacytoid dendritic cells, NK T cells, NK cells and gamma delta
T cells; and CDKN1A expression was significantly correlated with
neutrophils, monocytes and eosinophils.
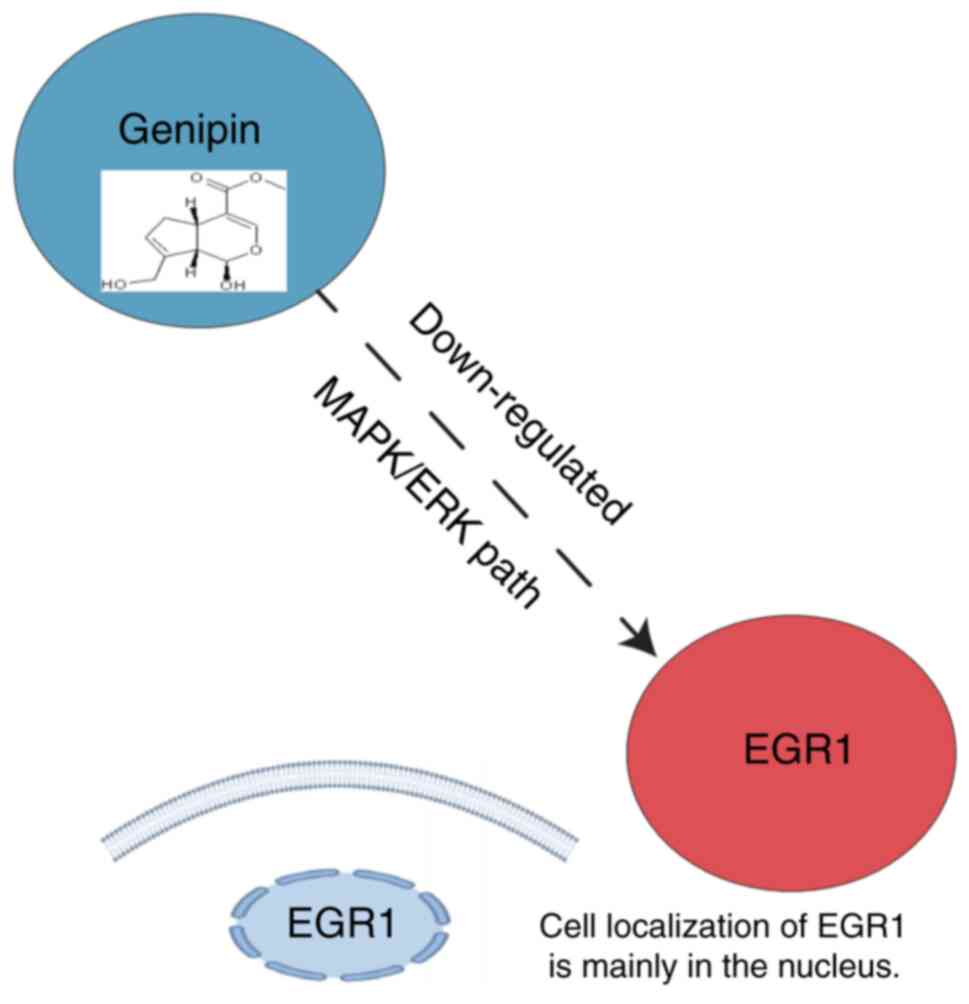
Prediction of key marker gene-targeted
drugs
Through the DGIdb database, potential
pharmacological targets were further identified. As a possible
targeted drug, Genipin was identified for EGR1 (Interaction Score,
58.98; Fig. 11).
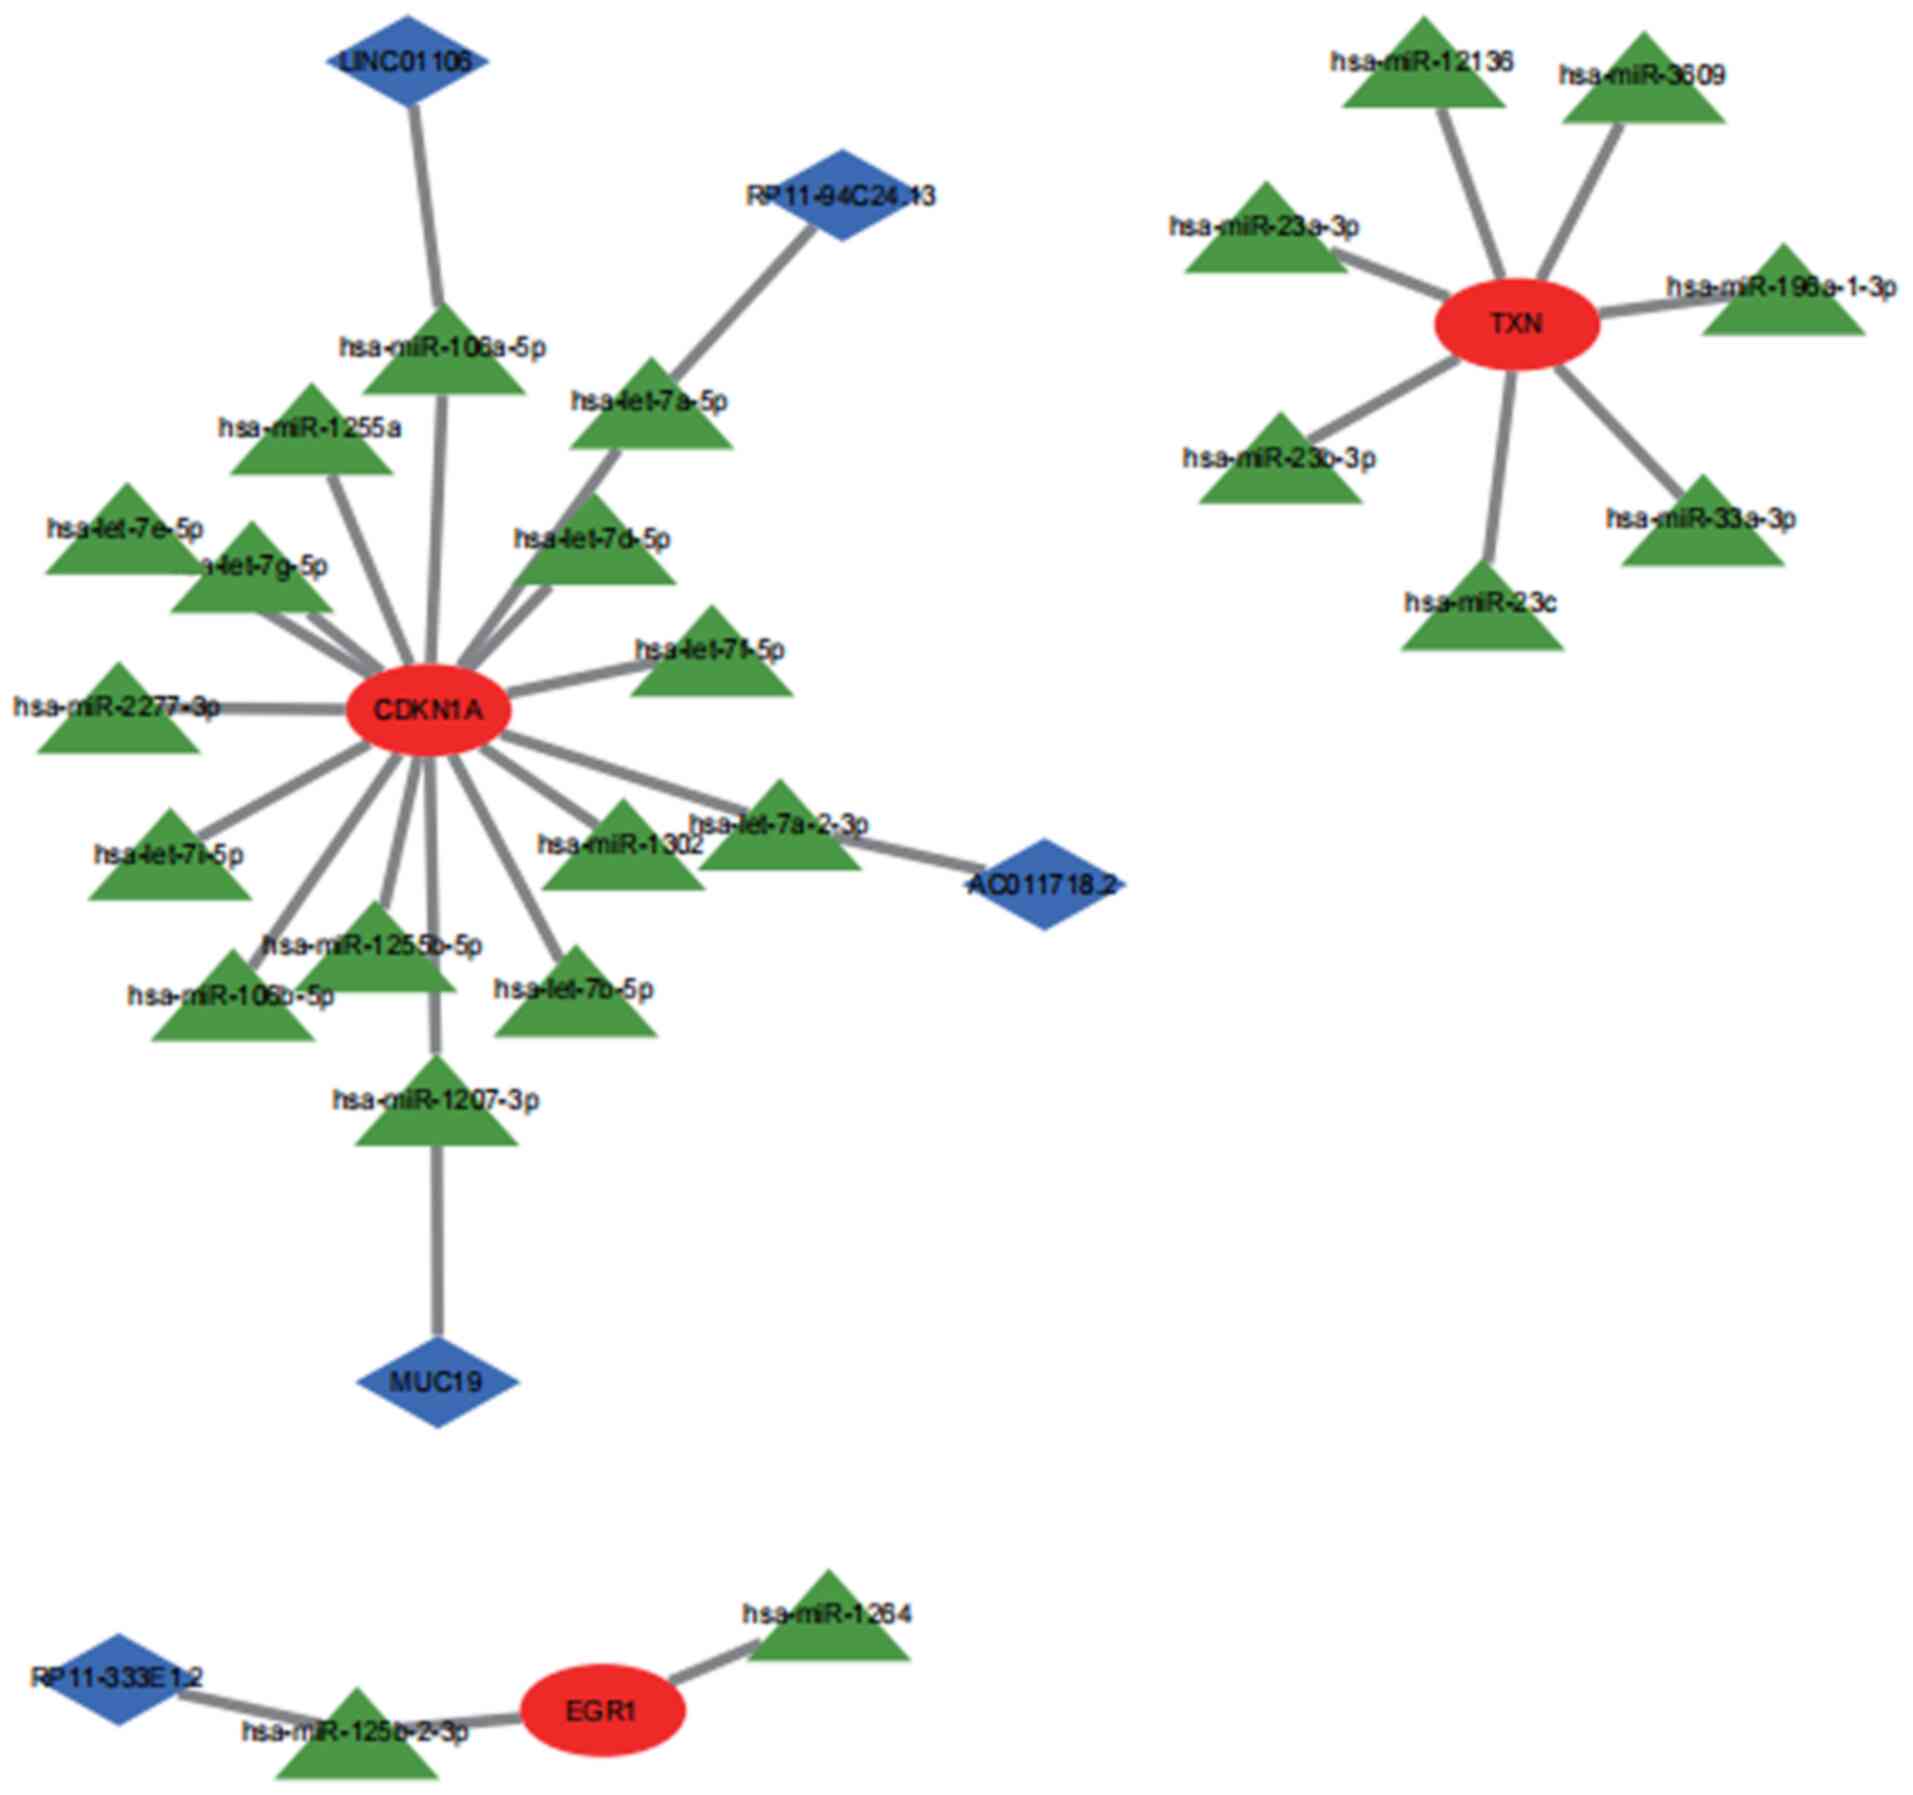
CeRNA network based on marker
genes
A ceRNA network was constructed based on three key
marker genes using the miRanda, miRDB and TargetScan databases. The
network consisted of 32 nodes (3 marker genes, 24 miRNAs and 5
lncRNAs). It was found that hsa-miR-12136, hsa-miR-196a-1-3p,
hsa-miR-23a-3p, hsa-miR-23b-3p, hsa-miR-23c, hsa-miR-33a-3p and
hsa-miR-3609 may competitively regulate TXN. Furthermore, lncRNA
(RP11-333E1.2), which can control EGR1 expression through
antagonistic binding to hsa-miR-125b-2-3p, was identified. In the
CDKN1A ceRNA network, the lncRNAs of AC011718.2, RP11-94C24.13,
LINC01106 and MUC19 could bind to hsa-let-7a-2-3p, hsa-let-7a-5p,
hsa-miR-106a-5p and hsa-miR-1207-3p, respectively, to regulate
genes (Fig. 12).
Discussion
Ferroptosis is a new hotspot of current research
exploring new biomarkers and therapeutic targets, but research on
OSA remains incomplete. In previous studies, chronic intermittent
hypoxia was shown to generate large amounts of reactive oxygen
species through repeated hypoxia-reoxygenation cycles, leading to
lipid peroxidation (28), a
central feature of ferroptosis. CIH may exacerbate lipid
peroxidation by modulating iron metabolism-related proteins (e.g.,
transferrin receptor, ferritin) to increase intracellular free iron
levels (13). CIH also imbalances
the antioxidant system, leading to glutathione depletion or reduced
glutathione peroxidase four activity, which impairs cellular
scavenging of lipid peroxidation, thereby promoting ferroptosis
(29). This suggests that OSA
disease and ferroptosis mechanisms are closely related, and the
search for key regulatory proteins related to ferroptosis in OSA is
of high significance. Three key marker genes associated with
ferroptosis in OSA were identified in the present study, which may
enhance the understanding of the relationship between ferroptosis
and OSA mechanisms. Furthermore, an immune infiltration analysis
was performed to investigate new treatment programs for OSA, which
may aid in the discovery of new therapeutic targets for OSA.
OSA is a disease whose onset and progression are not
well established, and several previous studies have shown that the
pathogenesis of OSA is closely related to hypoxia, oxidative stress
and inflammation (30,31). In the current study, 114
upregulated and 51 downregulated genes were identified by merging
and analyzing the data. KEGG pathway enrichment analysis showed
that differentially expressed ferroptosis-related genes were mainly
enriched in metabolic pathways and the PI3K/Akt pathway, while it
was found that the immune pathway was the major enriched pathway
for ferroptosis-related genes in OSA.
OSA is strongly associated with metabolic disorders
and the prevalence of OSA is high in diabetic patients, ranging
between 17 and 48% (32). CIH is a
key pathophysiologic feature of OSA and can cause most of the
pathological changes modeled in OSA. Previous studies have shown
that CIH interferes with glucose metabolism by affecting insulin
secretion and directly affecting pancreatic islet organs (33,34),
and that insulin sensitivity is decreased in adipocytes exposed to
CIH conditions (35,36). It has also been shown that
OSA-induced hypoxia increases metabolites such as lactate and
certain fatty acids in the blood (37,38).
Similarly, sleep plays an important role in regulating endocrine
function and glucose metabolism, and poor sleep quality and short
sleep duration may contribute to glucose metabolism disorders in
patients with OSA, which can increase the risk of diabetes
(39). In addition, OSA is an
independent risk factor for insulin resistance and fatty liver, may
trigger metabolic mitochondrial energy-related processes, and can
also induce inflammation and lead to dysfunction in adipose tissue,
while altering lipid metabolism and obesity (40,41).
An interesting point was found in the GSVA analysis performed in
the present study, namely that TXN may induce ferroptosis in OSA
through linoleic and linolenic acid metabolism. Previous studies
have found that TXN may antagonize the lipogenesis of peroxisome
proliferator-activated receptor (PPAR)γ in vivo, and PPARγ
plays a key role in fatty acid metabolism, which may be related to
the metabolism of linoleic acid and linolenic acid. It has been
found that TXN may regulate linolenic acid metabolism and its
physiological functions by affecting signaling pathways such as
MAPK and PI3K/Akt (27). By
contrast, lipid peroxides from linoleic acid metabolism can drive
ferroptosis (42,43). Among them, linoleic acid-rich
phospholipids (e.g., phosphatidylethanolamine) in cell membranes
are key targets of ferroptosis and their oxidation leads to
disruption of membrane integrity (44). Disorders of linoleic acid
metabolism may also be associated with ferroptosis-related
metabolic disorders (e.g., nonalcoholic fatty liver disease) and
neuronal ferroptosis in neurodegenerative diseases (e.g.,
Alzheimer's disease, Parkinson's disease) (45).
The present enrichment analysis of the differential
genes revealed a close relationship between OSA and the immune
response, and several studies have shown that an important
pathological feature of OSA is immune cell infiltration (46). Therefore, an immune cell
infiltration analysis was performed to understand the role of these
immune cells in OSA. The results suggest that T lymphocytes are the
main cells enriched in OSA; T lymphocytes are present in peripheral
blood and tissue fluids and perform cellular immunity and
immunomodulatory functions, and OSA may be associated with changes
in T-cell levels, activation and proliferation. In the study of
cellular immune response in OSA by Dyugovskaya et al
(47), cellular immune response
plays an important role in the progression of the disease course of
OSA. Cell counts of CD4 and CD8 T cells were significantly
increased in patients with OSA compared with normal controls
(48), and T-lymphocytes showed
high expression of activation and cytotoxicity. Furthermore,
Another study reported that effector CD4 T cells were upregulated
in children with a high AHI (49).
Also, CD4 and CD8 T cells isolated from the tonsils of children
with OSA had an increased ability to proliferate in vitro
(50). In addition, in OSA,
lymphocyte B, NK and NKT-like cells are equally involved in its
pathology and play a stronger role in its complications (51). Atherosclerosis is a known common
complication of OSA and NKT cells have been shown to contribute to
the development of atherosclerosis in OSA, so there may be a role
for NKT cells in atherosclerosis caused by OSA.
In this study, the key genes screened by LASSO and
the key genes screened by RF were intersected, and three common key
marker genes TXN, EGR1 and CDKN1A were obtained. Their ROC curves
were plotted separately and the AUC values of these three genes
were all >0.7, indicating that they have a certain diagnostic
significance. TXN, EGR1 and CDKN1A may be biological markers of
ferroptosis in OSA. At the same time, the present GSVA analysis of
the 3 key genes showed that metabolic pathways, including sugar and
lipid metabolism, were likewise mainly involved between groups with
high and low gene expression levels.
TXN is one of the most common markers of oxidative
stress, which is a typical feature of OSA. Previous studies have
shown that the degree of TXN expression represents the severity of
OSA (52) and may be useful in
evaluating and monitoring patients with OSA (53). TXN is also used in the clinic to
monitor the efficacy of transnasal continuous positive airway
pressure in the treatment of OSA (54). TXN levels were upregulated in
patients with OSA in the present study and may represent the
oxidative stress process involved in OSA. EGR1 was also reported to
be involved in oxidative stress and can lead to cardiac hypertrophy
(55,56). In addition, previous studies have
shown that EGR1 inhibits adipose triglyceride lipase to inhibit
lipolysis, which leads to fat accumulation (57) and promotes adipocyte
differentiation and activation (58). The present results showed decreased
EGR1 expression in patients with OSA, which may imply increased
lipolysis and disturbed lipid metabolism. CDKN1A, also known as p21
or WAF1, is one of the key molecules in cell cycle regulation. It
is involved in cell cycle arrest, DNA damage repair, cellular
senescence and apoptosis by inhibiting the activity of CDKs
(59). Previous studies have shown
that downregulating CDKN1A leads to decreased cellular repair of
DNA damage and increased genomic instability (60). In the present results, CDKN1A
expression was downregulated in patients with OSA, which may
represent a decreased ability to repair DNA damage in OSA
disease.
In addition, potential pharmacological targets were
identified through the DGIdb database and a possible target drug,
Genipin, was discovered for EGR1. Genipin has a wide range of
biological activities, including protein regulation, anti-tumor,
anti-inflammatory, immunosuppressive and anti-thrombotic (61). EGR1 is an important nuclear
transcription factor involved in regulating the cell growth and
differentiation process, modulating the expression of
immune-related genes and influencing the inflammatory response and
the function of immune cells (62). A previous study has shown that EGR1
is a key target for Genipin (63).
In the present study, it was found that EGR1 is a key gene
associated with ferroptosis in OSA, and there was a statistically
significant difference in the expression of EGR1 between OSA and
controls. EGR1 may be a target for early diagnosis and treatment of
OSA, and it may be possible to ameliorate disease damage in OSA by
targeting EGR1 with Genipin. However, at the same time, Genipin
also has certain potential side effects (64), such as a certain degree of
cytotoxicity, affecting cell viability and proliferation, and it
can cause excessive immune responses. Therefore, it is still
necessary to explore the potential avenues for the safe treatment
of OSA with Genipin in the future.
In addition, the ceRNA network centered on key
marker genes was mapped in the present study. LncRNAs regulate the
expression of 3 key marker genes by competing with mRNAs to bind
miRNAs. Wu et al (15)
proposed an lncRNA-miRNA-mRNA ceRNA network to help explore the
molecular mechanisms of lung adenocarcinoma. Wang et al
(65) treated osteoarthritis by
identifying key lncRNAs. The results of the present study suggested
that the combination of hsa-miR-12136, hsa-miR-196a-1-3p,
hsa-miR-23a-3p, hsa-miR-23b-3p, hsa-miR-23c, hsa-miR-33a-3p and
hsa-miR-3609 may competitively regulate TXN. An lncRNA can control
EGR1 expression through antagonistic binding to hsa-miR-125b-2-3p.
In the CDKN1A ceRNA network, four lncRNAs can respectively bind to
hsa-let-7a-2-3p, hsa-let-7a-5p, hsa-miR-106a-5p and hsa-miR-1207-3p
to regulate genes. This suggests that these miRNAs, which directly
regulate mRNAs, and lncRNAs, which indirectly regulate the
expression of mRNAs, may also be possible targets for the
prevention and treatment of OSA and have the potential to be
therapeutic targets for OSA.
There are certain limitations to the present study.
First, only data retrieved from the GEO database were included,
which is an insufficient sample size. Furthermore, due to the small
number of datasets available for OSA, the present analysis was not
validated by any external datasets, which may lead to one-sided
results. The present findings need to be validated in a larger
sample. More importantly, the current study lacks valid
experimental data to confirm the actual therapeutic effect between
the discovered drugs and OSA. Finally, more studies on the specific
associations between lncRNAs and miRNAs with key genes are also
needed. Therefore, it is planned to expand the sample size for
further validation and prepare experiments in our group to confirm
the therapeutic effects of the identified drugs.
In conclusion, in the present study, three key
differential genes, TXN, EGR1 and CDKN1A, were screened, which may
serve as potential biomarkers of ferroptosis in OSA. The possible
mechanisms of action of three key marker genes in OSA were explored
in a bioinformatics analysis. The results regarding the newly
discovered EGR1-targeting drug Genipin and the related lncRNAs
found in the ceRNA network constructed may provide new ideas for
the targeted treatment of OSA. In this paper, ferroptosis-related
genes in OSA were explored and their potential clinical value was
discussed to provide potential diagnostic and therapeutic targets
for OSA. These results provide a reference for further research on
the therapeutic mechanisms of OSA and the development of targets
for drug intervention. In future studies, the sample size will be
expanded and in vivo and in vitro experiments will be
combined to further investigate the reliability of the screened
biomarkers as diagnostic and therapeutic targets for OSA and to
characterize the therapeutic efficacy of related drugs.
Supplementary Material
Outliers were checked by sample
clustering and no samples were removed from the combined data. OSA,
obstructive sleep apnea.
DEGs for the merged dataset of
GSE135917 and GSE38792.
KEGG analysis results of 165
DEGs.
OSA ferroptosis-related differentially
expressed genes.
KEGG analysis results of 10 DEGs.
Strongest positive and negative
modules of the merged dataset.
Nine genes overlapped in the strongest
modules of OSA ferroptosis genes and WGCNA.
Narrowing down biomarkers using the
LASSO regression model and RF.
Acknowledgements
Not applicable.
Funding
Funding: This research was funded by the Hebei Province Natural
Science Foundation of China (grant no. H2023206407) and the
Training Program Foundation for the Talents of Clinical Medicine
sponsored by the Chinese Government (grant no. ZF2024128).
Availability of data and materials
The data generated in the present study may be
requested from the corresponding author.
Authors' contributions
BC contributed to the conception and design. BC and
LD analyzed the data. WC validated the method and data. BC wrote
the manuscript. DS edited the manuscript and provided constructive
comments. All authors read and approved the final manuscript. BC
and DS confirm the authenticity of the raw data.
Ethics approval and consent to
participate
This study was conducted in accordance with the
guidelines of the Declaration of Helsinki and was approved by the
Ethics Committee of the First Hospital of Hebei Medical University
(Shijiazhuang, China; approval no. 2024-082Y). The written informed
consent includes a description of the study, the rights of the
participants, and the storage and release of their data for the
purpose of participating in the study; all patients (including the
control group) provided written informed consent.
Patient consent for publication
Not applicable.
Competing interests
The authors declare that they have no competing
interests.
References
|
1
|
Hou H, Zhao Y, Yu W, Dong H, Xue X, Ding
J, Xing W and Wang W: Association of obstructive sleep apnea with
hypertension: A systematic review and meta-analysis. J Glob Health.
8(010405)2018.PubMed/NCBI View Article : Google Scholar
|
|
2
|
Lebkuchen A, Carvalho VM, Venturini G,
Salgueiro JS, Freitas LS, Dellavance A, Martins FC, Lorenzi-Filho
G, Cardozo KHM and Drager LF: Metabolomic and lipidomic profile in
men with obstructive sleep apnoea: Implications for diagnosis and
biomarkers of cardiovascular risk. Sci Rep. 8(11270)2018.PubMed/NCBI View Article : Google Scholar
|
|
3
|
Tripathi A, Melnik AV, Xue J, Poulsen O,
Meehan MJ, Humphrey G, Jiang L, Ackermann G, McDonald D, Zhou D, et
al: Intermittent hypoxia and hypercapnia, a hallmark of obstructive
sleep apnea, alters the gut microbiome and metabolome. mSystems.
3:e00020–18. 2018.PubMed/NCBI View Article : Google Scholar
|
|
4
|
Chiu HY, Chou KT, Su KC, Lin FC, Liu YY,
Shiao TH and Chen YM: Obstructive sleep apnea in young Asian adults
with sleep-related complaints. Sci Rep. 12(20582)2022.PubMed/NCBI View Article : Google Scholar
|
|
5
|
Heinzer R, Vat S, Marques-Vidal P,
Marti-Soler H, Andries D, Tobback N, Mooser V, Preisig M, Malhotra
A, Waeber G, et al: Prevalence of sleep-disordered breathing in the
general population: The HypnoLaus study. Lancet Respir Med.
3:310–318. 2015.PubMed/NCBI View Article : Google Scholar
|
|
6
|
Benjafield AV, Ayas NT, Eastwood PR,
Heinzer R, Ip MSM, Morrell MJ, Nunez CM, Patel SR, Penzel T, Pépin
JL, et al: Estimation of the global prevalence and burden of
obstructive sleep apnoea: A literature-based analysis. Lancet
Respir Med. 7:687–698. 2019.PubMed/NCBI View Article : Google Scholar
|
|
7
|
Dixon SJ, Lemberg KM, Lamprecht MR, Skouta
R, Zaitsev EM, Gleason CE, Patel DN, Bauer AJ, Cantley AM, Yang WS,
et al: Ferroptosis: An iron-dependent form of nonapoptotic cell
death. Cell. 149:1060–1072. 2012.PubMed/NCBI View Article : Google Scholar
|
|
8
|
Tang D, Kang R, Berghe TV, Vandenabeele P
and Kroemer G: The molecular machinery of regulated cell death.
Cell Res. 29:347–364. 2019.PubMed/NCBI View Article : Google Scholar
|
|
9
|
Zhang JJ, Du J, Kong N, Zhang GY, Liu MZ
and Liu C: Mechanisms and pharmacological applications of
ferroptosis: A narrative review. Ann Transl Med.
9(1503)2021.PubMed/NCBI View Article : Google Scholar
|
|
10
|
He P, Xu S, Miao Z, Que Y, Chen Y, Li S,
Ma Q, Yang R, Wei W, Zha Z and Hu Y: Anti-Her2 affibody-decorated
arsenene nanosheets induce ferroptosis through depleting
intracellular GSH to overcome cisplatin resistance. J
Nanobiotechnology. 21(203)2023.PubMed/NCBI View Article : Google Scholar
|
|
11
|
Huang J, Xie H, Yang Y, Chen L, Lin T,
Wang B and Lin QC: The role of ferroptosis and endoplasmic
reticulum stress in intermittent hypoxia-induced myocardial injury.
Sleep Breath. 27:1005–1011. 2023.PubMed/NCBI View Article : Google Scholar
|
|
12
|
Zhang L, Guo Y, Xiaokereti J, Cao G, Li H,
Sun H, Li K, Zhou X and Tang B: Ganglionated plexi ablation
suppresses chronic obstructive sleep apnea-related atrial
fibrillation by inhibiting cardiac autonomic hyperactivation. Front
Physiol. 12(640295)2021.PubMed/NCBI View Article : Google Scholar
|
|
13
|
Liu ZL, Huang YP, Wang X, He YX, Li J and
Li B: The role of ferroptosis in chronic intermittent
hypoxia-induced cognitive impairment. Sleep Breath. 27:1725–1732.
2023.PubMed/NCBI View Article : Google Scholar
|
|
14
|
Uesaka K, Oka H, Kato R, Kanie K, Kojima
T, Tsugawa H, Toda Y and Horinouchi T: Bioinformatics in bioscience
and bioengineering: Recent advances, applications, and
perspectives. J Biosci Bioeng. 134:363–373. 2022.PubMed/NCBI View Article : Google Scholar
|
|
15
|
Wu X, Sui Z, Zhang H, Wang Y and Yu Z:
Integrated analysis of lncRNA-mediated ceRNA network in lung
adenocarcinoma. Front Oncol. 10(554759)2020.PubMed/NCBI View Article : Google Scholar
|
|
16
|
Friedman J, Hastie T and Tibshirani R:
Regularization paths for generalized linear models via coordinate
descent. J Stat Softw. 33:1–22. 2010.PubMed/NCBI
|
|
17
|
Dall'Alba G, Casa PL, Abreu FP, Notari DL
and de Avila E Silva S: A survey of biological data in a big data
perspective. Big Data. 10:279–297. 2022.PubMed/NCBI View Article : Google Scholar
|
|
18
|
Dey D, Haque MS, Islam MM, Aishi UI,
Shammy SS, Mayen MSA, Noor STA and Uddin MJ: The proper application
of logistic regression model in complex survey data: A systematic
review. BMC Med Res Methodol. 25(15)2025.PubMed/NCBI View Article : Google Scholar
|
|
19
|
Ma X, Han X and Zhang L: An improved
k-nearest neighbor algorithm for recognition and classification of
thyroid nodules. J Ultrasound Med. 43:1025–1036. 2024.PubMed/NCBI View Article : Google Scholar
|
|
20
|
Ellis K, Kerr J, Godbole S, Lanckriet G,
Wing D and Marshall S: A random forest classifier for the
prediction of energy expenditure and type of physical activity from
wrist and hip accelerometers. Physiol Meas. 35:2191–2203.
2014.PubMed/NCBI View Article : Google Scholar
|
|
21
|
Zhang M, Zhu K, Pu H, Wang Z, Zhao H,
Zhang J and Wang Y: An immune-related signature predicts survival
in patients with lung adenocarcinoma. Front Oncol.
9(1314)2019.PubMed/NCBI View Article : Google Scholar
|
|
22
|
Alderden J, Pepper GA, Wilson A, Whitney
JD, Richardson S, Butcher R, Jo Y and Cummins MR: Predicting
pressure injury in critical care patients: A machine-learning
model. Am J Crit Care. 27:461–468. 2018.PubMed/NCBI View Article : Google Scholar
|
|
23
|
Epstein LJ, Kristo D, Strollo PJ Jr,
Friedman N, Malhotra A, Patil SP, Ramar K, Rogers R, Schwab RJ,
Weaver EM, et al: Clinical guideline for the evaluation, management
and long-term care of obstructive sleep apnea in adults. J Clin
Sleep Med. 5:263–276. 2009.PubMed/NCBI
|
|
24
|
Kapur VK, Auckley DH, Chowdhuri S,
Kuhlmann DC, Mehra R, Ramar K and Harrod CG: Clinical practice
guideline for diagnostic testing for adult obstructive sleep apnea:
An American academy of sleep medicine clinical practice guideline.
J Clin Sleep Med. 13:479–504. 2017.PubMed/NCBI View Article : Google Scholar
|
|
25
|
Livak KJ and Schmittgen TD: Analysis of
relative gene expression data using real-time quantitative PCR and
the 2(-Delta Delta C(T)) method. Methods. 25:402–408.
2001.PubMed/NCBI View Article : Google Scholar
|
|
26
|
Zhang Y, Bobe G, Miranda CL, Lowry MB, Hsu
VL, Lohr CV, Wong CP, Jump DB, Robinson MM, Sharpton TJ, et al:
Tetrahydroxanthohumol, a xanthohumol derivative, attenuates
high-fat diet-induced hepatic steatosis by antagonizing PPARγ.
Elife. 10(e66398)2021.PubMed/NCBI View Article : Google Scholar
|
|
27
|
Ibeagha-Awemu EM, Li R, Ammah AA,
Dudemaine PL, Bissonnette N, Benchaar C and Zhao X: Transcriptome
adaptation of the bovine mammary gland to diets rich in unsaturated
fatty acids shows greater impact of linseed oil over safflower oil
on gene expression and metabolic pathways. BMC Genomics.
17(104)2016.PubMed/NCBI View Article : Google Scholar
|
|
28
|
Prabhakar NR, Kumar GK, Nanduri J and
Semenza GL: ROS signaling in systemic and cellular responses to
chronic intermittent hypoxia. Antioxid Redox Signal. 9:1397–1403.
2007.PubMed/NCBI View Article : Google Scholar
|
|
29
|
Chen LD, Wu RH, Huang YZ, Chen MX, Zeng
AM, Zhuo GF, Xu FS, Liao R and Lin QC: The role of ferroptosis in
chronic intermittent hypoxia-induced liver injury in rats. Sleep
Breath. 24:1767–1773. 2020.PubMed/NCBI View Article : Google Scholar
|
|
30
|
Singh JA and Cleveland JD: Gout and the
risk of incident obstructive sleep apnea in adults 65 years or
older: An observational study. J Clin Sleep Med. 14:1521–1527.
2018.PubMed/NCBI View Article : Google Scholar
|
|
31
|
Wong MYZ, Yap JJL, Sultana R, Cheah M, Goh
GBB and Yeo KK: Association between non-alcoholic fatty liver
disease and subclinical atherosclerosis in Western and Asian
cohorts: An updated meta-analysis. Open Heart.
8(e001850)2021.PubMed/NCBI View Article : Google Scholar
|
|
32
|
Fallahi A, Jamil DI, Karimi EB, Baghi V
and Gheshlagh RG: Prevalence of obstructive sleep apnea in patients
with type 2 diabetes: A systematic review and meta-analysis.
Diabetes Metab Syndr. 13:2463–2468. 2019.PubMed/NCBI View Article : Google Scholar
|
|
33
|
Gozal D, Gileles-Hillel A, Cortese R, Li
Y, Almendros I, Qiao Z, Khalyfa AA, Andrade J and Khalyfa A:
Visceral white adipose tissue after chronic intermittent and
sustained hypoxia in mice. Am J Respir Cell Mol Biol. 56:477–487.
2017.PubMed/NCBI View Article : Google Scholar
|
|
34
|
Ryan S: Adipose tissue inflammation by
intermittent hypoxia: Mechanistic link between obstructive sleep
apnoea and metabolic dysfunction. J Physiol. 595:2423–2430.
2017.PubMed/NCBI View Article : Google Scholar
|
|
35
|
Hirotsu C, Haba-Rubio J, Togeiro SM,
Marques-Vidal P, Drager LF, Vollenweider P, Waeber G, Bittencourt
L, Tufik S and Heinzer R: Obstructive sleep apnoea as a risk factor
for incident metabolic syndrome: A joined Episono and HypnoLaus
prospective cohorts study. Eur Respir J. 52(1801150)2018.PubMed/NCBI View Article : Google Scholar
|
|
36
|
Murphy AM, Thomas A, Crinion SJ, Kent BD,
Tambuwala MM, Fabre A, Pepin JL, Roche HM, Arnaud C and Ryan S:
Intermittent hypoxia in obstructive sleep apnoea mediates insulin
resistance through adipose tissue inflammation. Eur Respir J.
49(1601731)2017.PubMed/NCBI View Article : Google Scholar
|
|
37
|
Papandreou C: Independent associations
between fatty acids and sleep quality among obese patients with
obstructive sleep apnoea syndrome. J Sleep Res. 22:569–572.
2013.PubMed/NCBI View Article : Google Scholar
|
|
38
|
Xu H, Zheng X, Qian Y, Guan J, Yi H, Zou
J, Wang Y, Meng L, Zhao A, Yin S and Jia W: Metabolomics profiling
for obstructive sleep apnea and simple snorers. Sci Rep.
6(30958)2016.PubMed/NCBI View Article : Google Scholar
|
|
39
|
Tasali E, Leproult R and Spiegel K:
Reduced sleep duration or quality: Relationships with insulin
resistance and type 2 diabetes. Prog Cardiovasc Dis. 51:381–391.
2009.PubMed/NCBI View Article : Google Scholar
|
|
40
|
Ryan S, Arnaud C, Fitzpatrick SF, Gaucher
J, Tamisier R and Pépin JL: Adipose tissue as a key player in
obstructive sleep apnoea. Eur Respir Rev. 28(190006)2019.PubMed/NCBI View Article : Google Scholar
|
|
41
|
Arısoy A, Sertoğullarından B, Ekin S,
Özgökçe M, Bulut MD, Huyut MT, Ölmez Ş and Turan M: Sleep apnea and
fatty liver are coupled via energy metabolism. Med Sci Monit.
22:908–913. 2016.PubMed/NCBI View Article : Google Scholar
|
|
42
|
Beatty A, Singh T, Tyurina YY, Tyurin VA,
Samovich S, Nicolas E, Maslar K, Zhou Y, Cai KQ, Tan Y, et al:
Ferroptotic cell death triggered by conjugated linolenic acids is
mediated by ACSL1. Nat Commun. 12(2244)2021.PubMed/NCBI View Article : Google Scholar
|
|
43
|
Sarparast M, Pourmand E, Hinman J, Vonarx
D, Reason T, Zhang F, Paithankar S, Chen B, Borhan B, Watts JL, et
al: Dihydroxy-metabolites of dihomo-γ-linolenic acid drive
ferroptosis-mediated neurodegeneration. ACS Cent Sci. 9:870–882.
2023.PubMed/NCBI View Article : Google Scholar
|
|
44
|
Perez MA, Clostio AJ, Houston IR, Ruiz J,
Magtanong L, Dixon SJ and Watts JL: Ether lipid deficiency disrupts
lipid homeostasis leading to ferroptosis sensitivity. PLoS Genet.
18(e1010436)2022.PubMed/NCBI View Article : Google Scholar
|
|
45
|
Sarparast M, Pourmand E, Hinman J, Vonarx
D, Reason T, Zhang F, Paithankar S, Chen B, Borhan B, Watts JL, et
al: Dihydroxy-metabolites of dihomo-gamma-linolenic acid drive
ferroptosis-Mediated Neurodegeneration. bioRxiv [Preprint]:
2023.01.05.522933, 2023.
|
|
46
|
Jelic S, Lederer DJ, Adams T, Padeletti M,
Colombo PC, Factor PH and Le Jemtel TH: Vascular inflammation in
obesity and sleep apnea. Circulation. 121:1014–1021.
2010.PubMed/NCBI View Article : Google Scholar
|
|
47
|
Dyugovskaya L, Lavie P, Hirsh M and Lavie
L: Activated CD8+ T-lymphocytes in obstructive sleep apnoea. Eur
Respir J. 25:820–628. 2005.PubMed/NCBI View Article : Google Scholar
|
|
48
|
Sériès F, Chakir J and Boivin D: Influence
of weight and sleep apnea status on immunologic and structural
features of the uvula. Am J Respir Crit Care Med. 170:1114–1119.
2004.PubMed/NCBI View Article : Google Scholar
|
|
49
|
Sade K, Fishman G, Kivity S, DeRowe A and
Langier S: Expression of Th17 and Treg lymphocyte subsets in
hypertrophied adenoids of children and its clinical significance.
Immunol Invest. 40:657–666. 2011.PubMed/NCBI View Article : Google Scholar
|
|
50
|
Kim J, Bhattacharjee R, Dayyat E, Snow AB,
Kheirandish-Gozal L, Goldman JL, Li RC, Serpero LD, Clair HB and
Gozal D: Increased cellular proliferation and inflammatory
cytokines in tonsils derived from children with obstructive sleep
apnea. Pediatr Res. 66:423–428. 2009.PubMed/NCBI View Article : Google Scholar
|
|
51
|
Domagała-Kulawik J, Osińska I, Piechuta A,
Bielicki P and Skirecki T: T, B, and NKT cells in systemic
inflammation in obstructive sleep apnoea. Mediators Inflamm.
2015(161579)2015.PubMed/NCBI View Article : Google Scholar
|
|
52
|
Guo Q, Wang Y, Li QY, Li M and Wan HY:
Levels of thioredoxin are related to the severity of obstructive
sleep apnea: Based on oxidative stress concept. Sleep Breath.
17:311–316. 2013.PubMed/NCBI View Article : Google Scholar
|
|
53
|
Lira AB and de Sousa Rodrigues CF:
Evaluation of oxidative stress markers in obstructive sleep apnea
syndrome and additional antioxidant therapy: A review article.
Sleep Breath. 20:1155–1160. 2016.PubMed/NCBI View Article : Google Scholar
|
|
54
|
Takahashi K, Chin K, Nakamura H, Morita S,
Sumi K, Oga T, Matsumoto H, Niimi A, Fukuhara S, Yodoi J and
Mishima M: Plasma thioredoxin, a novel oxidative stress marker, in
patients with obstructive sleep apnea before and after nasal
continuous positive airway pressure. Antioxid Redox Signal.
10:715–726. 2008.PubMed/NCBI View Article : Google Scholar
|
|
55
|
Xie B, Wang C, Zheng Z, Song B, Ma C,
Thiel G and Li M: Egr-1 transactivates Bim gene expression to
promote neuronal apoptosis. J Neurosci. 31:5032–5044.
2011.PubMed/NCBI View Article : Google Scholar
|
|
56
|
Luo S, Garcia-Arencibia M, Zhao R, Puri C,
Toh PP, Sadiq O and Rubinsztein DC: Bim inhibits autophagy by
recruiting Beclin 1 to microtubules. Mol Cell. 47:359–370.
2012.PubMed/NCBI View Article : Google Scholar
|
|
57
|
Singh M, Shin YK, Yang X, Zehr B,
Chakrabarti P and Kandror KV: 4E-BPs control fat storage by
regulating the expression of Egr1 and ATGL. J Biol Chem.
290:17331–17338. 2015.PubMed/NCBI View Article : Google Scholar
|
|
58
|
Bléher M, Meshko B, Cacciapuoti I,
Gergondey R, Kovacs Y, Duprez D, L'Honoré A and Havis E: Egr1
loss-of-function promotes beige adipocyte differentiation and
activation specifically in inguinal subcutaneous white adipose
tissue. Sci Rep. 10(15842)2020.PubMed/NCBI View Article : Google Scholar
|
|
59
|
Manousakis E, Miralles CM, Esquerda MG and
Wright RHG: CDKN1A/p21 in breast cancer: Part of the problem, or
part of the solution? Int J Mol Sci. 24(17488)2023.PubMed/NCBI View Article : Google Scholar
|
|
60
|
Perucca P, Cazzalini O, Madine M, Savio M,
Laskey RA, Vannini V, Prosperi E and Stivala LA: Loss of p21 CDKN1A
impairs entry to quiescence and activates a DNA damage response in
normal fibroblasts induced to quiescence. Cell Cycle. 8:105–114.
2009.PubMed/NCBI View Article : Google Scholar
|
|
61
|
Natallia L, Dama A, Gorica E, Darya K,
Peña-Corona SI, Cortés H, Santini A, Büsselberg D, Leyva-Gómez G
and Sharifi-Rad J: Genipin's potential as an anti-cancer agent:
From phytochemical origins to clinical prospects. Med Oncol.
41(186)2024.PubMed/NCBI View Article : Google Scholar
|
|
62
|
Pan M, Luo M, Liu L, Chen Y, Cheng Z, Wang
K, Huang L, Tang N, Qiu J, Huang A and Xia J: EGR1 suppresses HCC
growth and aerobic glycolysis by transcriptionally downregulating
PFKL. J Exp Clin Cancer Res. 43(35)2024.PubMed/NCBI View Article : Google Scholar
|
|
63
|
Sun K, Chen Y, Zheng S, Wan W and Hu K:
Genipin ameliorates diabetic retinopathy via the HIF-1α and
AGEs-RAGE pathways. Phytomedicine. 129(155596)2024.PubMed/NCBI View Article : Google Scholar
|
|
64
|
Kim BC, Kim HG, Lee SA, Lim S, Park EH,
Kim SJ and Lim CJ: Genipin-induced apoptosis in hepatoma cells is
mediated by reactive oxygen species/c-Jun NH2-terminal
kinase-dependent activation of mitochondrial pathway. Biochem
Pharmacol. 70:1398–1407. 2005.PubMed/NCBI View Article : Google Scholar
|
|
65
|
Wang R, Shiu HT and Lee WYW: Emerging role
of lncRNAs in osteoarthritis: An updated review. Front Immunol.
13(982773)2022.PubMed/NCBI View Article : Google Scholar
|