Introduction
The development and application of matrix-assisted
laser desorption/ionization time-of-flight mass spectrometry
(MALDI-TOF MS) for the identification of microorganisms has been
revolutionary. Microbial proteomics has attracted attention
worldwide and this has resulted in the development of novel
identification methods which are rapid, robust and relatively
inexpensive (1).
For the identification of microorganisms, MALDI-TOF
MS analysis typically concentrates on intact proteins with a
molecular weight in the range of 2–20 kDa. The proteins in this
range are mainly ribosomal proteins which represent approximately
30% of the total proteins from a microbial cell (2). Following mass spectral analysis, the
raw spectra are processed using a peak recognition algorithm. The
data generated following MALDI-TOF MS analysis consist of two large
sets of values: mass-to-charge (m/z) and intensity. Each
m/z value has a corresponding intensity value. The signal
extraction, also known as peak picking, is often corrupted by
noise. Therefore, various algorithms have been developed for
obtaining peaks that correspond to true peptide/proteins signals
(3). This is a very important
step in data analysis as different peak recognition algorithms may
have a considerable effect on the peak list, and therefore should
be adjusted with care (4). Once
extracted, the peak lists are compared to a dedicated database
which contains reference mass spectra of known microbial strains.
The first such platform 'MALDI Biotyper' was developed by Bruker
Daltonics. Another platform combines the Shimadzu mass
instrumentation and software 'Launchpad' with a centralized
database 'SARAMIS' provided by BioMerieux (Marcy l'Etoile, France)
(1,5).
Although mainly used for microbial identification,
intact protein profiles have also been used successfully for the
characterization and identification of mammalian cell lines
(6–8). Karger et al (6) identified 66 cell lines from 34
species using reference spectra library created by MALDI Biotyper,
while Povey et al (8) used
partial least squares discriminant analysis model to predict the
phenotype of recombinant mammalian cell lines.
The methods currently used for the identification
and characterization of cancer cells, namely DNA fingerprinting,
immunohistochemistry and flow cytometry (9–12),
require specific reagents which limit the degree of multiplexing.
In addition, these methods require laborious sample preparation
which leads to an increased analysis time. The proteomic approach
can achieve a level of multiplexing where several cell lines can be
analyzed without changing the method parameters and without using
specialized materials and reagents. The aim of this study was to
assess the potential of using MALDI-TOF MS for the classification
of cancer cell lines. To achieve this, the procedure for the
taxonomic classification of microorganisms was adapted. Six cancer
cell lines (murine and human) were used in this study: B16-F0 and
B164A5 (murine melanoma cells), A375 (human melanoma), HepG2 (human
liver carcinoma), MCF7 (human breast carcinoma) and MDA-MB-231
(human breast carcinoma). The statistical analysis was processed
using MALDI Biotyper software. These data were used for a better
observation of differences regarding the species and metastatic
potential, differences well-defined between the two human breast
carcinoma cell lines (MCF7 and MDA-MB-231) and two murine melanoma
cell lines (B16-F0 and B164A5). As an end point, a different cell
line was applied for an upgraded picture: HepG2 (human liver
carcinoma).
Materials and methods
Cell lines and reagents
The cancer cell lines used in the present study,
B16-F0 [murine melanoma; CRL-6322™, American Type Culture
Collection (ATCC), Manassas, VA, USA], B16 melanoma 4A5 (murine
melanoma; 94042254; Sigma-Aldrich Chemie GmbH, Munich, Germany),
A375 (human melanoma; CRL-1619™; ATCC), HepG2 (human liver
carcinoma; HB8065™; ATCC), MCF7 (human breast carcinoma; HTB22™;
ATCC) and MDA-MB-231 (human breast carcinoma; HTB26™; ATCC), were
acquired from Sigma-Aldrich Chemie GmbH and ATCC as frozen
items.
The specific reagents for cell culture [Dulbecco's
modified Eagle's medium (DMEM); Eagle's Minimum Essential Medium
(EMEM)], fetal bovine serum (FBS), antibiotic mixture of
penicillin/streptomycin, phosphate-buffered saline (PBS),
Trypsin/EDTA and trypan blue were acquired from Sigma-Aldrich
Chemie GmbH and ATCC.
Ethanol, formic acid, trifluoroacetic acid and
acetonitrile were acquired from Sigma-Aldrich Chemie GmbH.
α-cyano-4-hydroxycinnamic acid (Bruker HCCA matrix) and protein I
calibration standard were acquired from Bruker Daltonics (Bremen,
Germany).
Cell culture
The murine melanoma (B164A5 and B16-F0), human
melanoma (A375) and human breast carcinoma (MDA-MB-231) cell lines
were cultured in DMEM with 4.5 g/l glucose, 2 mM L-glutamine and
supplemented with 10% FBS and antibiotic mixture (100 U/ml
penicillin and 100 µg/ml streptomycin). The human liver
carcinoma (HepG2) and human breast carcinoma (MCF7) were cultured
in EMEM, supplemented with 10% FBS and antibiotic mixture. The
cells were kept in standard conditions as follows: a humidified
atmosphere with 5% CO2 at a temperature of 37°C and were
passaged every 2–3 days.
Scratch assay
The migratory character of the tumor cells used in
this study was examined by the means of a scratch assay. In brief,
2×10⁵ cells/well were seeded in 12-well plates in
specific culture medium and when the confluence was appropriate
(85–90%) a gap/scratch was drawn in the middle of the well with a
10 µl tip (13). The
capacity of the cells to migrate and fill the gap was monitored for
24 h by acquiring images at different time points, namely 0, 3 and
24 h using an Optika Microscopes Optikam Pro Cool 5 and Optika View
(Optika, Ponteranica, Italy).
Protein extraction for MALDI-TOF MS
analysis
Sample preparation for MALDI-TOF MS analysis was
performed as follows: the culture medium was discarded from the
flasks; the cells were washed with 10 ml PBS and were subsequently
incubated with 3 ml 0.025% trypsin/EDTA for 3–5 min. The reaction
was terminated by the addition of 10 ml cell culture medium. The
cells were stained with trypan blue and the cell number was
established using the Neubauer cell counting chamber. The
suspension was subsequently centrifuged at 1,700 × g for 5 min. The
supernatant was discarded and the cell pellet was mixed with 1 ml
of ethanol. Following centrifugation at 1,700 × g for 5 min, the
ethanol was removed and the pellet was reconstituted in 70% formic
acid at a ratio of 20 µl/1×106 cells. The mixture
was left at room temperature for 2 min, and then an equal volume of
acetonitrile was added. The samples were then centrifuged at 10,000
× g for 5 min. An aliquot (1 µl) of the supernatant was
spotted in duplicate onto the MTP 384 ground steel MALDI target
plate (Bruker Daltonics). The sample was allowed to dry at ambient
temperature and then overlaid with 1 µl of HCCA (5 mg/ml in
a mixture of acetonitrile, water and trifluoroacetic acid
50:47.5:2.5% v/v).
MALDI-TOF MS analysis
The MALDI-TOF MS instrument (Bruker Daltonics) was
calibrated in a positive ion linear mode in a mass range of
5,000–20,000 m/z, using Bruker Protein Calibration Standard
I containing insulin, ubiquitin I, cytochrome c and
myoglobin. Flex Control® (version 3.4) software was used
to acquire the data and set the method parameters. The following
settings were used: laser frequency, 2,000 Hz; smartbeam,
'4_large'; sample rate and digitiser settings, 1.25 GS/sec;
accelerator voltage, 20.07 kW; extraction voltage, 18.87 kW; lens
voltage, 5.58 kW; and delayed extraction, 250 nsec. The laser
intensity was adjusted such that the highest peak in the spectrum
was in the range of 104 arbitrary units. A 1,000 laser
shots were used for each individual spectrum and minimum of 10
individual spectra (10,000 laser shots) were cumulated and
saved.
Mass spectra processing
Mass spectra were processed using MALDI Biotyper
Offline Client® software (version 3.1; Bruker
Daltonics). The MALDI-TOF MS spectra were analyzed using principle
component analysis (PCA). The following parameters were used for
pre-processing the spectra: mass adjustment from 5,000 to 20,000
m/z; resolution, 1; processing method, spectra compressing;
compressing factor, 10; smoothing method, 'Savitsky-Golay' with a
frame size of 25 kDa; baseline subtraction method, multipolygon
with a search window of 5 kDa in 2 runs; spectra normalization,
maximum; peak piking method, 'Local maximum' with 200 maximum
peaks, signal-to-noise threshold, 0.01 and window width, 25 kDa.
The PCA creation parameters were set as follows: mass from
9,500–12,500 m/z; resolution, 2 and number of principal
components set to automatic.
For creating main spectra (MSP) the pre-processing
parameters used were the same as those described for PCA analysis
except that the mass range was 9,500 to 12,500 m/z. For the
MSP creation method, the following parameters were used: maximum
mass errors of each single spectrum, 2,000; desired mass error for
the MSP, 200; desired peak frequency minimum, 25%; maximum desired
peak number for the MSP, 10. For the identification method, the
following parameters were used: frequency threshold for spectra
adjusting, 50; frequency threshold for score calculation, 5;
maximum mass error of raw spectrum, 2,000; desired mass tolerance
of the adjusted spectrum, 250; furthermore accepted mass tolerance
of a peak 600, parameter of the intensity correction function,
0.25. For creating the MSP dendrogram, the following parameters
were used: distance measure, correlation; linkage, average; score
threshold value for a single organism, 300; and score threshold
value for a related organism, 0.
Results
Characteristics of tumor cell appearance
in culture
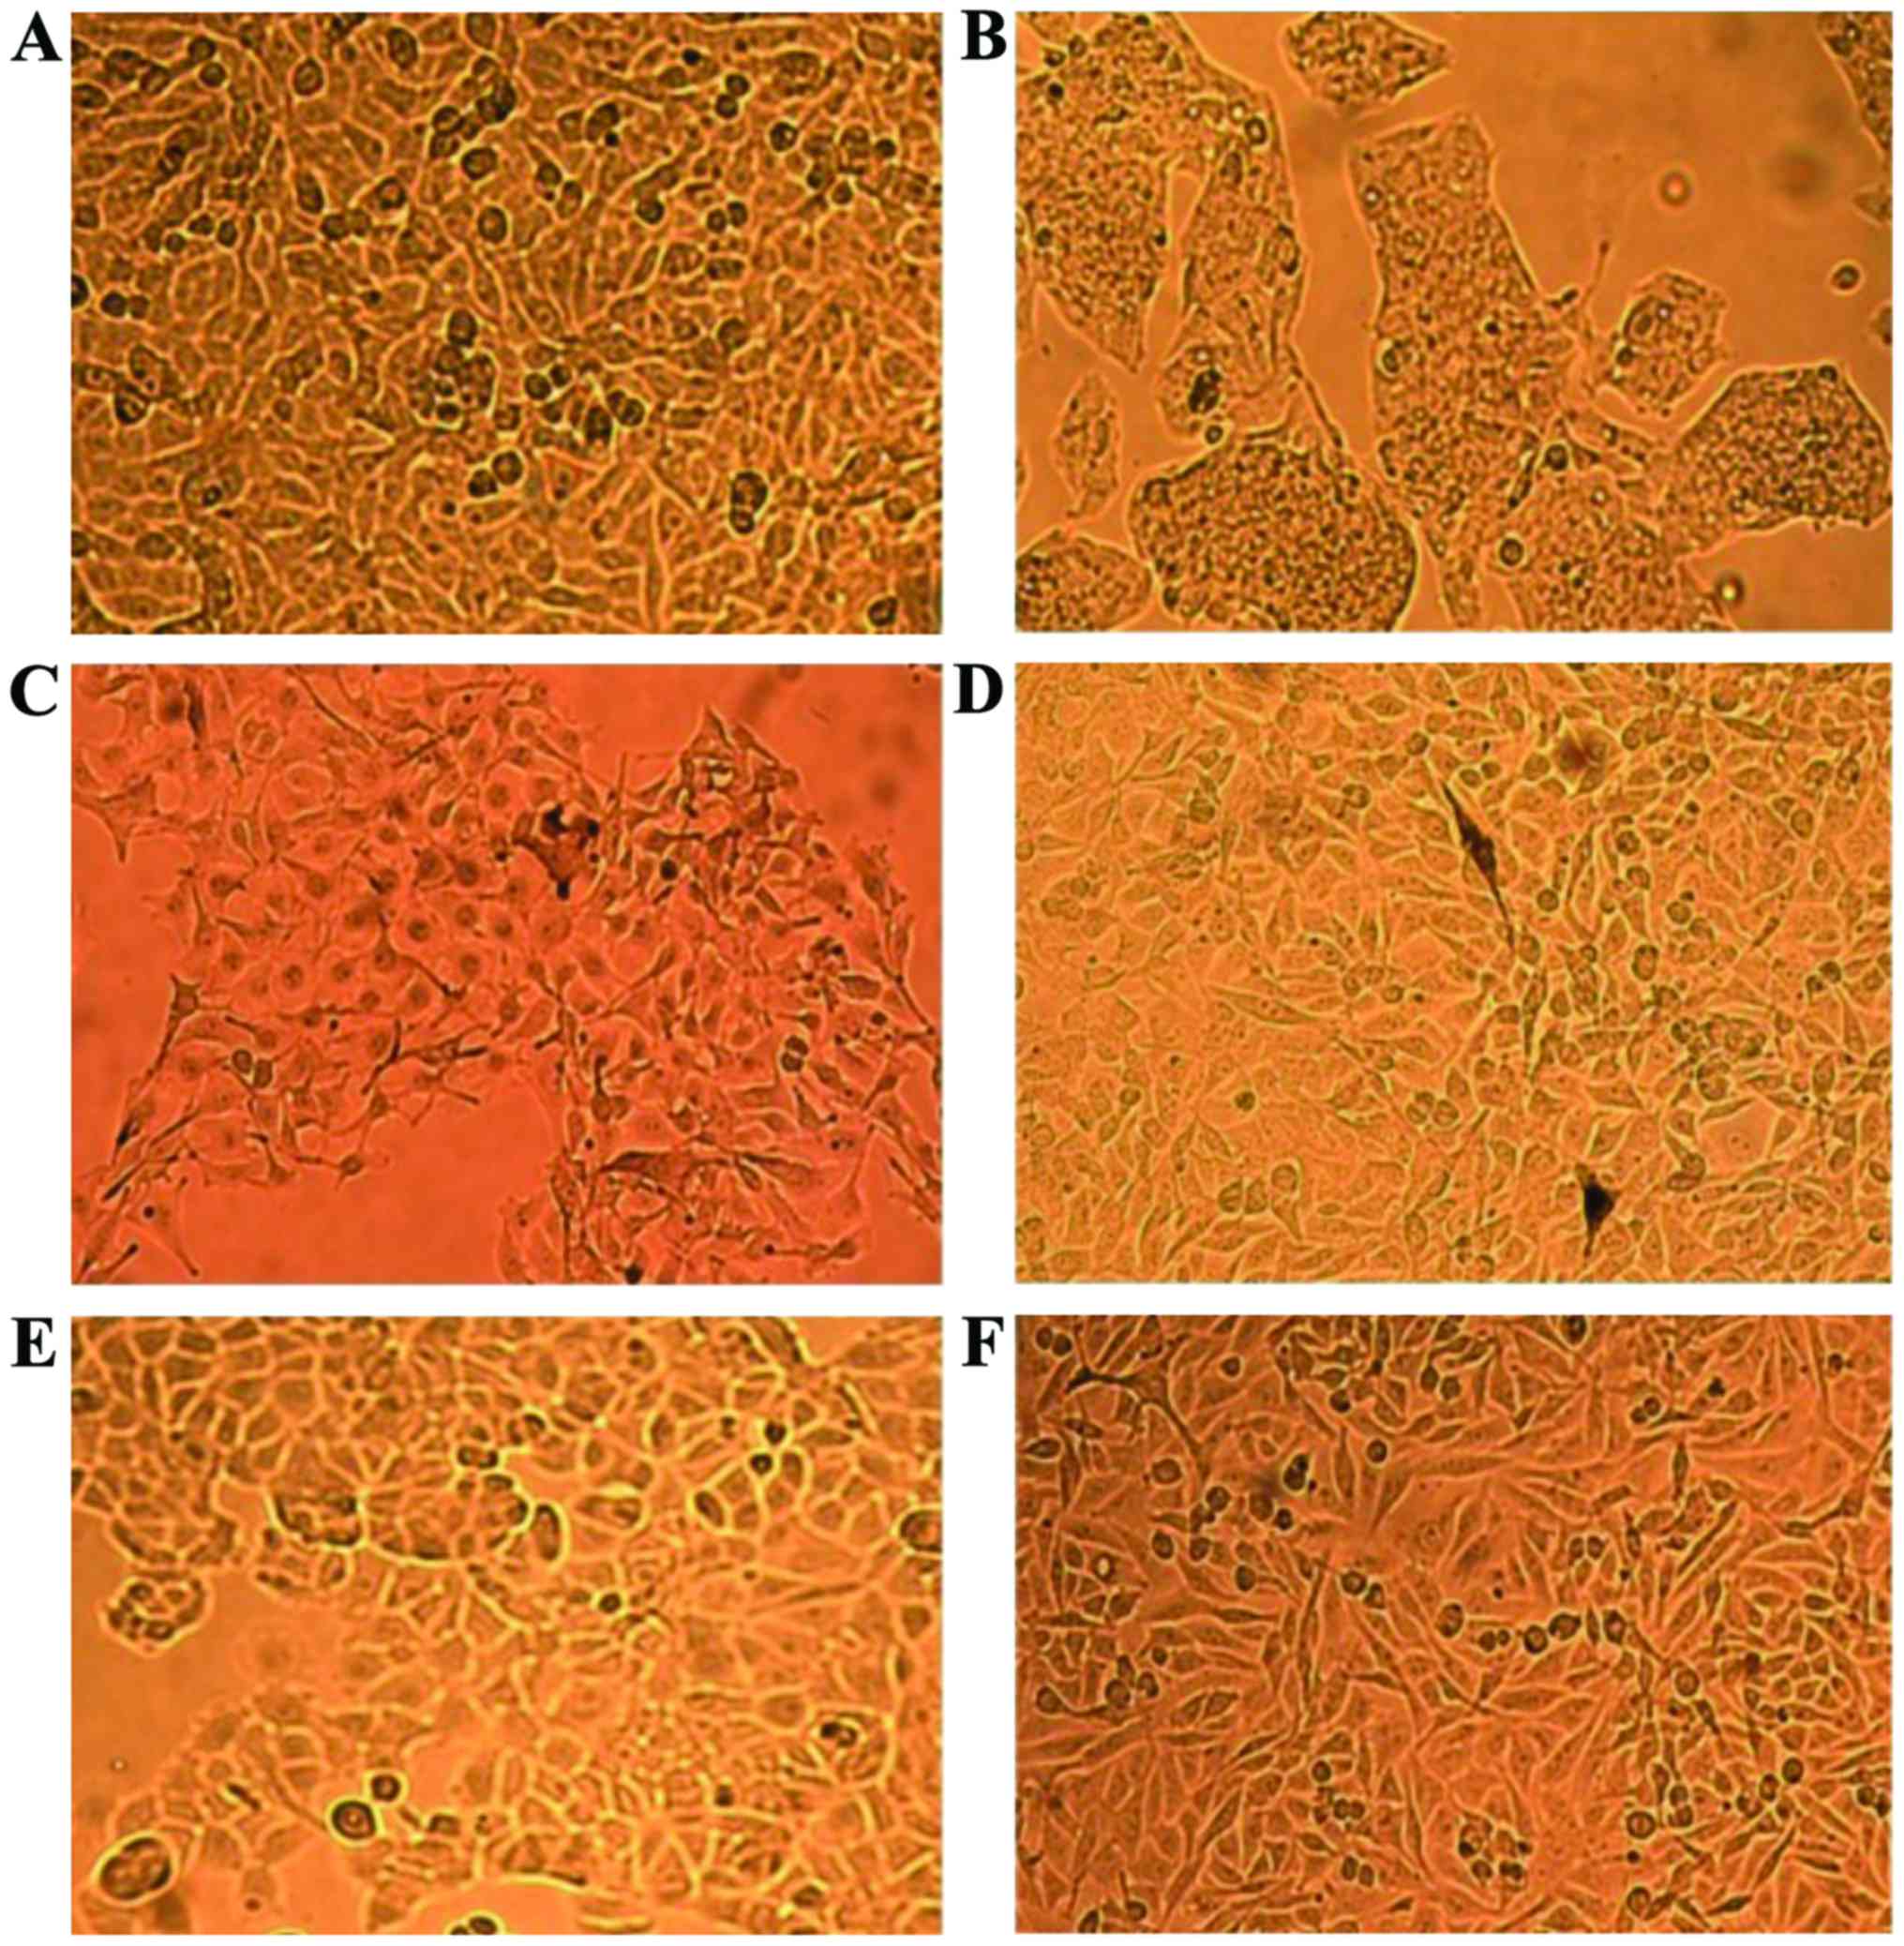
The cell lines employed in the present study in
order to be classified and differentiated at proteomic level by the
means of MALDI-TOF MS are illustrated in Fig. 1. It can be observed that the cells
have different shapes, even though they originate from the same
species [Fig. 1C (B16-F0) and D
(B164A5) murine melanoma] or cancer type [Fig. 1E (MCF7) and F (MDA-MB-231) human
breast carcinoma]. A375 (Fig. 1A)
are human amelanotic cells with an epithelial morphology, whereas
B16-F0 and B164A5 (murine) are melanin producing cells with a
mixture of spindle-shaped and epithelial-like cells (B16-F0) or a
fibroblast-like morphology (B164A5) (Fig. 1C and D, granules of melanin can
also be observed).
The human liver carcinoma cell line, HepG2, has an
epithelial morphology and the cells are strongly bonded (Fig. 1B). In the case of the two breast
human carcinoma cell lines, MCF7 and MDA-MB-231, some differences
were observed in terms of shape (an elongated shape in the case of
MDA-MB-231 and a more round one in the case of MCF7 cells), albeit
both are described to have an epithelial morphology (Fig. 1E and F).
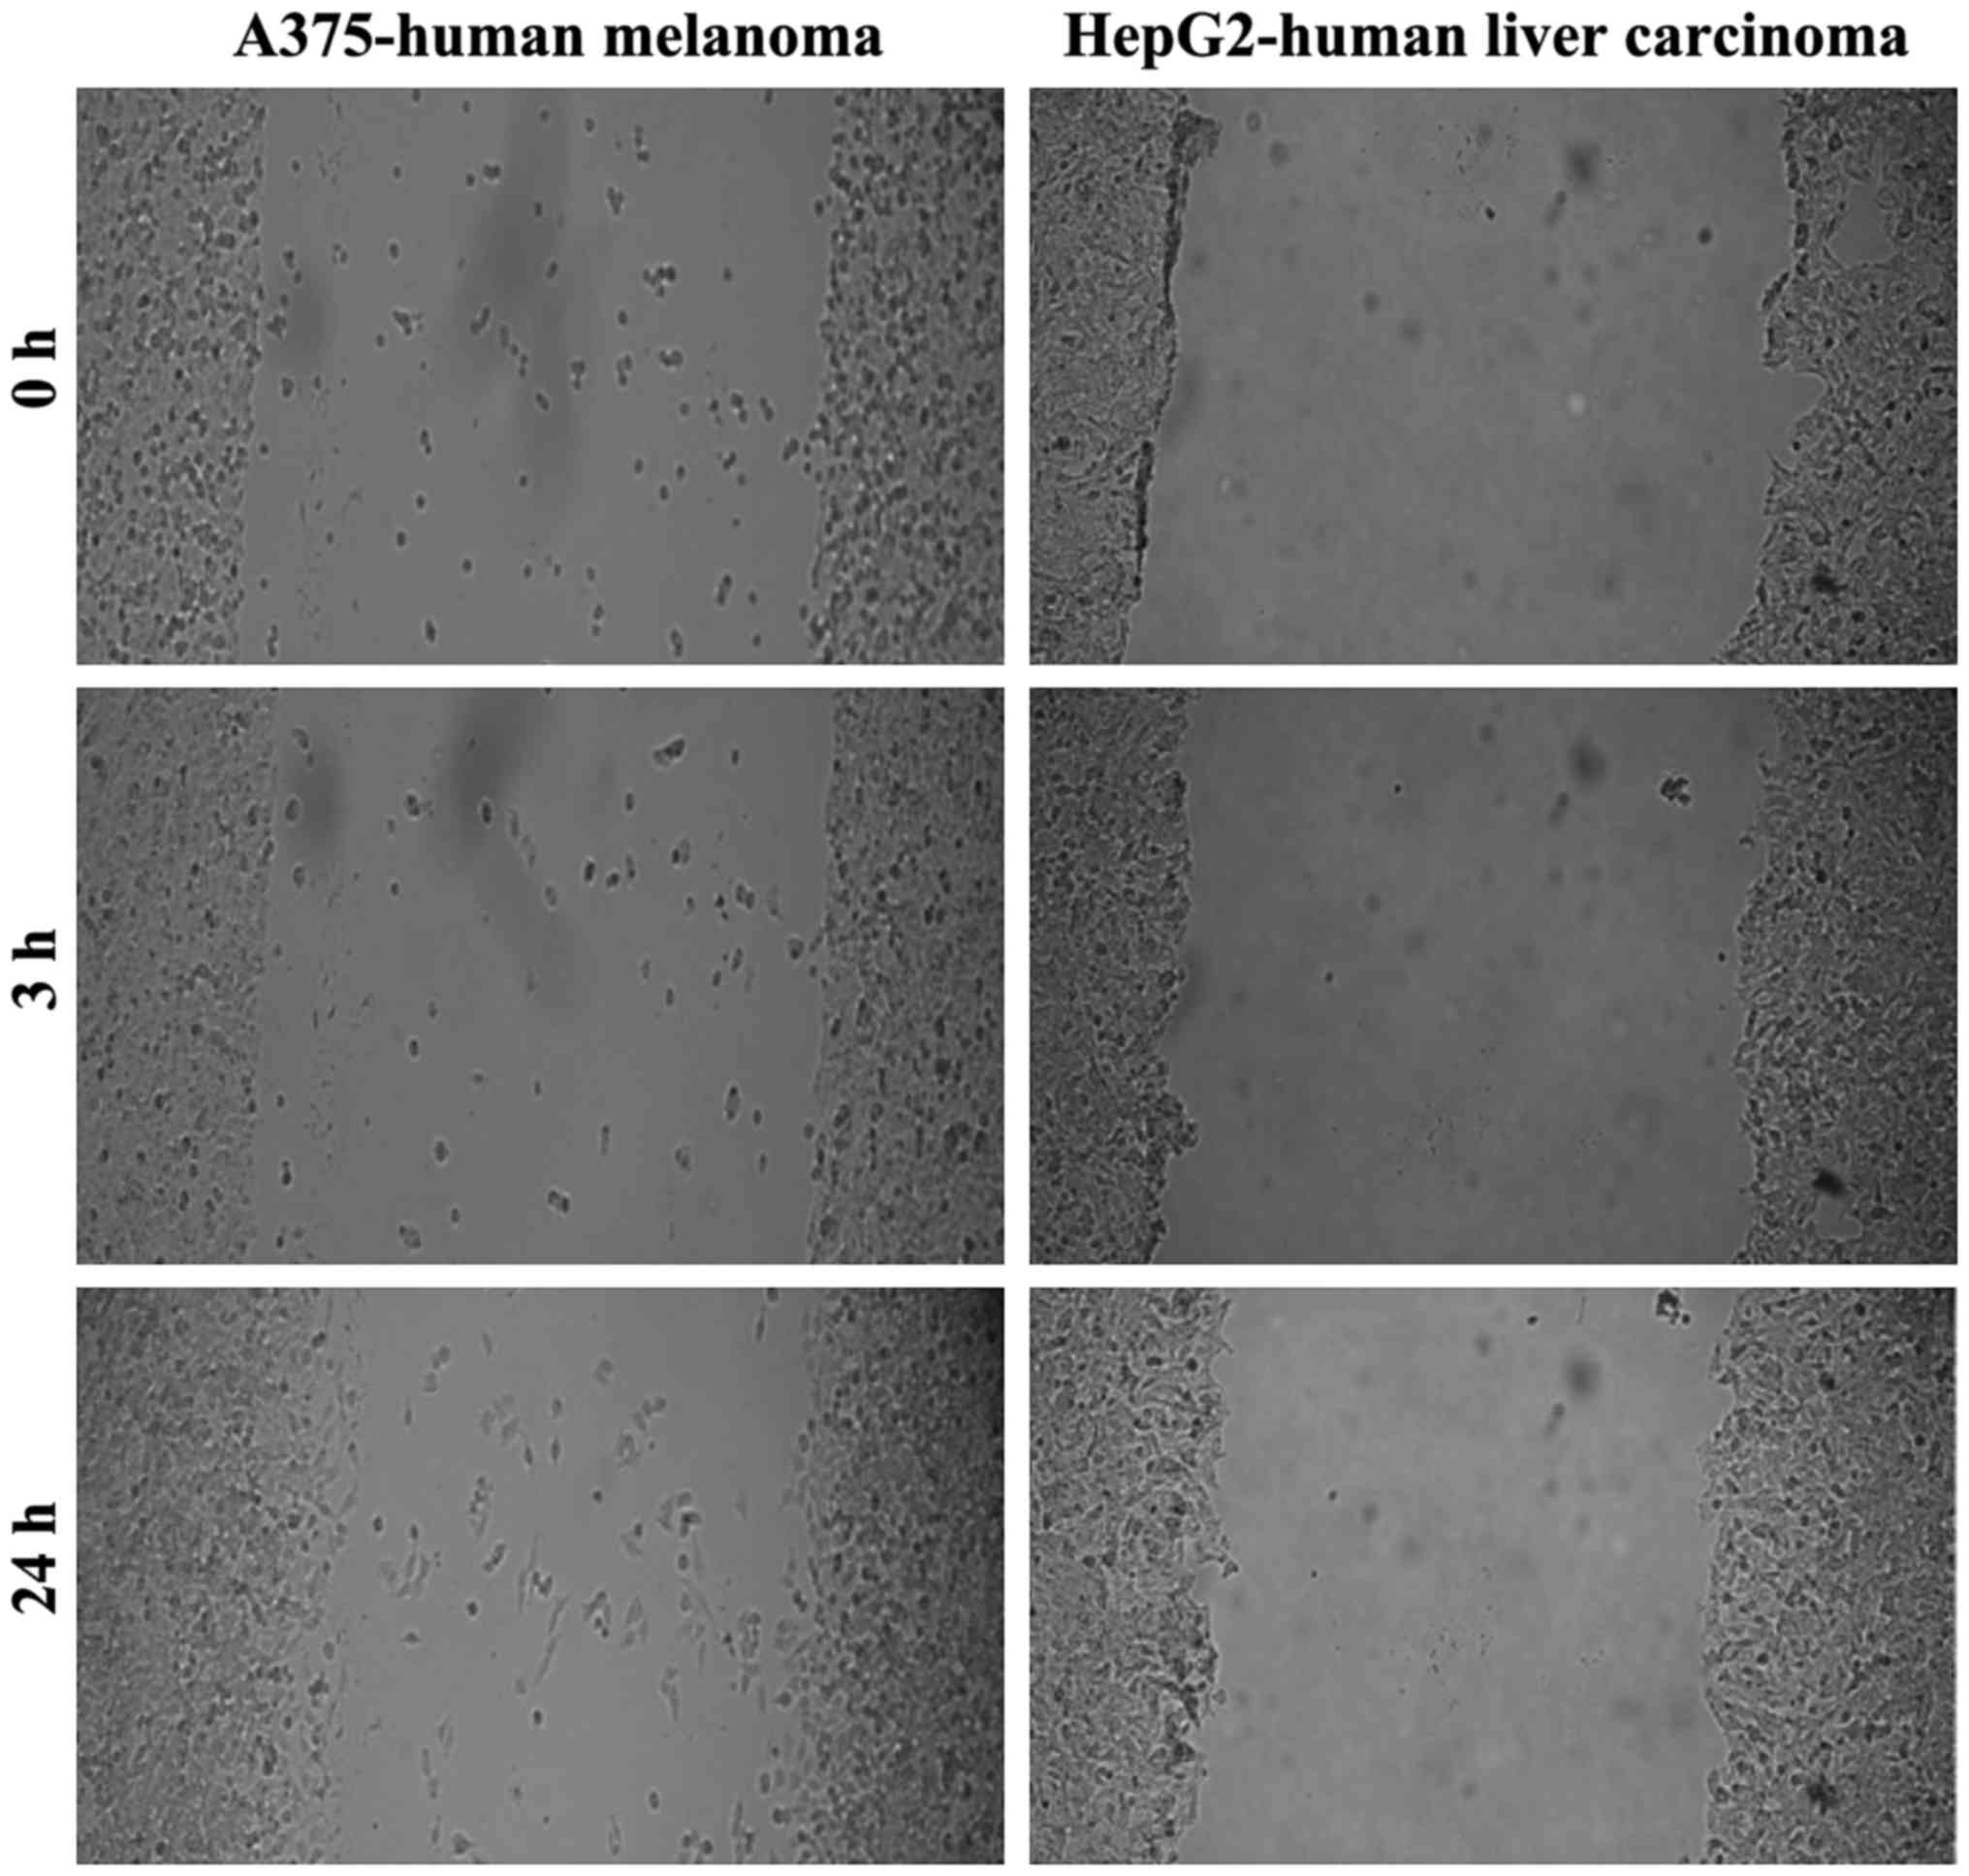
To delineate the differences regarding the migratory
character of the tumor cells studied, we performed a wound healing
assay/scratch assay. As shown in Fig.
2, the A375 and HepG2 cells were not able to fill the gap drawn
within 24 h, what indicates a low migratory capacity.
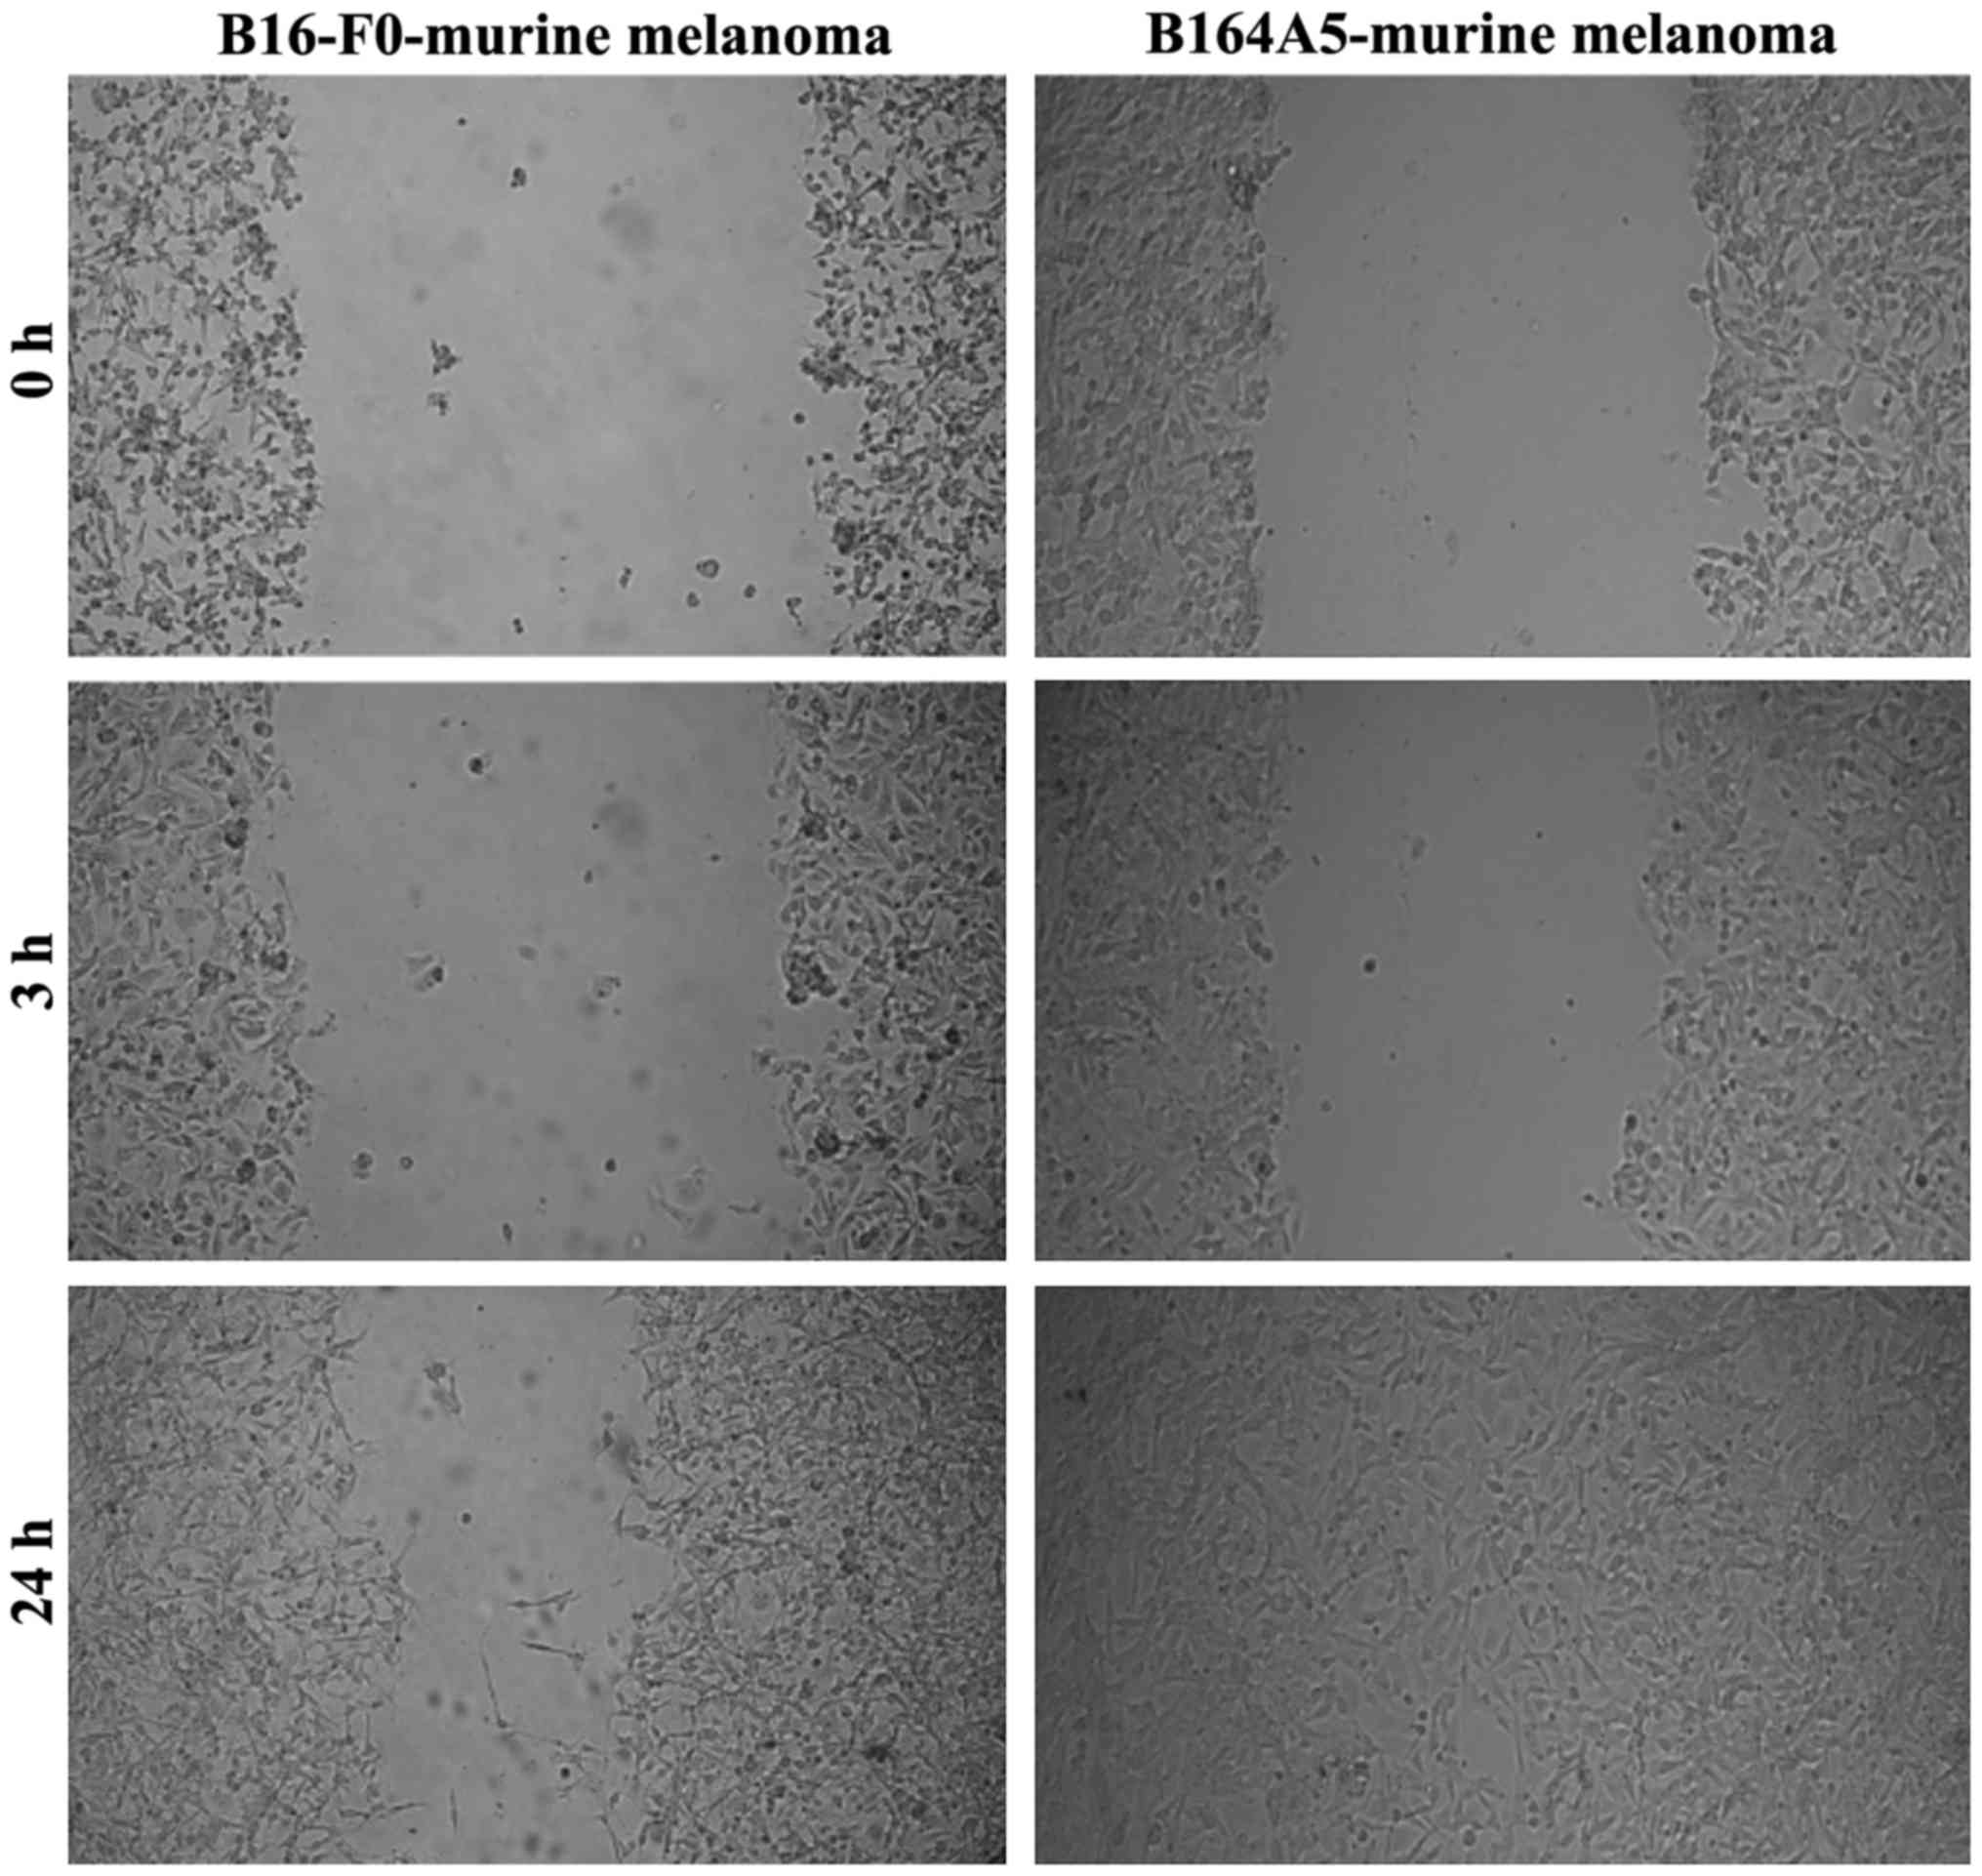
B164A5 cells (murine melanoma) proved to be highly
invasive, with the gap being completely filled after 24 h. The
B16-F0 cells also exhibited a potent migratory capacity, although
to a lesser extent than the B164A5 cells (Fig. 3).
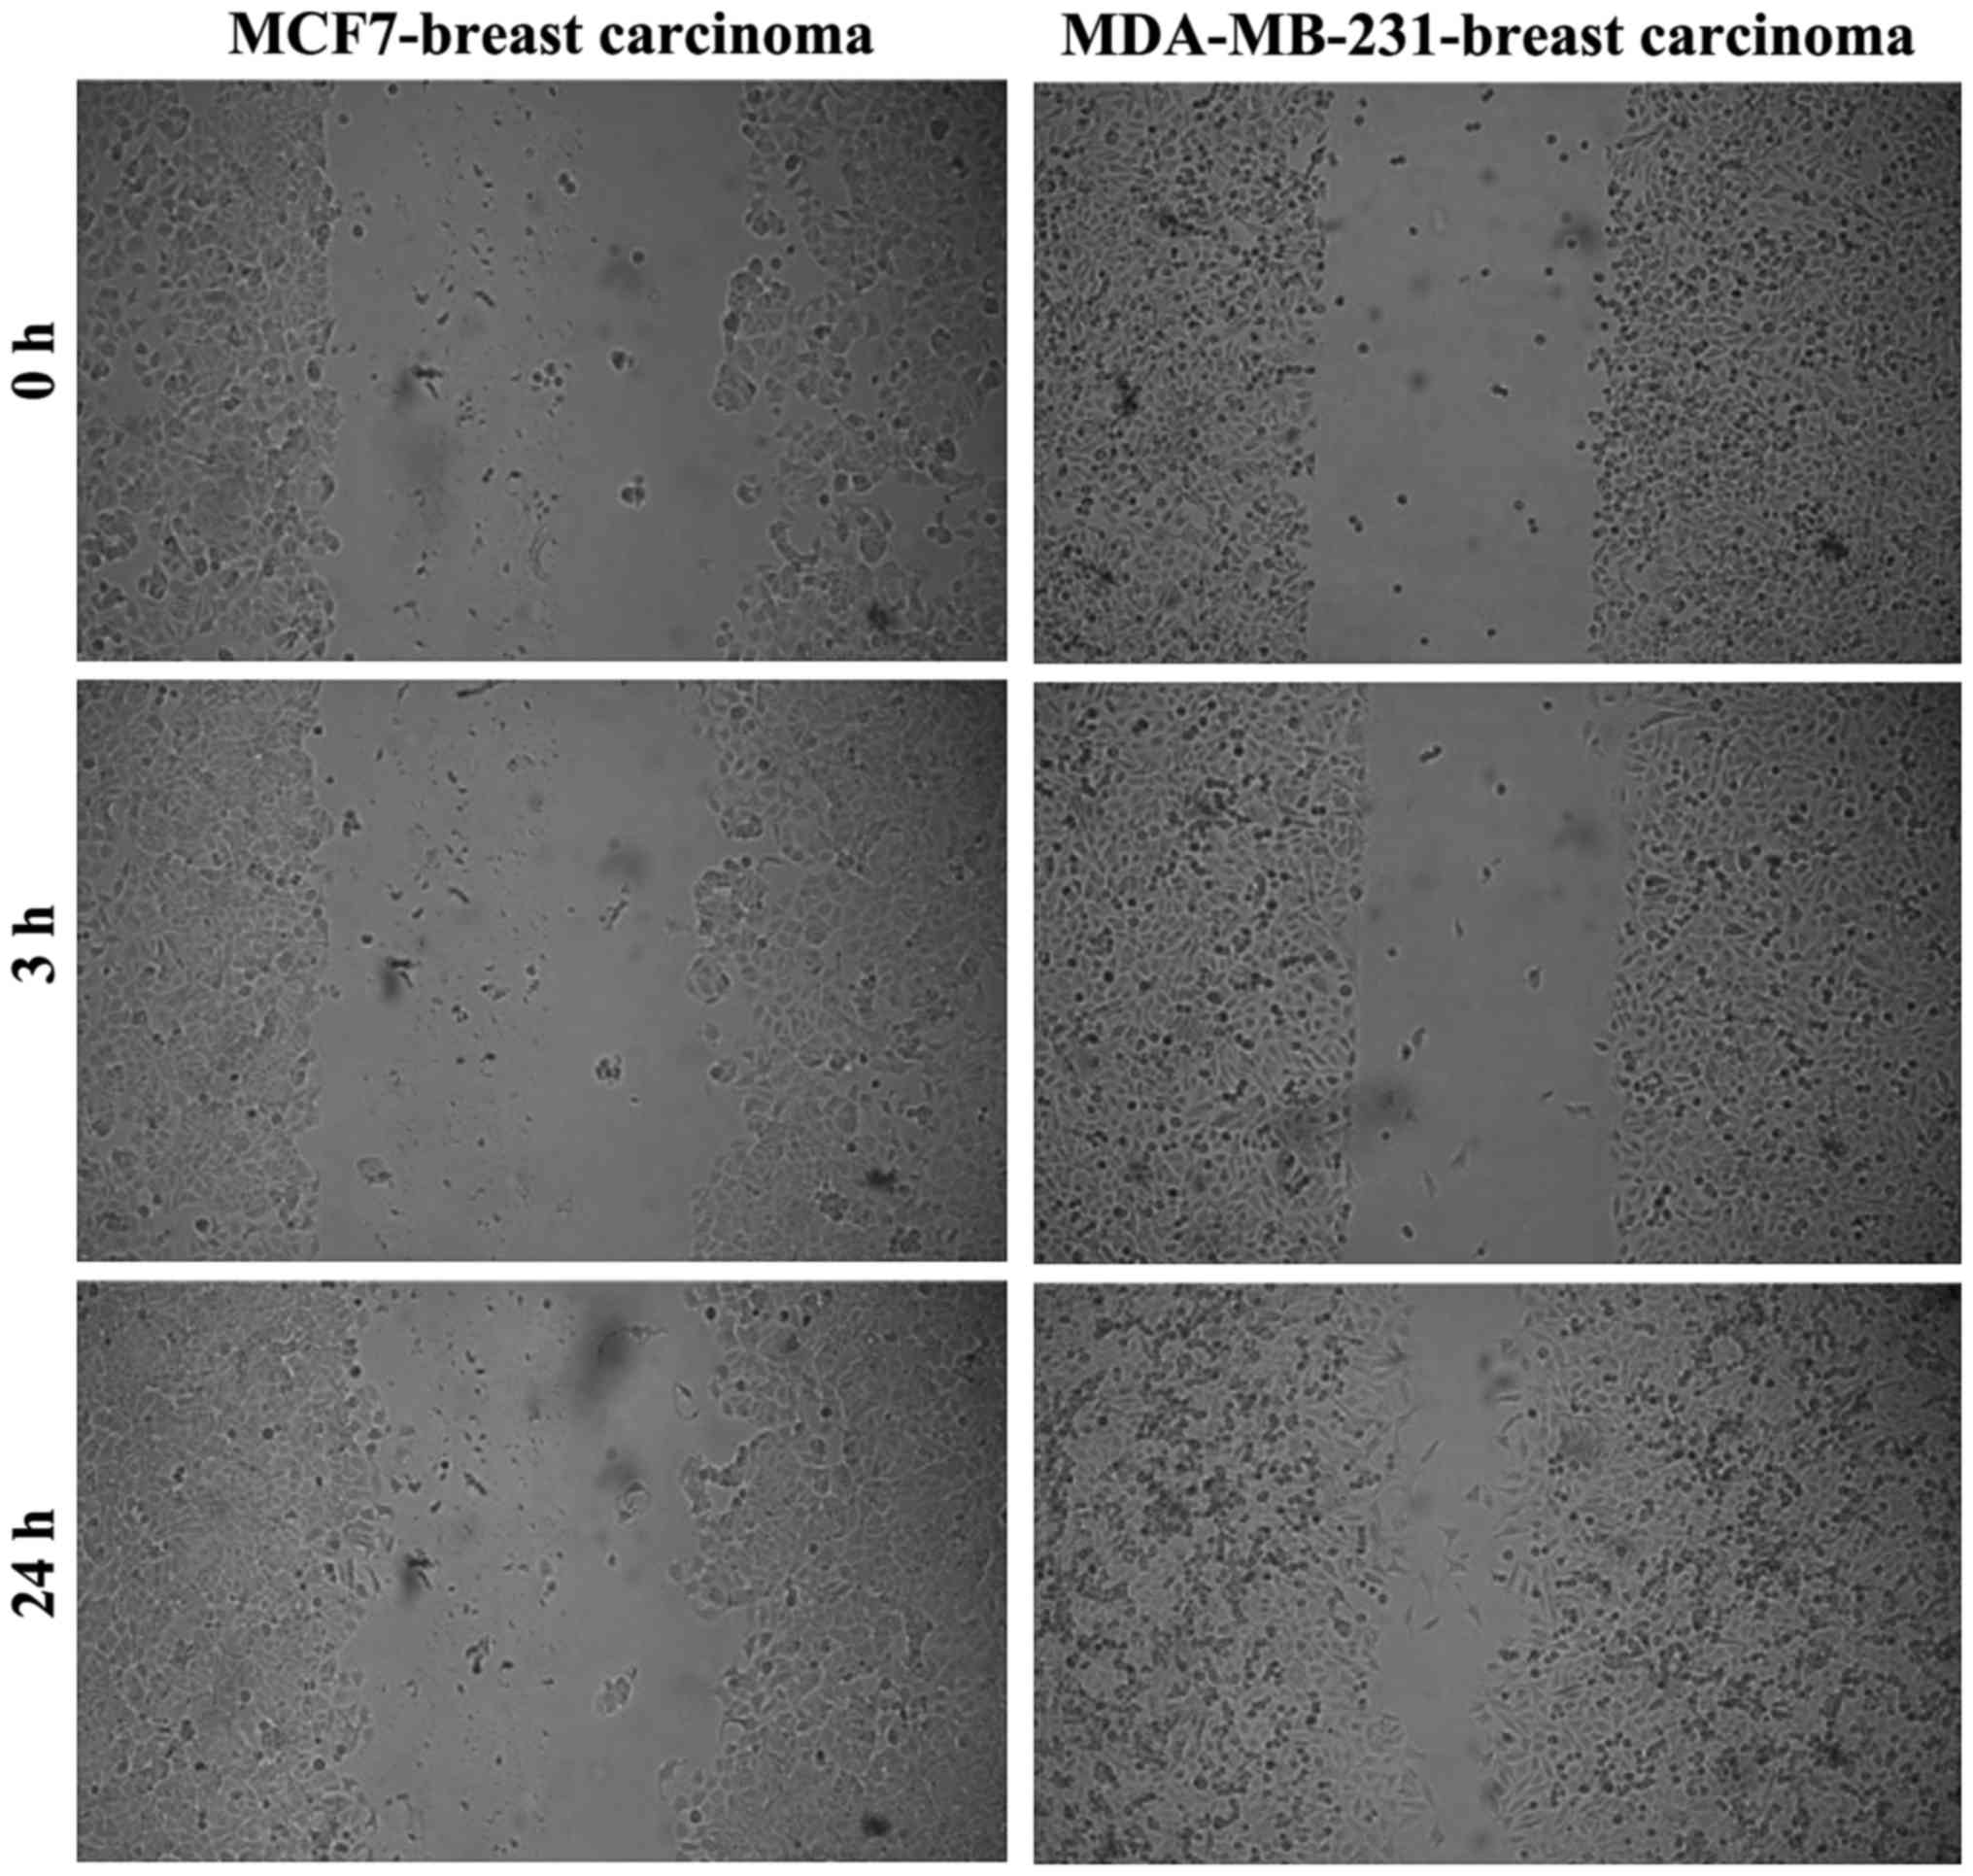
The comparison between the two breast carcinoma cell
lines in terms of migratory capacity indicated that the MDA-MB-231
cells were more invasive (Fig.
4).
PCA analysis
PCA three-dimensional clustering (Fig. 5) revealed that the three human
carcinoma cell lines (HepG2, MDA-MB-231 and MCF7) formed a distinct
cluster, while the human (A375) and murine melanoma (B164A5 and
B16-F0) cell lines formed another two separate clusters.
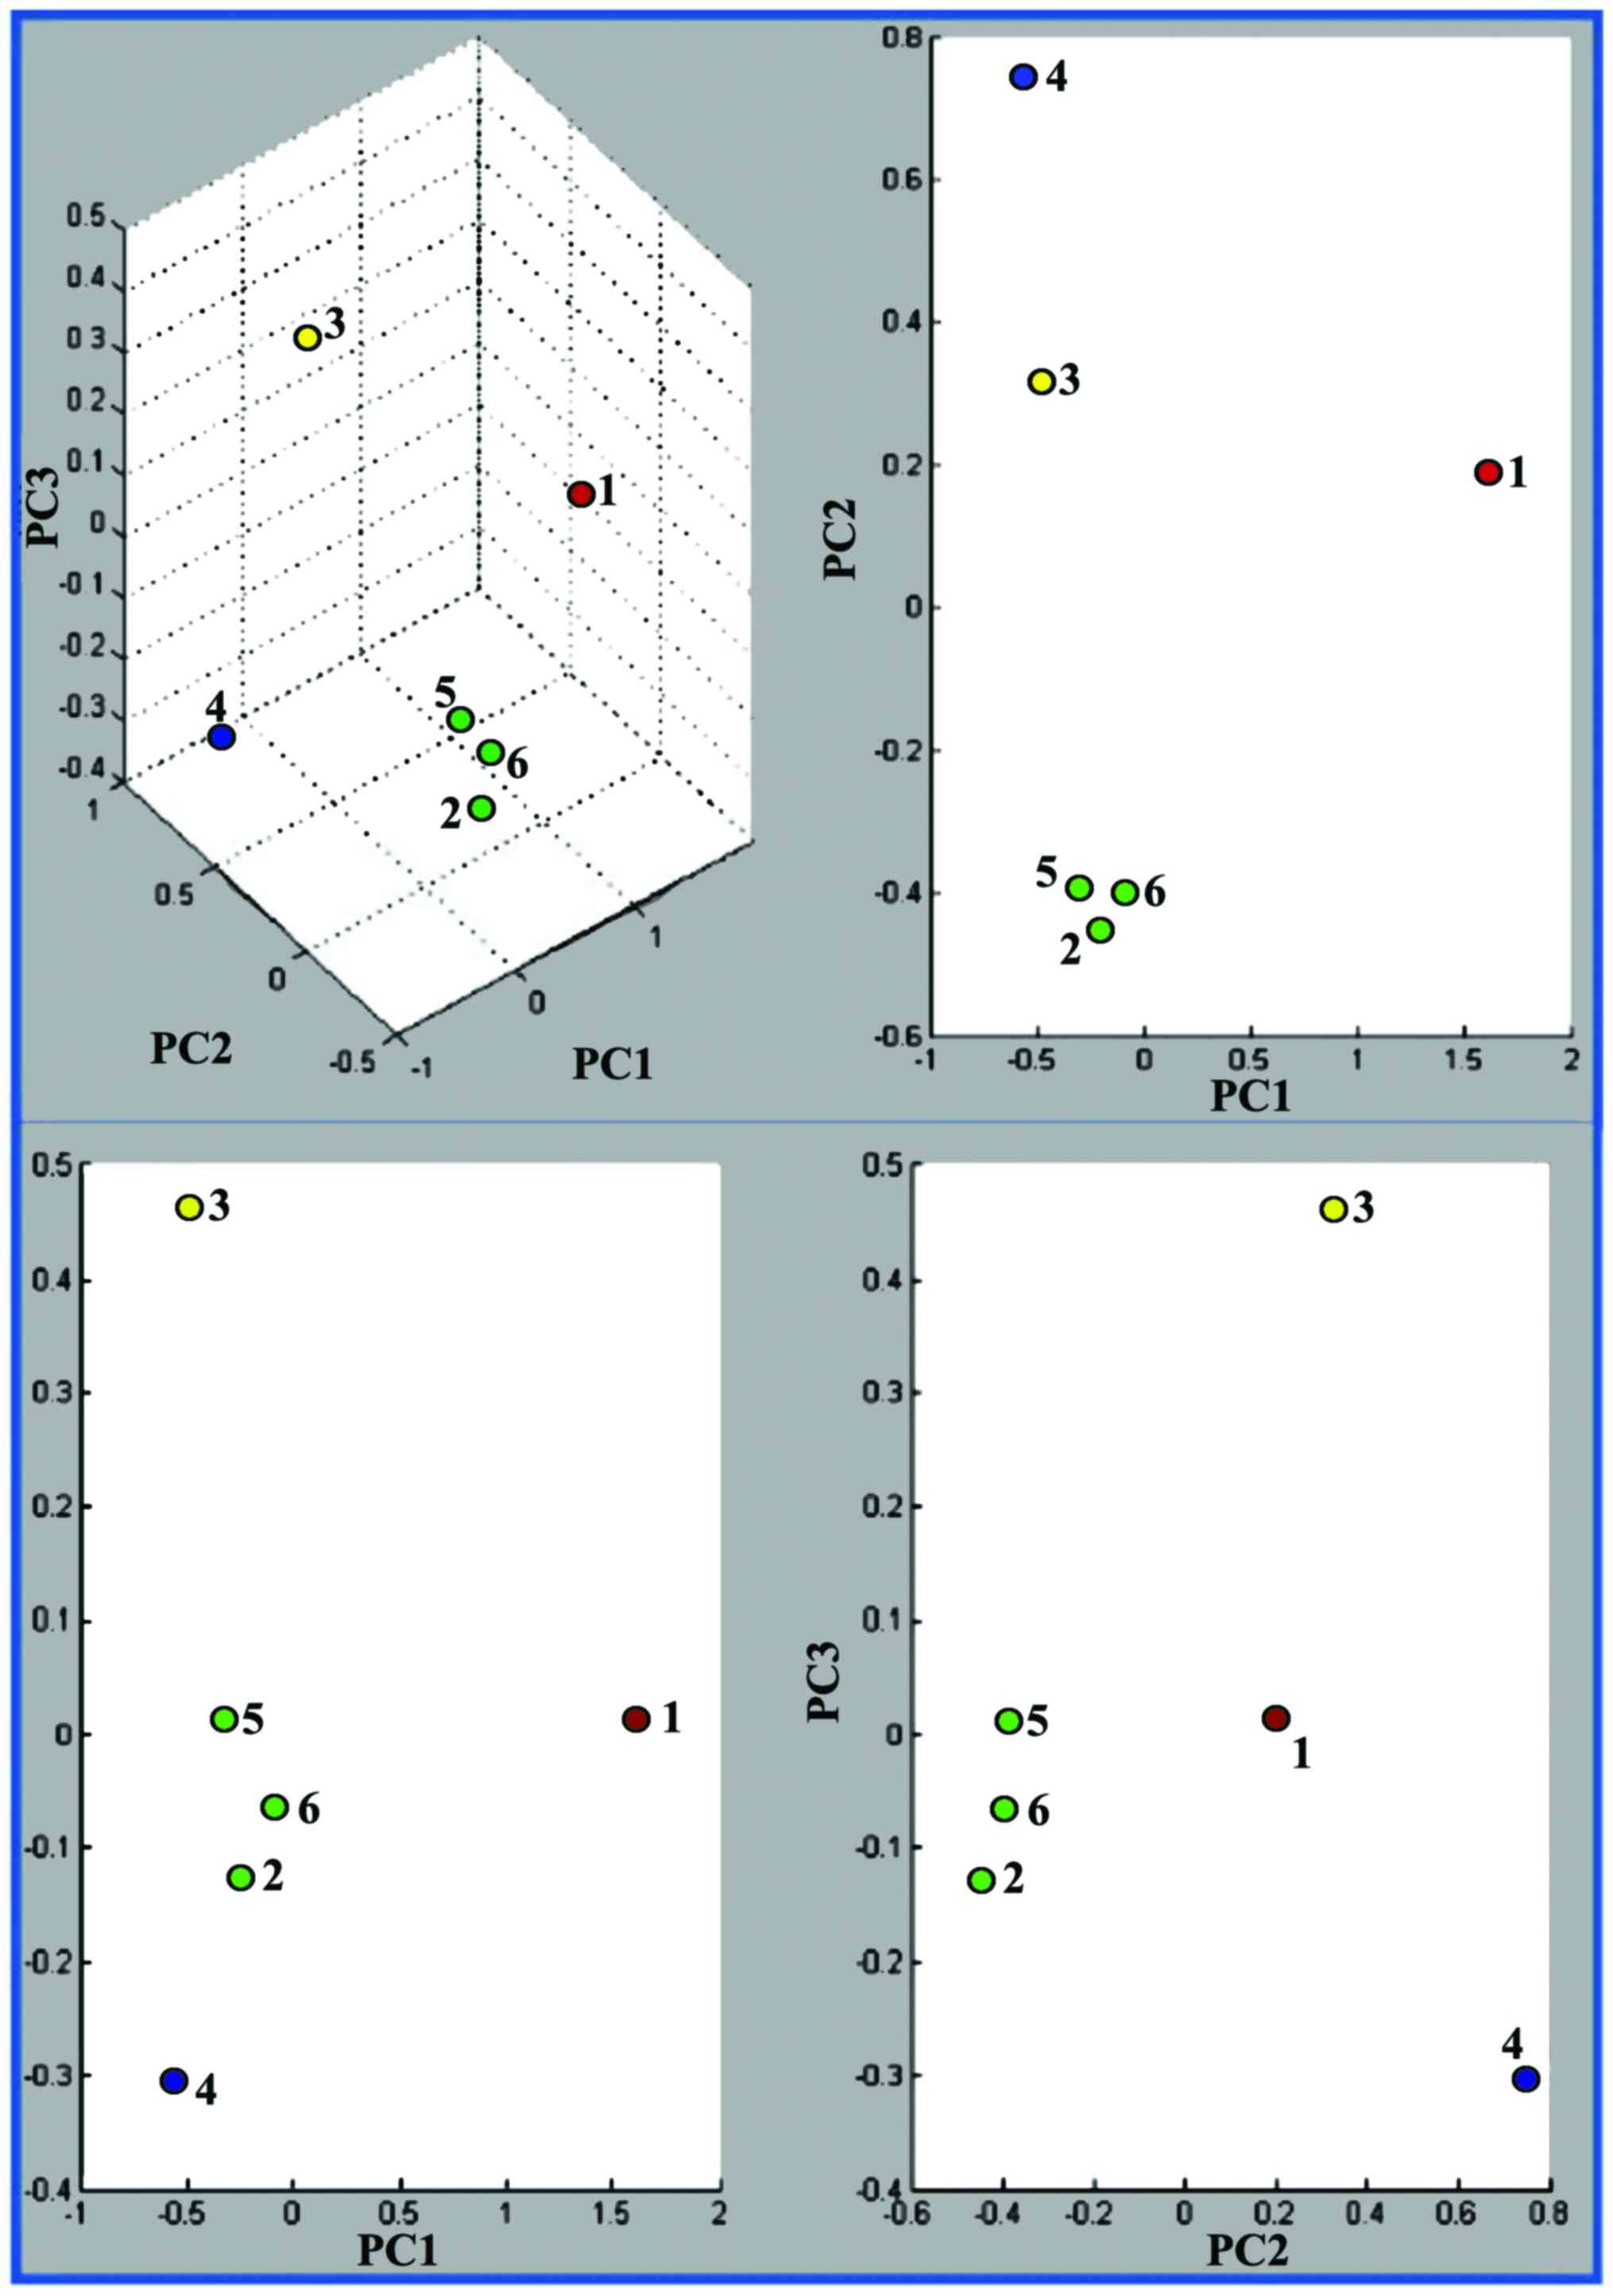 | Figure 5PCA spectra clustering using
9,500–12,500 m/z interval. The top left score plot is a 3D
plot of PC1 vs. PC2 vs. PC3 while on right is a 2D plots of PC1 vs.
PC2, bottom left is PC1 vs. PC3 and bottom right PC2 vs. PC3. Each
dot represents one spectra: 1, A375 (human melanoma); 2, HepG2
(human liver carcinoma); 3, B16-F0 (murine melanoma); 4, B164A5
(murine melanoma); 5, MCF7 (human breast carcinoma); and 6,
MDA-MB-231 (human breast carcinoma). PCA, principle component
analysis. |
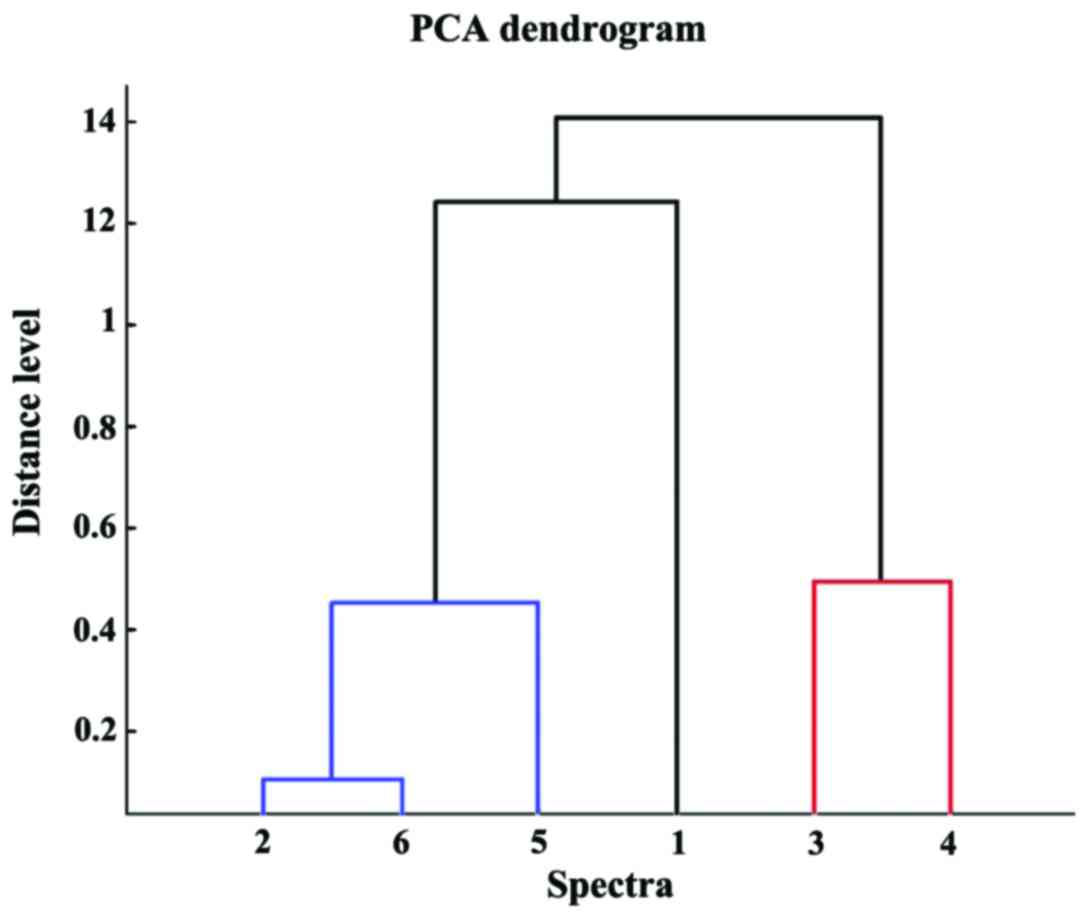
Within the human carcinoma cluster, and also in the
PCA dendrogram (Fig. 6) the
distance level that separated the breast carcinoma (MDA-MB-231)
cell line from the liver carcinoma (HepG2) cell line was shorter
than the distance level between the two breast carcinoma cell
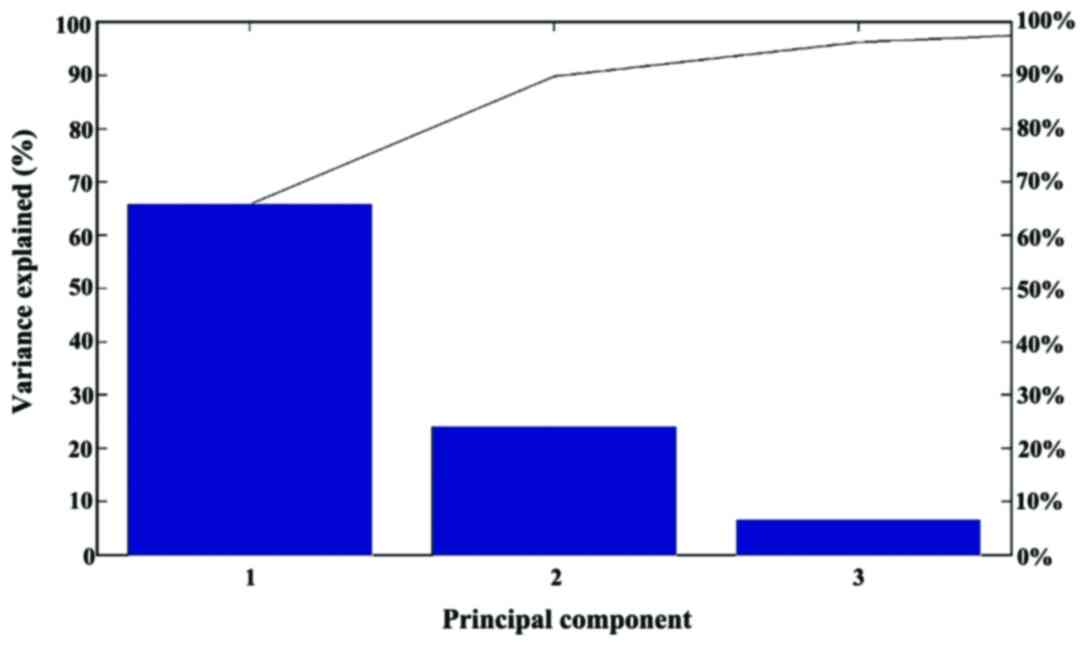
lines. The contribution of PC1, PC2 and PC3 was found to be 66, 24
and 7%, respectively (Fig.
7).
Creation and use of MSP
All MSP (Fig. 8)
were used to confirm the classification of cell lines. This yielded
a score for the level of similarity (Table I).
 | Table IThe classification results obtained
by comparing the MSP in rapport with each other. |
Table I
The classification results obtained
by comparing the MSP in rapport with each other.
Individual MSP
score
| Group MSP score
|
|---|
| Cell line | Score | Cell
group/type | Score |
|---|
| A375 | | | |
| A375 | 3 | Human melanoma | 3 |
| MDA-MB-231 | 1.832 | Human
carcinoma | 2.27 |
| B164A5 | 1.405 | Murine
melanoma | 0.641 |
| HepG2 | 1.397 | | |
| B16-F0 | 1.389 | | |
| MCF7 | 1.344 | | |
| HepG2 | | | |
| HepG2 | 3 | Human
carcinoma | 2.505 |
| MDA-MB-231 | 2.451 | Human melanoma | 1.397 |
| MCF7 | 2.109 | Murine
melanoma | 1.35 |
| A375 | 1.397 | | |
| B16-F0 | 1.386 | | |
| B164A5 | 1.003 | | |
| B16-F0 | | | |
| B16-F0 | 3 | Murine
melanoma | 2.782 |
| B164A5 | 2.479 | Human
carcinoma | 1.406 |
| HepG2 | 1.498 | Human melanoma | 1.389 |
| A375 | 1.389 | | |
| MDA-MB-231 | 1.329 | | |
| MCF7 | 1.304 | | |
| B164A5 | | | |
| B164A5 | 3 | Murine
melanoma | 2.659 |
| B16-F0 | 2.48 | Human melanoma | 1.405 |
| A375 | 1.405 | Human
carcinoma | <0 |
| MCF7 | 1.354 | | |
| HepG2 | 1.003 | | |
| MDA-MB-231 | 0.641 | | |
| MCF7 | | | |
| MCF7 | 3 | Human
carcinoma | 2.116 |
| HepG2 | 2.109 | Human melanoma | 1.344 |
| MDA-MB-231 | 1.464 | Murine
melanoma | 1.331 |
| B164A5 | 1.354 | | |
| A375 | 1.344 | | |
| B16-F0 | 1.304 | | |
| MDA-MB-231 | | | |
| MDA-MB-231 | 3 | Human
carcinoma | 2.443 |
| HepG2 | 2.449 | Human melanoma | 1.832 |
| A375 | 1.832 | Murine
melanoma | 0.574 |
| MCF7 | 1.466 | | |
| B164A5 | 1.393 | | |
| B16-F0 | 1.343 | | |
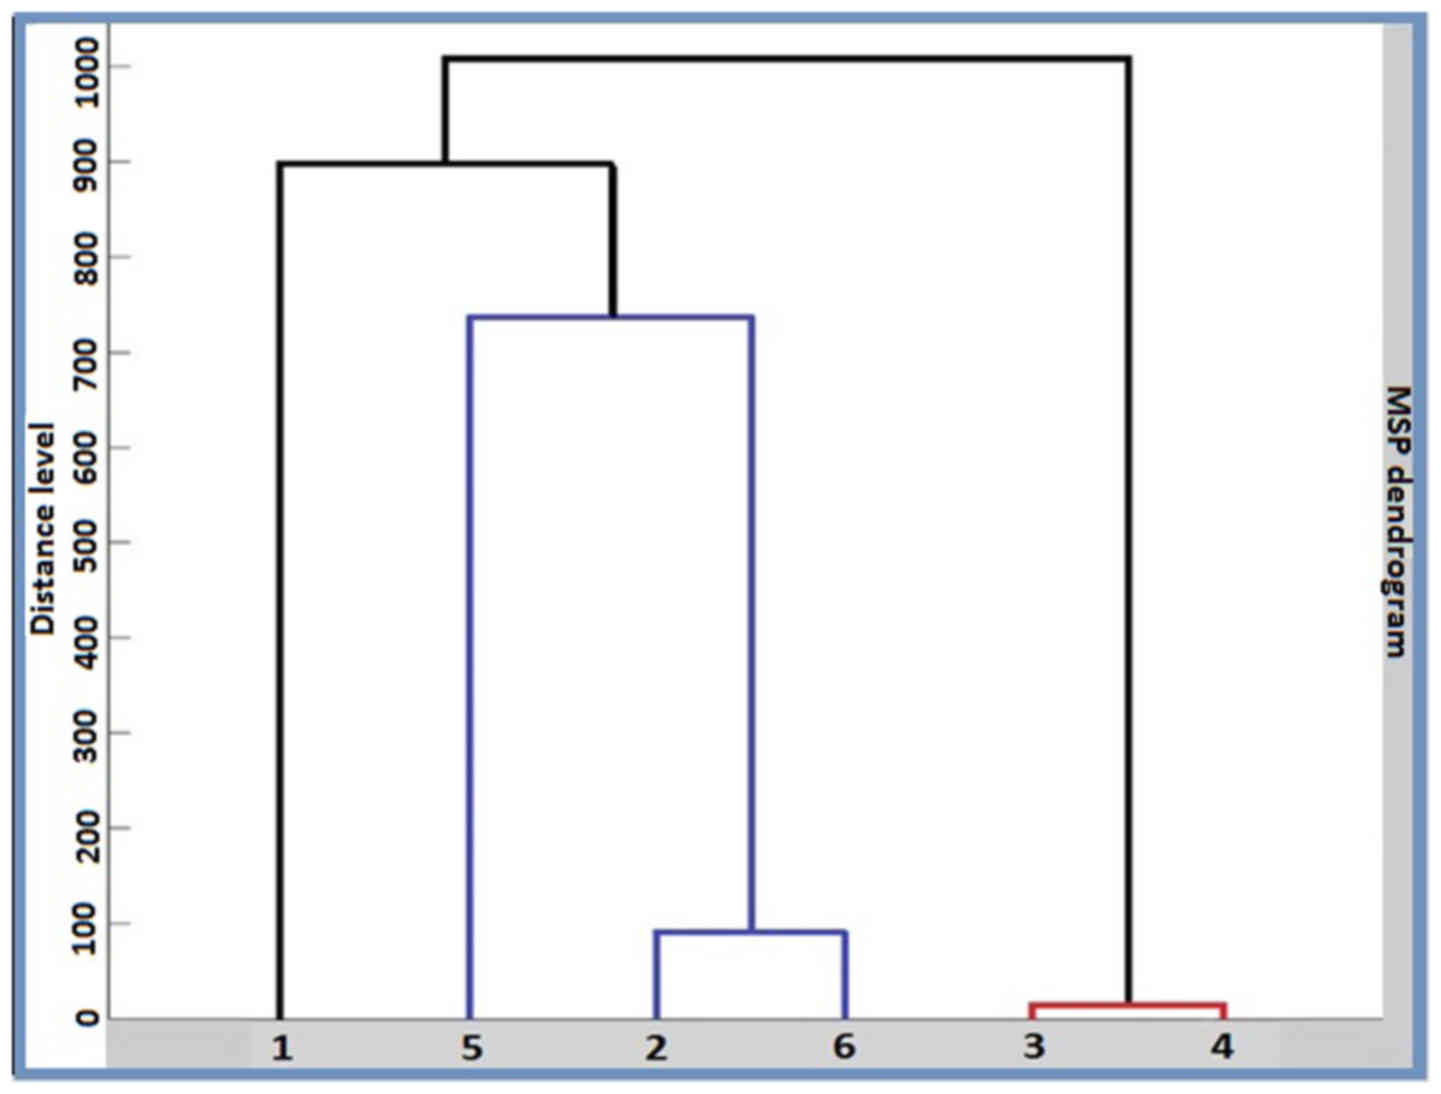
This was also illustrated as an MSP-based dendrogram
(Fig. 9). A score value of 3
represents the maximum similarity, while 0 represent no
relatedness. For individual MSP, the results revealed a similarity
between the same types of cancer. The only exception was the A375
MSP, where the second hit was a breast carcinoma. In the MSP
dendrogram however, all three human carcinoma cell lines (HepG2,
MDA-MB-231 and MCF7) were grouped in a separate subclade from human
carcinoma A375 cells. The murine melanoma cell lines (B164A5 and
B16-F0) formed separate clades from all the human cells. In
addition, within the human carcinoma clades, the distance level
that separated the breast carcinoma cell line (MDA-MB-231) and the
liver carcinoma cell line (HepG2) was shorter than the distance
level between the two breast carcinoma cell lines (MCF7 and
MDA-MB-231).
Discussion
MALDI mass spectrometry was firstly announced in the
late 1980's by Hillenkamp and Karas (14) who developed a novel ionization
technique that allowed the characterization of large biomolecules
as proteins by mass spectrophotometer (15). Further improvements of the initial
method propelled MALDI-TOF MS into the top of renowned tools for
proteomic research. This technique is characterized by a high
sensitivity, an ease of operation and automated capabilities, and
can be used for the analysis of small organic or large biochemical
compounds obtained from various sources (15,16). Apart from its great usability in
microbial identification, MALDI-TOF MS has proven to be a valuable
cancer diagnostic tool, being applied to detect biomarkers for a
plethora of cancer types, such as gastrointestinal cancer, lung
cancer, renal and bladder cancer, ovarian cancer, leukemia
(17), melanoma (18), breast carcinoma (19) and hepatic carcinoma (20).
The present study aimed to use the established
Bruker Biotyper protocol with minimum modifications for the
classification and differentiation of several human and murine
cancer cell lines. The choice of HCCA matrix was also supported by
evidence from a previous study on cell lines (6). The sample preparation process was
very simple, rapid and inexpensive, and it was found that using 70%
formic acid at a ratio of 20 µl for 1×10⁶ cells,
provided the optimal spectra quality. Following the addition of
acetonitrile, the final ratio was 0.025×10⁶ cells/ml. A
higher concentration of cells led to ion suppression, which
resulted in an increased noise level and fewer assigned peaks, a
fact previously reported by Povey et al (8). The formic acid extraction requires
only 2 min, a method that is faster compared with a previous report
by Povey et al (8), where
a 4-h-long incubation with the matrix at 3°C was used. Analysis can
therefore be performed using a reduced number of cells (250,000
cells). The analysis was performed in manual mode and the laser
intensity was adjusted manually to obtain the highest
signal-to-noise ratio. The method proved to have a very good
shot-to-shot and spot-to-spot reproducibility correlated to the new
application of this method in personalized medicine and tumor
heterogeneity observation (21).
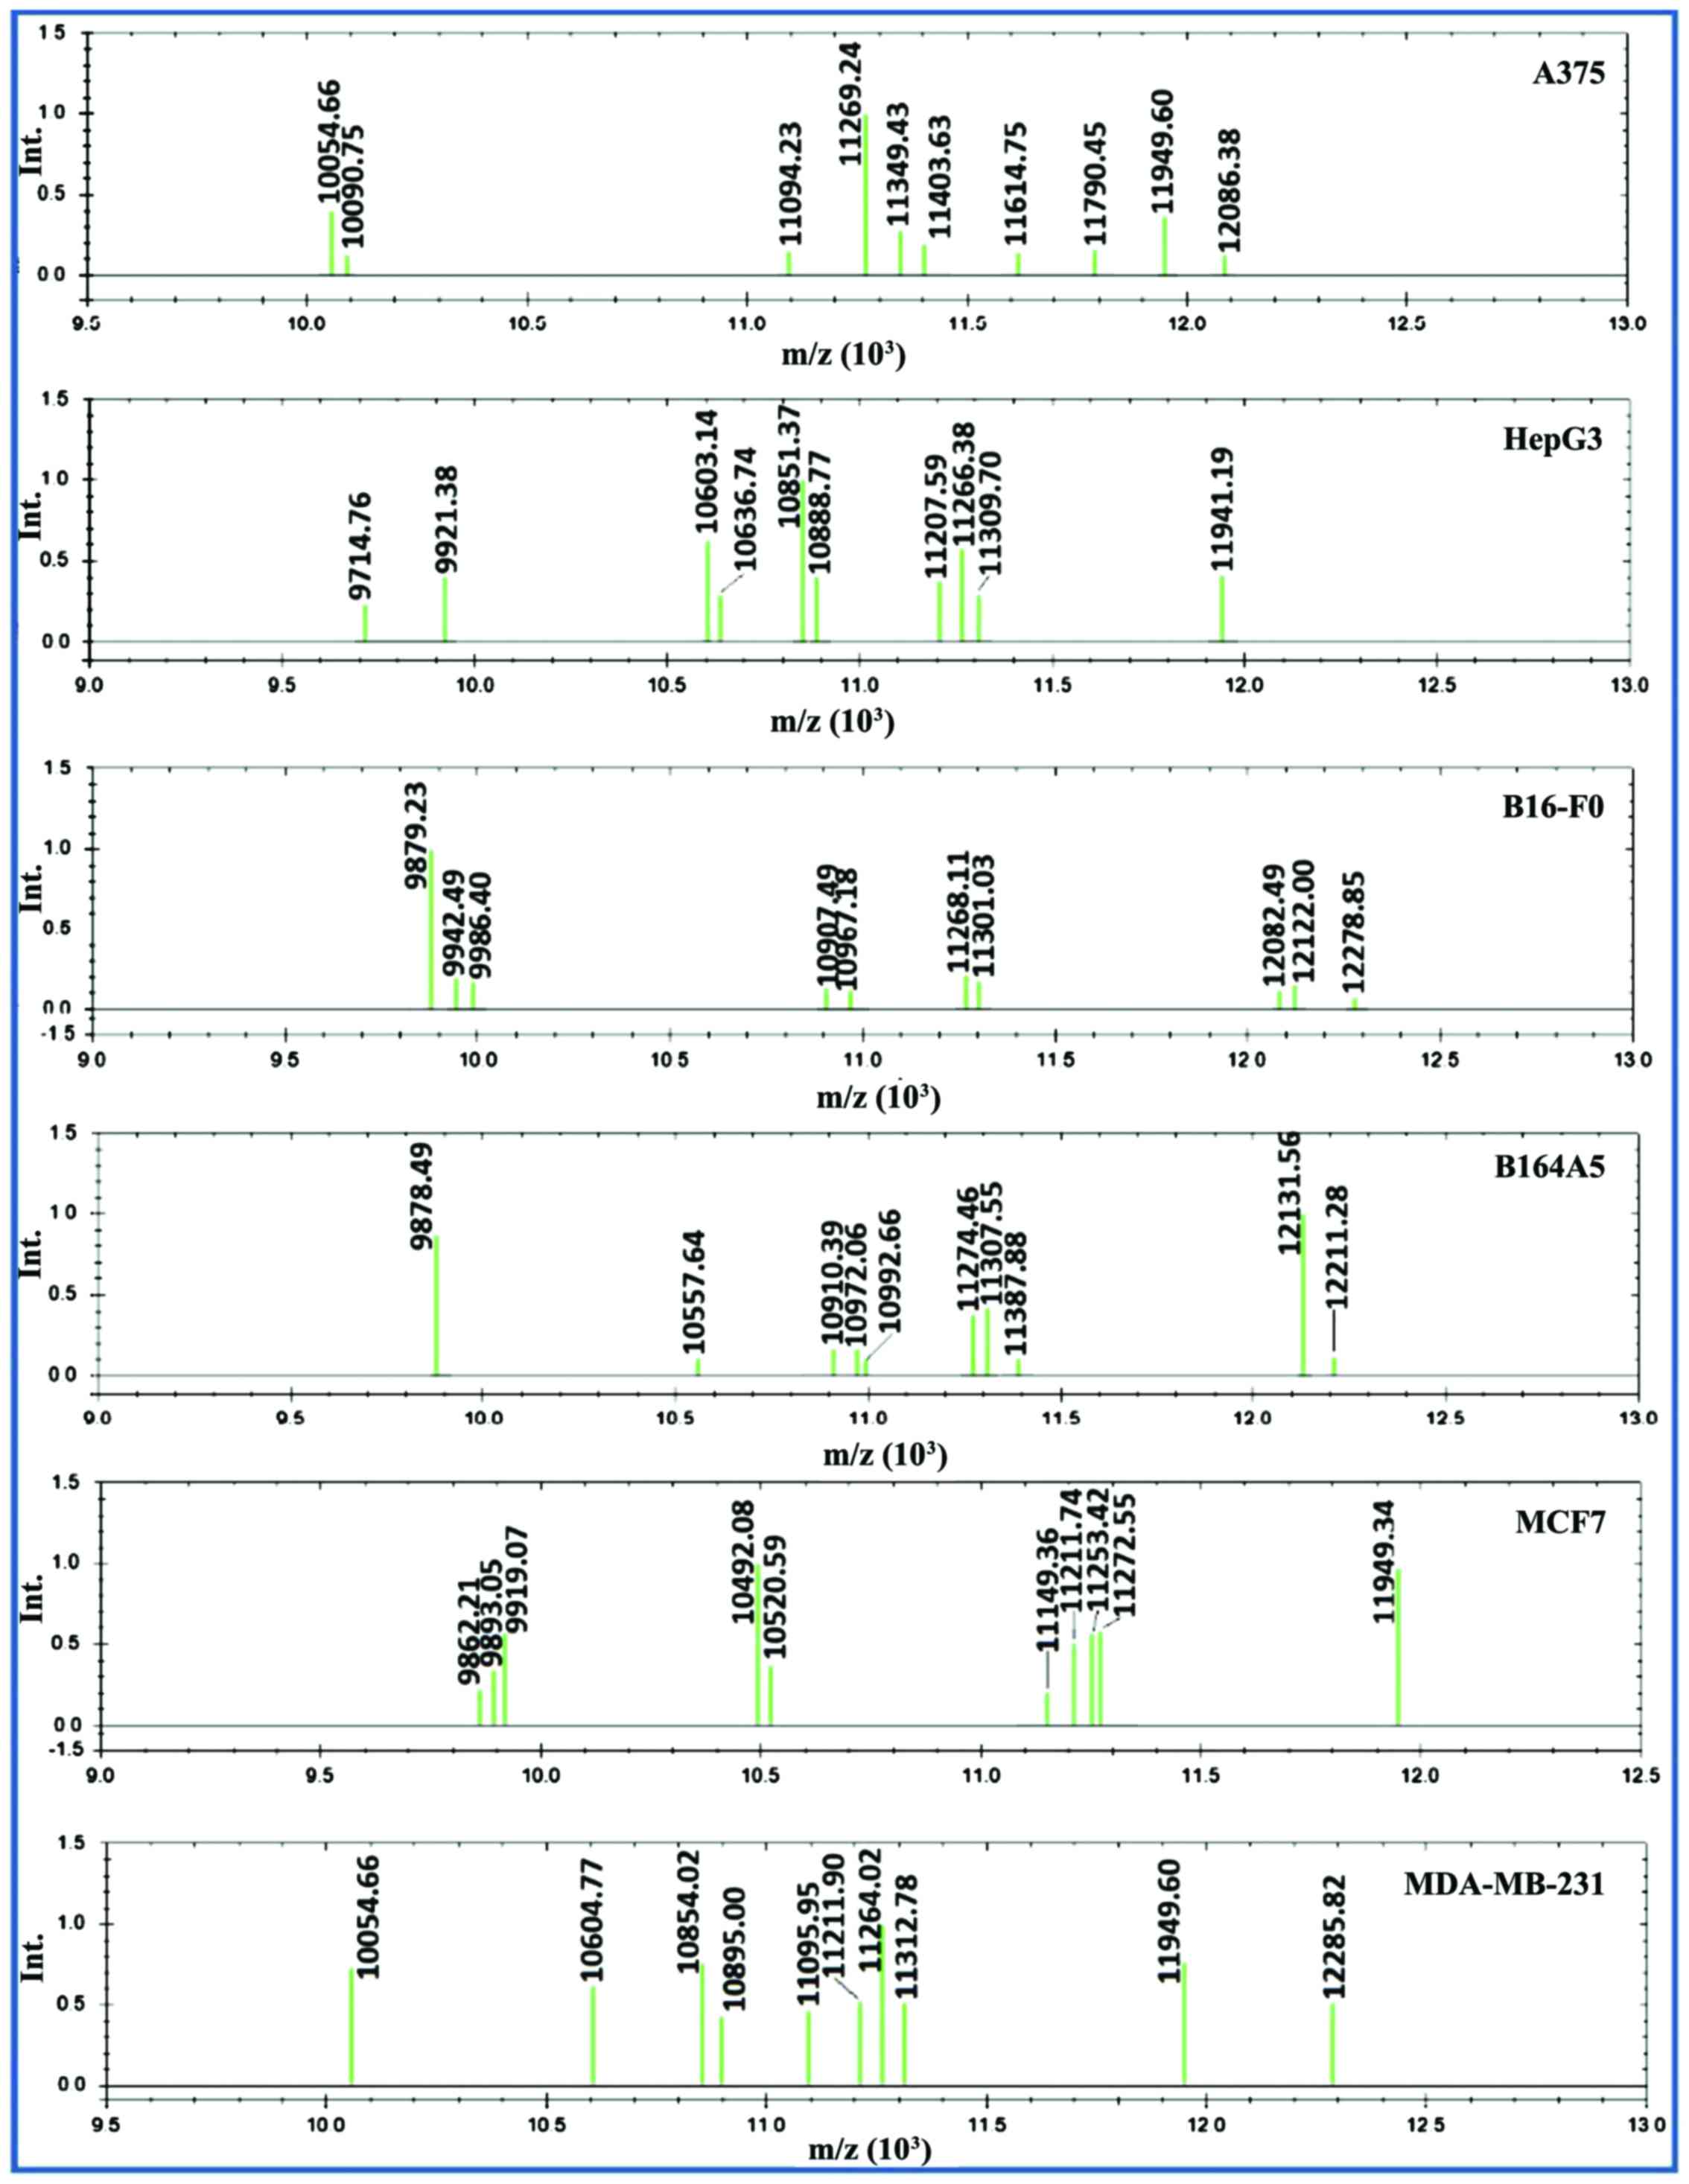
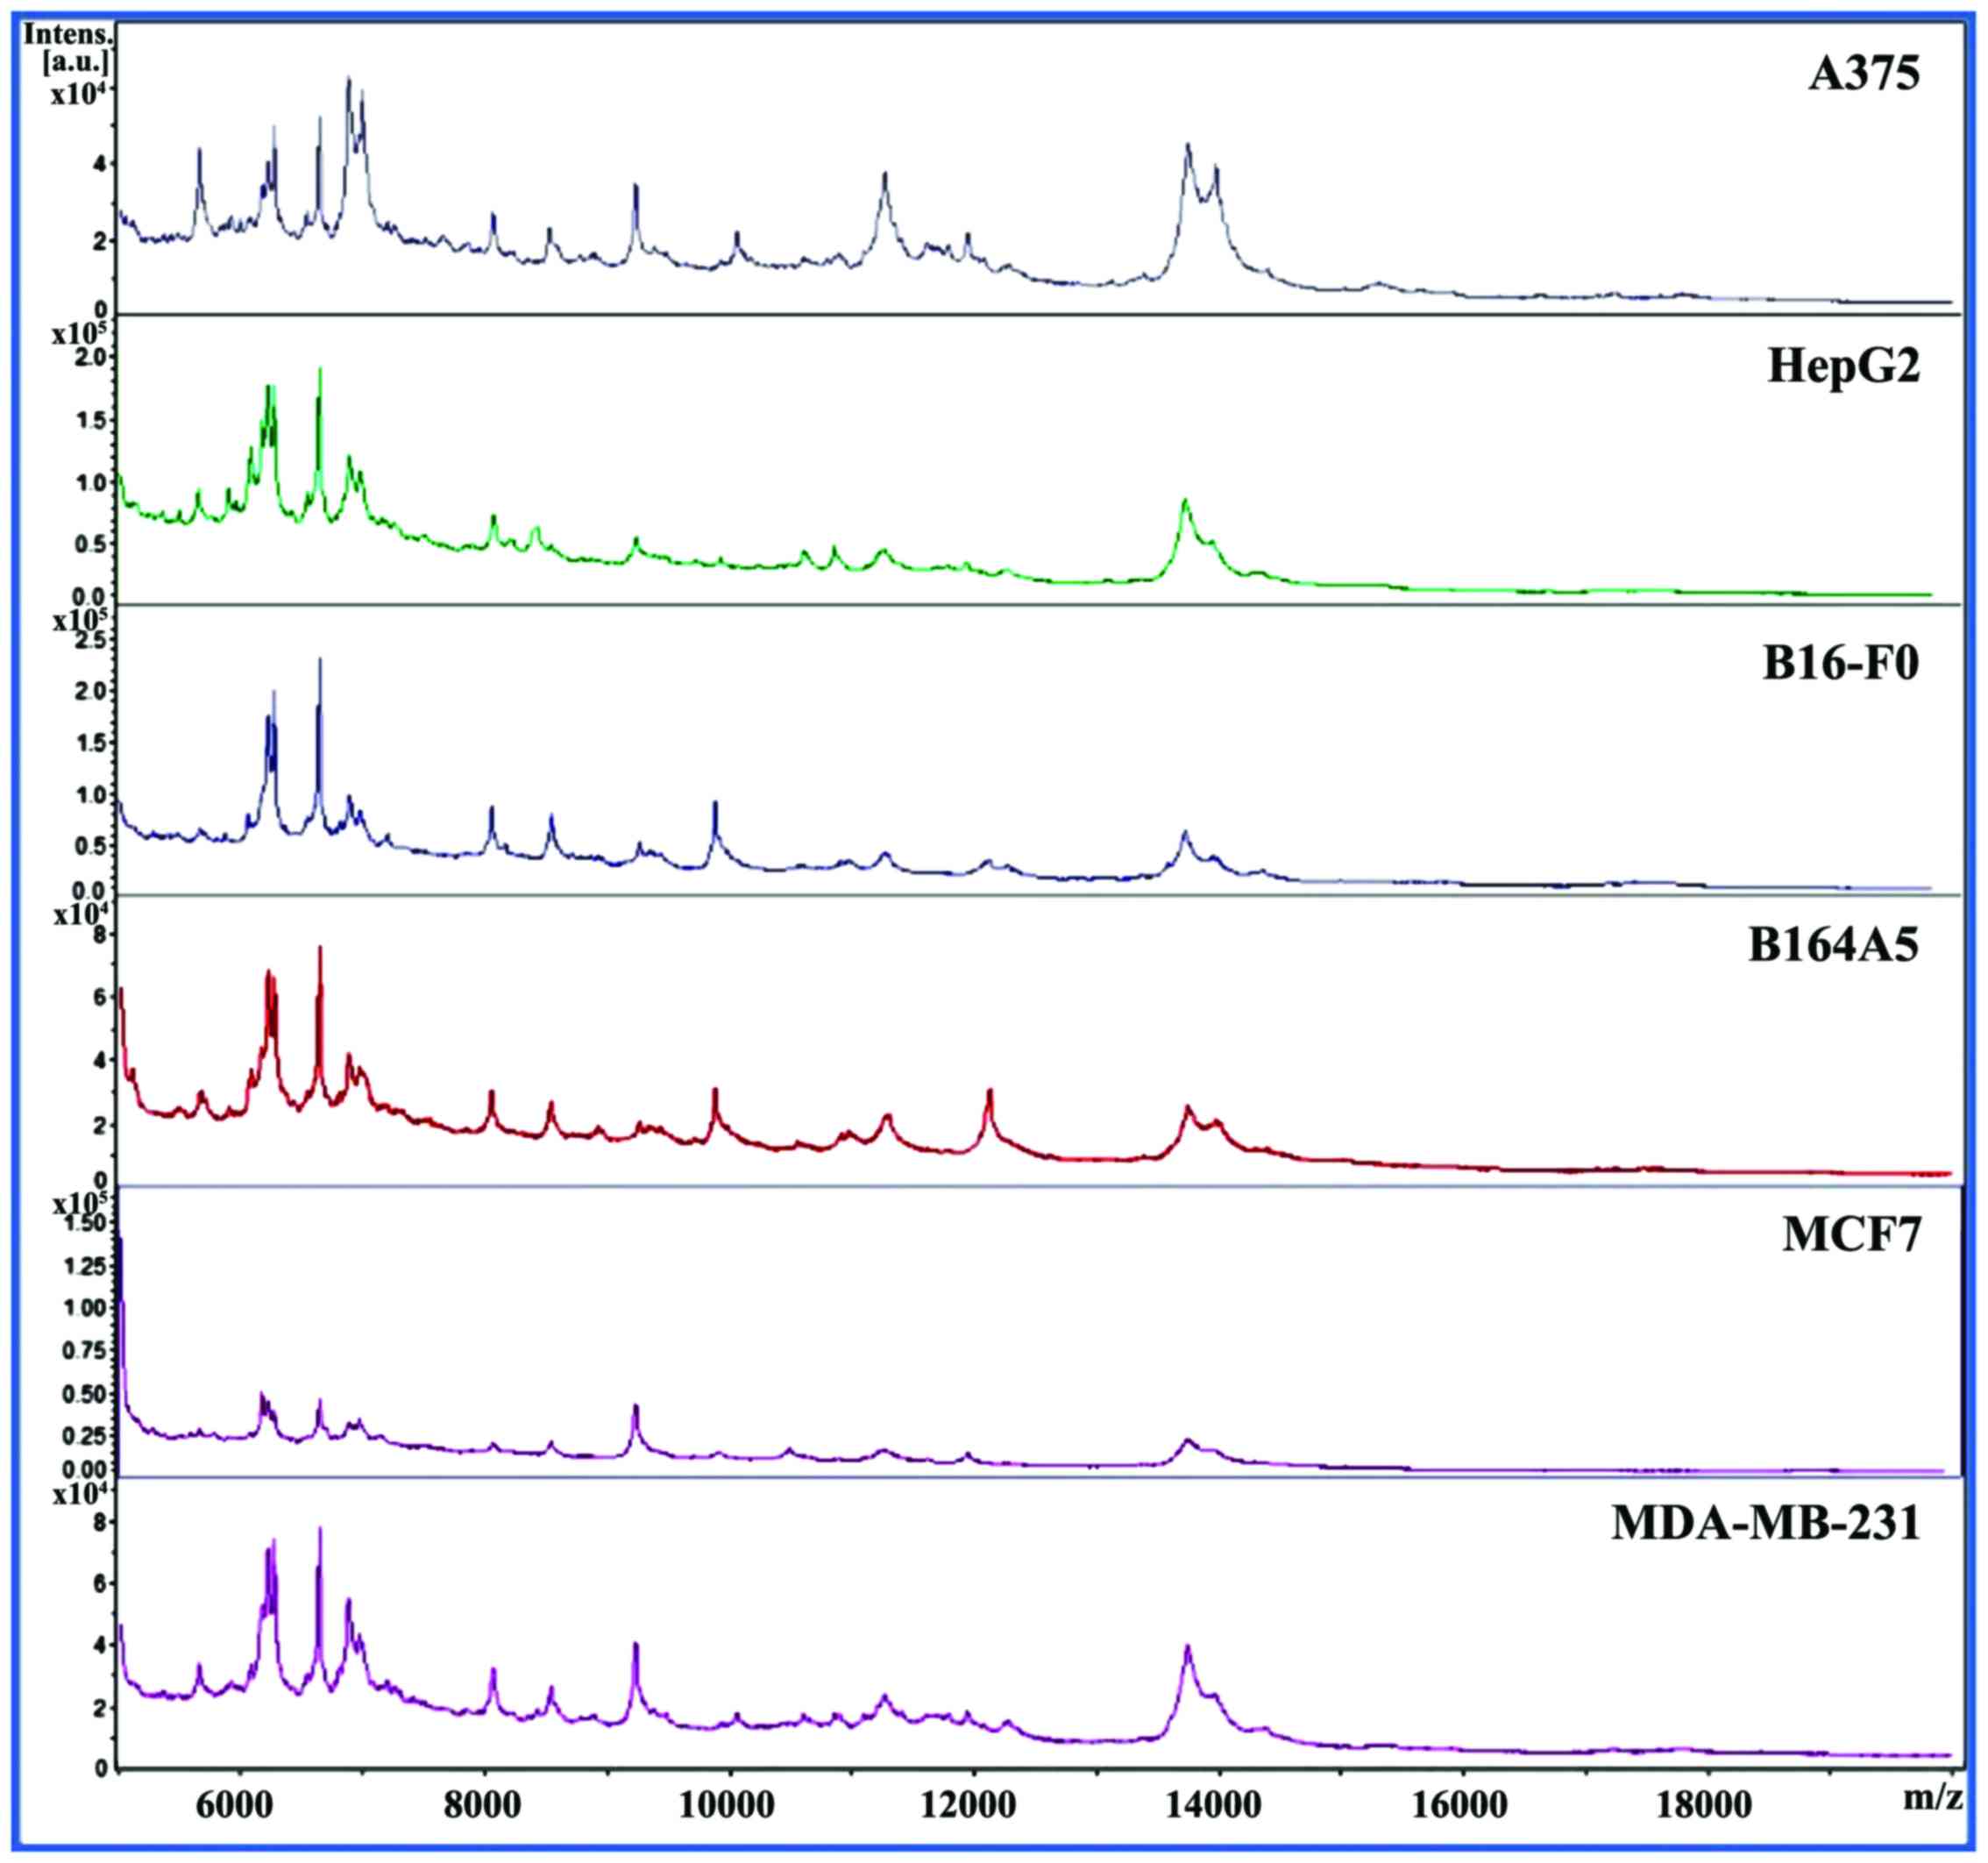
The most challenging step in this study was to
establish a spectra processing method able to transform raw spectra
(Fig. 10) into peak lists that,
once processed using PCA algorithm, provided a realistic
classification of the cell lines. This process involved three
steps: smoothing, baseline subtraction and peak picking. For both
smoothing and baseline subtraction the Bruker standard parameters
were used. However, for peak picking the 'local maximum' method was
used. This method is based on using the local maxima within a
defined window width (in our case 25 kDa) rather than the
differentiation of the entire spectrum as used in the standard
Biotyper method. This is motivated by the fact that the noise has
different intensities at different mass ranges. A maximum spectra
normalization was used; in this approach the most intense peak from
each spectrum is set to a value of 1 and the intensity of all other
signals is calculated relative to this (22). The signal-to-noise threshold was
set to 0.01. Thus, in order to be assigned, a peak should have a
relative intensity of at least 1% of the highest peak. By combining
all these parameters, we were able to eliminate most of the noise
and artefacts from raw spectra which otherwise resulted in
unrealistic classification of the cell lines.
The MALDI mass spectra consist of a type of
multivariate data, with each mass signal defining one molecular
dimension, and the process of evaluating mass spectra requires
multivariate statistical methods that grant the differentiation of
samples (16). A multivariate
statistical method used to analyze MALDI spectra is the PCA. The
principle of this method is represented by the extraction of
variance within a data set, reducing the dimensionality of the data
set while retaining the information present in the original data
set what leads to spectra with similar variation characteristics
that can be clustered together and the differences between samples
groups can be easily visualized in the system (16).
PCA analysis could be applied successfully on cancer
cells by using their group spectra for the differentiation of
pathology with a high sensitivity and selectivity (23). We began by performing PCA analysis
using the whole mass range of 5,000–20,000 m/z. As in the
MSP classification, this mass range proved to comprise too many
groups of variables which contain redundant information and
interfere with a realistic classification. By selecting the
m/z interval of 9,500–12,500, a minimized profile was
created which retains more meaningful peaks, and at the same time
eliminates peaks with similar behavior. The restricted mass range
also decreased the number of contributory principle components to
three (Fig. 7).
Since the PC3 contribution to the dataset variance
is low, the experiment could disregard it and take only the PC1/PC2
two-dimensional clustering into consideration, thus reducing the
dataset to an even lower dimensional space. The PC1/PC2 showed a
closer clustering of the three human carcinomas and of the two
murine melanomas. The human melanoma is plotted at a significant
distance from both murine melanoma and human carcinoma groups
(Fig. 5).
MALDI-imaging mass spectrometry (IMS) is also used
with PCA analysis in a similar manner as it was used in our study
(24). In MALDI-IMS, the PCA is
used to classify cells in a single tissue section, while in our
study it was used to classify different cell lines (25). The present approach can be used
for cancer studies in combination with MALDI-IMS. The combined
proteomic profiles from these two approaches can be compared
revealing further information about tumor complexity.
PCA analysis has been used in conjunction with Raman
spectroscopy in a cancer study by Bodanese et al (23) for the successful discrimination of
basal cell carcinoma and melanoma from normal skin biopsies. Raman
spectroscopy is a spectroscopic technique which typically uses
electromagnetic radiation emitted by a sample when treated with a
laser (26). The major difference
from MALDI-TOF MS is that Raman microscopy does not use a laser to
ablate the proteins from the target. Although Raman spectroscopy
has proven to be a valuable technique, MALDI-TOF MS is a more
widely established as a routine technique in many laboratories
(27). It does not require
complex sample preparation and requires minimal training,
particularly after the technique was standardized and validated
(5).
MSP are used as an identification basis by the MALDI
Biotyper software. MSP are a reference spectra which contain one or
several peak lists assigned to a bacteria species or strain. In the
Biotyper identification workflow, one MSP should contain a certain
number of peaks. This will provide an unambiguous identification of
an unknown organism when its mass spectrum is compared to the
reference MSP stored in a database. The software generates scoring
values between 0 and 3. The higher the score value, the higher the
degree of similarity between the sample and the reference MSP.
Apart from identification, the generated MSPs can be used for
sample classification instead of raw spectra. We decided to use
this system to compare the obtained scores to the PCA
classification. In our case, the cumulated spectra (10 individual
spectra of 10,000 laser shots) were used for creating two types of
MSPs: individual MSPs which contain the peak list for one single
cell line and three group MSPs which contained the cumulated peak
list of the three main groups of cancers cells: human melanoma
(A375), human carcinoma (MDA-MB-231, HepG2 and MCF7) and murine
melanoma (B164A5 and B16-F0) cells. In this study, a combination of
parameters was tested and the optimum was used for MSP creation.
The use of the whole mass range of 5,000–20,000 m/z, did not
provide a realistic classification according to the type of cancer
and the originating species. Therefore, several mass ranges were
selected, as well as different numbers of peaks to be included in
the MSP. A number of ten peaks from the 9,500–12,500 m/z
interval proved to be more appropriate in providing realistic
results.
When compared to the group MSPs, all cell lines were
correctly attributed to their corresponding group (Table I). The differences between the
first and second hit were substantial providing an unambiguous
classification.
The MSP-based dendrogram (Fig. 9) revealed similar results to the
PCA-based one, proving consistency between the two approaches.
These results are in agreement with those described by Geiger et
al (2012) in a previous study in the way that species
relationship prevails to organ relationship, data obtained by using
an LTQ-Orbitrap family mass spectrometer with a 'high field'
Orbitrap mass analyzer (28). In
the present study, the species-based relationship was stronger than
the relationship between different types of cancer from which the
cells originated, a fact that was revealed for the first time by
the means of the MALDI-TOF MS technique. In addition, the
restricted mass range of 9,500–12,500 m/z was not previously
reported.
The results revealed a closer relationship between
HepG2 (liver carcinoma) and MDA-MB-231 (breast carcinoma) than
between the two breast carcinomas cell lines. This can be explained
by a high degree of similarity between the proteomic profiles of
the different human cancer cell lines, a fact previously reported
(28). Another hypothesis for
this similarity is the adaptation of the cells to in vitro
culture which could lead to a clone selection based on their
proliferative potential with the loss of the functions that are not
vital (29). Although there were
similarities between the HepG2 and MDA-MB-231 cell lines, the
MSP-based scoring system revealed that the protein expression was
clearly distinct between the cell lines.
The distance level between the MCF7 and MDA-MB-231
cell lines revealed by MSP analysis could be explained by the fact
that, even though these cell lines have the same origin (pleural
effusions of metastatic mammary patients), the MCF7 cell line
(non-invasive cells) expresses specific markers for luminal
epithelial phenotype and is employed as a model for estrogen
receptor-positive tumors, whereas the MDA-MB-231 cell line
(invasive cells) expresses mesenchymal markers (vimentin) and is
used for estrogen receptor-negative breast cancers (30). Moreover, there were observed
significant differences between the MCF7 and MDA-MB-231 proteomic
profiles (31).
In our previous study, it was shown that there are
differences between B16 murine melanoma cell sublines as regard
molecular profile and proliferation behavior, B164A5 being
described as a highly metastatic cell line (32). Moreover, the human melanoma cell
line, A375, proved to be a valuable asset in inducing reproducible
animal models with primary melanoma (33). The classification of melanoma
cells in different clades could be explained by the fact that they
originate from different species (human and murine), and in
addition, A375 cells are an amelanotic primary melanoma cell line
and their metastatic potential is lower compared to that of the
murine melanoma cells, B164A5 and B16-F0 (32,33).
The differences between the cancer cell lines tested
observed by applying MALDI-TOF MS assert the data that were
presented after microscopic evaluation in terms of shape and
invasive capacity.
In conclusion, although different, the two
statistical approaches (PCA and MSP) provided similar results. The
MSP-based approach can be used for building groups which contain
one cancer type or one cancer type from a given species. We were
able to differentiate the cells according to cancer type (carcinoma
versus melanoma) and the same cancer type originating from two
different species (human versus mice melanomas). This proves that
the MSP approach can be used not only to identify unknown samples,
but also for their classification.
The results highlighted the necessity to establish
minimized profiles comprising a restricted mass range. The
MALDI-TOF acquisition method could also be improved to obtain
maximum resolution for the newly establish mass range of
9,500–12,500 m/z. We do not exclude the possibility of other
discriminative peaks outside this range. However, this could not be
achieved using Biotyper software which does not allow direct peak
list editing.
Acknowledgments
This study was financially supported by a grant of
the Romanian National Authority for Scientific Research and
Innovation, CNCS-UEFISCDI, project no. PN-II-RU-TE-2014-4-2842
(Dorina Coricovac). This study was performed within the Center of
Genomic Medicine from the 'Victor Babes' University of Medicine and
Pharmacy Timisoara, POSCCE Project ID: 1854, SMIS code: 48749,
'Center of Genomic Medicine v2', contract no. 677/09.04.2015.
References
|
1
|
Kallow W, Erhard M, Shah HN, Raptakis E
and Welker M: MALDI-TOF MS for Microbial Identification: Years of
Experimental Development to an Established Protocol. Mass
Spectrometry for Microbial Proteomics. Shah HN and Gharbia SE: John
Wiley & Sons, Ltd; Chichester: pp. 255–276. 2010, View Article : Google Scholar
|
|
2
|
Shah HN and Gharbia SE: Mass Spectrometry
for Microbial Proteomics. John Wiley and Sons Ltd; Chichester, UK:
2010, View Article : Google Scholar
|
|
3
|
Yang C, He Z and Yu W: Comparison of
public peak detection algorithms for MALDI mass spectrometry data
analysis. BMC Bioinformatics. 10:42009. View Article : Google Scholar : PubMed/NCBI
|
|
4
|
Jarman KH, Daly DS, Anderson KK and Wahl
KL: A new approach to automated peak detection. Chemom Intell Lab
Syst. 69:61–76. 2003. View Article : Google Scholar
|
|
5
|
Singhal N, Kumar M, Kanaujia PK and Virdi
JS: MALDI-TOF mass spectrometry: An emerging technology for
microbial identification and diagnosis. Front Microbiol. 6:7912015.
View Article : Google Scholar : PubMed/NCBI
|
|
6
|
Karger A, Bettin B, Lenk M and
Mettenleiter TC: Rapid characterisation of cell cultures by
matrix-assisted laser desorption/ionisation mass spectrometric
typing. J Virol Methods. 164:116–121. 2010. View Article : Google Scholar
|
|
7
|
Zhang X, Scalf M, Berggren TW, Westphall
MS and Smith LM: Identification of mammalian cell lines using
MALDI-TOF and LC-ESI-MS/MS mass spectrometry. J Am Soc Mass
Spectrom. 17:490–499. 2006. View Article : Google Scholar : PubMed/NCBI
|
|
8
|
Povey JF, O'Malley CJ, Root T, Martin EB,
Montague GA, Feary M, Trim C, Lang DA, Alldread R, Racher AJ, et
al: Rapid high-throughput characterisation, classification and
selection of recombinant mammalian cell line phenotypes using
intact cell MALDI-ToF mass spectrometry fingerprinting and PLS-DA
modelling. J Biotechnol. 184:84–93. 2014. View Article : Google Scholar : PubMed/NCBI
|
|
9
|
Wang P, Gao Q, Suo Z, Munthe E, Solberg S,
Ma L, Wang M, Westerdaal NA, Kvalheim G and Gaudernack G:
Identification and characterization of cells with cancer stem cell
properties in human primary lung cancer cell lines. PLoS One.
8:e570202013. View Article : Google Scholar : PubMed/NCBI
|
|
10
|
Dirks WG and Drexler HG: Authentication of
Cancer Cell Lines by DNA Fingerprinting. Cancer Cell Culture:
methods and Protocols. 1st edition. Langdon SP: Humana Press;
Totowa, NJ: pp. 33–42. 2004
|
|
11
|
Greve B, Kelsch R, Spaniol K, Eich HT and
Götte M: Flow cytometry in cancer stem cell analysis and
separation. Cytometry A. 81:284–293. 2012. View Article : Google Scholar : PubMed/NCBI
|
|
12
|
Duraiyan J, Govindarajan R, Kaliyappan K
and Palanisamy M: Applications of immunohistochemistry. J Pharm
Bioallied Sci. 4(Suppl 2): S307–S309. 2012. View Article : Google Scholar : PubMed/NCBI
|
|
13
|
Coricovac DE, Moacă EA, Pinzaru I, Cîtu C,
Soica C, Mihali CV, Păcurariu C, Tutelyan VA, Tsatsakis A and
Dehelean CA: Biocompatible Colloidal Suspensions Based on Magnetic
Iron Oxide Nanoparticles: Synthesis, Characterization and
Toxicological Profile. Front Pharmacol. 8:1542017. View Article : Google Scholar : PubMed/NCBI
|
|
14
|
Hillenkamp F and Karas M: Mass
spectrometry of peptides and proteins by matrix-assisted
ultraviolet laser desorption/ionization. Methods Enzymol.
193:280–295. 1990. View Article : Google Scholar : PubMed/NCBI
|
|
15
|
Flatley B, Malone P and Cramer R: MALDI
mass spectrometry in prostate cancer biomarker discovery. Biochim
Biophys Acta. 1844:940–949. 2014. View Article : Google Scholar
|
|
16
|
Cho YT, Chiang YY, Shiea J and Hou MF:
Combining MALDI-TOF and molecular imaging with principal component
analysis for biomarker discovery and clinical diagnosis of cancer.
Genomic Medicine, Biomarkers and Health Sciences. 4:3–6. 2012.
View Article : Google Scholar
|
|
17
|
Rodrigo MA, Zitka O, Krizkova S, Moulick
A, Adam V and Kizek R: MALDI-TOF MS as evolving cancer diagnostic
tool: A review. J Pharm Biomed Anal. 95:245–255. 2014. View Article : Google Scholar : PubMed/NCBI
|
|
18
|
Nawarak J, Huang-Liu R, Kao SH, Liao HH,
Sinchaikul S, Chen ST and Cheng SL: Proteomics analysis of A375
human malignant melanoma cells in response to arbutin treatment.
Biochim Biophys Acta. 1794:159–167. 2009. View Article : Google Scholar
|
|
19
|
Heger Z, Rodrigo MA, Krizkova S, Zitka O,
Beklova M, Kizek R and Adam V: Identification of estrogen receptor
proteins in breast cancer cells using matrix-assisted laser
desorption/ionization time of flight mass spectrometry (Review).
Oncol Lett. 7:1341–1344. 2014.PubMed/NCBI
|
|
20
|
Corona G, De Lorenzo E, Elia C, Simula MP,
Avellini C, Baccarani U, Lupo F, Tiribelli C, Colombatti A and
Toffoli G: Differential proteomic analysis of hepatocellular
carcinoma. Int J Oncol. 36:93–99. 2010.
|
|
21
|
Kriegsmann J, Kriegsmann M and Casadonte
R: MALDI TOF imaging mass spectrometry in clinical pathology: A
valuable tool for cancer diagnostics (Review). Int J Oncol.
46:893–906. 2015. View Article : Google Scholar
|
|
22
|
Delorme A, Sejnowski T and Makeig S:
Enhanced detection of artifacts in EEG data using higher-order
statistics and independent component analysis. Neuroimage.
34:1443–1449. 2007. View Article : Google Scholar
|
|
23
|
Bodanese B, Silveira FL, Zângaro RA,
Pacheco MTT, Pasqualucci CA and Silveira L Jr: Discrimination of
basal cell carcinoma and melanoma from normal skin biopsies in
vitro through Raman spectroscopy and principal component analysis.
Photomed Laser Surg. 30:381–387. 2012. View Article : Google Scholar : PubMed/NCBI
|
|
24
|
Alexandrov T: MALDI imaging mass
spectrometry: Statistical data analysis and current computational
challenges. BMC Bioinformatics. 13(Suppl 16): S112012.PubMed/NCBI
|
|
25
|
Norris JL and Caprioli RM: Imaging mass
spectrometry: A new tool for pathology in a molecular age.
Proteomics Clin Appl. 7:733–738. 2013. View Article : Google Scholar : PubMed/NCBI
|
|
26
|
Bumbrah GS and Sharma RM: Raman
spectroscopy - Basic principle, instrumentation and selected
applications for the characterization of drugs of abuse. Egypt J
Forensic Sci. 6:209–215. 2016. View Article : Google Scholar
|
|
27
|
Ghebremedhin M, Heitkamp R, Yesupriya S,
Clay B and Crane NJ: Accurate and rapid differentiation of
Acinetobacter baumannii strains by Raman spectroscopy: a
comparative study. J Clin Microbiol. 55:2480–2490. 2017. View Article : Google Scholar : PubMed/NCBI
|
|
28
|
Geiger T, Wehner A, Schaab C, Cox J and
Mann M: Comparative proteomic analysis of eleven common cell lines
reveals ubiquitous but varying expression of most proteins. Mol
Cell Proteomics. 11:M111.0140502012. View Article : Google Scholar : PubMed/NCBI
|
|
29
|
Pan C, Kumar C, Bohl S, Klingmueller U and
Mann M: Comparative proteomic phenotyping of cell lines and primary
cells to assess preservation of cell type-specific functions. Mol
Cell Proteomics. 8:443–450. 2009. View Article : Google Scholar :
|
|
30
|
Mladkova J, Sanda M, Matouskova E and
Selicharova I: Phenotyping breast cancer cell lines EM-G3, HCC1937,
MCF7 and MDA-MB-231 using 2-D electrophoresis and affinity
chromatography for glutathione-binding proteins. BMC Cancer.
10:4492010. View Article : Google Scholar : PubMed/NCBI
|
|
31
|
Nagaraja GM, Othman M, Fox BP, Alsaber R,
Pellegrino CM, Zeng Y, Khanna R, Tamburini P, Swaroop A and Kandpal
RP: Gene expression signatures and biomarkers of noninvasive and
invasive breast cancer cells: Comprehensive profiles by
representational difference analysis, microarrays and proteomics.
Oncogene. 25:2328–2338. 2006. View Article : Google Scholar
|
|
32
|
Danciu C, Falamas A, Dehelean C, Soica C,
Radeke H, Barbu-Tudoran L, Bojin F, Pînzaru SC and Munteanu MF: A
characterization of four B16 murine melanoma cell sublines
molecular fingerprint and proliferation behavior. Cancer Cell Int.
13:752013. View Article : Google Scholar : PubMed/NCBI
|
|
33
|
Avram S, Coricovac DE, Pavel IZ, Pinzaru
I, Ghiulai R, Baderca F, Soica C, Muntean D, Branisteanu DE,
Spandidos DA, et al: Standardization of A375 human melanoma models
on chicken embryo chorioallantoic membrane and Balb/c nude mice.
Oncol Rep. 38:89–99. 2017. View Article : Google Scholar : PubMed/NCBI
|