Introduction
As liver cancer is the most prevalent primary liver
neoplasm and the fourth leading cause of malignancy-associated
death, it is considered one of the most aggressive tumors with
notable morbidity and mortality rates, presenting a serious
healthcare concern worldwide (1,2).
The World Health Organization predicts that the worldwide incidence
rate of liver cancer is increasing and may reach an annual
incidence of ~1 million new cases in the next decade (3-5).
Liver cancer is characterized by substantial molecular
heterogeneity and a poor prognosis (6,7).
Hence, the identification of reliable biomarkers to predict early
or accurate prognosis, as well as the development of new molecular
targeted therapeutic strategies for liver cancer is important.
Non-SMC condensin I complex subunit D2
(NCAPD2) is situated on chromosome 12p13.31 and is mainly
expressed in the cytoplasm (8).
It has been shown to mediate the recruitment and localization of
mitosis-associated proteins on chromosomes, which mainly
participate in chromosomal condensation and segregation during the
process of the cell cycle, thus affecting cell mitosis (9,10). NCAPD2 is a newly
discovered, tumor-associated gene; however, studies on
NCAPD2 are limited. It has been shown that NCAPD2
expression is abnormally high and exerts an important role in
numerous malignancies, such as colorectal cancer (11) and breast cancer (12), particularly triple-negative
breast cancer (TNBC) (13).
Furthermore, it has been revealed that NCAPD2 is an
independent prognostic indicator in liver cancer and is associated
with positive clinical outcomes, mainly based on the results of
bioinformatics analysis (14).
However, the expression pattern, exact biological roles and
molecular mechanisms of NCAPD2 in liver cancer remain
unknown.
In the current study, NCAPD2 expression was
investigated using public tumor databases, including The Cancer
Genome Atlas (TCGA), TNMplot and the International Cancer Genome
Consortium (ICGC). In addition, NCAPD2 expression was detected in
clinical tissues and its functions were assessed using in
vitro experiments. The results of the present study may provide
increased knowledge on liver cancer and delineate the biological
function of NCAPD2 in the progression of this type of cancer, which
may be useful for identifying novel prognostic targets or
developing anticancer therapeutic strategies for patients with
liver cancer.
Materials and methods
NCAPD2 expression in liver cancer using
public tumor databases
Three publicly available tumor databases, including
TNMplot (differential gene expression analysis in tumor, healthy
control and metastatic tissues, https://tnmplot.com/), TCGA (https://portal.gdc.cancer.gov/) and ICGC (https://dcc.icgc.org/), were used for the
investigation of NCAPD2 expression in liver cancer. From the
TNMplot database (15), which
uses gene chip or RNA-sequencing (RNA-seq) data to display the
analysis of specific genes in selected tissue types, data from 379
paracancerous liver tissues and 806 primary liver cancer tissues
were collected. TCGA-Genotype-Tissue Expression Project database
was used to identify 50 paracancerous liver tissues and 374 liver
cancer tissues. The ICGC database was used to identify 202
paracancerous liver tissues and 240 liver cancer tissues. The Human
Protein Atlas (HPA, https://www.proteinatlas.org/) is a public database
that was used to obtain proteome expression information of genes
from 44 paracancerous control tissues and 18 tumor tissues. The HPA
was used to investigate NCAPD2 protein expression in patients with
liver cancer.
Clinical specimens
Clinical specimens were fixed in 10% neutral
formalin at room temperature for 12-24 h and embedded in paraffin.
A total of 33 formalin-fixed paraffin-embedded (FFPE) specimens,
including 20 liver cancer and 13 paired adjacent non-cancerous
liver samples, were collected for validation from the Department of
Pathology, Taihe Hospital (Shiyan, China) between July and October
2023. The inclusion criteria of the clinical specimens were: i)
Confirmation of liver cancer diagnosis by senior pathologists using
tumor tissues from patients that did not undergo preoperative
radiotherapy or chemotherapy; and ii) patients were free of other
diseases, or their medical history revealed no other diseases apart
from liver cancer.
Immunohistochemistry (IHC) and reverse
transcription-quantitative PCR (RT-qPCR) assay
IHC detection of all FFPE slides was conducted using
EliVision methods according to the manufacturers' instructions.
Specifically, all 3-µm FFPE sections were dewaxed with xylene and
rehydrated with graded ethanol. After antigen repair with EDTA (pH
9.0) in a pressure cooker for 4 min, endogenous peroxidase activity
was blocked with 3% hydrogen peroxide in methanol for 10 min at
room temperature. The slides were then incubated with primary
antibodies (Table SI) at 37°C
for 1 h, were washed three times with PBS (3 min/wash), and were
incubated with horseradish peroxidase (HRP)-labeled secondary
antibody (cat. no. KIT-9923; Fuzhou Maixin Biotechnology
Development Co., Ltd.) at 37°C for 0.5 h. The nuclei were stained
with hematoxylin for 30 sec and the sections were washed with water
for bluing after 0.5% HCI-ethanol differentiation for 3 sec.
Finally, chromogen detection was performed using DAB Plus Kit (cat.
no. DAB-2032; Fuzhou Maixin Biotechnology Development Co., Ltd.) at
room temperature for 10 min.
All IHC staining results were scanned and scored by
at least two experienced pathologists. IHC staining of
NCPAD2+ cells was detected using light microscopy
(magnification, ×200 or ×100) and these cells were graded based on
quantity and intensity scores. Specifically, the quantity scoring
criteria were: 0, absent; 1, ≤10%; 2, 11-50%; 3, 51-75%; 4, >75%
and the intensity scoring criteria were: 0, no staining; 1, light
yellow; 2, brownish yellow; 3, dark brown. The quantity and
intensity scores were multiplied to yield an overall score ranging
between 0 and 12. The percentage of Ki67+ cells was
calculated as the percentage of Ki67+ cells to all cells
in the field of view at low magnification (×200).
Additionally, total RNA was extracted from FFPE
slides using the RNeasy FFPE kit (Qiagen GmbH) and total RNA was
then used to synthesize first-strand cDNA using the First Strand
cDNA Synthesis kit (Vazyme Biotech Co., Ltd.); these steps were
performed according to the manufacturers' protocols. qPCR was
carried out in an ABI Prism 7000 analyzer (Applied Biosystems;
Thermo Fisher Scientific, Inc.) using Green Mix SYBR (Vazyme
Biotech Co., Ltd.) and specific primers (Table SII) to determine mRNA
expression. The thermocycling conditions were as follows: initial
denaturation at 120 sec for 95°C, followed by 40 cycles at 95°C for
15 sec, 58°C for 15 sec and 72°C for 30 sec. GAPDH was used as an
endogenous control. All experiments were performed in triplicate.
The relative mRNA expression levels in liver cancer samples were
determined using the 2−ΔΔCq method (16). The primers were obtained from
Sangon Biotech Co., Ltd.
Association analysis of NCAPD2 and
clinicopathological signatures in liver cancer
The association between NCAPD2 expression and
the clinicopathological parameters of patients with liver cancer
was assessed using TCGA-liver cancer data. All patients with liver
cancer were divided into two subgroups based on median cut-off
values; the high NCAPD2 expression (n=187) and the low
NCAPD2 expression (n=187) groups. The distribution of
NCAPD2 expression in liver cancer in terms of age,
pathological TNM (pTNM) stage, histological grades and survival
status was plotted in an Sankey diagram. RNA-sequencing expression
profiles and corresponding clinical information for liver cancer
were downloaded from TCGA dataset. The package 'ggalluvial' of R
software (version 4.2.1) was used to build Sankey diagram (17). Subsequently, the prognostic
analysis of NCAPD2 expression in liver cancer was analyzed
including overall survival (OS) or disease-specific survival (DSS)
data from TCGA or the ICGC datasets based on Kaplan-Meier and
log-rank test. Furthermore, univariate Cox (uni-cox) and
multivariate Cox (multi-cox) regression analyses were applied to
investigate the relationship between NCAPD2 expression and
other clinicopathological signatures in TCGA-liver cancer data.
Immune infiltration and gene-set
enrichment analysis (GSEA)
Estimation of STromal and Immune cells in MAlignant
Tumor tissues using Expression data (ESTIMATE) assesses mesenchymal
and immune cells in malignant tumors using gene expression data.
The algorithm scores specific sets of genes by GSEA to obtain the
stromal and the immune scores of the tumor sample, and these two
scores are added together to obtain the ESTIMATE score, which can
be used to estimate tumor purity. With the ESTIMATE algorithm,
stromal and immune scores can be obtained for every sample, and
then the tumor samples can be classified into high- and
low-expression subgroups based on these scores, facilitating
subsequent bioinformatics analysis and research. Specifically,
immune infiltration analyses of the ESTIMATE algorithm, including
stromal and immune scores, and the ESTIMATE score were conducted
via the 'estimate' (version 1.0.13) package (18) in R (version 4.2.1) software
(https://www.r-project.org/).
Furthermore, the evaluation of immune cell abundance was derived
from the GSEA algorithm provided in the R package 'GSVA' (version
1.46.0) (19). For GSEA, the R
package GSVA (20,21) was used to investigate the
underlying molecular mechanisms of NCAPD2 in TCGA-liver
cancer data. Spearman's correlation coefficient was used to denote
the correlation between genes and pathway scores. Thresholds were
set at Spearman's correlation coefficient, rs>0.5.
P<0.05 was considered to indicate a statistically significant
difference.
Single-cell sequencing analysis
Integrated iMMune profiling of large adaptive CANcer
patient cohorts (IMMUcan), an online service platform established
by a team of researchers from the Institute of Research Saint-Louis
(Paris, France), collects single-cell sequencing data of >56
cancer types worldwide, and aims to create and integrate the
clinical, cellular and molecular profile of different tumor types
and the tumor immune microenvironment (22). The IMMUcan database provides
detailed clinical annotations that link cell types and gene
expression patterns to specific clinical patterns. It also provides
extensive functionality for analyzing multiple datasets. The
single-cell RNA-seq datasets GSE140228 (23) and GSE112271 (24) from the Gene Expression Omnibus
dataset (https://www.ncbi.nlm.nih.gov/geo/; Table SIII) were used to characterize
NCAPD2 expression in different cell clusters from liver
cancer.
Construction of NCAPD2 interference and
overexpression systems
NCAPD2 expression was assessed in the liver cancer
cell lines Huh7 (cat. no. CL-0120; Procell Life Science &
Technology Co. Ltd.), MHCC-97H (cat. no. TCH-C258; HyCyte), HepG2
(cat. no. CL-0103; Procell Life Science & Technology Co. Ltd.)
and LM3 (cat. no. TCH-C456; HyCyte). All cell lines used in the
current study were authenticated using short tandem repeat
profiling. In vitro assays involving HepG2 cells with small
interfering RNA (siRNA)-induced NCAPD2 knockdown using si-NCAPD2,
or Huh7 cells with pcDNA-NCAPD2 plasmid-induced NCAPD2
overexpression were performed to discover the molecular mechanisms
of NCAPD2 in liver cancer.
Cell culture
The liver cancer cell lines HepG2, Huh7, MHCC-97H
and LM3 were cultured in basic DMEM (cat. no. C11995500BT; Gibco;
Thermo Fisher Scientific, Inc.) supplemented with 10% fetal bovine
serum (Gibco; Thermo Fisher Scientific, Inc.) at 37°C and 5%
CO2. The culture medium was replaced every 2-3 days
until cell density reached >90% for passaging, and cells in the
logarithmic growth phase were used for RT-qPCR and subsequent
experiments.
Cell transfection
When cell density reached ~70%, 50 nmol plasmids or
50 nmol siRNAs were transfected into liver cancer cells using
Lipofectamine® 3000 (Invitrogen; Thermo Fisher
Scientific, Inc.) according to the manufacturer's instructions.
Huh7 cells were transfected with the NCAPD2 overexpression plasmid
pcDNA3.1-NCAPD2 (Zhuhai DL Biotech Co., Ltd.), and pcDNA3.1 was
used as a control. HepG2 cells were transfected with si-NCAPD2
(Guangzhou Ribobio Co., Ltd.; Table
SII), and si-negative control (NC) was used as a control. All
cell line experiments were performed at 37°C. The culture medium
was refreshed 6 h after transfection, and most other experiments
(RT-qPCR, cell proliferation, flow cytometry, cell invasion, cell
migration experiments, etc.) were carried out 24 h
post-transfection, with the exception of western blotting, which
was carried out 48 h post-transfection. The experiments were
performed in triplicate.
RT-qPCR
Total RNA was extracted from cell lines using
TRIzol® reagent (Invitrogen; Thermo Fisher Scientific,
Inc.), according to the manufacturer's instructions. Total RNA was
used to synthesize first-strand cDNA using the First Strand cDNA
Synthesis kit and qPCR was carried out as aforementioned.
Cell proliferation
A total of 5,000 cells/well were cultured in 96-well
plates, and MTT reagent (20 µl/well; Sigma-Aldrich; Merck KGaA) was
added at 24, 48 and 72 h in the dark. The supernatant was removed
after 4 h of incubation and DMSO (150 µl/well; Sigma-Aldrich; Merck
KGaA) was added. Optical density was measured at 495 nm.
Transwell assay
Cells were cultured in 12-well plates for 24 h, and
were then digested with trypsin and counted. Cell suspensions were
prepared using serum-free medium to ensure cell density was
5×10⁴ cells/well and were seeded into Transwell cell
culture chambers (24-well; pore size, 8 µm; cat. no. 3422; Corning,
Inc.). For the cell invasion experiments, Matrigel (cat. no.
356234; Corning, Inc.) was diluted and spread evenly in the upper
chamber, and was incubated at 37°C overnight. Subsequently, 200 µl
cell suspension was added to the upper chamber, 600 µl DMEM
supplemented with 10% fetal bovine serum was added to the lower
chamber, and the cells were incubated at 37°C for 24 h, after
which, images were captured. For the cell migration experiments,
the same steps were performed as for the invasion assay; however,
Matrigel-free chambers were used. Subsequently, the chambers were
fixed with anhydrous methanol for 30 min, stained with 0.1% crystal
violet for 20 min at room temperature and finally washed with
double-distilled water three times. Images were captured under a
light microscope after the chambers were dried to observe cell
migration and invasion.
Wound healing assay
Cells were cultured in 6-well plates for 24 h to
achieve uniform coverage of the entire culture plate, and were then
scratched vertically with a 200-µl pipette tip, washed three times
with PBS and cultured in serum-free medium. Cell migration was
observed at 0 and 48 h; images of the cells were captured under a
light microscope and cell migration was analyzed using ImageJ
(version 1.8.0; National Institutes of Health). Cell migration rate
(%)=(0 h scratch area −48 h scratch area)/0 h scratch area
×100.
Flow cytometry
For the cell cycle experiments, cells were digested
with 0.25% trypsin-EDTA solution, centrifuged for 100 × g at room
temperature for 5 min, and the cell precipitates were collected and
washed twice with PBS. Subsequently, 1.0×10⁴ cells were
fixed with 70% ethanol at 4°C overnight, and were then incubated
with 100 mg/l RNase A and 50 mg/l PI solution (Beyotime Institute
of Biotechnology) at 37°C for 30 min in the dark. Cell cycle
progression was assessed using a flow cytometer (FACSCalibur; BD
Biosciences), and the proportion of cells in each phase of the cell
cycle was analyzed using FlowJo7.6 software (FlowJo LLC).
For the cell apoptosis assay, the same trypsin
digestion was performed as for cell cycle experiments;
subsequently, the precipitate was collected and 1.0×10⁴
cells were washed twice with PBS and resuspended in 100 μl
PBS. Cells were then incubated with 8 μl FITC staining
solution for 15 min at room temperature and 2 μl PI staining
solution for 5 min at room temperature in the dark, according to
the instructions of the Annexin V-FITC/PI Apoptosis Double Staining
kit (cat. no. 556547; BD Biosciences). Finally, the apoptotic rate
was analyzed by flow cytometry (FACSCalibur) using FlowJo7.6
software.
Western blotting
Cells were lysed using RIPA lysis buffer (Beyotime
Institute of Biotechnology) and were placed on ice for 30 min
before the cell lysates were centrifuged at 4°C for 15 min. Protein
concentration was determined using the BCA assay (Beyotime
Institute of Biotechnology). Subsequently, proteins were incubated
for 10 min in loading buffer, and 30 μg protein/lane was
separated by SDS-PAGE on 10% gels and transferred to PVDF membranes
(MilliporeSigma). The membranes were incubated with 5% skimmed milk
powder at room temperature for 2 h, and TBS-1% Tween-20 (TBST;
neoFroxx GmbH) was used to wash the membrane three times (10
min/wash). Finally, the membranes were incubated with diluted
primary antibodies (Table SI)
overnight at 4°C, washed three times with TBST and then incubated
with HRP-linked secondary antibodies (1:5,000; anti-rabbit/mouse
IgG; cat. nos. 7074s and 7076s; Cell Signaling Technology, Inc.)
for 2 h at room temperature. The blots were visualized on a gel
imager (Bio-Rad Laboratories, Inc.) using an enhanced
chemiluminescence substrate kit (cat. no. BL523B; Biosharp Life
Sciences).
Statistical analysis
All statistical analyses were performed using
GraphPad Prism (version 8.0; Dotmatics). Data are expressed as the
mean ± SD and all in vitro experiments were performed in
triplicate. Paired Student's t-test was used to determine the
significance of differences between two paired groups. Unpaired
Student's t-test was used to determine the significance of
differences between two independent groups. To compare multiple
groups, one-way ANOVA followed by Bonferroni test was used. In
addition, the χ2 test, Fisher's exact test and log-rank
test were used, and non-parametric data were analyzed using
Mann-Whitney U test and Spearman's correlation coefficient.
P<0.05 was considered to indicate a statistically significant
difference.
Results
NCAPD2 is upregulated in liver cancer
compared with in control liver tissues
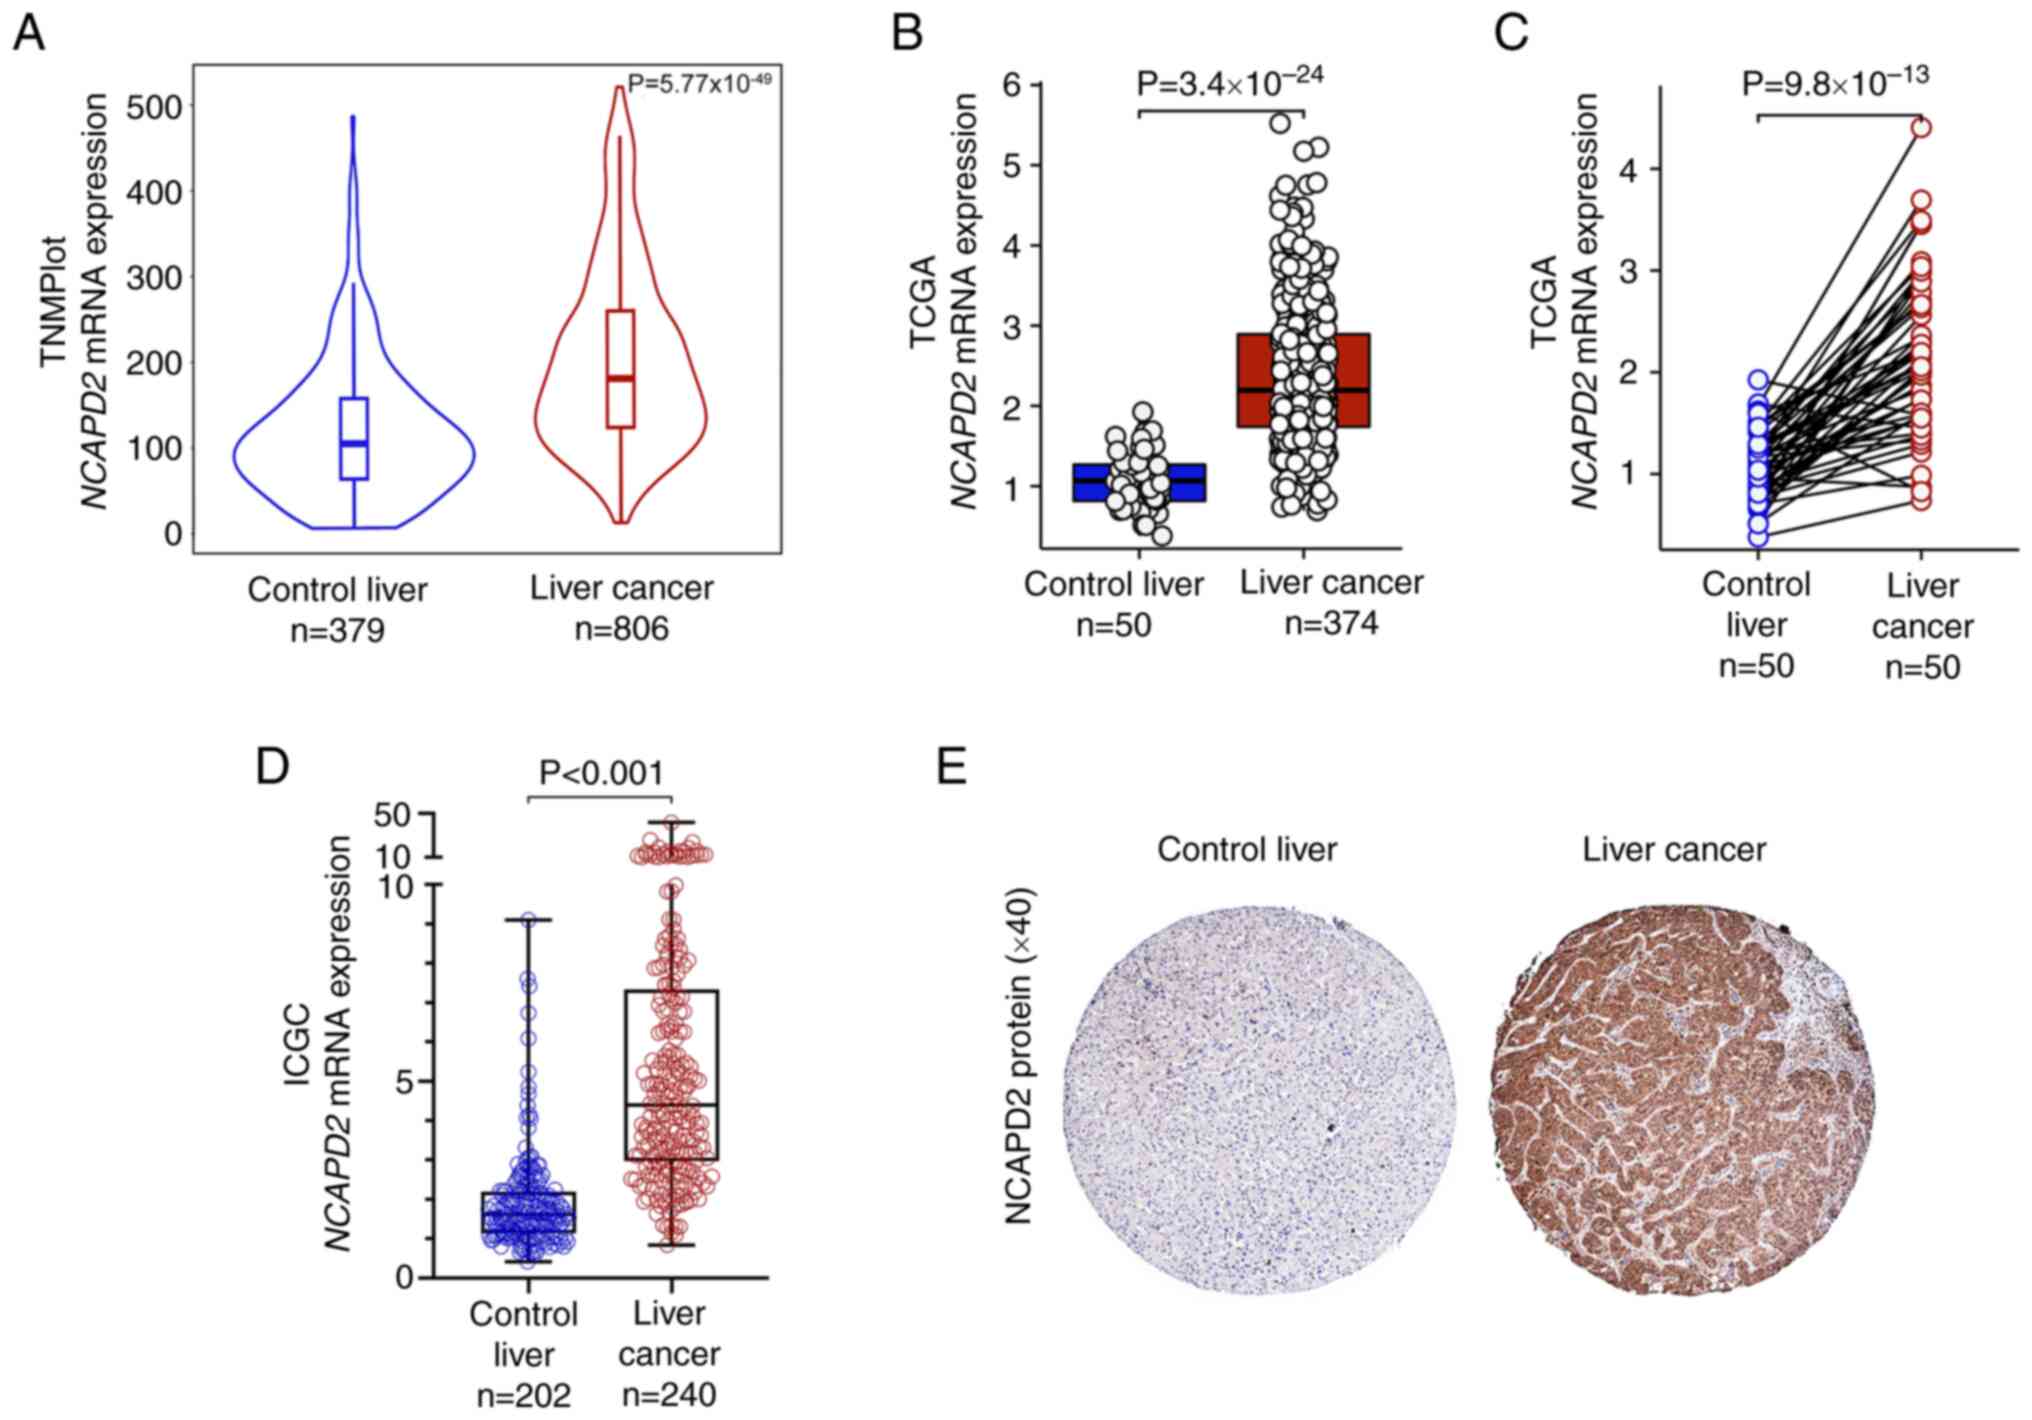
Based on the TNMplot, TCGA and ICGC databases,
bioinformatics analyses revealed that the mRNA expression levels of
NCAPD2 were upregulated in liver cancer tissues compared
with those in healthy control liver tissues (Fig. 1A-D). Furthermore, NCAPD2
mRNA expression was upregulated in liver cancer tissues compared
with in paired healthy control tissues (Fig. 1C). In terms of NCAPD2 protein
expression, the HPA dataset indicated that NCAPD2 was markedly
upregulated in liver cancer tissues compared with in healthy
control tissues (Fig. 1E).
Clinical validation of NCAPD2 expression
in patients with liver cancer
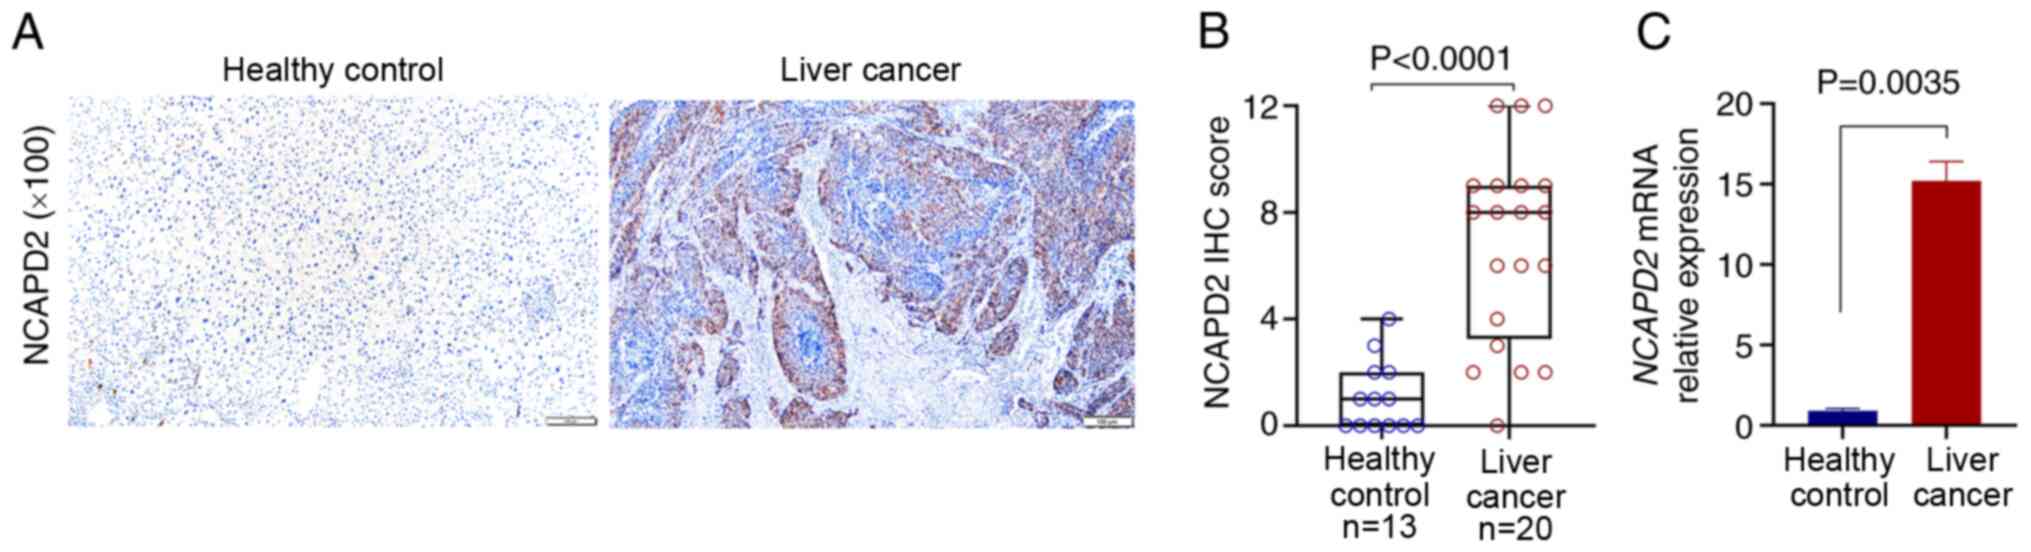
For the validation of NCAPD2 expression in patients
with liver cancer, 20 liver cancer tissues and 13 adjacent
non-cancerous samples were collected for IHC. The results suggested
that NCAPD2 was significantly higher in liver cancer tissues than
in adjacent non-cancerous tissues in terms of protein (Fig. 2A and B) and mRNA expression
levels (Fig. 2C).
NCAPD2 expression is positively
correlated with Ki67+ cells in liver cancer
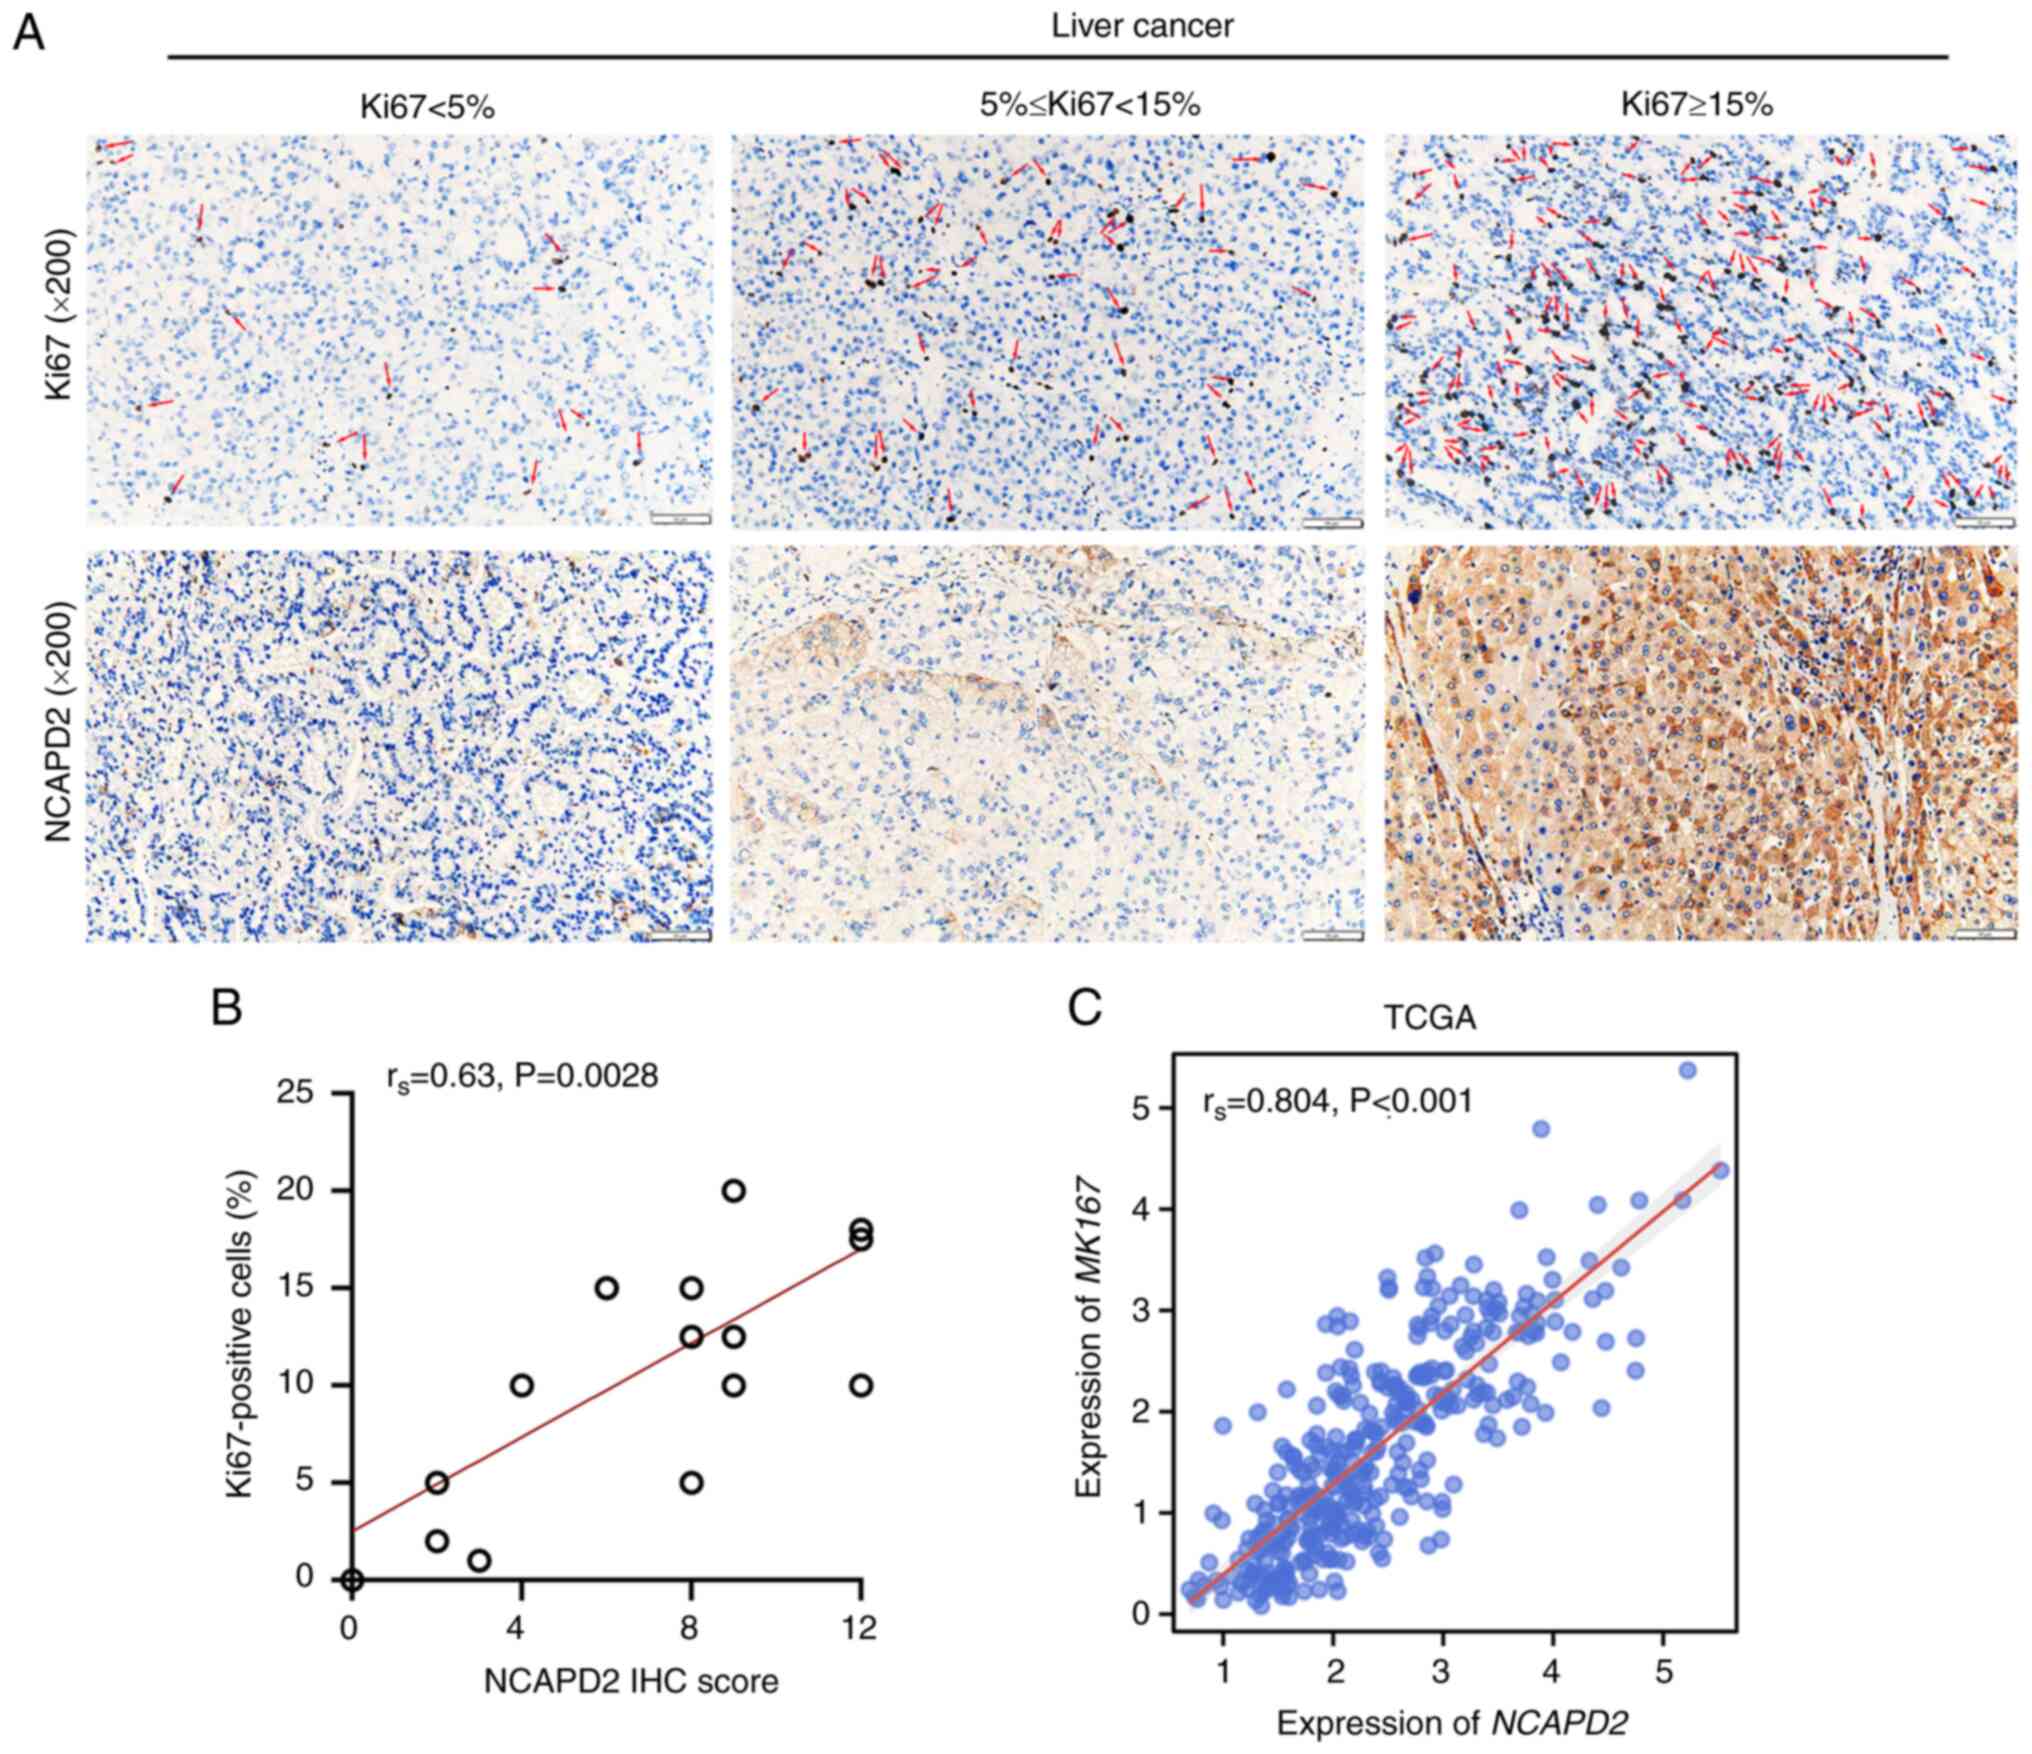
As a cell proliferation index, Ki67 was used to
investigate the relationship between NCAPD2 expression and
Ki67+ cells in liver cancer. It was suggested that
NCAPD2 expression, namely NCAPD2 IHC score, was positively
correlated with the proportion of Ki67+ cells (Fig. 3A and B). In addition, based on
TCGA-liver cancer data, NCAPD2 expression was positively
correlated with the expression of MKI67, the gene symbol of
Ki67 (Fig. 3C).
Analysis of the association between
NCAPD2 expression and clinicopathological characteristics in liver
cancer
The association of NCAPD2 and
clinicopathological parameters in liver cancer revealed that
NCAPD2 expression was significantly associated with age,
pTNM stage (especially T stage), histological grade and
α-fetoprotein (AFP; P<0.001), but not with sex, BMI, residual
tumor and Ishak fibrosis score (25) (Table SIV). In addition, an alluvial
diagram showed the distribution of NCAPD2 expression in
terms of age, pTNM stage, histological grade and survival status
(Fig. 4A). It suggested that
NCAPD2 expression was related to age, pTNM stage,
histological grade and survival status in liver cancer.
Furthermore, NCAPD2 expression was upregulated in patients
with advanced pTNM stage or advanced histological grade liver
cancer, or in those with higher AFP levels (>400 ng/ml) compared
with in the control subgroups (Fig.
4B-D). Subsequently, the prognostic analysis revealed that
upregulation of NCAPD2 was associated with poor OS and DSS
based on TCGA data (Fig. 4E and
F) or ICGC data (Fig. 4G).
The uni-cox and multi-cox regression analyses indicated that
NCAPD2 expression was strongly associated with prognosis,
and may serve as an independent prognostic marker of OS in patients
with liver cancer (Table SV).
Furthermore, among the common types of gene mutations in liver
cancer based on TCGA dataset, including TP53 and
CTNNB1 mutations, the analysis showed that NCAPD2
expression was increased in TP53 mutant (mut) compared with
in TP53 wild-type (wt) liver cancer (Fig. 4H). The expression of
NCAPD2 was not associated with CTNNB1 mutation
(Fig. 4I).
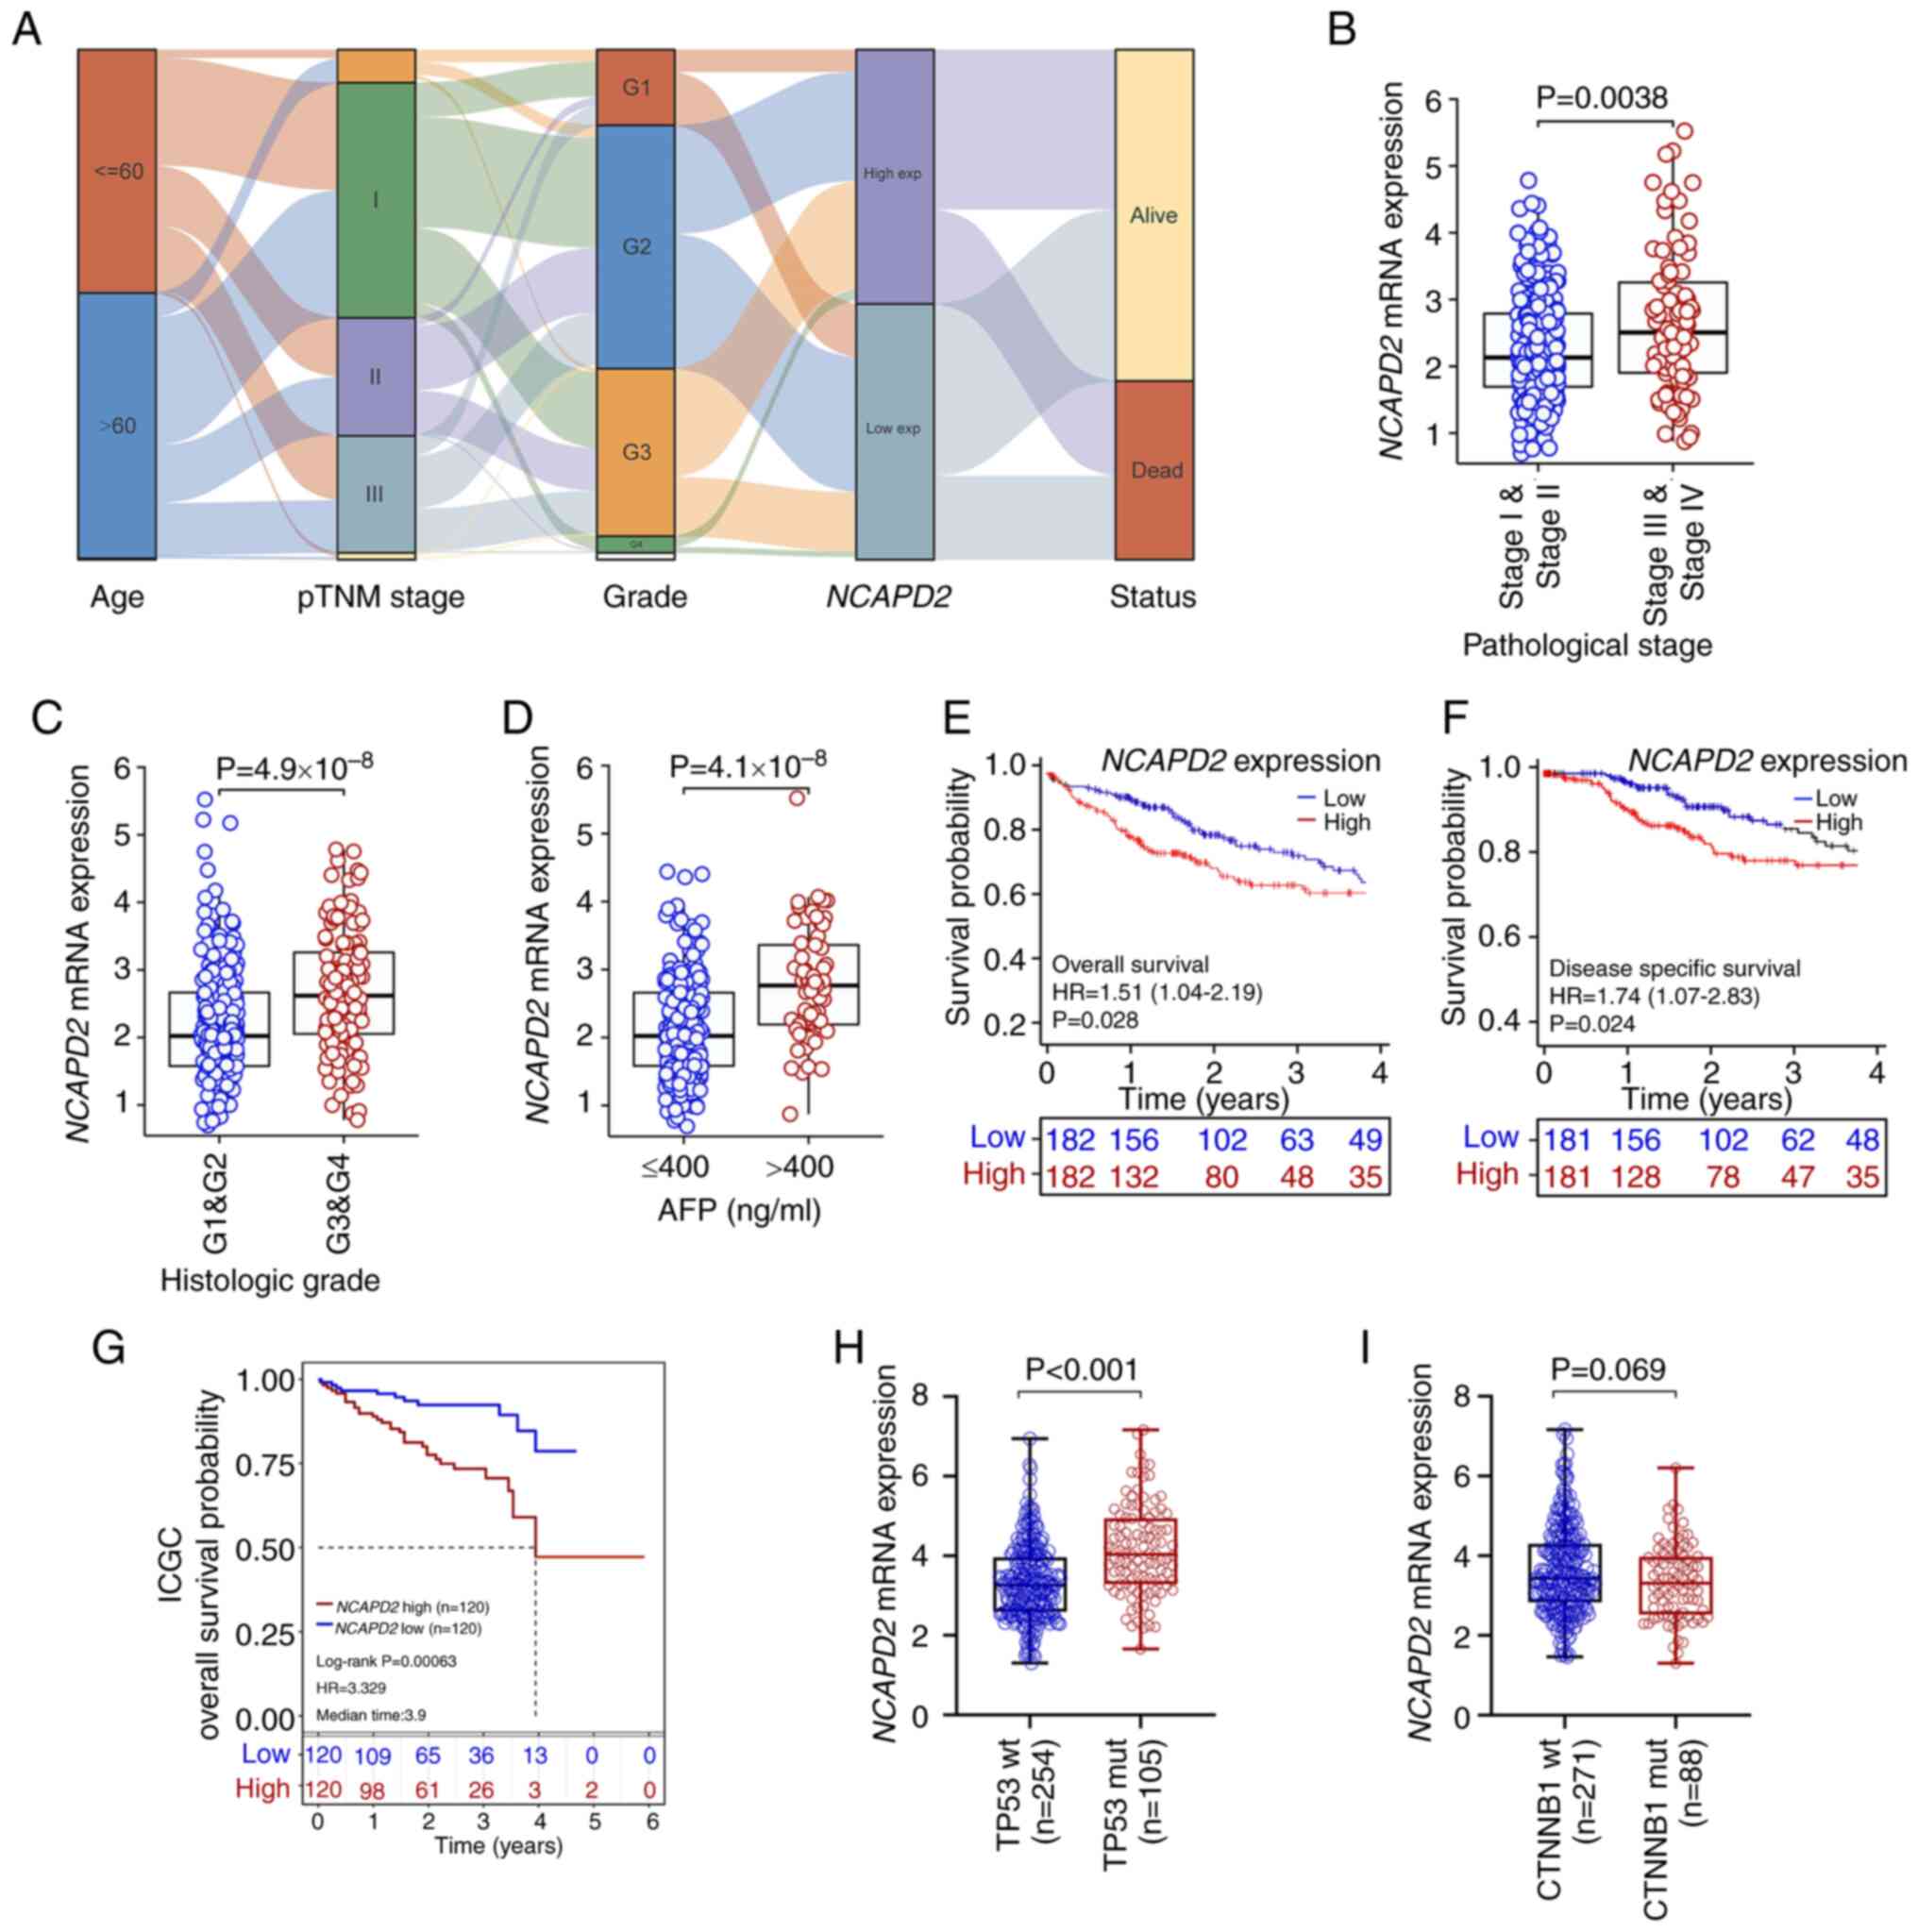 | Figure 4Association between NCAPD2
expression and clinicopathological signatures in liver cancer. (A)
Alluvial diagram was used to display the distribution of
NCAPD2 expression in liver cancer in terms of age, pTNM
stage, histological grade and survival status. Differences in
NCAPD2 expression regarding clinicopathological parameters,
including (B) pTNM stage, (C) histological grade and (D) AFP
concentration. Prognostic analysis of NCAPD2 expression in
liver cancer, including (E) overall survival and (F)
disease-specific survival, based on TCGA data. (G) Prognostic
analysis of NCAPD2 expression in liver cancer overall
survival, based on the ICGC dataset. Differences in NCAPD2
expression regarding different types of gene mutations in liver
cancer, including (H) TP53 and (I) CTNNB1 mutations.
AFP, α-fetoprotein; ICGC, International Cancer Genome Consortium;
mut, mutant; NCAPD2, non-SMC condensin I complex subunit D2;
pTNM, pathological TNM; TCGA, The Cancer Genome Atlas; wt,
wild-type. |
Immune infiltration analysis and
gene-enriched pathways of NCAPD2 in liver cancer
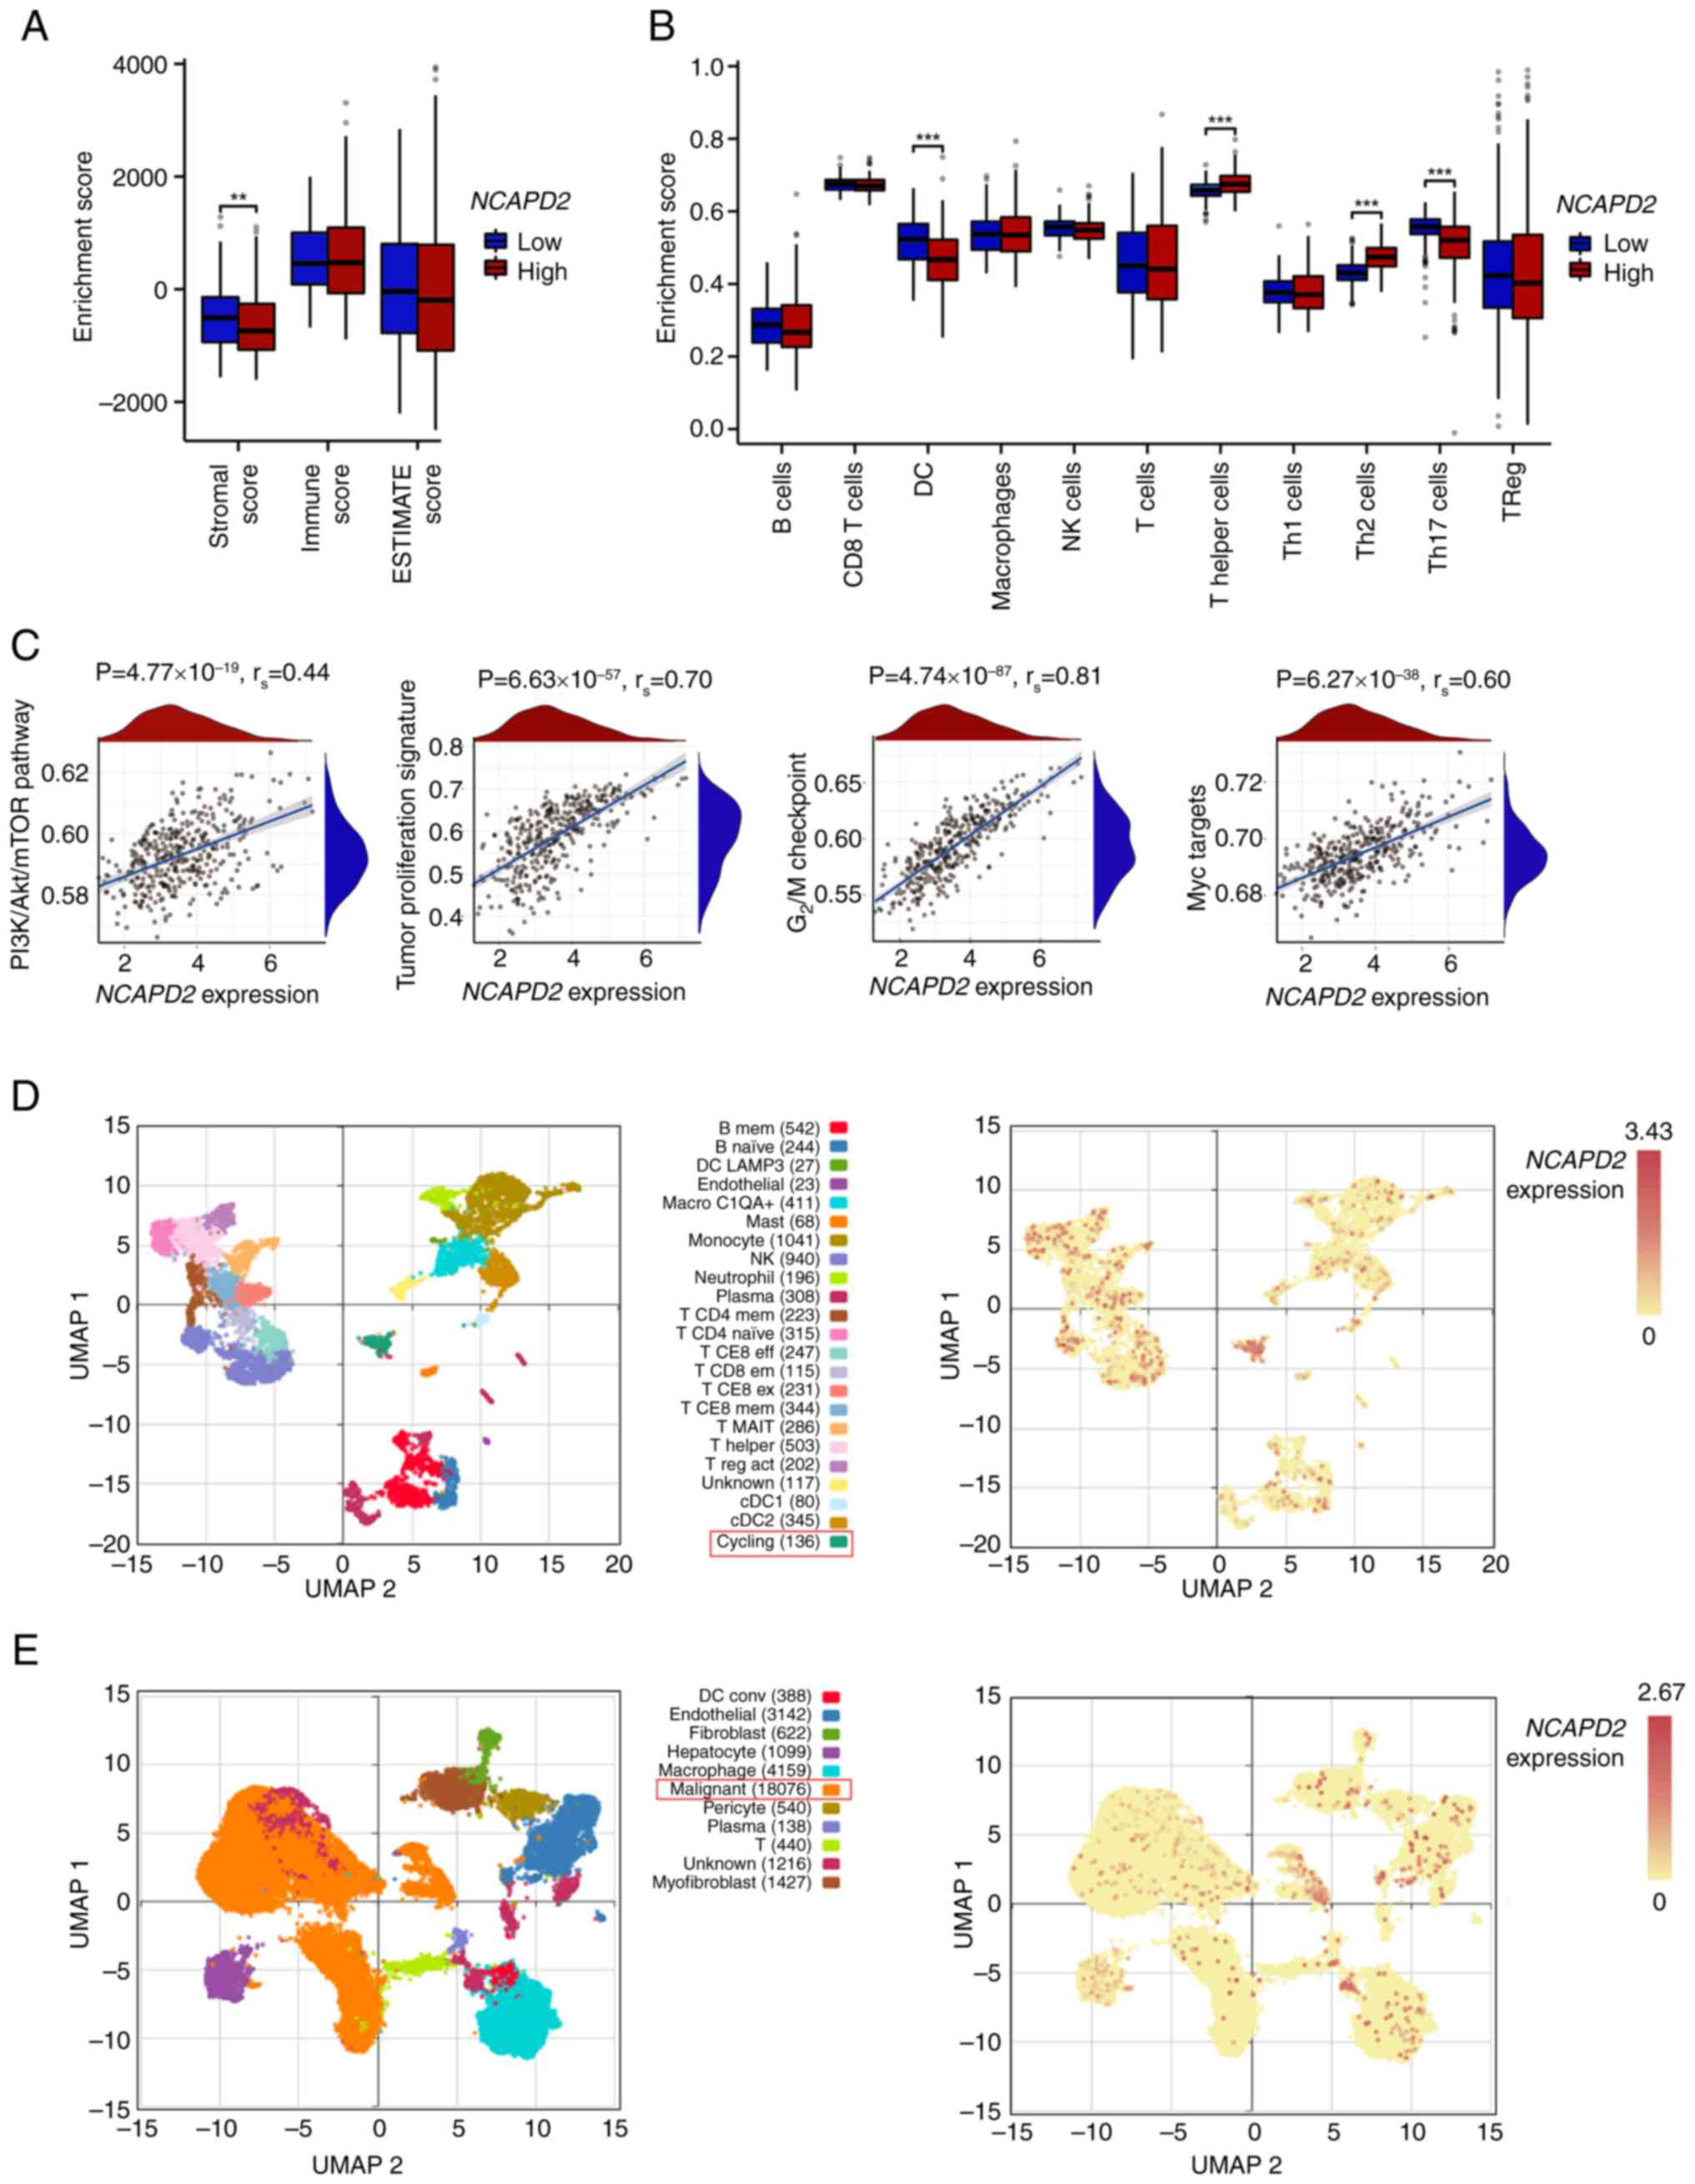
Immune infiltration assays suggested that the
stromal score was significantly lower in the high NCAPD2
expression group compared with that in the low NCAPD2
expression group, but no difference was observed for the immune
score or ESTIMATE score (Fig.
5A). Subsequently, the GSEA algorithm revealed that the
abundance of most immune cells was not related to differences in
the expression of NCAPD2, with the exception of dendritic
cells and T helper (Th) cells (especially Th2 and Th17 cells)
(Fig. 5B). Moreover, the GSEA
asserted that liver cancer with high NCAPD2 expression was
mostly enriched in the phosphatidylinositol 3-kinase
(PI3K)-Akt-mammalian target of rapamycin (mTOR) signaling pathway,
the tumor proliferation signature, the G2/M checkpoint
of the cell cycle and Myc signal targets (Fig. 5C). In the GSE140228 dataset, the
high expression subgroup of NCAPD2 was mainly enriched in
the cell population in the cell cycling state (Fig. 5D); the GSE112271 dataset denoted
that NCAPD2 was mainly expressed in the malignant cell
population (Fig. 5E).
Aberrant NCAPD2 expression alters cell
proliferation, invasion, cell cycle progression and apoptosis in
liver cancer cells
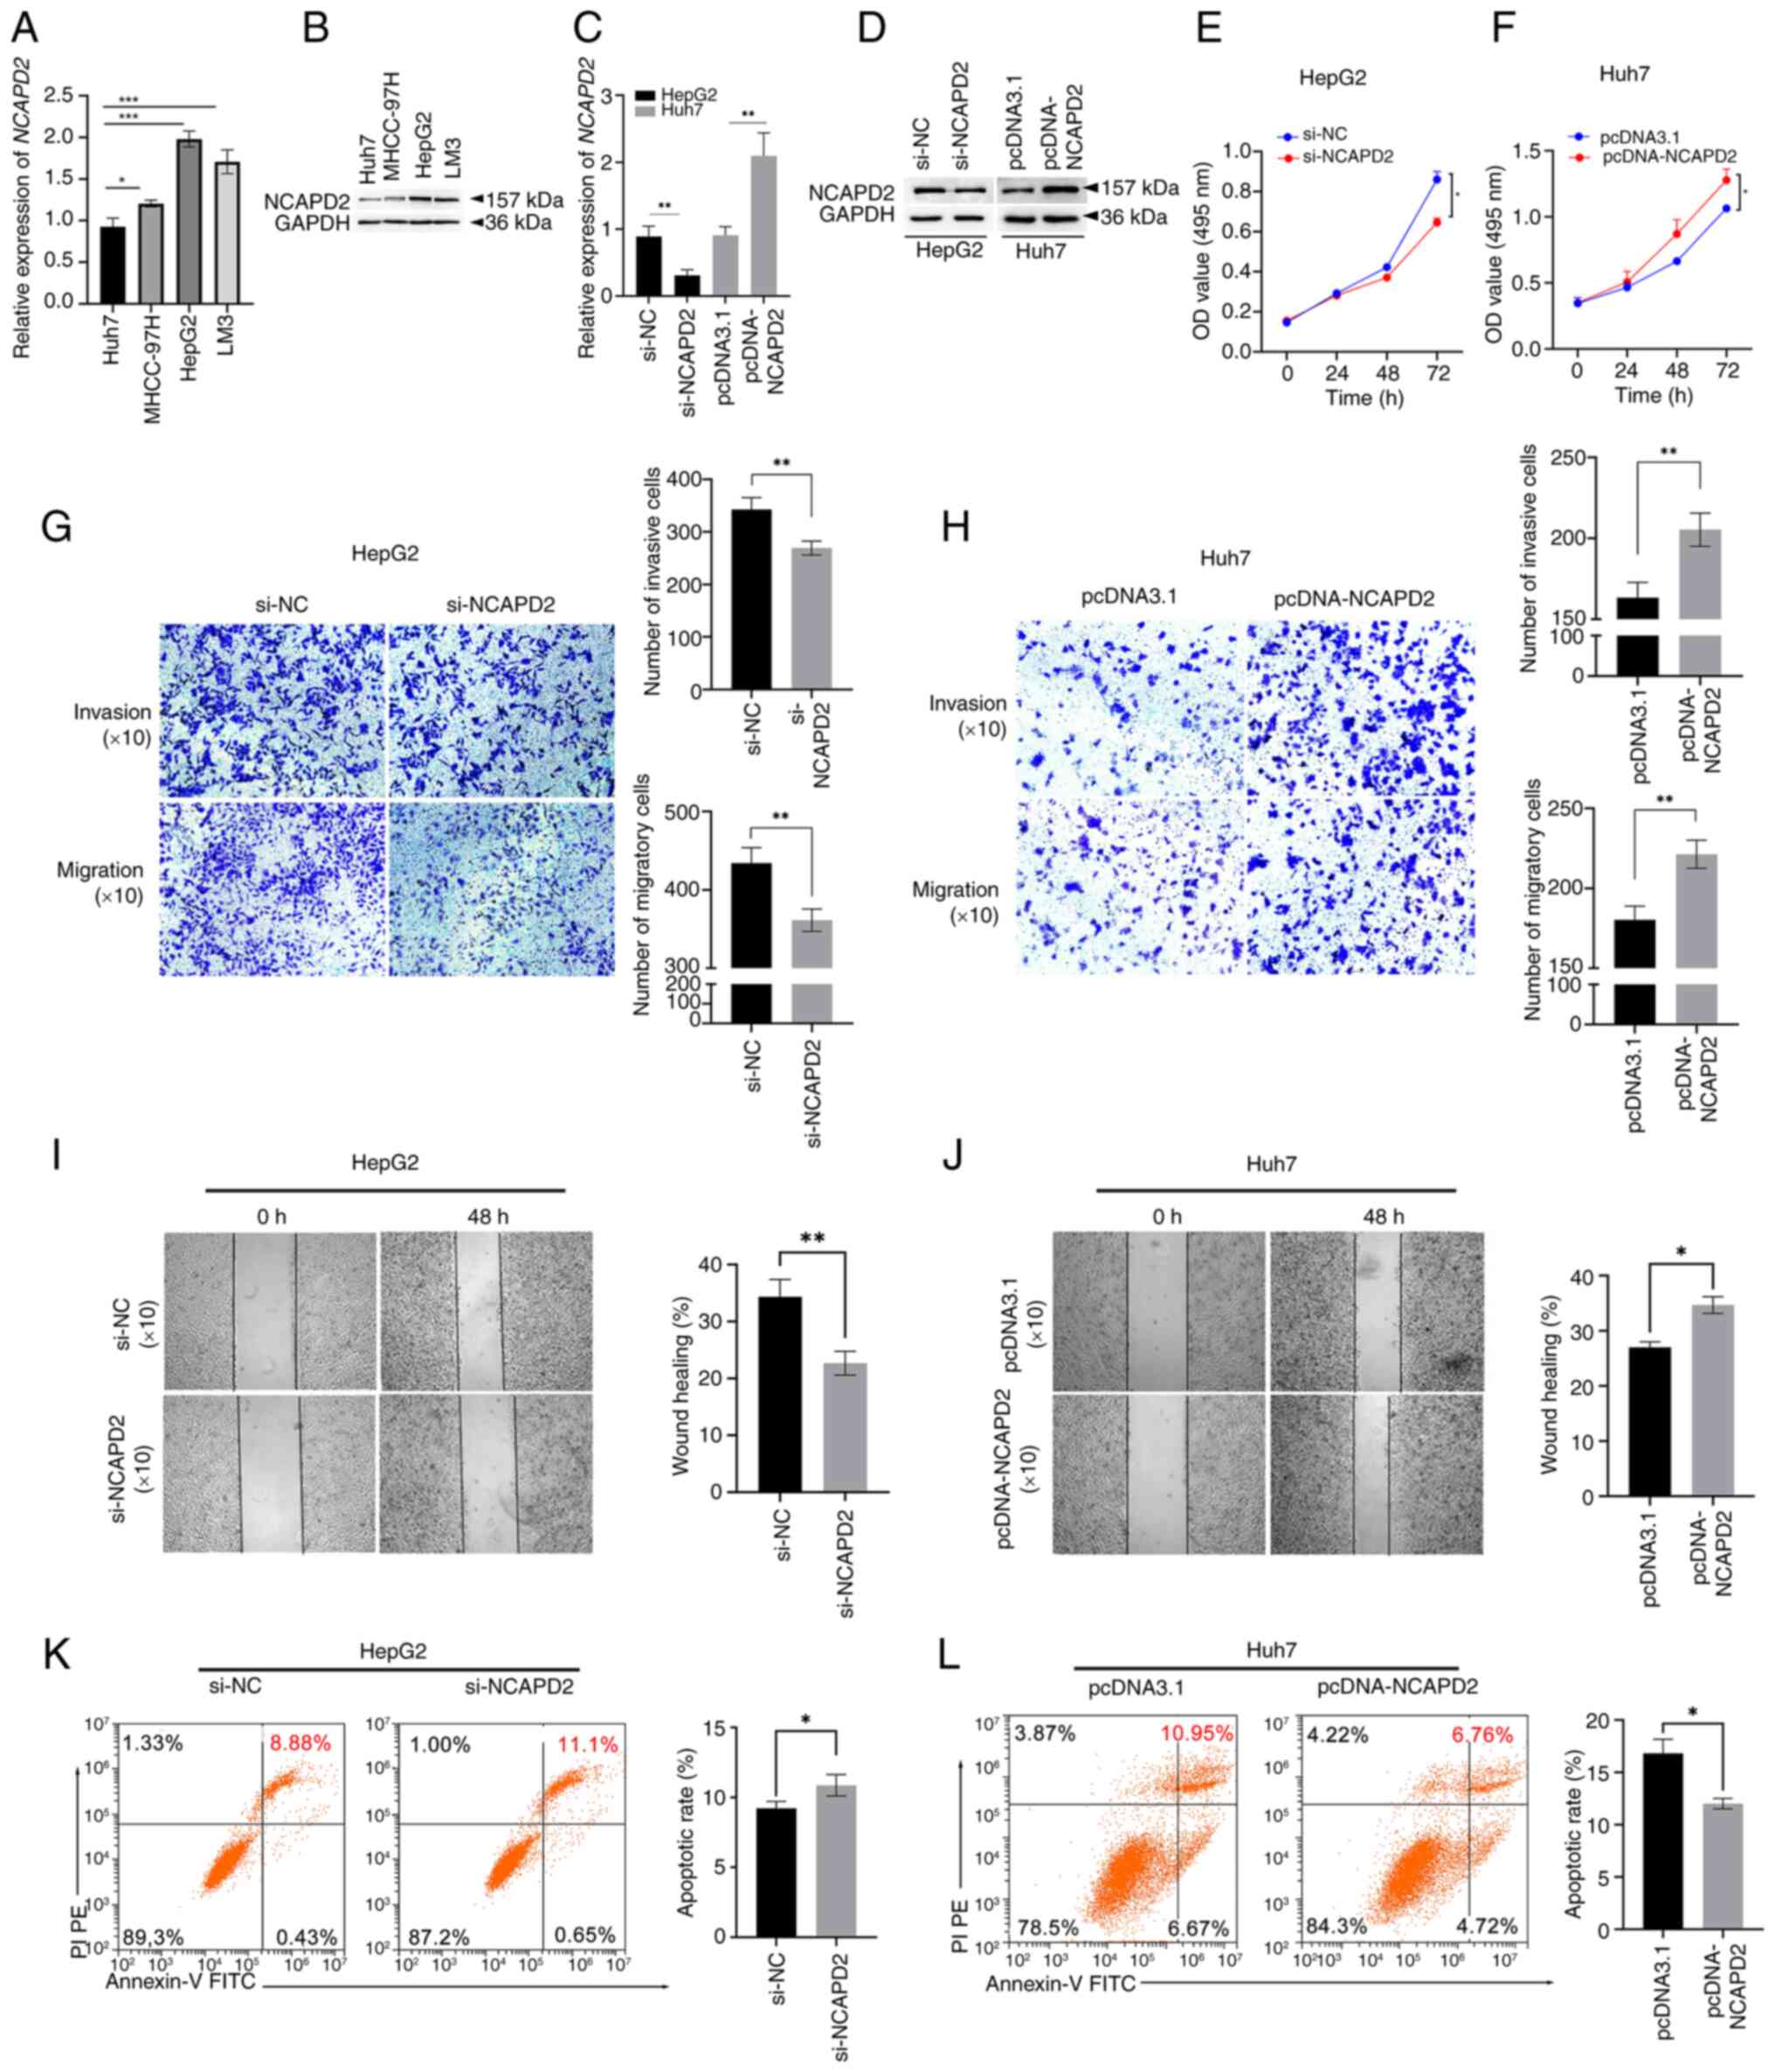
NCAPD2 expression was assessed in the liver cancer
cell lines Huh7, MHCC-97H, HepG2 and LM3. Among these four liver
cancer cell lines, the mRNA and protein expression levels of NCAPD2
were highest in HepG2 cells and lowest in Huh7 cells (Fig. 6A and B). Thus, HepG2 cells were
selected for siRNA experiments and Huh7 cells were selected for
overexpression experiments to further investigate the biological
roles of NCAPD2 in liver cancer. Notably, the mRNA and protein
expression levels of NCAPD2 were significantly inhibited in HepG2
cells transfected with si-NCAPD2 compared with those transfected
with si-NC (Fig. 6C and D). By
contrast, the mRNA and protein expression levels of NCAPD2 were
significantly upregulated in Huh7 cells transfected with
pcDNA-NCAPD2 compared with those transfected with pcDNA3.1.
Specifically, NCAPD2 knockdown significantly inhibited the
proliferation (Fig. 6E),
invasion and migration (Fig. 6G and
I) of HepG2 cells transfected with si-NCAPD2 compared with
those transfected with si-NC. Flow cytometry showed that NCAPD2
knockdown significantly enhanced the apoptosis of HepG2 cells (8.88
vs. 11.1%; Fig. 6K). By
contrast, overexpression of NCAPD2 increased the proliferation
(Fig. 6F), invasion and
migration (Fig. 6H and J) of
Huh7 cells transfected with pcDNA-NCAPD2 compared with those
transfected with pcDNA3.1. Flow cytometry also showed that NCAPD2
overexpression impeded the apoptosis of Huh7 cells (10.95 vs.
6.76%; Fig. 6L).
NCAPD2 promotes cell cycle progression at
the G2/M-phase transition, activates the PI3K-Akt-mTOR
signaling pathway and epithelial-mesenchymal transition (EMT)
progression in liver cancer cells
Flow cytometry revealed that knockdown of NCAPD2
inhibited the cell cycle at the G2/M-phase transition
and enhanced G0/G1-phase transition in HepG2
cells (Fig. 7A), whereas
overexpression of NCAPD2 boosted the cell cycle at the
G2/M-phase transition in Huh7 cells (Fig. 7B). Western blotting revealed that
knockdown of NCAPD2 expression suppressed the expression levels of
c-Myc; affected the expression levels of EMT-related proteins,
including upregulation of E-cadherin, and downregulation of
N-cadherin and vimentin; and reduced the phosphorylation of mTOR,
PI3K and Akt in HepG2 cells. By contrast, NCAPD2 overexpression
enhanced the expression levels of c-Myc; activated the EMT via
altering the expression levels of the related proteins, including
downregulation of E-cadherin, and upregulation N-cadherin and
vimentin; and increased the expression levels of phosphorylated
(p)-mTOR, p-PI3K and p-Akt in Huh7 cells (Fig. 7C).
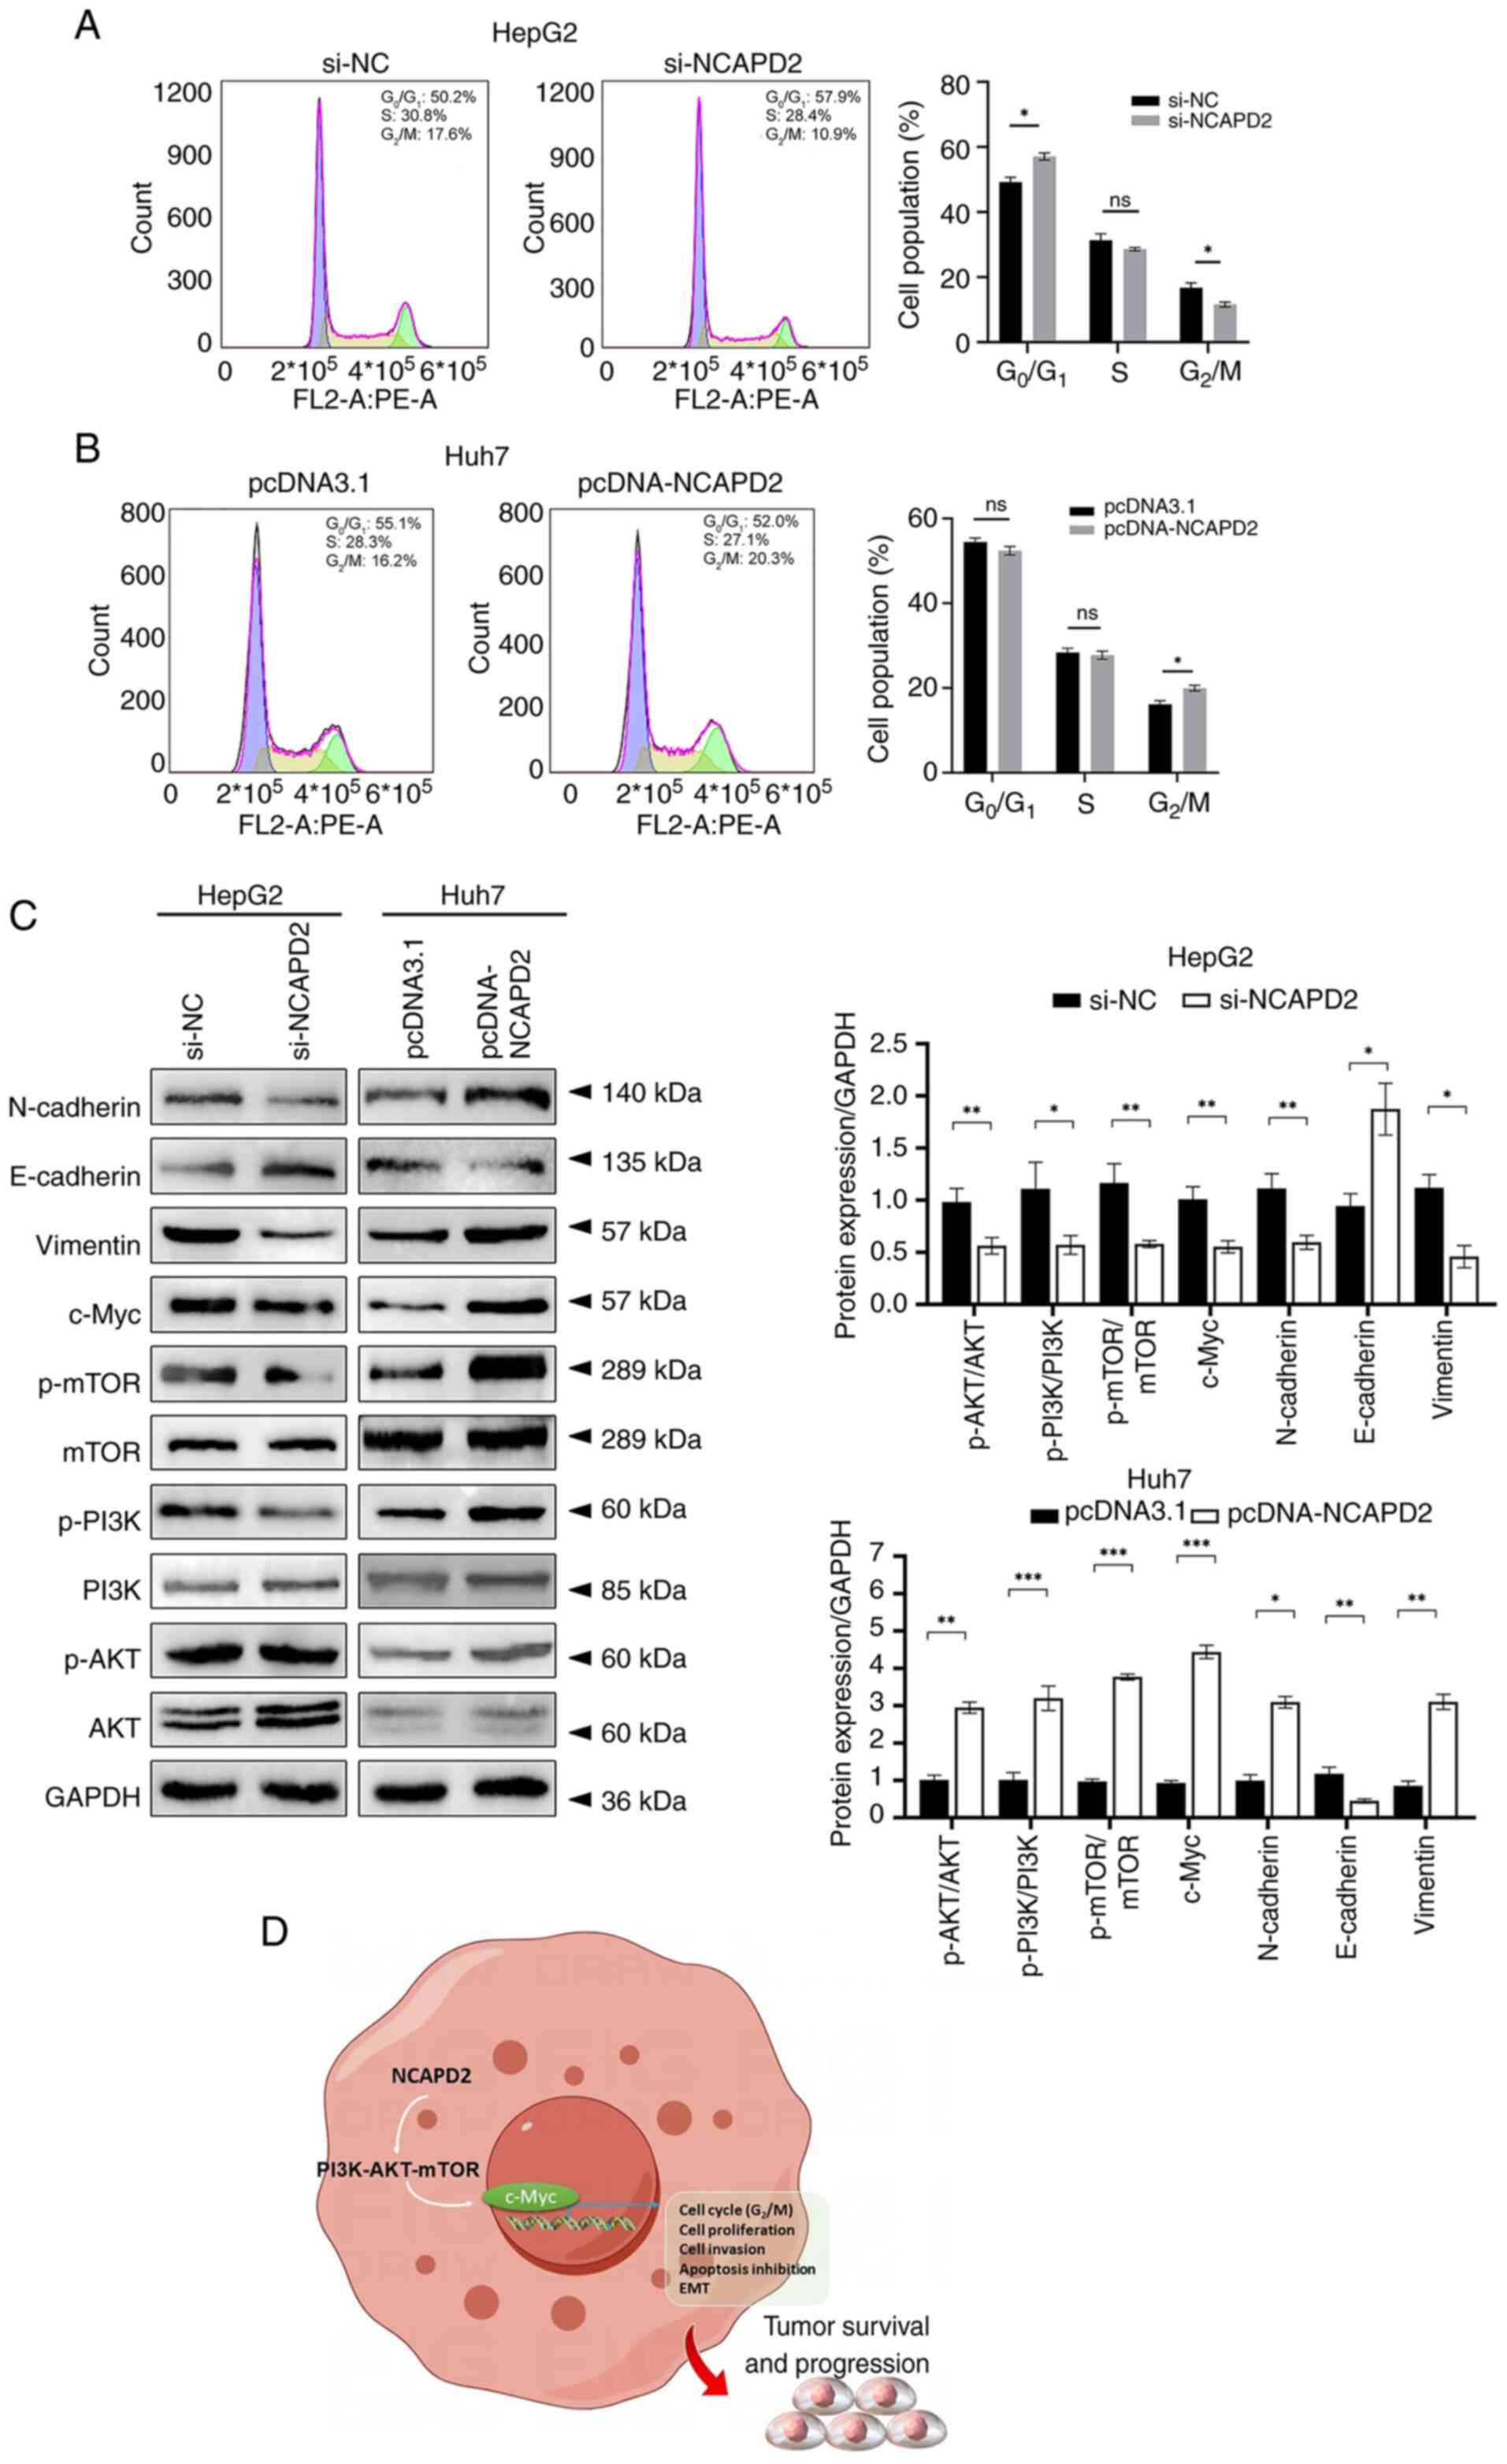 | Figure 7NCAPD2 promotes cell cycle
progression at the G2/M-phase transition, activates the
PI3K-Akt-mTOR and c-Myc signaling pathways, and induces EMT
progression in liver cancer cell lines. Cell cycle assay of (A)
si-NCAPD2-transfected HepG2 cells and (B) pcDNA-NCAPD2
overexpression plasmid-transfected Huh7 cells. (C) Western blotting
of proteins related to the PI3K-Akt-mTOR/c-Myc signaling pathway
and EMT progression after silencing of NCAPD2 in HepG2 cells or
overexpression of NCAPD2 in Huh7 cells. All the experiments were
performed in triplicate. (D) Diagram of the molecular mechanism.
*P<0.05, **P<0.01,
***P<0.001. EMT, epithelial-mesenchymal transition;
mTOR, mammalian target of rapamycin; NC, negative control; NCAPD2,
non-SMC condensin I complex subunit D2; p-, phosphorylated; PI3K,
phosphatidylinositol 3-kinase; si, small interfering. |
Discussion
Condensin complexes exert an essential function in
the process of chromosomal condensation in eukaryotic organisms,
and two types of condensin complexes exist in vertebrates:
Condensin complex I and II (13). NCAPD2, as a subunit of
condensin complex I, not only exerts a vital function in chromatin
condensation and segregation during cell proliferation, but is also
involved in maintaining genome stability (10,26). As previously reported (12-14,27-31), NCAPD2 is commonly
expressed in healthy control tissues, such as lymph nodes, bone
marrow and fat. Under pathological conditions, aberrant expression
of NCAPD2 is strongly associated with the incidence of
cancer and non-tumorigenic diseases. In addition, NCAPD2
harbors a critical effect on central nervous system development.
Zhang et al (27)
demonstrated the association between NCAPD2 polymorphisms
and Parkinson's disease. Lin et al (28) found that a typical splice-site
variant in the NCAPD2 gene (c.3477+2T>C) may be
associated with primary microcephaly. Upregulation of NCAPD2
has also been shown to induce an inflammatory response through the
IKK/NF-κB pathway in ulcerative colitis (29), and a recent study identified
NCAPD2 as a novel biomarker for the unfavorable prognosis of
lung adenocarcinoma, related to immune infiltration and tumor
mutational burden (30). He
et al (12) revealed that
NCAPD2 may contribute to breast cancer cell progression via
CDK1-related signaling. Zhang et al (13) showed that interference with
NCAPD2 expression may cause G2/M arrest through
the p53 signaling pathway, leading to cell proliferation
inhibition, polyploidy and apoptosis, and reduced invasiveness of
TNBC cells. In liver cancer, fewer studies have been performed
related to NCAPD2. It has been suggested that NCAPD2
is one of the hub genes that might serve vital roles in the
progression of liver cancer through an integrated bioinformatics
assay (31). Furthermore, Dong
et al (14) performed a
pan-cancer analysis and asserted that NCAPD2 may act as a
prognostic marker in various types of cancer, including liver
cancer. These previous findings indicated that NCAPD2 may be
an independent factor that can predict poor survival in liver
cancer, which is mainly involved in the G2/M checkpoint
and p53 signaling pathway.
Compared with the aforementioned studies, in the
present study, liver cancer data from the public databases TNMplot,
TCGA and ICGC were integrated, the expression and prognostic value
of NCAPD2 in patients with liver cancer was analyzed, and
the results were validated in clinical samples. Additionally,
immune infiltration assays and single-cell sequencing analysis
showed that NCAPD2 expression was not significantly
associated with immune infiltration, but was associated with
stromal score. In liver cancer, overexpression of NCAPD2 was
mainly enriched in cells in active cell cycle or malignant tumor
cells. Subsequently, GSEA and in vitro experiments on human
liver cancer cell lines with NCAPD2 overexpression or knockdown
were adopted to investigate the biological features and molecular
signaling pathways of NCAPD2 in liver cancer.
As a result, it was shown that NCAPD2 was
prominently upregulated in liver cancer tissues compared with in
control tissues based on clinical samples and datasets from the
TNMplot, TCGA and ICGC databases. The association between
NCAPD2 and clinicopathological parameters in liver cancer
revealed that NCAPD2 expression was closely related to age,
pTNM stage (especially T stage), histological grade and AFP levels.
In addition, NCAPD2 expression was closely related to poor
OS and DSS, and could be considered an independent prognostic
factor of OS in patients with liver cancer. Furthermore,
NCAPD2 expression was increased in TP53 mut liver
cancer compared with that in TP53 wt liver cancer, but it
was not related to the mutation status of CTNNB1. NCAPD2
expression was also positively correlated with the percentage of
Ki67+ cells in liver cancer. These findings indicated
that NCAPD2 may be involved in cell proliferation in patients with
liver cancer. Additionally, the GSEA of TCGA-liver cancer data
validated that NCAPD2 high expression was mostly enriched in
tumor proliferation signature and G2/M checkpoint of the
cell cycle. Subsequently, HepG2 cells were selected for siRNA
experiments and Huh7 cells were selected for overexpression
experiments to further determine the biological roles of NCAPD2 in
liver cancer. Consequently, overexpression of NCAPD2 enhanced tumor
cell proliferation, invasion and cell cycle progression at the
G2/M-phase transition, and inhibited cell apoptosis in
liver cancer cell lines.
c-Myc, as a member of the Myc family as well as a
transcription factor, is a proto-oncogene that serves as a key
regulator of the tumor microenvironment (TME) (32,33). c-Myc is involved in the
regulation of diverse biological processes, including cell
proliferation, differentiation, invasion and migration, and the
recruitment of tumor cells, thus contributing to the regulation of
angiogenesis and EMT (34).
Moreover, c-Myc can affect the abundance of immune cell
infiltration, specifically of natural killer cells, T cells and B
cells, and the expression of programmed death cell protein
(PD)-ligand 1/PD-1, thereby inducing immune evasion and
immunosuppression (35). In
turn, the TME can regulate c-Myc expression by various cytokines,
the hypoxic microenvironment and factors released by
tumor-associated fibroblasts (36). The PI3K-Akt-mTOR signaling
pathway and related genes have been extensively studied, and have
been shown to be related to multiple upstream and downstream
elements of oncogenesis (37,38). Inhibition of this pathway has
been proven to result in tumor regression in humans (39). Furthermore, PI3K-Akt-mTOR has
been reported to dysregulate transcription factors, including
c-Myc, to promote tumor survival and progression (40-42). Consequently, the in vitro
assay demonstrated that the NCAPD2 overexpression promoted cell
cycle progression at the G2/M-phase transition, and
activated the PI3K-Akt-mTOR/c-Myc signaling pathway and EMT
progression, according to the analysis of Huh7 cells transfected
with pcDNA-NCAPD2 overexpression plasmid (Fig. 7D).
In the present study, NCAPD2 expression was
frequently upregulated in liver cancer tissues compared with in
control liver tissues, and it was positively correlated with the
percentage of Ki67+ cells. Finally, the potential
underlying biological mechanisms were identified, and it was
suggested that NCAPD2 upregulation may promote cell cycle
progression at the G2/M-phase transition, and activate
the PI3K-Akt-mTOR/c-Myc signaling pathway and EMT progression in
liver cancer cells, thus augmenting tumor survival and progression.
It may thus be hypothesized that NCAPD2 could be considered a
promising prognostic marker or treatment target for liver
cancer.
The present study has some limitations. Firstly,
the sample size of patients with liver cancer was relatively small,
and it is necessary to expand the sample size to confirm the
aforementioned results. In addition, the underlying biological
mechanism of NCAPD2 in patients with liver cancer was mainly
based on bioinformatics strategies and in vitro analyses of
human liver cancer cell lines. Accordingly, in vivo research
or even clinical trials on NCAPD2 in liver cancer are still
required. The academic field of structural biology has witnessed an
increase in the application of high-resolution devices, such as
cryo-electron tomography, due to rapid technical advancements in
recent years. Understanding the precise macromolecular structures
and mechanisms of each of the individual functional modules of a
cell helps researchers understand how cells work and the details of
how genes function as a whole (43). Finally, regarding the evidence
that PI3K-Akt-mTOR signaling is involved in NCAPD2-mediated liver
cancer development, further studies are required to determine its
direct pathogenic mechanism. Thus, for in-depth speculation,
further investigation of the structural biology of NCAPD2 and
related molecules is important for studying them as potential
biotargets or therapeutic biomarkers for liver cancer.
In conclusion, in the present study, the
upregulation of NCAPD2 in patients with liver cancer was
comprehensively analyzed and may be used to predict an unfavorable
prognosis based on the integrated findings of multiple public
databases and clinical samples. Furthermore, NCAPD2 expression was
positively correlated with the percentage of Ki67+
cells, indicating that NCAPD2 might be involved in cell
proliferation in patients with liver cancer. Finally, the in
vitro assays demonstrated that overexpression of NCAPD2 led to
cell cycle progression at the G2/M-phase transition, and
activation of the PI3K-Akt-mTOR/c-Myc signaling pathway and EMT
progression in human liver cancer cells. Briefly, the current study
has provided promising evidence for the function of NCAPD2 and its
related signaling pathways in the initiation and progression of
liver cancer, which may be used for developing potential biotargets
or individualized therapeutic options for patients with liver
cancer and high NCAPD2 expression.
Supplementary Data
Availability of data and materials
The publicly available data used in the present
study may be found in TCGA (https://portal.gdc.cancer.gov/), TNMplot (https://tnmplot.com/), ICGC (https://icgc.org), the HPA (www.proteinatlas.org/) and IMMUcan (https://immucanscdb.vital-it.ch). The other data
generated in the present study may be requested from the
corresponding author.
Authors' contributions
JXG and YGH designed the study. YGH, PH and KH
wrote the manuscript. JXG performed the in vitro assay. PH
supervised the study and contributed to conception. YGH, KH and WLZ
conducted the IHC assay and statistical analysis. XMZ contributed
to the acquisition and interpretation of data. YQW participated in
data collection, and provided helpful suggestions on method and
figure preparation. SRY conducted data analysis and interpretation,
revised the initial draft and provided suggestions for experimental
design. All authors confirm the authenticity of all the raw data.
All authors have read and approved the final version of the
manuscript.
Ethics approval and consent to
participate
The present study follows The Declaration of
Helsinki. The current study was supported and approved by the
Ethics Committee of Taihe Hospital (ethical approval no. 2024KS10;
Shiyan, China). The samples involved in this study were obtained
with written informed consent from patients or their families.
Patient consent for publication
Not applicable.
Competing interests
The authors declare that they have no competing
interests.
Acknowledgements
Not applicable.
Funding
The present study was supported by the Hubei Provincial Natural
Science Foundation (grant no. 2020CFB235).
References
|
1
|
Forner A, Reig M and Bruix J:
Hepatocellular carcinoma. Lancet. 391:1301–1314. 2018. View Article : Google Scholar : PubMed/NCBI
|
|
2
|
Ganesan P and Kulik LM: Hepatocellular
carcinoma: New developments. Clin Liver Dis. 27:85–102. 2023.
View Article : Google Scholar
|
|
3
|
Llovet JM, Kelley RK, Villanueva A, Singal
AG, Pikarsky E, Roayaie S, Lencioni R, Koike K, Zucman-Rossi J and
Finn RS: Hepatocellular carcinoma. Nat Rev Dis Primers. 7:62021.
View Article : Google Scholar : PubMed/NCBI
|
|
4
|
Vogel A, Meyer T, Sapisochin G, Salem R
and Saborowski A: Hepatocellular carcinoma. Lancet. 400:1345–1362.
2022. View Article : Google Scholar : PubMed/NCBI
|
|
5
|
Nagtegaal ID, Odze RD, Klimstra D, Paradis
V, Rugge M, Schirmacher P, Washington KM, Carneiro F and Cree IA;
WHO Classification of Tumours Editorial Board: The 2019 WHO
classification of tumours of the digestive system. Histopathology.
76:182–188. 2020. View Article : Google Scholar :
|
|
6
|
Zheng H, Pomyen Y, Hernandez MO, Li C,
Livak F, Tang W, Dang H, Greten TF, Davis JL, Zhao Y, et al:
Single-cell analysis reveals cancer stem cell heterogeneity in
hepatocellular carcinoma. Hepatology. 68:127–140. 2018. View Article : Google Scholar : PubMed/NCBI
|
|
7
|
Friemel J, Rechsteiner M, Frick L, Böhm F,
Struckmann K, Egger M, Moch H, Heikenwalder M and Weber A:
Intratumor heterogeneity in hepatocellular carcinoma. Clin Cancer
Res. 21:1951–1961. 2015. View Article : Google Scholar
|
|
8
|
Ball AR Jr, Schmiesing JA, Zhou C, Gregson
HC, Okada Y, Doi T and Yokomori K: Identification of a
chromosome-targeting domain in the human condensin subunit
CNAP1/hCAP-D2/Eg7. Mol Cell Biol. 22:5769–5781. 2002. View Article : Google Scholar : PubMed/NCBI
|
|
9
|
Savvidou E, Cobbe N, Steffensen S,
Cotterill S and Heck MM: Drosophila CAP-D2 is required for
condensin complex stability and resolution of sister chromatids. J
Cell Sci. 118:2529–2543. 2005. View Article : Google Scholar : PubMed/NCBI
|
|
10
|
Watrin E and Legagneux V: Contribution of
hCAP-D2, a non-SMC subunit of condensin I, to chromosome and
chromosomal protein dynamics during mitosis. Mol Cell Biol.
25:740–750. 2005. View Article : Google Scholar : PubMed/NCBI
|
|
11
|
Jing Z, He X, Jia Z, Sa Y, Yang B and Liu
P: NCAPD2 inhibits autophagy by regulating
Ca(2+)/CAMKK2/AMPK/mTORC1 pathway and PARP-1/SIRT1 axis to promote
colorectal cancer. Cancer Lett. 520:26–37. 2021. View Article : Google Scholar : PubMed/NCBI
|
|
12
|
He J, Gao R, Yang J, Li F, Fu Y, Cui J,
Liu X, Huang K, Guo Q, Zhou Z and Wei W: NCAPD2 promotes breast
cancer progression through E2F1 transcriptional regulation of CDK1.
Cancer Sci. 114:896–907. 2023. View Article : Google Scholar :
|
|
13
|
Zhang Y, Liu F, Zhang C, Ren M, Kuang M,
Xiao T, Di X, Feng L, Fu L and Cheng S: Non-SMC condensin I complex
subunit D2 is a prognostic factor in triple-negative breast cancer
for the ability to promote cell cycle and enhance invasion. Am J
Pathol. 190:37–47. 2020. View Article : Google Scholar
|
|
14
|
Dong X, Liu T, Li Z and Zhai Y: Non-SMC
condensin I complex subunit D2 (NCAPD2) reveals its prognostic and
immunologic features in human cancers. Aging (Albany NY).
15:7237–7257. 2023. View Article : Google Scholar : PubMed/NCBI
|
|
15
|
Bartha Á and Győrffy B: TNMplot.com: A web
tool for the comparison of gene expression in normal, tumor and
metastatic tissues. Int J Mol Sci. 22:26222021. View Article : Google Scholar : PubMed/NCBI
|
|
16
|
Livak KJ and Schmittgen TD: Analysis of
relative gene expression data using real-time quantitative PCR and
the 2(-Delta Delta C(T)) method. Methods. 25:402–408. 2001.
View Article : Google Scholar
|
|
17
|
Zeng D, Li M, Zhou R, Zhang J, Sun H, Shi
M, Bin J, Liao Y, Rao J and Liao W: Tumor microenvironment
characterization in gastric cancer identifies prognostic and
immunotherapeutically relevant gene signatures. Cancer Immunol Res.
7:737–750. 2019. View Article : Google Scholar : PubMed/NCBI
|
|
18
|
Yoshihara K, Shahmoradgoli M, Martínez E,
Vegesna R, Kim H, Torres-Garcia W, Treviño V, Shen H, Laird PW,
Levine DA, et al: Inferring tumour purity and stromal and immune
cell admixture from expression data. Nat Commun. 4:26122013.
View Article : Google Scholar : PubMed/NCBI
|
|
19
|
Bindea G, Mlecnik B, Tosolini M,
Kirilovsky A, Waldner M, Obenauf AC, Angell H, Fredriksen T,
Lafontaine L, Berger A, et al: Spatiotemporal dynamics of
intratumoral immune cells reveal the immune landscape in human
cancer. Immunity. 39:782–795. 2013. View Article : Google Scholar : PubMed/NCBI
|
|
20
|
Xiao Z, Dai Z and Locasale JW: Metabolic
landscape of the tumor microenvironment at single cell resolution.
Nat Commun. 10:37632019. View Article : Google Scholar : PubMed/NCBI
|
|
21
|
Wei J, Huang K, Chen Z, Hu M, Bai Y, Lin S
and Du H: Characterization of glycolysis-associated molecules in
the tumor microenvironment revealed by pan-cancer tissues and lung
cancer single cell data. Cancers (Basel). 12:17882020. View Article : Google Scholar : PubMed/NCBI
|
|
22
|
Camps J, Noël F, Liechti R, Massenet-Regad
L, Rigade S, Götz L, Hoffmann C, Amblard E, Saichi M, Ibrahim MM,
et al: Meta-analysis of human cancer single-cell RNA-seq datasets
using the IMMUcan database. Cancer Res. 83:363–373. 2023.
View Article : Google Scholar :
|
|
23
|
Zhang Q, He Y, Luo N, Patel SJ, Han Y, Gao
R, Modak M, Carotta S, Haslinger C, Kind D, et al: Landscape and
dynamics of single immune cells in hepatocellular carcinoma. Cell.
179:829–845.e20. 2019. View Article : Google Scholar : PubMed/NCBI
|
|
24
|
Losic B, Craig AJ, Villacorta-Martin C,
Martins-Filho SN, Akers N, Chen X, Ahsen ME, von Felden J, Labgaa
I, D-Avola D, et al: Intratumoral heterogeneity and clonal
evolution in liver cancer. Nat Commun. 11:2912020. View Article : Google Scholar : PubMed/NCBI
|
|
25
|
Verloh N, Probst U, Utpatel K, Zeman F,
Brennfleck F, Werner JM, Fellner C, Stroszczynski C, Evert M,
Wiggermann P and Haimerl M: Influence of hepatic fibrosis and
inflammation: Correlation between histopathological changes and
Gd-EOB-DTPA-enhanced MR imaging. PLoS One. 14:e02157522019.
View Article : Google Scholar : PubMed/NCBI
|
|
26
|
Seipold S, Priller FC, Goldsmith P, Harris
WA, Baier H and Abdelilah-Seyfried S: Non-SMC condensin I complex
proteins control chromosome segregation and survival of
proliferating cells in the zebrafish neural retina. BMC Dev Biol.
9:402009. View Article : Google Scholar : PubMed/NCBI
|
|
27
|
Zhang P, Liu L, Huang J, Shao L, Wang H,
Xiong N and Wang T: Non-SMC condensin I complex, subunit D2 gene
polymorphisms are associated with Parkinson's disease: A Han
Chinese study. Genome. 57:253–257. 2014. View Article : Google Scholar : PubMed/NCBI
|
|
28
|
Lin Y, Zeng C, Lu Z, Lin R and Liu L: A
novel homozygous splice-site variant of NCAPD2 gene identified in
two siblings with primary microcephaly: The second case report.
Clin Genet. 96:98–101. 2019. View Article : Google Scholar : PubMed/NCBI
|
|
29
|
Yuan CW, Sun XL, Qiao LC, Xu HX, Zhu P,
Chen HJ and Yang BL: Non-SMC condensin I complex subunit D2 and
non-SMC condensin II complex subunit D3 induces inflammation via
the IKK/NF-κB pathway in ulcerative colitis. World J Gastroenterol.
25:6813–6822. 2019. View Article : Google Scholar : PubMed/NCBI
|
|
30
|
Li Z, Zheng Y, Wu Z, Zhuo T, Zhu Y, Dai L,
Wang Y and Chen M: NCAPD2 is a novel marker for the poor prognosis
of lung adenocarcinoma and is associated with immune infiltration
and tumor mutational burden. Medicine (Baltimore). 102:e326862023.
View Article : Google Scholar : PubMed/NCBI
|
|
31
|
Zhao Q, Zhang Y, Shao S, Sun Y and Lin Z:
Identification of hub genes and biological pathways in
hepatocellular carcinoma by integrated bioinformatics analysis.
PeerJ. 9:e105942021. View Article : Google Scholar : PubMed/NCBI
|
|
32
|
Thompson EB: The many roles of c-Myc in
apoptosis. Annu Rev Physiol. 60:575–600. 1998. View Article : Google Scholar : PubMed/NCBI
|
|
33
|
Meškytė EM, Keskas S and Ciribilli Y: MYC
as a multifaceted regulator of tumor microenvironment leading to
metastasis. Int J Mol Sci. 21:77102020. View Article : Google Scholar : PubMed/NCBI
|
|
34
|
Dang CV: MYC on the path to cancer. Cell.
149:22–35. 2012. View Article : Google Scholar : PubMed/NCBI
|
|
35
|
Dhanasekaran R, Deutzmann A,
Mahauad-Fernandez WD, Hansen AS, Gouw AM and Felsher DW: The MYC
oncogene-the grand orchestrator of cancer growth and immune
evasion. Nat Rev Clin Oncol. 19:23–36. 2022. View Article : Google Scholar
|
|
36
|
Gao FY, Li XT, Xu K, Wang RT and Guan XX:
c-MYC mediates the crosstalk between breast cancer cells and tumor
microenvironment. Cell Commun Signal. 21:282023. View Article : Google Scholar : PubMed/NCBI
|
|
37
|
Janku F, Yap TA and Meric-Bernstam F:
Targeting the PI3K pathway in cancer: Are we making headway? Nat
Rev Clin Oncol. 15:273–291. 2018. View Article : Google Scholar : PubMed/NCBI
|
|
38
|
Alzahrani AS: PI3K/Akt/mTOR inhibitors in
cancer: At the bench and bedside. Semin Cancer Biol. 59:125–132.
2019. View Article : Google Scholar : PubMed/NCBI
|
|
39
|
Peng Y, Wang Y, Zhou C, Mei W and Zeng C:
PI3K/Akt/mTOR pathway and its role in cancer therapeutics: Are we
making headway? Front Oncol. 12:8191282022. View Article : Google Scholar : PubMed/NCBI
|
|
40
|
Guo C, He J, Song X, Tan L, Wang M, Jiang
P, Li Y, Cao Z and Peng C: Pharmacological properties and
derivatives of shikonin-A review in recent years. Pharmacol Res.
149:1044632019. View Article : Google Scholar : PubMed/NCBI
|
|
41
|
Rebello RJ, Pearson RB, Hannan RD and
Furic L: Therapeutic approaches targeting MYC-driven prostate
cancer. Genes (Basel). 8:712017. View Article : Google Scholar : PubMed/NCBI
|
|
42
|
Nussinov R, Tsai CJ, Jang H, Korcsmáros T
and Csermely P: Oncogenic KRAS signaling and YAP1/β-catenin:
Similar cell cycle control in tumor initiation. Semin Cell Dev
Biol. 58:79–85. 2016. View Article : Google Scholar : PubMed/NCBI
|
|
43
|
Beck M, Covino R, Hänelt I and
Müller-McNicoll M: Understanding the cell: Future views of
structural biology. Cell. 187:545–562. 2024. View Article : Google Scholar : PubMed/NCBI
|