Introduction
Diabetes-associated cognitive decline (DACD) is a
chronic complication of diabetes with a complex pathogenesis
(1). Diabetic patients face a
notably higher risk of cognitive impairment, which manifests as
decreased memory, reduced cognitive flexibility and, in severe
instances, intellectual decline and behavioral abnormalities. This
results in a decline in patients' self-management abilities and an
increased dependency on caregivers, which further accelerates the
progression of diabetes, creating a vicious cycle. (2). According to a previous study
(3), DACD affects ~30% of
patients with diabetes. Compared with the general population,
patients with DCI are more likely to develop Alzheimer's disease.
This significantly increases the economic burden on families and
society, emerging as a worldwide health problem that requires
immediate attention and resolution.
The etiology of DACD is complex, and its
pathogenesis has not been completely clarified (4). A previous study reported that
insulin resistance is not only a significant feature of diabetes
but is also associated with diabetic cognitive dysfunction,
particularly in patients with type 2 diabetes mellitus (T2DM)
(5). Chronic hyperglycemia in
patients with diabetes results in neuronal damage and cognitive
decline, predominantly impacting the hippocampus and prefrontal
cortex-regions crucial for memory and executive function. The
impact of oxidative stress on neuronal cells has been extensively
studied, revealing that it can lead to various forms of cellular
damage, including apoptosis and necrosis. For instance, in a study
involving SH-SY5Y neuronal cells, it was demonstrated that
oxidative stress resulted in increased reactive oxygen species
(ROS) production, which subsequently led to decreased cell
viability and enhanced necrotic cell death (6). In diabetes, oxidative stress arises
from various sources, including hyperglycemia and mitochondrial
dysfunction, leading to an imbalance in the redox state of neuronal
cells (7). Oxidative stress
underlies numerous pathologies, including neuroinflammation
(8), apoptosis (9) and neurological
disorders/neurodegeneration (10,11). It is clear that there is a need
for the development of treatment methods that can both lower blood
sugar levels and target these specific pathways. It is crucial to
conduct research aimed at identifying hypoglycemic drugs with
neuroprotective properties.
In recent years, there has been growing interest in
discovering a new class of drugs with significant biological
activities and numerous clinical benefits derived from
glucagon-like peptide-1 (GLP-1) receptor agonists used in
glucose-lowering therapy (12).
Semaglutide is a long-acting GLP-1 analogue that shares 94%
homology with human GLP-1 (13).
It replicates the effects of the natural hormone GLP-1 by enhancing
insulin secretion, suppressing glucagon release, and slowing
gastric emptying. These actions contribute to improved blood
glucose control and some benefits beyond glucose lowering (14-16). In the field of neuroscience,
semaglutide has shown significant potential as a neuroprotective
agent in rodent models. Its effects on seizures, neuronal damage,
cognitive function and other neurobiological aspects make it a
compelling candidate for further investigation in clinical settings
(17). However, there are only a
few studies focusing on the mechanism of semaglutide on DACD,
therefore it is necessary to perform a comprehensive and systematic
transcriptome and proteome analysis of DACD brain tissues.
The aim of the present study was to elucidate how
semaglutide mitigates DACD and investigate the underlying
mechanisms responsible for reducing oxidative stress. Integrated
transcriptomic and proteomic analyses were employed to identify key
factors and specific pathways associated with oxidative stress that
are both activated by DACD and modulated by semaglutide.
Materials and methods
Animals
A total of 50 male C57BL/6J mice (8-week-old) were
procured from Beijing SiPeiFu Biotechnology Co., Ltd. [SCXK (Jing)
2019-0004]. The mice (weight, 25-32 g) were housed in groups of
four to five per cage, maintained under standard temperature
conditions with a 12/12-h light/dark cycle. They had ad
libitum access to food and water throughout the experiment. All
experimental procedures and animal care protocols were approved
(approval no. zryhyy61-2 4-02-25) by the Ethics Committee of
China-Japan Friendship Hospital (Beijing, China). T2DM was induced
in the mice according to a previously established protocol
(18). Briefly, the mice were
fed a high-fat diet (HFD) comprising 60% fat for 4 weeks. Following
this, they received intraperitoneal injections of streptozotocin
(STZ) at a dose of 25 mg/kg/day for 5 consecutive days. Control
mice were administered an equivalent volume of PBS (1X)
intraperitoneally for the same duration after a 4-week period of
feeding on a standard chow diet. Diabetes was confirmed if blood
glucose levels exceeded 300 mg/dl 16 days after the final STZ
injection. Blood glucose levels were measured using Accu-Chek
glucose strips from tail vein blood samples. After establishing the
model, mice were administered subcutaneous injections of either
saline or semaglutide every day for 16 weeks leading up to the
behavioral experiment. Diabetic mice (n=20 per group) were
randomized into two groups: The T2DM and semaglutide (Sema) groups.
The mice in both groups were fed an HFD diet. Mice in the sema
group received daily subcutaneous injections of semaglutide (Novo
Nordisk) at a dose of 10 μg/kg. The dosing regimen for
semaglutide began with 2.5 μg/kg/day during the first week,
increased to 5 μg/kg/day in the second week, and then was
maintained at 10 μg/kg/day for the rest of the study. The
dosage of semaglutide was determined based on previous studies
(19,20) and the results of the preliminary
experiments. In our preliminary experiments, no adverse effects
were observed in mice following this administration strategy. This
gradual adjustment may help reduce gastrointestinal side effects
and optimize therapeutic efficacy. Mice received an equal volume of
0.9% saline and were fed with a regular diet. Subsequently, the
mice were fasted overnight (12 h) and administered their final dose
of semaglutide or saline at 08:00.
Morris water maze (MWM) test
The MWM test was used to evaluate spatial learning
and memory capacity. The study protocol has been previously
described in detail (21). The
test was conducted 16 weeks after the establishment of the model in
a grey circular pool with a diameter of 150 cm, divided into four
equal quadrants, each filled with water maintained at 30±2°C and
with a depth of 16 cm. An overhead camera was positioned centrally
above the pool and linked to a computerized recording system
equipped with a tracking program (DigBehv; Shanghai Jiliang
Software Technology Co., Ltd.) capable of monitoring and recording
the swimming paths of the mice.
The testing protocol involved conducting four trials
on the platform each day over a 5-day acquisition phase, followed
by a probe trial on day 6. During the acquisition phase, mice were
placed in a water pool within a quadrant where the platform was not
present, and given 60 sec to locate the hidden platform. If a mouse
failed to find the platform within this time frame, it was gently
guided to the platform and allowed to stay there for 15 sec,
reinforcing memory of the platform's location. Data were recorded
at the 90-sec mark. This procedure was repeated four times daily
until performance improvements plateaued. On day 6, the platform
was removed, and each mouse was allowed to swim freely for 60 sec
from the same starting position, which was opposite the original
platform location. The time spent in the target quadrant and the
total swimming duration were recorded for further analysis.
Novel object recognition (NOR) and novel
object location recognition (NOL) tests
The NOL and NOR tests were used to assess learning
and memory functions in each group, following established protocols
(22). These tests were
administered 16 weeks after the model was established. Initially,
mice were acclimated to an empty wooden chamber for 15 min. After a
24-h period, each mouse was placed back in the same chamber, where
two identical objects were positioned in the corners. The mice were
allowed to explore the chamber freely until they had spent a total
of 30 sec interacting with both objects. Exploration was defined as
the mouse approaching an object with its nose within 2 cm; climbing
or sitting on the object was not considered exploration.
After another 24-h period, the mice were returned to
the chamber, where one of the familiar objects was replaced with a
new object located in a different corner. The preference for the
novel object was measured by the proportion of time spent exploring
the new object compared with the total time spent exploring both
objects. A total of eight mice from each group were randomly
selected for the tests. The NOL test was conducted first, followed
by the NOR test 4 days later. During the NOR test, 24 h after the
initial exploration phase, one of the familiar objects was replaced
with a new one, and the percentage of time spent exploring the
novel object was calculated as a proportion of the total time spent
exploring both objects.
Hematoxylin and eosin (H&E)
staining
Brain tissues were collected following the
completion of behavioral experiments. The mice were anesthetized
using 70% CO2 narcosis and subsequently euthanized via
cervical dislocation. To assess the extent of the neuronal damage,
the authors adhered to the H&E staining protocol provided by
Beijing Solarbio Science & Technology. Histological changes in
the hippocampal regions were examined using an optical microscope
(Olympus Corporation) at a magnification of ×200. Neuronal counts
were conducted in the CA1, CA3, DG pyramidal cell layers and cortex
by counting neurons per 250 μm segment across five sections
per mouse, with the average count representing the final
result.
TUNEL staining
The apoptosis assays were conducted using the TUNEL
Apoptosis Assay kit (cat. no. C1088; Beyotime Institute of
Biotechnology), according to the manufacturer's protocol.
Hippocampal sections were initially fixed with 4% paraformaldehyde
for 30 min at room temperature, followed by two washes with 0.01 M
PBS (10 min each), and a 5-min incubation at room temperature with
0.5% Triton X-100/PBS. The TUNEL assay solution was then applied to
the slides, which were covered with anti-evaporation film and
incubated at 37°C for 60 min in the dark. After staining the
cellular nuclei with DAPI (5 μg/ml) for 10 min at room
temperature, the slides were washed three times, each wash lasting
5 min. Finally, the slides were cover-slipped using a 50% glycerin
mounting medium. The stained tissue sections were examined using a
fluorescence microscope (Olympus Corporation). A total of five
randomly selected fields were observed under the microscope at a
magnification of ×200 to determine the total number of neurons and
the count of TUNEL-positive neurons. The percentage of apoptotic
neurons was calculated using the formula: (TUNEL-positive
neurons/total neurons) ×100%.
Transcriptome analysis
For the RNA sequencing (RNA-seq) experiments,
hippocampus samples were isolated and sent to Huada Gene Research
Institute (Guangdong, China) for RNA preparation and sequencing. A
total of three mice from each group were randomly selected to serve
as biological replicates, and their total RNA was extracted using
the TRIzol® reagent kit (Thermo Fisher Scientific,
Inc.). The quality of the extracted RNA was assessed using the
Agilent 2100 Bioanalyzer (Agilent Technologies, Inc.). Samples with
A260/A280 ratios >1.8 were further evaluated. Subsequently, mRNA
was enriched and fragmented into shorter sequences and
reverse-transcribed into cDNA. The second-strand cDNA was
synthesized using a second-strand synthesis reaction system
(Invitrogen; Thermo Fisher Scientific, Inc.). The second-strand
cDNA was subsequently purified, end-repaired, polyadenylated and
ligated to Illumina sequencing adapters (Illumina, Inc.). The
resultant products were sequenced using the Illumina HiSeq 2500
platform (Illumina, Inc.).
Principal component analysis (PCA) and Pearson
correlation coefficient (PCC) were performed with the R package
gmodels (23). The clean data
were aligned to the Mus musculus genome (GRCm38). Next, the data
were aligned to the reference gene sequence using Bowtie 2
(http://bowtie-bio.sourceforge.net/bowtie2/index.shtml),
and the expression levels of genes and transcripts were calculated
using RNA-Seq by Expectation-Maximization. Differential expression
analysis was conducted using DESeq2 (https://github.com/mikelove/DESeq2). Genes with a
P<0.001 (adjusted using the Benjamini and Hochberg method) and a
fold change of >2.0 were identified as differentially expressed.
These differentially expressed genes (DEGs) were classified and
enriched using Gene Ontology (GO) and Kyoto Encyclopedia of Genes
and Genomes (KEGG) pathway annotation.
Quantitative proteomics analysis
A total of three replicates of each group of
hippocampus samples were measured in parallel. The proteomic
analysis was conducted at the Jingjie PTM BioLab Co., Ltd.
Proteomics Facility, following established protocols (24). Proteins extracted from
hippocampal cell lysates were quantified using bicinchoninic acid
assay. The proteins were subjected to trypsin digestion at a
protein-to-protease ratio of 50:1 (w/w) for 12 h. Next, protein was
subjected to cysteine reduction and alkylation using sequential
incubation with 5 mM dithiothreitol at 56°C for 30 min and 11 nM
iodoacetamide for 15 min at room temperature in the dark. The
resulting peptides were resuspended in mobile phase A (0.1% formic
acid +2% acetonitrile) for subsequent liquid chromatography, and
were separated using a NanoElute ultrahigh-performance liquid
chromatography system (Bruker Daltonics; Bruker Corporation). The
gradient for phase B (0.1% formic acid +100% acetonitrile) was
programmed as follows: 6-24% from 0-70 min, 24-35% from 70-84 min,
35-80% from 84-87 min and 80% from 87-90 min, with a flow rate of
450 nl/min. During the separation process, peptides were ionized
using a capillary ion source and subsequently analyzed using a
TIMS-TOF Pro mass spectrometer (Bruker Daltonics). The pulse
voltage was set at 1.65 kV, and peptide precursors along with their
secondary fragments were analyzed using high-resolution
LC/Q-TOF-MS. The scan range for the secondary mass spectrometry was
set between 400 and 1,500 m/z.
The DESeq2 R software package (version 3.14) was
used to conduct differential expression analysis among the three
groups. Fold-changes were calculated to compare the three groups.
Proteins with an adjusted P<0.05 and an absolute fold-change
>1.2 were considered differentially expressed. The GO and KEGG
pathway enrichment analyses of differentially expressed proteins
(DEPs) were conducted using clusterProfiler (version 3.4.4,
https://guangchuangyu.github.io/software/clusterProfiler).
Gene Set Enrichment Analysis (GSEA) was performed using GSEA
software (version 4.1.0, http://www.broadinstitute.org/gsea).
mRNA and protein correlation
analyses
First, DEGs and DEPs were identified among the
groups. Genes with a fold change ≥1.2 and P<0.05 were considered
significant DEGs, while proteins with a fold change of >1.5 and
P<0.05 were considered significant DEPs. Subsequently, the
association between genes and proteins was quantitatively analyzed.
The detected genes/proteins and the DEGs/DEPs in both the
transcriptome and proteome were counted separately. A Venn diagram
was created using this data. In addition, a nine-quadrant map
analysis was performed to illustrate the correlation between genes
and proteins. This analysis was conducted using R language (version
3.5.1). To assess functional enrichment, GO biological process (BP)
terms and KEGG pathway analysis of mRNAs were applied to the
nine-quadrant map. A correlation analysis between GO functions and
KEGG pathway information in the transcriptome and proteome was
carried out, comparing the similarities and differences in gene
function and metabolic pathways between the two groups.
Western blot analysis
Total proteins were extracted by the Total Protein
Extraction Kit (cat. no. KGB5303; Nanjing KeyGen Biotech Co.,
Ltd.). The protein concentrations were determined by the
bicinchoninic acid assay. Following the quantification of the total
protein concentration extracted from primary microglia in
vitro, a loading buffer was added to the samples for
high-temperature denaturation. Denatured protein samples (20
μg) were then separated using SDS-PAGE (Wako Supersep™ Ace,
5-20%) and transferred onto PVDF membranes (Invitrogen; Thermo
Fisher Scientific, Inc.) soaked in transfer buffer. To prevent
non-specific binding, the membranes were blocked with 5% non-fat
milk for 1 h at room temperature. Primary antibodies against
Acyl-CoA oxidase 1 (ACOX1; 1:5,000; cat. no. PA5-76341; RRID:
AB_2720068), GLP-1R (1:2,000; cat. no. PA5-97790; RRID: AB_2812405)
and β-actin (1:5,000; cat. no. MA1-140; RRID: AB_2536844; all from
Invitrogen; Thermo Fisher Scientific, Inc.) were applied at 4°C to
the blots overnight. After washing with Tris-buffered saline
containing 0.05% Tween-20 (TBST), the protein bands were incubated
with an anti-rabbit IgG HRP-linked secondary antibody (1:3,000;
cat. no. CST-7074S; Cell Signaling Technology, Inc.) at room
temperature for 1 h. The fluorescence intensity of the specific
antibody on the protein bands was then detected using an enhanced
chemiluminescent reagent (Bio-Rad Laboratories, Inc.). The
resulting blots were quantified via densitometric analysis using
ImageJ (Image Lab 4.1; Bio-Rad Laboratories, Inc.). Uncropped blots
are shown in Fig. S1A-E.
Reverse transcription-quantitative
polymerase chain reaction (RT-qPCR)
Tissue and cell lysis were conducted using a
TRIzol-based cell lysis buffer (Invitrogen; Thermo Fisher
Scientific, Inc.). Following this, complementary DNA (cDNA)
synthesis was performed with the PrimeScriptTM RT
reagent kit (cat. no. RR037A; Takara Bio, Inc.), following the
manufacturer's protocol. The PCR cycle parameters were as follows:
94°C for 2 min; 40 cycles with denaturation at 94°C for 20 sec,
annealing at 60°C for 20 sec and extension at 72°C for 20 sec. Gene
expression levels were then quantified through qPCR analysis using
SYBR-Green mix (Roche Diagnostics). The primer sequences used are
provided in Table SI. β-actin
was used as the reference gene for normalizing mRNA expression
levels. Analysis of relative gene expression data was conducted
using the 2−ΔΔCq method (25).
Cell culture
Primary hippocampal neuronal cultures were generated
from C57BL/6 mice using standard protocols (26). Primary hippocampal neurons were
isolated from P0-P1 wild-type mouse pups. Hippocampi were
dissected, dissociated with 0.25% trypsin, and plated onto
poly-D-lysine-coated coverslips (for imaging) or 6-well plates (for
biochemical analysis) at a density of 7,500 cells/cm. Hippocampal
neuronal cultures were cultured in neurobasal medium supplemented
with GlutaMax (Gibco; Thermo Fisher Scientific, Inc.) and B-27 and
incubated at 37°C with 5% CO2 in a humidified incubator.
To simulate an in vivo model of diabetes induced by HFD and
STZ, an in vitro approach using high glucose (HG)
supplemented with palmitic acid (Pal) was employed as previously
described (26). The HG+Pal
medium contained 200 μM Pal and 25 mM glucose.
Administration of plasmids, small
interfering (siRNA) or semaglutide
GLP-1 receptor (GLP-1R) expression in primary
hippocampal neurons was silenced using siRNA transfection. Primary
hippocampal neurons were transfected with GLP-1R siRNA (50 nM;
Shanghai GeneChem Co., Ltd.) using Lipofectamine® 2000
(Thermo Fisher Scientific, Inc.) at 37°C, according to the
manufacturer's protocol. The inhibitory efficiency was verified
using western blotting (Fig.
S2A). A total of 6 h post-transfection, the medium was replaced
with one containing 5% FBS for 24 h before proceeding with
additional experiments. In order to investigate whether semaglutide
could regulate oxidative stress through ACOX1, ACOX1 overexpression
was accomplished via pcDNA3.1-ACOX1-GFP transfection. Primary
hippocampal neurons were divided into the following groups: i)
Control group (NC); ii) HG + Pal group; iii) HG + Pal + Sema group
(HG + Pal + Sema); iv) HG + Pal + siRNA GLP-1R group (HG + Pal +
siRNA GLP-1R); v) HG + Pal + siRNA NC group; vi) HG + Pal + Sema +
pcDNA3.1-ACOX1-GFP group; and vii) HG + Pal + Sema + pcDNA3.1-GFP
group. pcDNA3.1-ACOX1-GFP and pcDNA3.1-GFP were purchased from
Thermo Fisher Scientific, Inc. Cells were cultured with or without
semaglutide (4 μg/ml, 99.84%, HY-114118; MedChemExpress) and
incubated for 48 h at 37°C. Following treatment, cells were
prepared for immunofluorescence, western blotting, and oxidative
and antioxidant measurements.
Examination for
H2O2, catalase (CAT), malondialdehyde (MDA),
superoxide dismutase (SOD) and glutathione (GSH)
Hippocampal supernatants and primary hippocampal
cultures were assayed for mouse oxidative stress levels (CAT, MDA,
SOD and GSH) using testing kits from Nanjing Jiancheng
Bioengineering Institute (cat. nos. A007-2-1, A003-1-2, A001-1-1
and A006-1-1, respectively). H2O2 levels were
tested using a commercial kit (cat. no. S0038; Beyotime Institute
of Biotechnology). All procedures were conducted according to the
manufacturer's protocol.
Cell viability
The viability of primary hippocampal cultures
following exposure to pcDNA3.1-ACOX1-GFP or pcDNA3.1-GFP was
assessed using a Cell Counting Kit-8 assay (cat. no. CK04; Dojindo
Molecular Technologies, Inc.) at the time points of 0, 12, 24 and
48 h. Briefly, cells were seeded into 96-well plates at a density
of 2,000 cells per well and cultured until confluence. Next, 10
μl of CCK-8 solution was added to each well and incubated at
37°C for 2-3 h. Optical absorbance at 450 nm was then measured
using a microplate reader (Tecan Group, Ltd.).
Adeno-associated virus
administration
To increase ACOX1 expression in mice, AAV8-Alb-ACOX1
or AAV8-Alb-eGFP which was resuspended in PBS was injected into the
tail vein at a dose of 1e11 gc per mouse. Hippocampal tissues were
collected 16 weeks after semaglutide treatment and 3 weeks post-AAV
injection. The activation efficacies are shown in Fig. S2B.
Immunofluorescence
For immunofluorescence, the 4-μm sections
were first deparaffinized with xylene and rehydrated with an
ethanol series. Next, they were blocked with goat serum for 1 h and
then incubated overnight at 4°C with primary antibodies against
NEUN (1:500; cat. no. PA5-78499; RRID: AB_2736206), 4HNE (1:50;
cat. no. MA5-27570; RRID: AB_2735095; both from Invitrogen; Thermo
Fisher Scientific, Inc.), followed by incubation with secondary
antibodies conjugated with Alexa Fluor 488 (green) and Alexa Fluor
594 (red) (1:500; cat. no. A-11001; RRID: AB_2534069; 1:500; cat.
no. A-11012; RRID: AB_2534079; Invitrogen; Thermo Fisher
Scientific, Inc.) for 2h at room temperature. After mounting on
slides, the samples were examined and imaged using a Zeiss Axio
Observer 3 fluorescence microscope (Carl Zeiss AG). ImageJ software
(v. 1.53; National Institutes of Health) was used to measure the
mean fluorescence intensity, and 4HNE-positive and NEUN-positive
cells were manually counted.
Statistical analysis
Statistical analysis was performed using one-way
ANOVA with Tukey's or Dunnett's post-hoc tests for multiple
comparisons, utilizing GraphPad Prism 7 software (GraphPad Prism
Software, Inc.; Dotmatics) unless otherwise noted. Quantitative
data from three independent biological replicates are presented as
the mean ± standard deviation. Unless otherwise specified, all
experiments were conducted with three independent biological
replicates. A two-sided P<0.05 was considered to indicate a
statistically significant difference.
Results
Hyperglycemia has the potential to impair
cognitive function
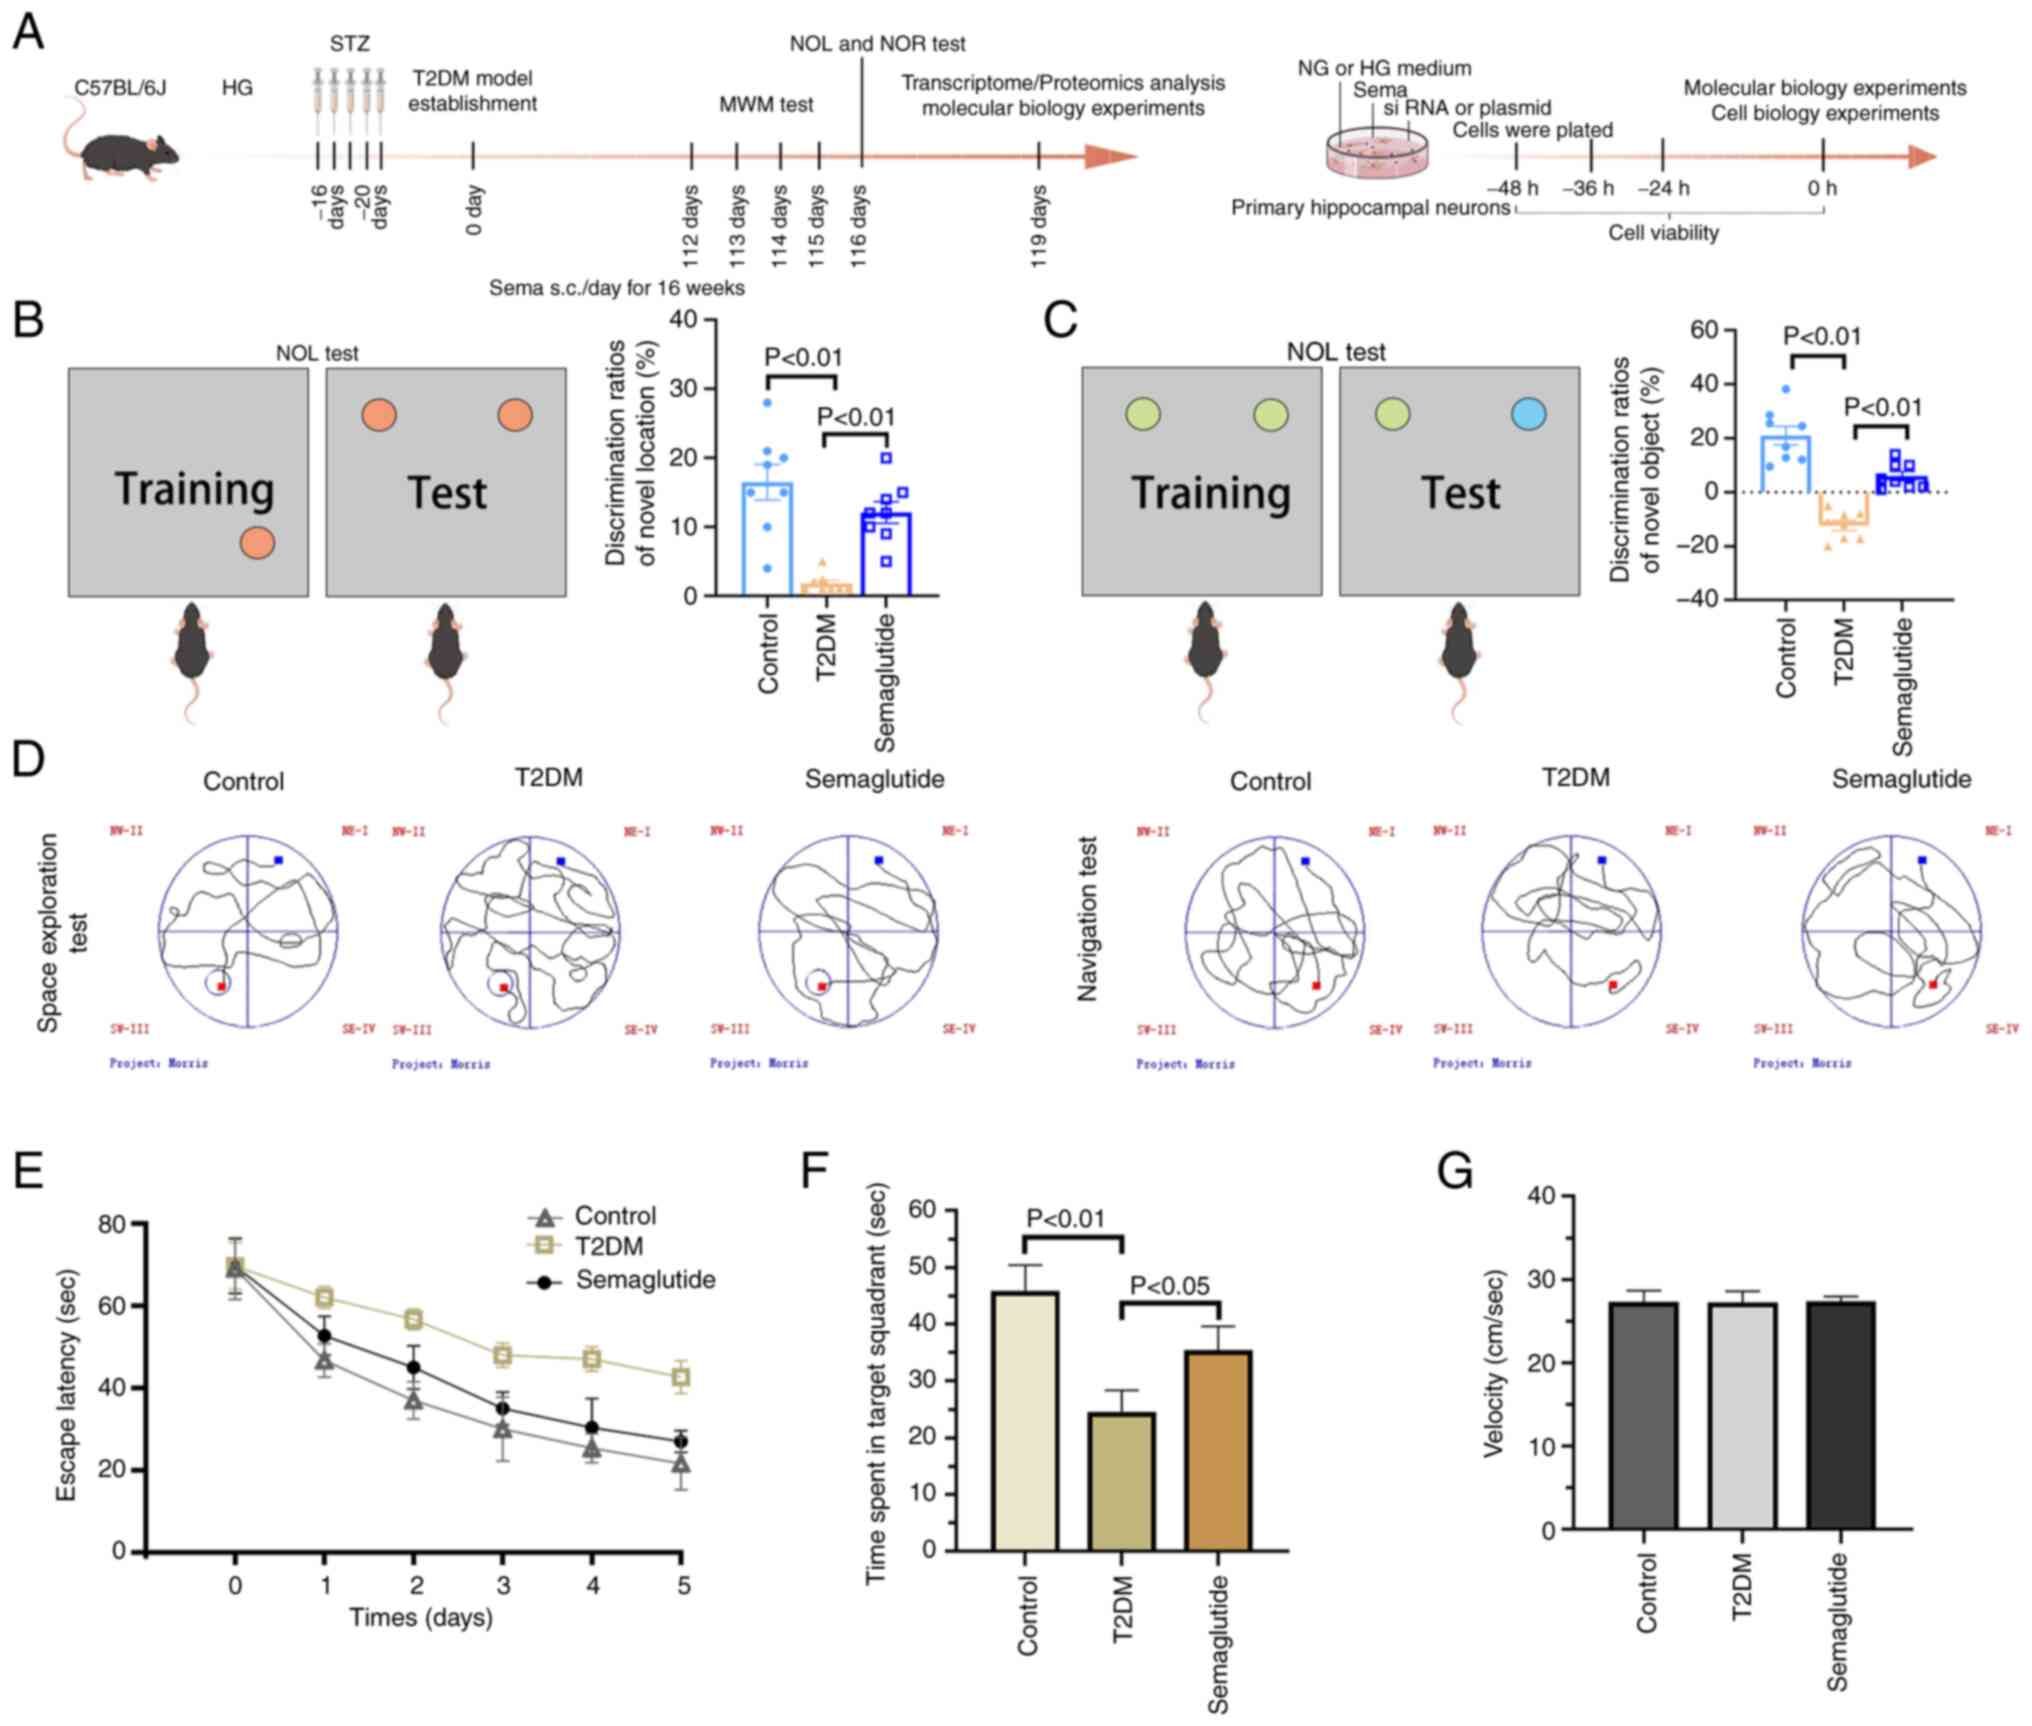
A flow chart for the experiments is shown in
Fig. 1A. In the NOL test,
control mice spent more time exploring the object placed at a new
location (Fig. 1B). Mice in the
Sema group spent significantly more time attending the object in
the novel location. By contrast, T2DM mice did not display any
preference for either object. In both the NOL and NOR test,
semaglutide improved long-term cognitive impairment in T2DM mice
(Fig. 1C). Spatial learning and
memory were assessed using the MWM. Mice with T2DM displayed a
significantly longer time to find the hidden platform in the MWM
task compared with age-matched control mice (Fig. 1D and E). Semaglutide improved the
learning ability shown by decreased escape latency during the
positioning navigation experiment. In subsequent probe trials, T2DM
mice exhibited a decreased preference for the trained target zone
compared with the NC (Fig. 1F).
However, the mice in the Sema group spent significantly more time
in the target quadrant than those in the T2DM group. It is
noteworthy that all groups of mice swam at comparable speeds
(Fig. 1G).
Hyperglycemia leads to hippocampal tissue
damage
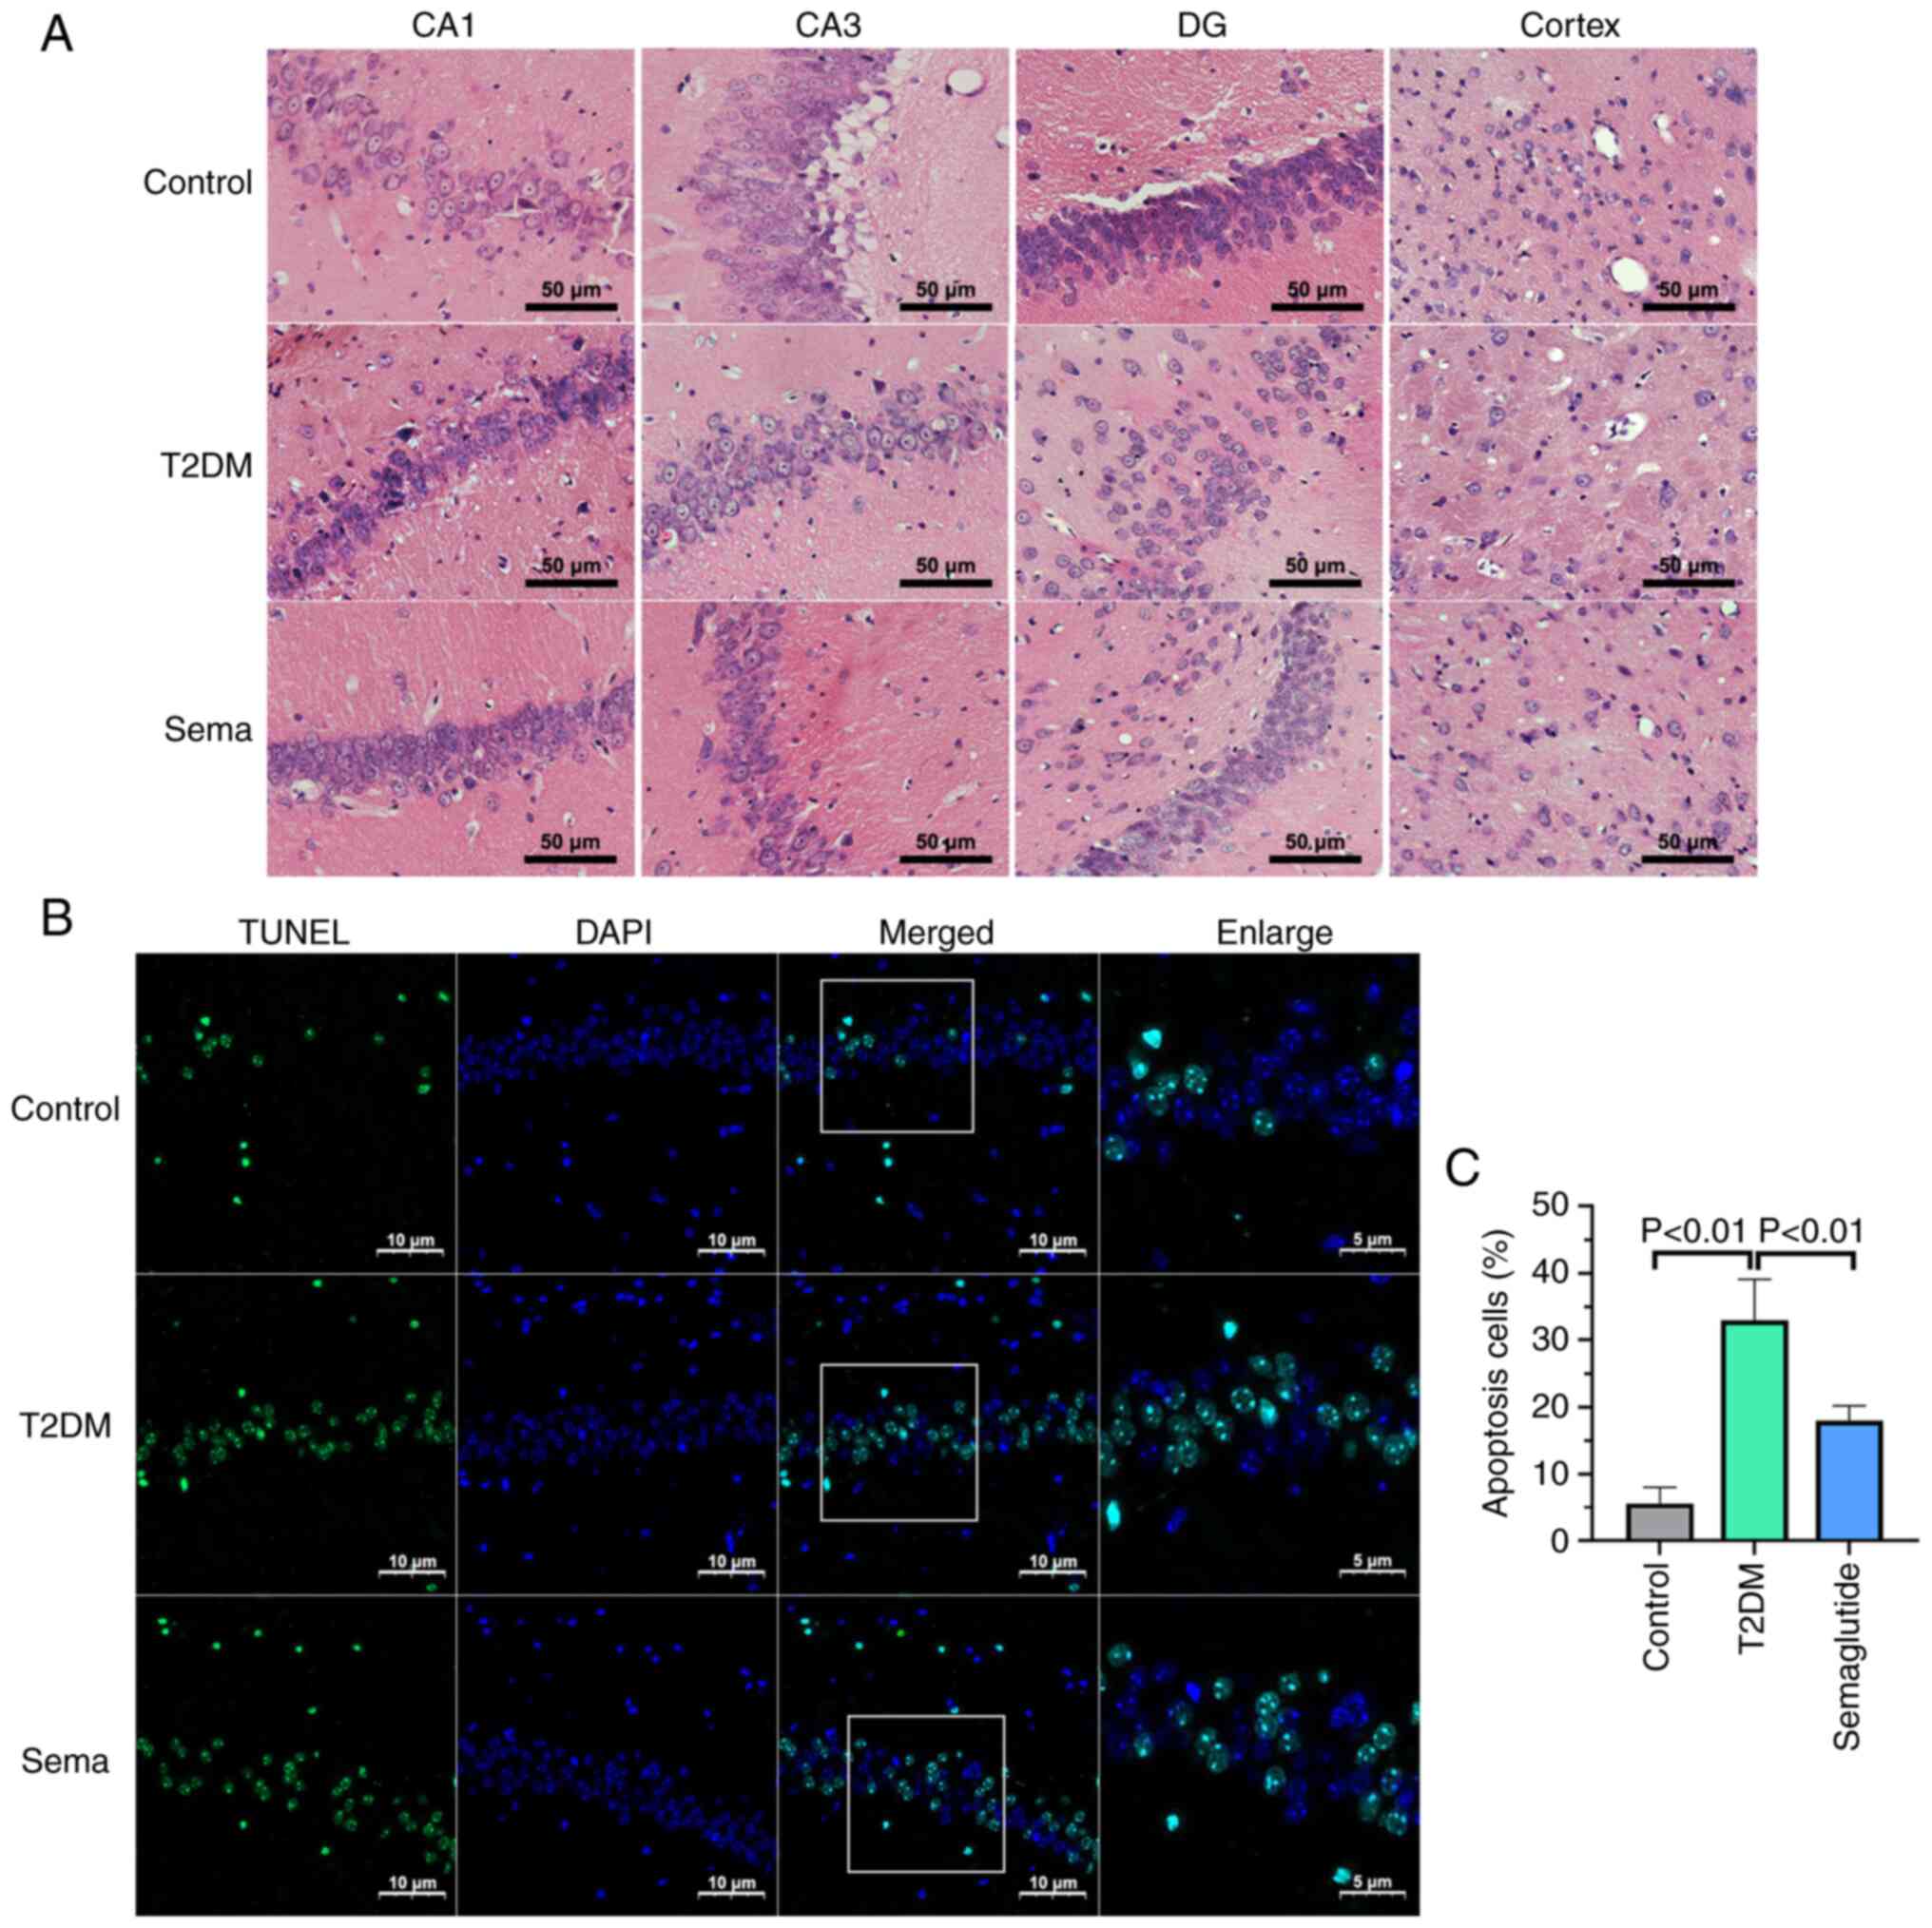
H&E staining was employed in the present study
to evaluate neuronal morphology and abundance. In the control mice,
hippocampal cells exhibited well-organized structures with no
abnormalities in morphology (Fig.
2A). Conversely, hyperglycemia in mice with T2DM resulted in
neuronal damage and loss within the hippocampus and cortex compared
with controls. Microscopic analysis revealed disrupted cellular
patterns and pyknotic nuclei in T2DM mice. Semaglutide treatment
could ameliorate cell morphology changes and cytoplasmic
contraction in HG conditions, with these alterations being
particularly prominent in the hippocampus. Of note, hippocampal
dysfunction is considered the primary pathological foundation for
cognitive decline observed in individuals with T2DM.
TUNEL staining was performed to evaluate neural cell
apoptosis. The hippocampus of T2DM mice exhibited a significantly
higher number of TUNEL-positive cells compared with the controls
(Fig. 2B). There was a
particularly robust decrease in apoptosis in hippocampus of
semaglutide-treated T2DM mice. These results suggested that
hyperglycemia may contribute to hippocampal damage and promote
neural cell death through apoptosis (Fig. 2C).
Transcriptomics analysis
To identify changes in gene expression, RNA-seq
analysis was performed to examine the transcriptome in mice from
three groups. PCA of the results revealed significant differences
in transcripts between the control and T2DM groups (Fig. S3A). Box plots showing
distribution of log10-transformed intensity of identified RNAs in
three groups (Fig. S3B)
suggested that the quality of the RNA samples was favorable. The
Pearson correlation coefficient (PCC) showed a high correlation
between biological replicates, while it was low when comparing the
(-) dimethyl sulfate (DMS) and (+) DMS libraries for each
biological replicate (Fig.
S3C).
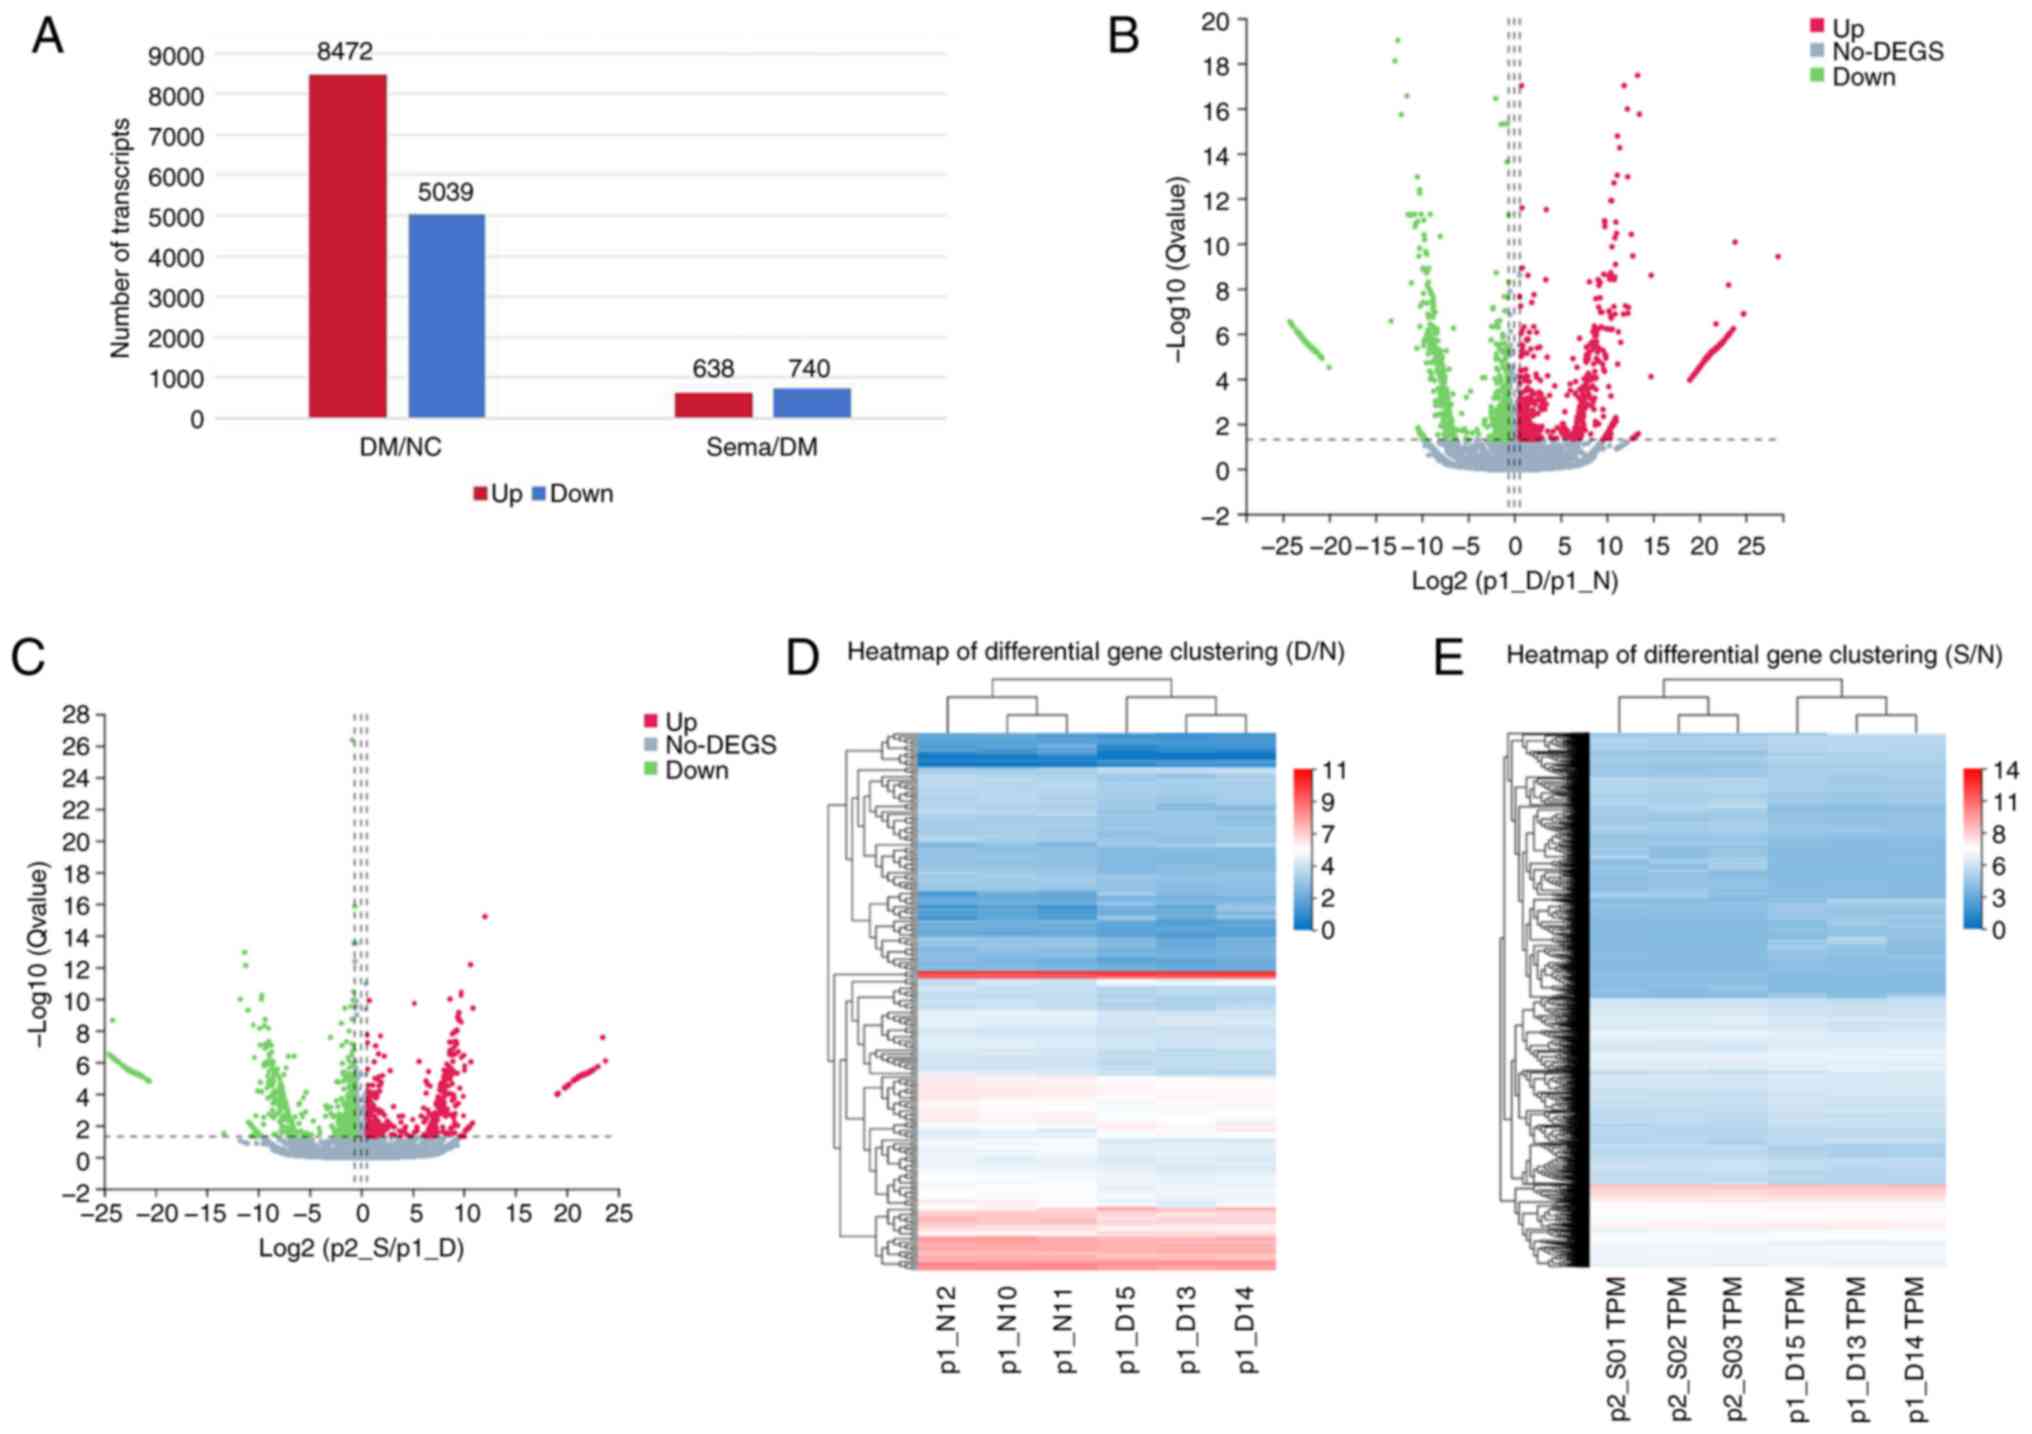
Following this analysis, bar charts (Fig. 3A) and volcano plots (Fig. 3B and C) were used to visualize
the DEGs induced by the various treatments. RNA-seq identified
74,693 genes when comparing the NC to the T2DM group, and the T2DM
group to the Sema group, respectively. Within the Control vs. T2DM
comparison, 13,511 genes were differentially expressed, with 8,472
upregulated and 5,039 downregulated (Fig. 3B). Compared with the T2DM group,
Sema treatment resulted in 1,378 DEGs, including 740 upregulated
and 638 downregulated genes (Fig.
3C). Next, the DEGs in the three groups are shown using
heatmaps (Fig. 3D and E). The
top 10 DEGs significantly upregulated/downregulated in these three
groups are listed in Table I.
These plots revealed a distinct separation in the transcriptional
profiles between the three groups, with biological replicates
clustering tightly together. This observation suggested that T2DM
and semaglutide treatment resulted in differential gene expression
patterns.
 | Table IList of top 10 differentially
expressed genes significantly upregulated/downregulated in these
three groups. |
Table I
List of top 10 differentially
expressed genes significantly upregulated/downregulated in these
three groups.
| Gene ID | T2DM/Control
| Log2(FC) |
|---|
| Gene symbol | Type |
|---|
| 100038882 | Isg15 | mRNA | 1.602249511 |
| 100042074 | Gm3650 | mRNA | 4.32462459 |
| 118568284 | LOC118568284 | mRNA | −1.40967923 |
| 12642 | Ch25h | mRNA | −2.389526237 |
| 20344 | Selp | mRNA | −4.309909401 |
| 226040 | Tmem252 | mRNA | −1.754036809 |
| 231290 | Slc10a4 | mRNA | 1.514550901 |
| 238393 | Serpina3f | mRNA | −4.175723916 |
| 442834 | D830031N03Rik | mRNA | −1.520722637 |
| 54123 | Irf7 | mRNA | 2.166235551 |
|
| Gene ID | Sema/T2DM
| Log2(FC) |
| Gene symbol | Type |
|
| 107303348 | Gm45935 | mRNA | 6.151632936 |
| 108167670 | Gm17415 | mRNA | −6.377687627 |
| 108168832 | Gm13981 | mRNA | −6.312064864 |
| 110312 | Pmch | mRNA | 6.728818468 |
| 118567798 | LOC118567798 | mRNA | −7.511450723 |
| 15171 | Hcrt | mRNA | 7.901759599 |
| 216036 | Gm4796 | mRNA | −7.158297767 |
| 353204 | Aldoart1 | mRNA | −9.75033781 |
| 433319 | Gm5528 | mRNA | −6.96612261 |
| 433745 | Gm12816 | mRNA | −7.234313084 |
Molecular alterations in proteomics
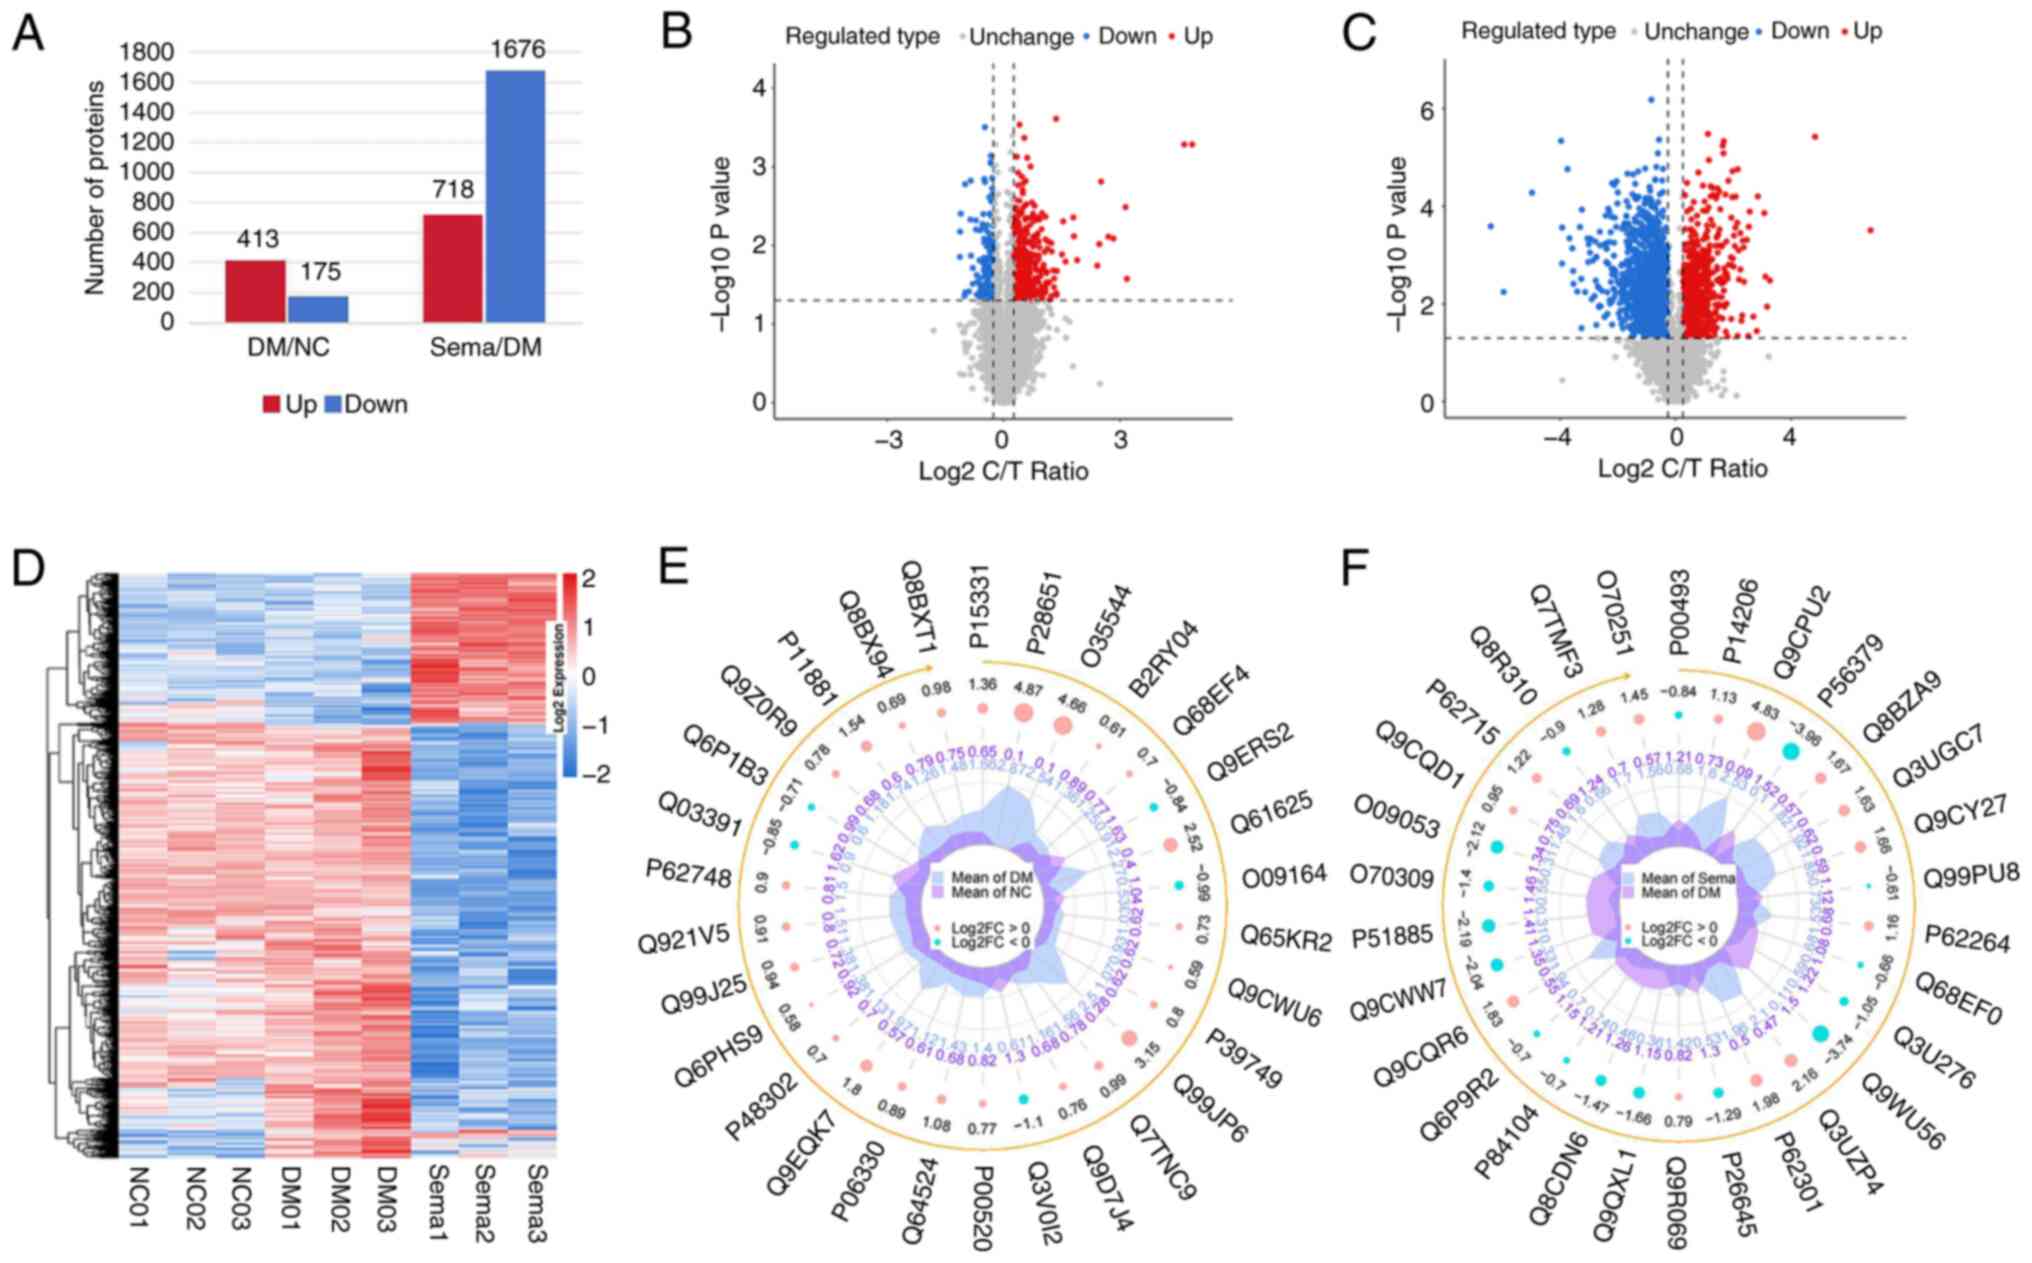
During our proteomic analysis, a comprehensive
quality evaluation was performed to ensure the accuracy of the
results. This involved assessing sample repeatability through
analysis of peptide length distribution, peptide quantity
distribution, PCC, PCA and the relative standard deviation tests
(Fig. S3D-F). The distribution
of the protein intensity profile and peptide length distribution of
the identified peptides are revealed in Fig. S3G and H. The hippocampi of the
T2DM group demonstrated significant changes in protein expression
compared with the NC. In total, 588 proteins were DEPs, with 413
being upregulated and 175 downregulated (Fig. 4A and B). Similarly, the Sema
group exhibited 2,394 DEPs in the hippocampus when compared with
the T2DM group. Similar to the T2DM group, these DEPs consisted of
718 upregulated and 1,676 downregulated proteins (Fig. 4A and C). Heatmaps (Fig. 4D) and radar plots (Fig. 4E and F) visually represent the
protein expression patterns between the Control vs. T2DM and T2DM
vs. Sema groups. The top 10 DEPs significantly
upregulated/downregulated in these three groups are listed in
Table II.
| Table IIList of top 10 differentially
expressed proteins significantly upregulated/downregulated in these
three groups. |
Table II
List of top 10 differentially
expressed proteins significantly upregulated/downregulated in these
three groups.
| Accession | T2DM/Control
| FC |
|---|
| Protein name | Gene name |
|---|
| P28651 | Carbonic
anhydrase-related protein | Ca8 | 30.73104346 |
| Q99JP6 | Homer protein
homolog 3 | Homer3 | 8.605505985 |
| Q0VEJ0 | Centrosomal protein
of 76 kDa | Cep76 | 6.493296981 |
| O35544 | Excitatory amino
acid transporter 4 | Slc1a6 | 5.854075769 |
| Q61625 | Glutamate receptor
ionotropic, delta-2 | Grid2 | 5.678624242 |
| Q0QWG9 | Delphilin OS=Mus
musculus | Grid2ip | 4.508011439 |
| Q3TGF2 | Protein
FAM107B | Fam107b | 4.364816483 |
| Q64338 | Dual specificity
calcium/calmodulin-dependent 3′,5′-cyclic nucleotide
phosphodiesterase 1C | Pde1c | 4.229122142 |
| Q9EQK7 |
Protein-S-isoprenylcysteine
O-methyltransferase | Icmt | 3.77526444 |
| Q63ZW7 | InaD-like
protein | Patj | 3.691659478 |
|
| Accession | Sema/T2DM
| FC |
| Protein name | Gene name |
|
| Q9Z0N2 | Eukaryotic
translation initiation factor 2 subunit 3, Y-linked | Eif2s3y | 107.9458757 |
| Q9CPU2 | NADH dehydrogenase
[ubiquinone] 1 beta subcomplex subunit 2, mitochondrial | Ndufb2 | 28.50007876 |
| P04104 | Keratin, type II
cytoskeletal 1 | Krt1 | 9.647625063 |
| P02535 | Keratin, type I
cytoskeletal 10 | Krt10 | 9.021370593 |
| Q3UV17 | Keratin, type II
cytoskeletal 2 oral | Krt76 | 8.672844569 |
| P02463 | Collagen
alpha-1(IV) chain | Col4a1 | 8.439254018 |
| A2AWR3 | Lysosomal
cholesterol signaling protein | Gpr155 | 7.209646232 |
| O70451 | Monocarboxylate
transporter 2 | Slc16a7 | 7.039011181 |
| Q8BQP9 | Regulator of
G-protein signaling 7-binding protein | Rgs7bp | 6.480696147 |
| P03930 | ATP synthase
protein 8 | Mtatp8 | 5.936756791 |
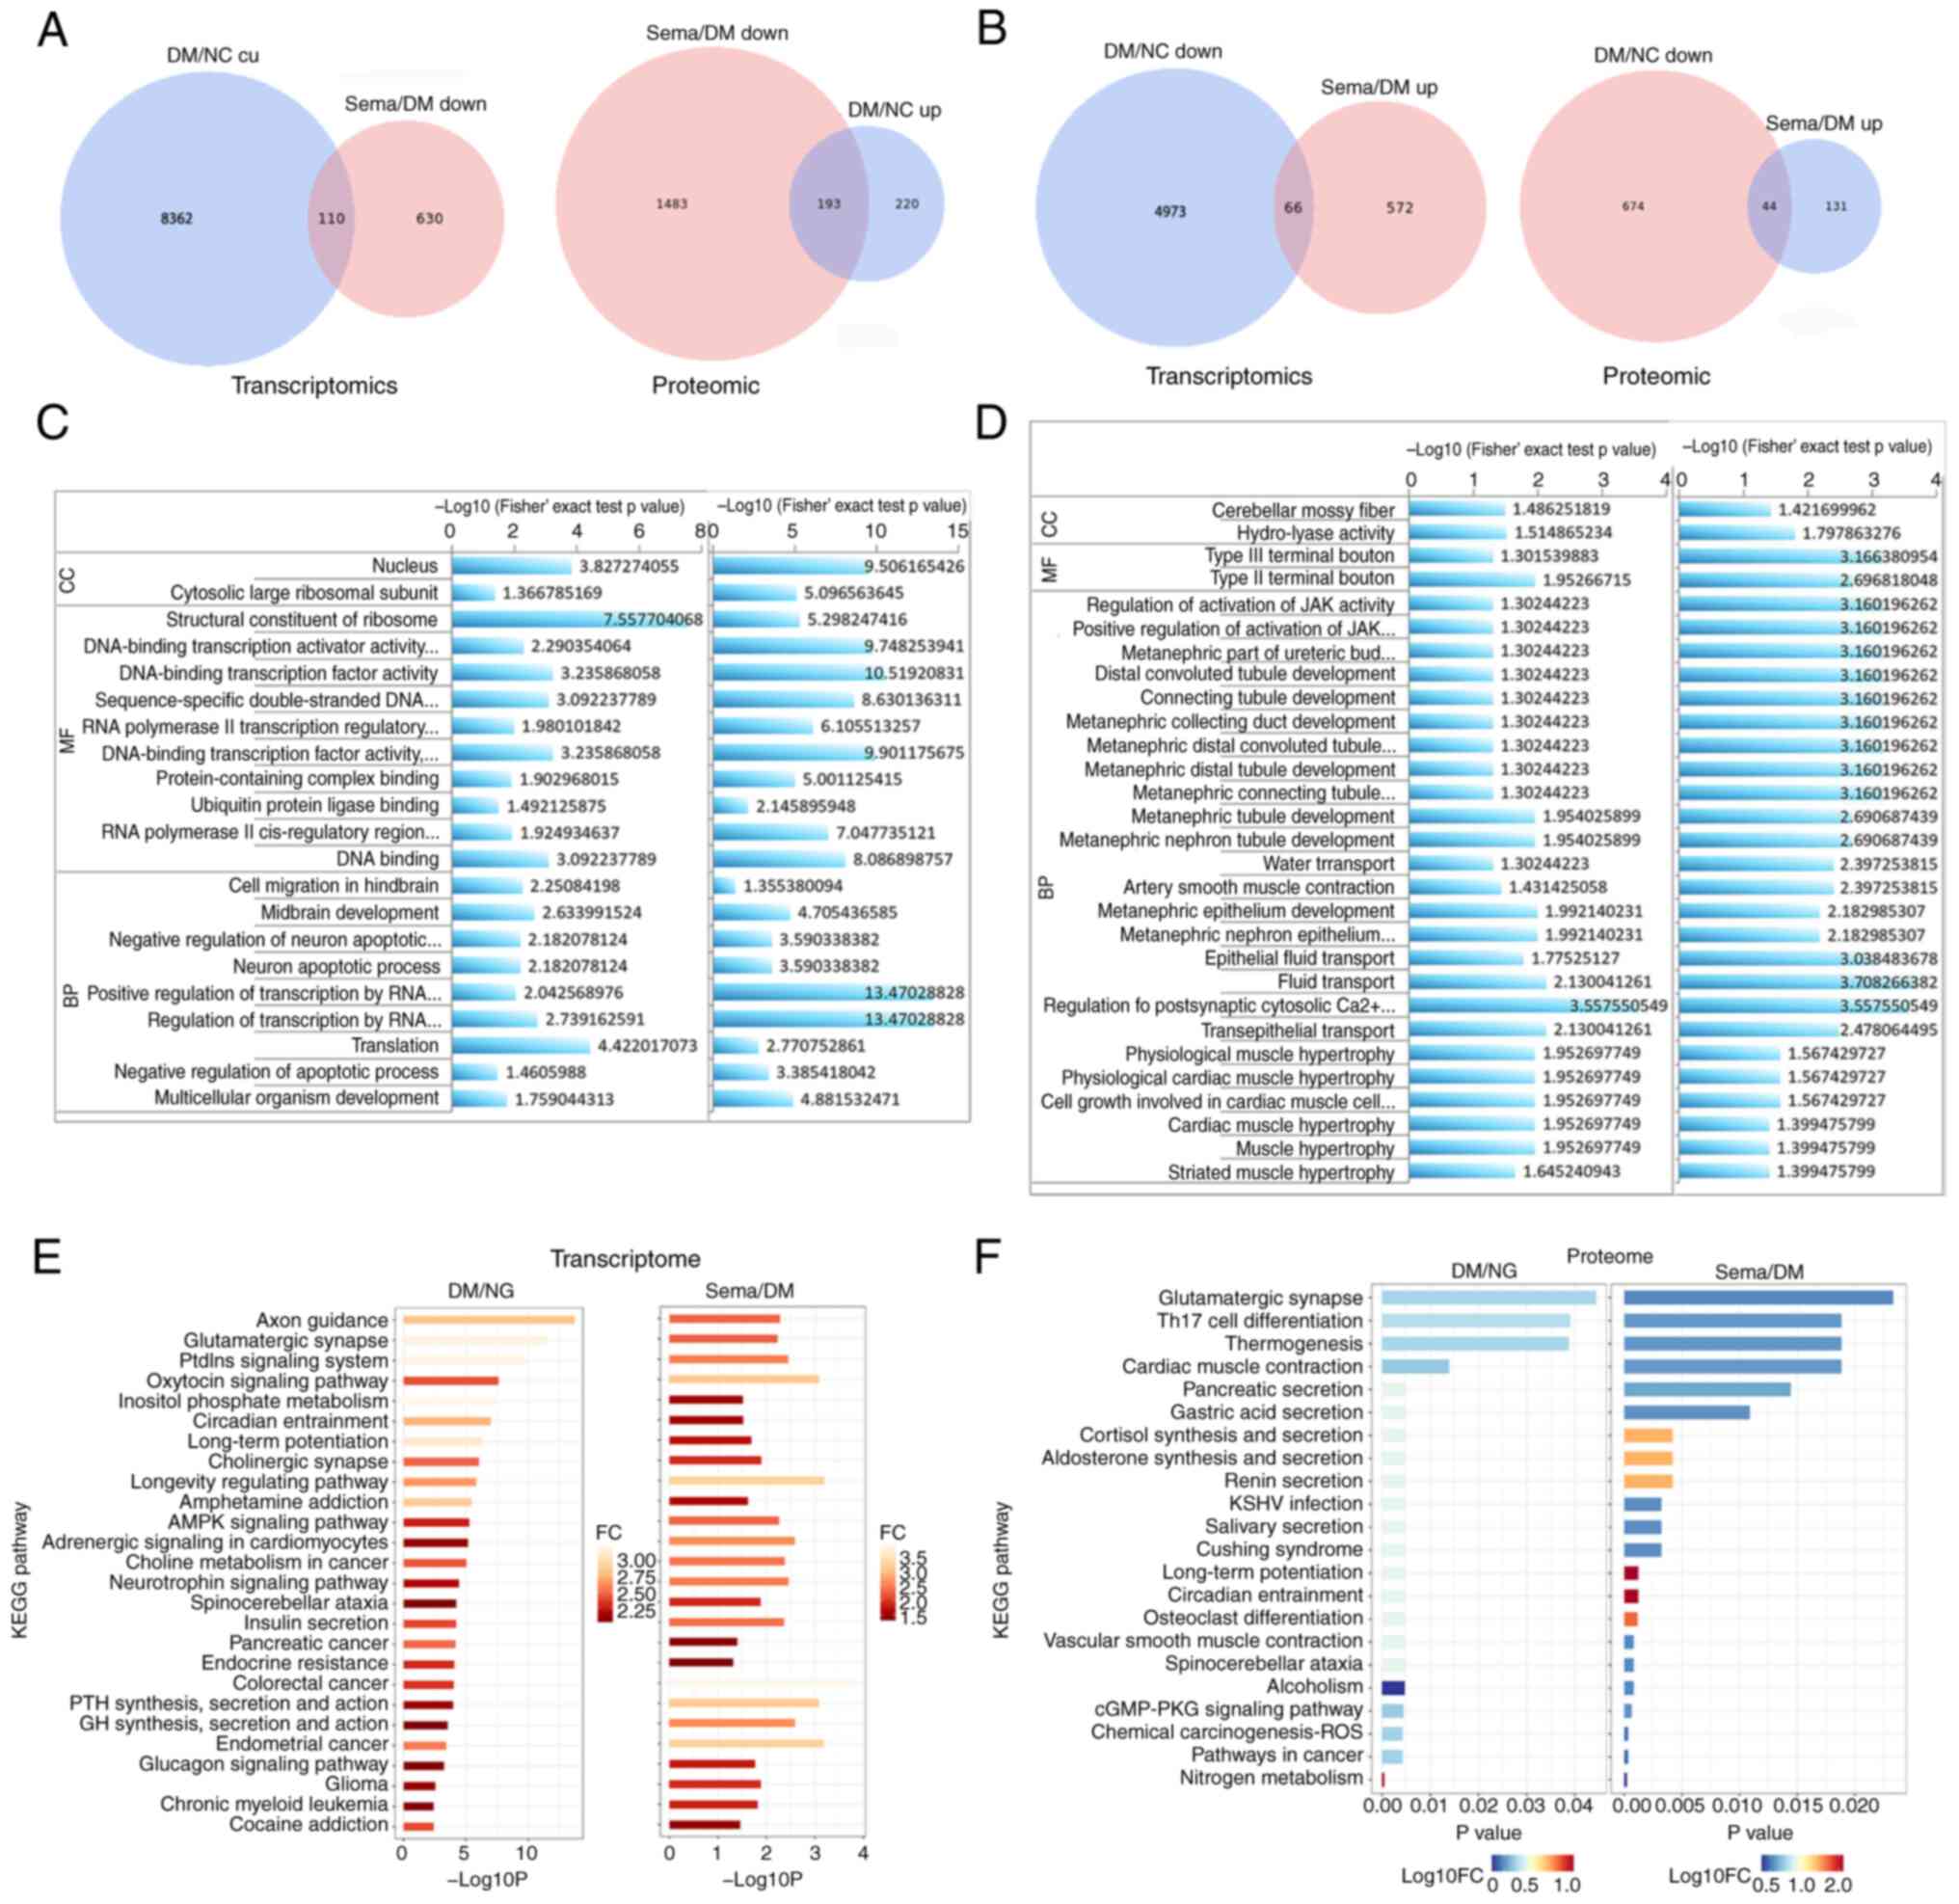
Common trends of DEPs and DEGs
The present analysis revealed an interesting trend.
When comparing T2DM and NC groups across different pathways, a
higher number of upregulated genes was identified, compared with
downregulated genes. In addition, the Sema group displayed a
decrease in more genes compared with the T2DM group (Fig. 5A and B). This pattern mirrored
what was observed at the protein level. These findings suggested
the potential existence of common genes significantly altered by
hyperglycemia and subsequently restored by semaglutide treatment.
The list of the DEPs reversed by semaglutide between T2DM/Control
and Sema/T2DM is shown in Table
SII. The list of the top 200 DEGs reversed by semaglutide
between T2DM/Control and Sema/T2DM is presented in Table SIII.
GO and KEGG pathway enrichment
analysis
To uncover the key BPs involved in semaglutide's
improvement of DACD, GO enrichment results were examined from the
comparisons between the Control and T2DM groups, as well as between
the T2DM and Sema groups. The results revealed a significant
enrichment of DEGs and DEPs in pathways associated with cell
survival, transport and catabolism, as well as signal transduction
(Fig. 5C and D). DEGs and DEPs
exhibited significant GO enrichment with respect to 20 GO-BP, 44
GO-cellular component and 26 GO-molecular function terms (Table SIV). To identify key pathways
underlying semaglutide's improvement in hyperglycemia-induced
cognitive decline, KEGG pathway enrichment results from Control vs.
T2DM and T2DM vs. Sema comparisons were analyzed using R software
(R software, version 3.2) (Fig. 5E
and F). This identified 40 commonly enriched pathways (Table SV). Fatty acid degradation was
observed, along with metabolic pathways, fatty acid metabolism and
cAMP signaling pathways due to the enrichment in both the Control
vs. T2DM and T2DM vs. Semaglutide comparisons (Table SVI). This combined analysis
revealed commonly enriched ACOX1 in these pathways.
The correlation between transcriptome and
proteome
An integrated analysis was conducted to investigate
the correlation between mRNA and protein levels. Genes in the
Control and T2DM groups that showed both increased mRNA and protein
levels (defined as a log2 fold change >0.263034) were selected.
A total of 86 genes (54 upregulated and 32 downregulated) exhibited
significant changes in both mRNA and protein levels in the DM
compared with the NC group (Fig.
6A). In addition, 155 genes (26 upregulated and 129
downregulated) displayed differentially expressed mRNA and protein
levels in the Sema group relative to the DM group (Fig. 6B). Among them, ACOX1 exhibited a
significantly altered expression in the DM group compared with the
NC group, but was downregulated in the Sema-treated group compared
with the T2DM group.
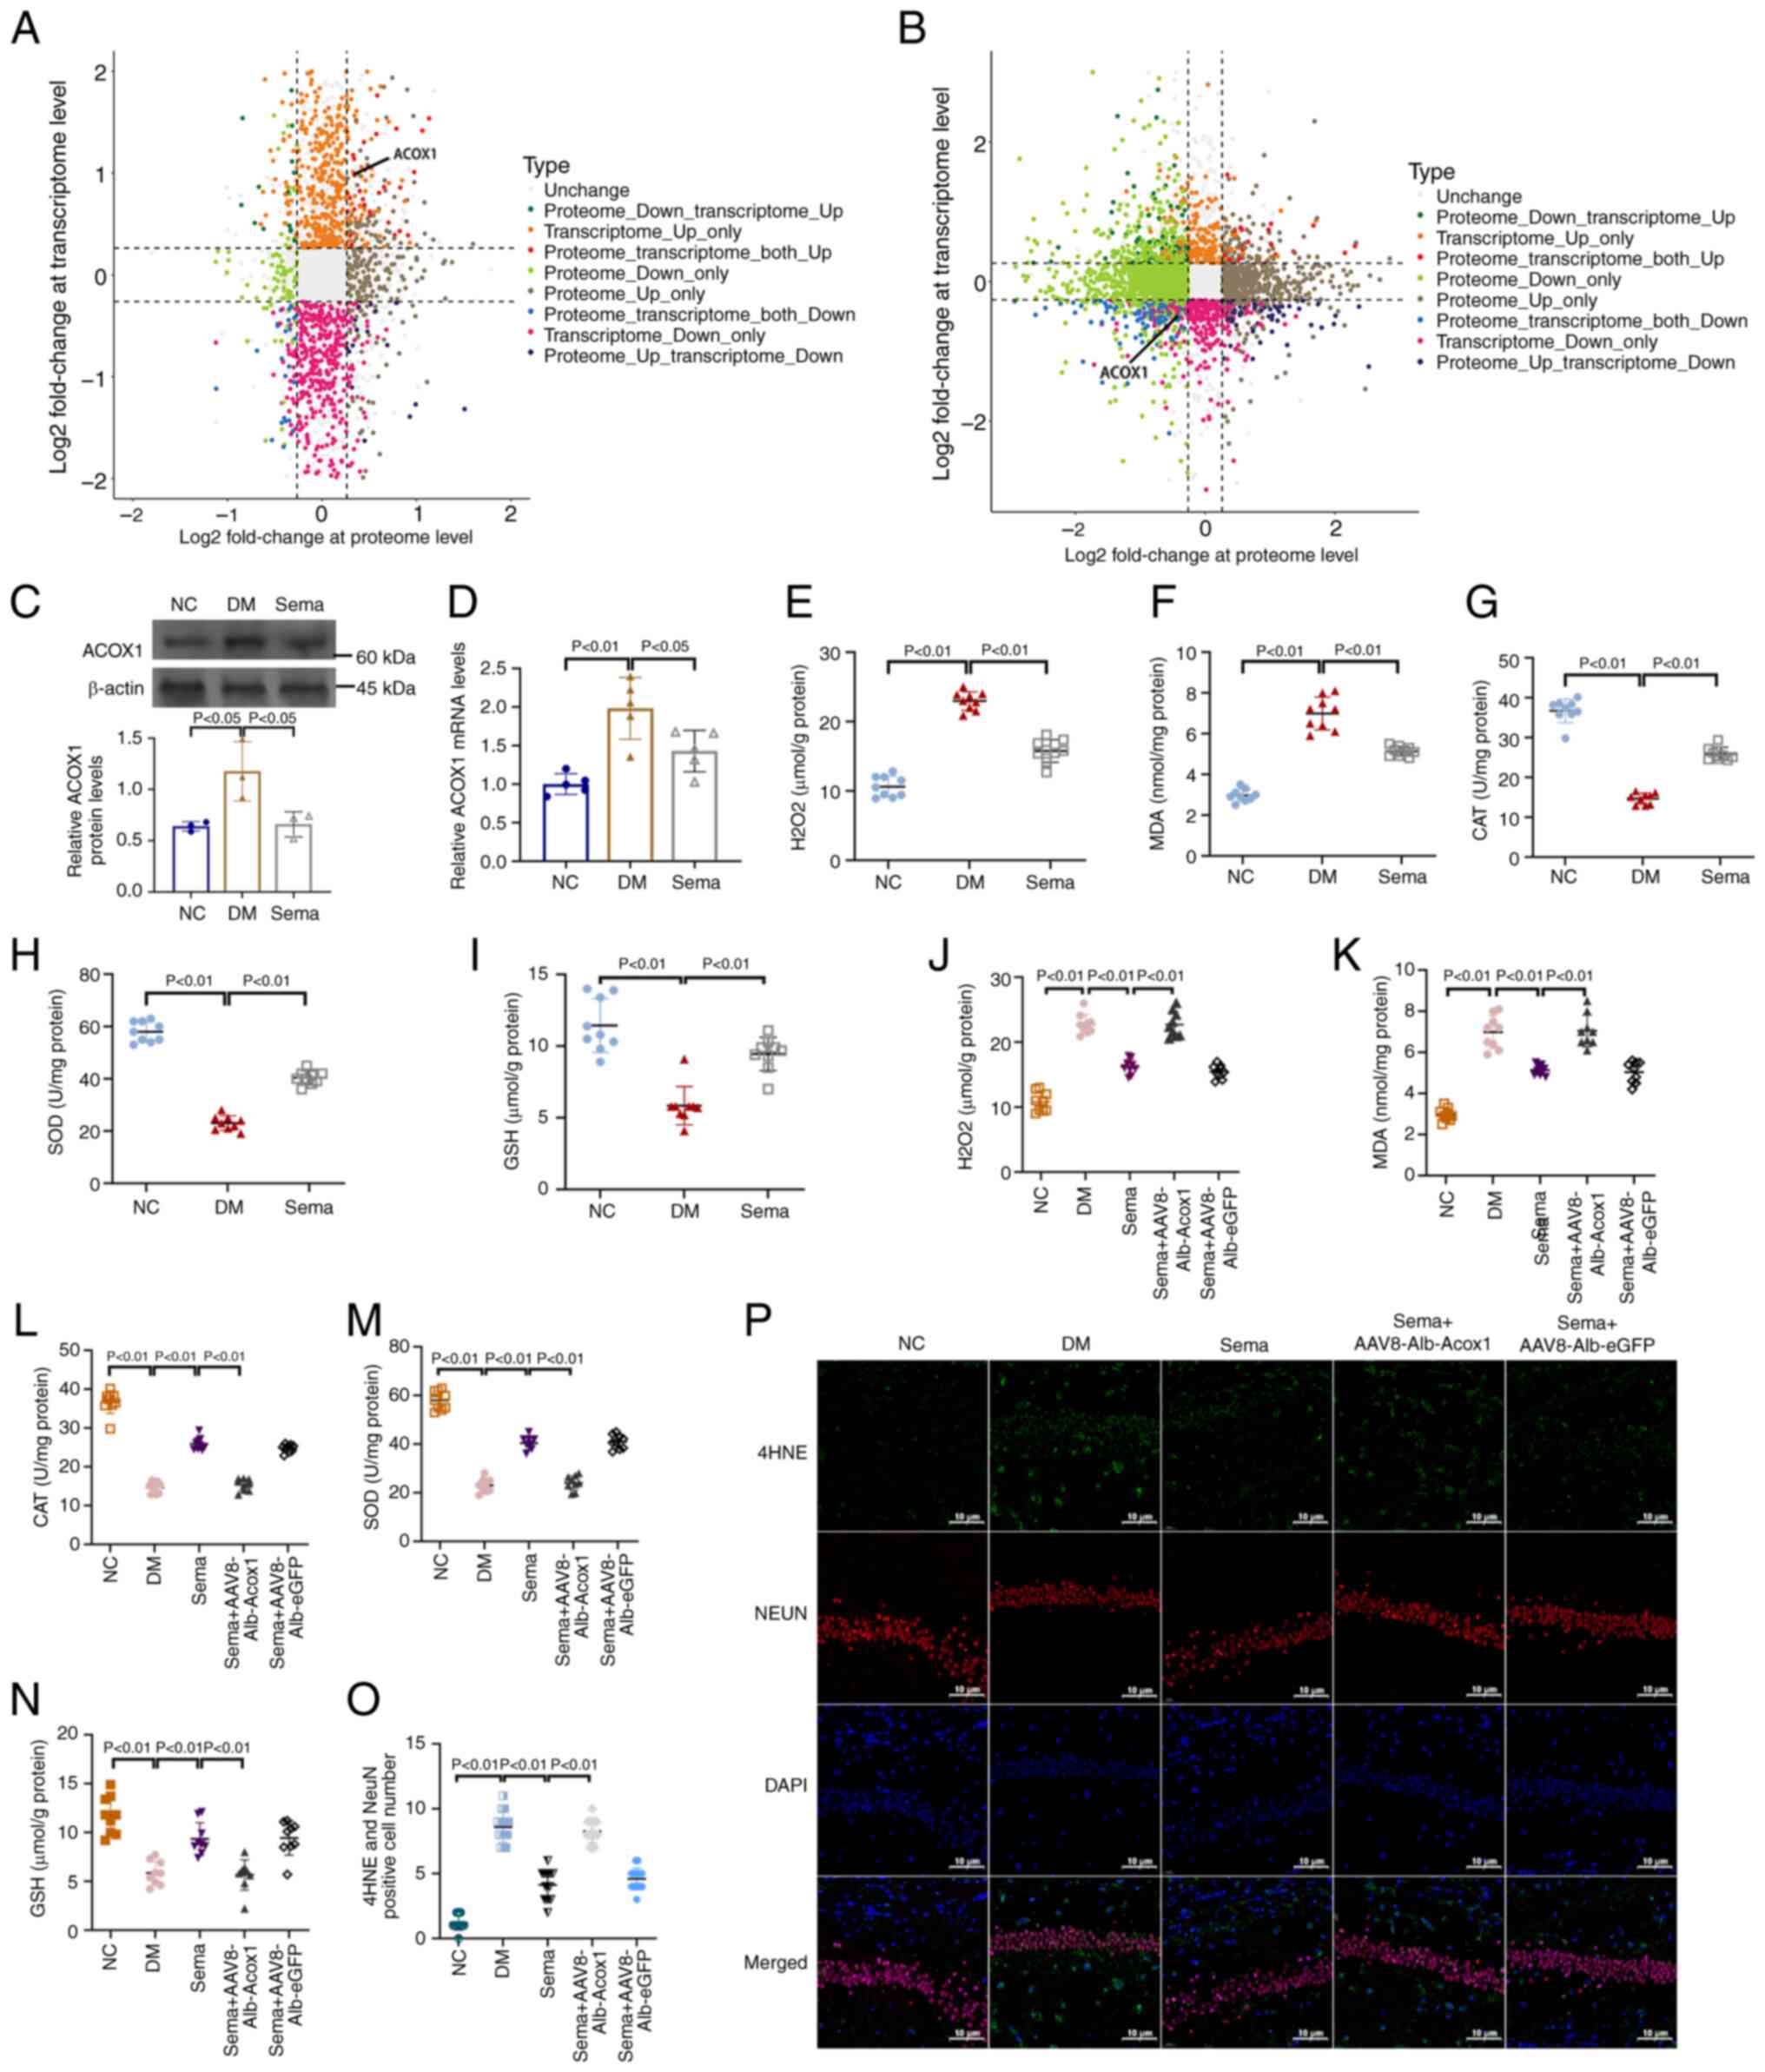 | Figure 6Correlation between transcriptome and
proteome. (A) DM vs. NC. (B) Sema vs. DM, nine-quadrant graph
(considering the statistical significance, P<0.05). The x-axis
(abscissa) shows the log2 fold change of the protein levels. The
y-axis (ordinate) shows the log2 fold change of the transcriptome
levels. The top of the figure displays the Pearson correlation
coefficient and its associated statistical significance (P-value)
between the transcriptome and proteome data. Each dot represents a
gene and its corresponding protein. Grey dots indicate genes and
proteins that show no significant change in expression. Red dots
represent genes and proteins that exhibit similar trends
(upregulation). Blue dots represent genes and proteins that exhibit
opposite trends in expression (downregulation). (C) Western blot
images. (D) Quantification of western blot bands. Examination for
(E) H2O2, (F) MDA, (G) CAT, (H) SOD and (I)
GSH in hippocampus tissues of three groups of mice. Examination for
(J) H2O2, (K) MDA, (L) CAT, (M) SOD and (N)
GSH in hippocampus tissues of mice treated with or without Sema +
AAV8-Alb-Acox1. n=3 (O) Immunofluorescent staining for 4-HNE
expression in hippocampal sections. (P) Positive fluorescent
intensity of 4-HNE was quantified after IF analysis. DM, diabetes
mellitus; NC, negative control; MDA, malondialdehyde; CAT,
catalase; SOD, superoxide dismutase; GSH, glutathione. |
Antioxidant effects of semaglutide
inhibited by ACOX1
Analysis of the transcriptome and proteome revealed
a correlation between ACOX1 and protective effects of semaglutide
on the hippocampus of mice with T2DM. This warrants further
investigation. In T2DM mice, ACOX1 expression in the hippocampus
was significantly higher compared with the NC group (Fig. 6C). Conversely, hippocampal
tissues in the Sema group showed a significant reduction in ACOX1
induction compared with the DM mice. This trend was consistent with
ACOX1 transcription levels (Fig.
6D). As illustrated in Fig. 6E
and F, the high-glucose challenge significantly increased
oxidative stress markers, including H2O2 and
MDA, in the hippocampus of T2DM mice, which were reduced by Sema
treatment. Meanwhile, antioxidants such as CAT, SOD and GSH were
significantly restored in the hippocampus of Sema-treated T2DM mice
(Fig. 6G-I). AAV8-Alb-Acox1 was
then used to increase ACOX1 expression and assess the oxidant and
antioxidant capacities. Even with Sema present, AAV8-Alb-Acox1
treatment consistently elevated oxidative stress levels and reduced
antioxidant defense enzymes (Fig.
6J-N). Immunofluorescent staining confirmed that the
hippocampal lipid peroxidation product 4-HNE was significantly
induced by T2DM, but greatly reduced in mice supplemented with Sema
(Fig. 6O). Furthermore, compared
with the DM + Sema group, mice co-treated with Sema and
AAV8-Alb-Acox1 revealed a higher fluorescent intensity of 4-HNE
(Fig. 6P), indicating increased
oxidative stress.
A cell viability assay demonstrated that exposure to
pcDNA3.1-GFP did not affect cell viability. There was no observable
change in cell viability over time in the pcDNA3.1-GFP-treated
group. pcDNA3.1-ACOX1-GFP did not produce a significant loss of
cell viability until 48 h post exposure (Fig. 7A). pcDNA3.1-ACOX1-GFP
overexpression efficacy was analyzed using western blotting and PCR
(Fig. S2C). In primary
hippocampal neuron cultures, HG + Pal treatment led to an increase
in ACOX1 expression, whereas GLP-1R agonism resulted in its
decrease. Following GLP-1R inhibition, ACOX1 protein expression was
significantly elevated. The transcriptional expression results were
consistent with the protein results (Fig. 7B and C). The level of oxidative
stress, including that of H2O2, MDA, CAT, SOD
and GSH, was then assessed. As expected from the results, HG + Pal
treatment significantly upregulated H2O2 and
MDA, downregulating CAT, SOD and GSH. This was effectively reversed
by semaglutide treatment (Fig.
7D-H). Hippocampal neurons treated with siRNA GLP-1R showed
increased oxidative stress levels, indicating that GLP-1R
negatively regulates ACOX1 expression. In addition, neurons
co-treated with Sema and pcDNA3.1-ACOX1-GFP exhibited higher levels
of H2O2 and MDA compared with those treated
with Sema alone. The immunofluorescence results corroborated that
conclusion (Fig. 7I and J).
Cells in the HG + Pal group exhibited increased immunoreactive
fluorescence intensity for 4HNE compared with the NC group.
However, in the HG + Pal + Sema group, the 4HNE fluorescence signal
decreased in primary hippocampal neurons. By contrast, with the
presence of pcDNA3.1-ACOX1-GFP, the 4HNE fluorescence signals
remained strong even after Sema treatment.
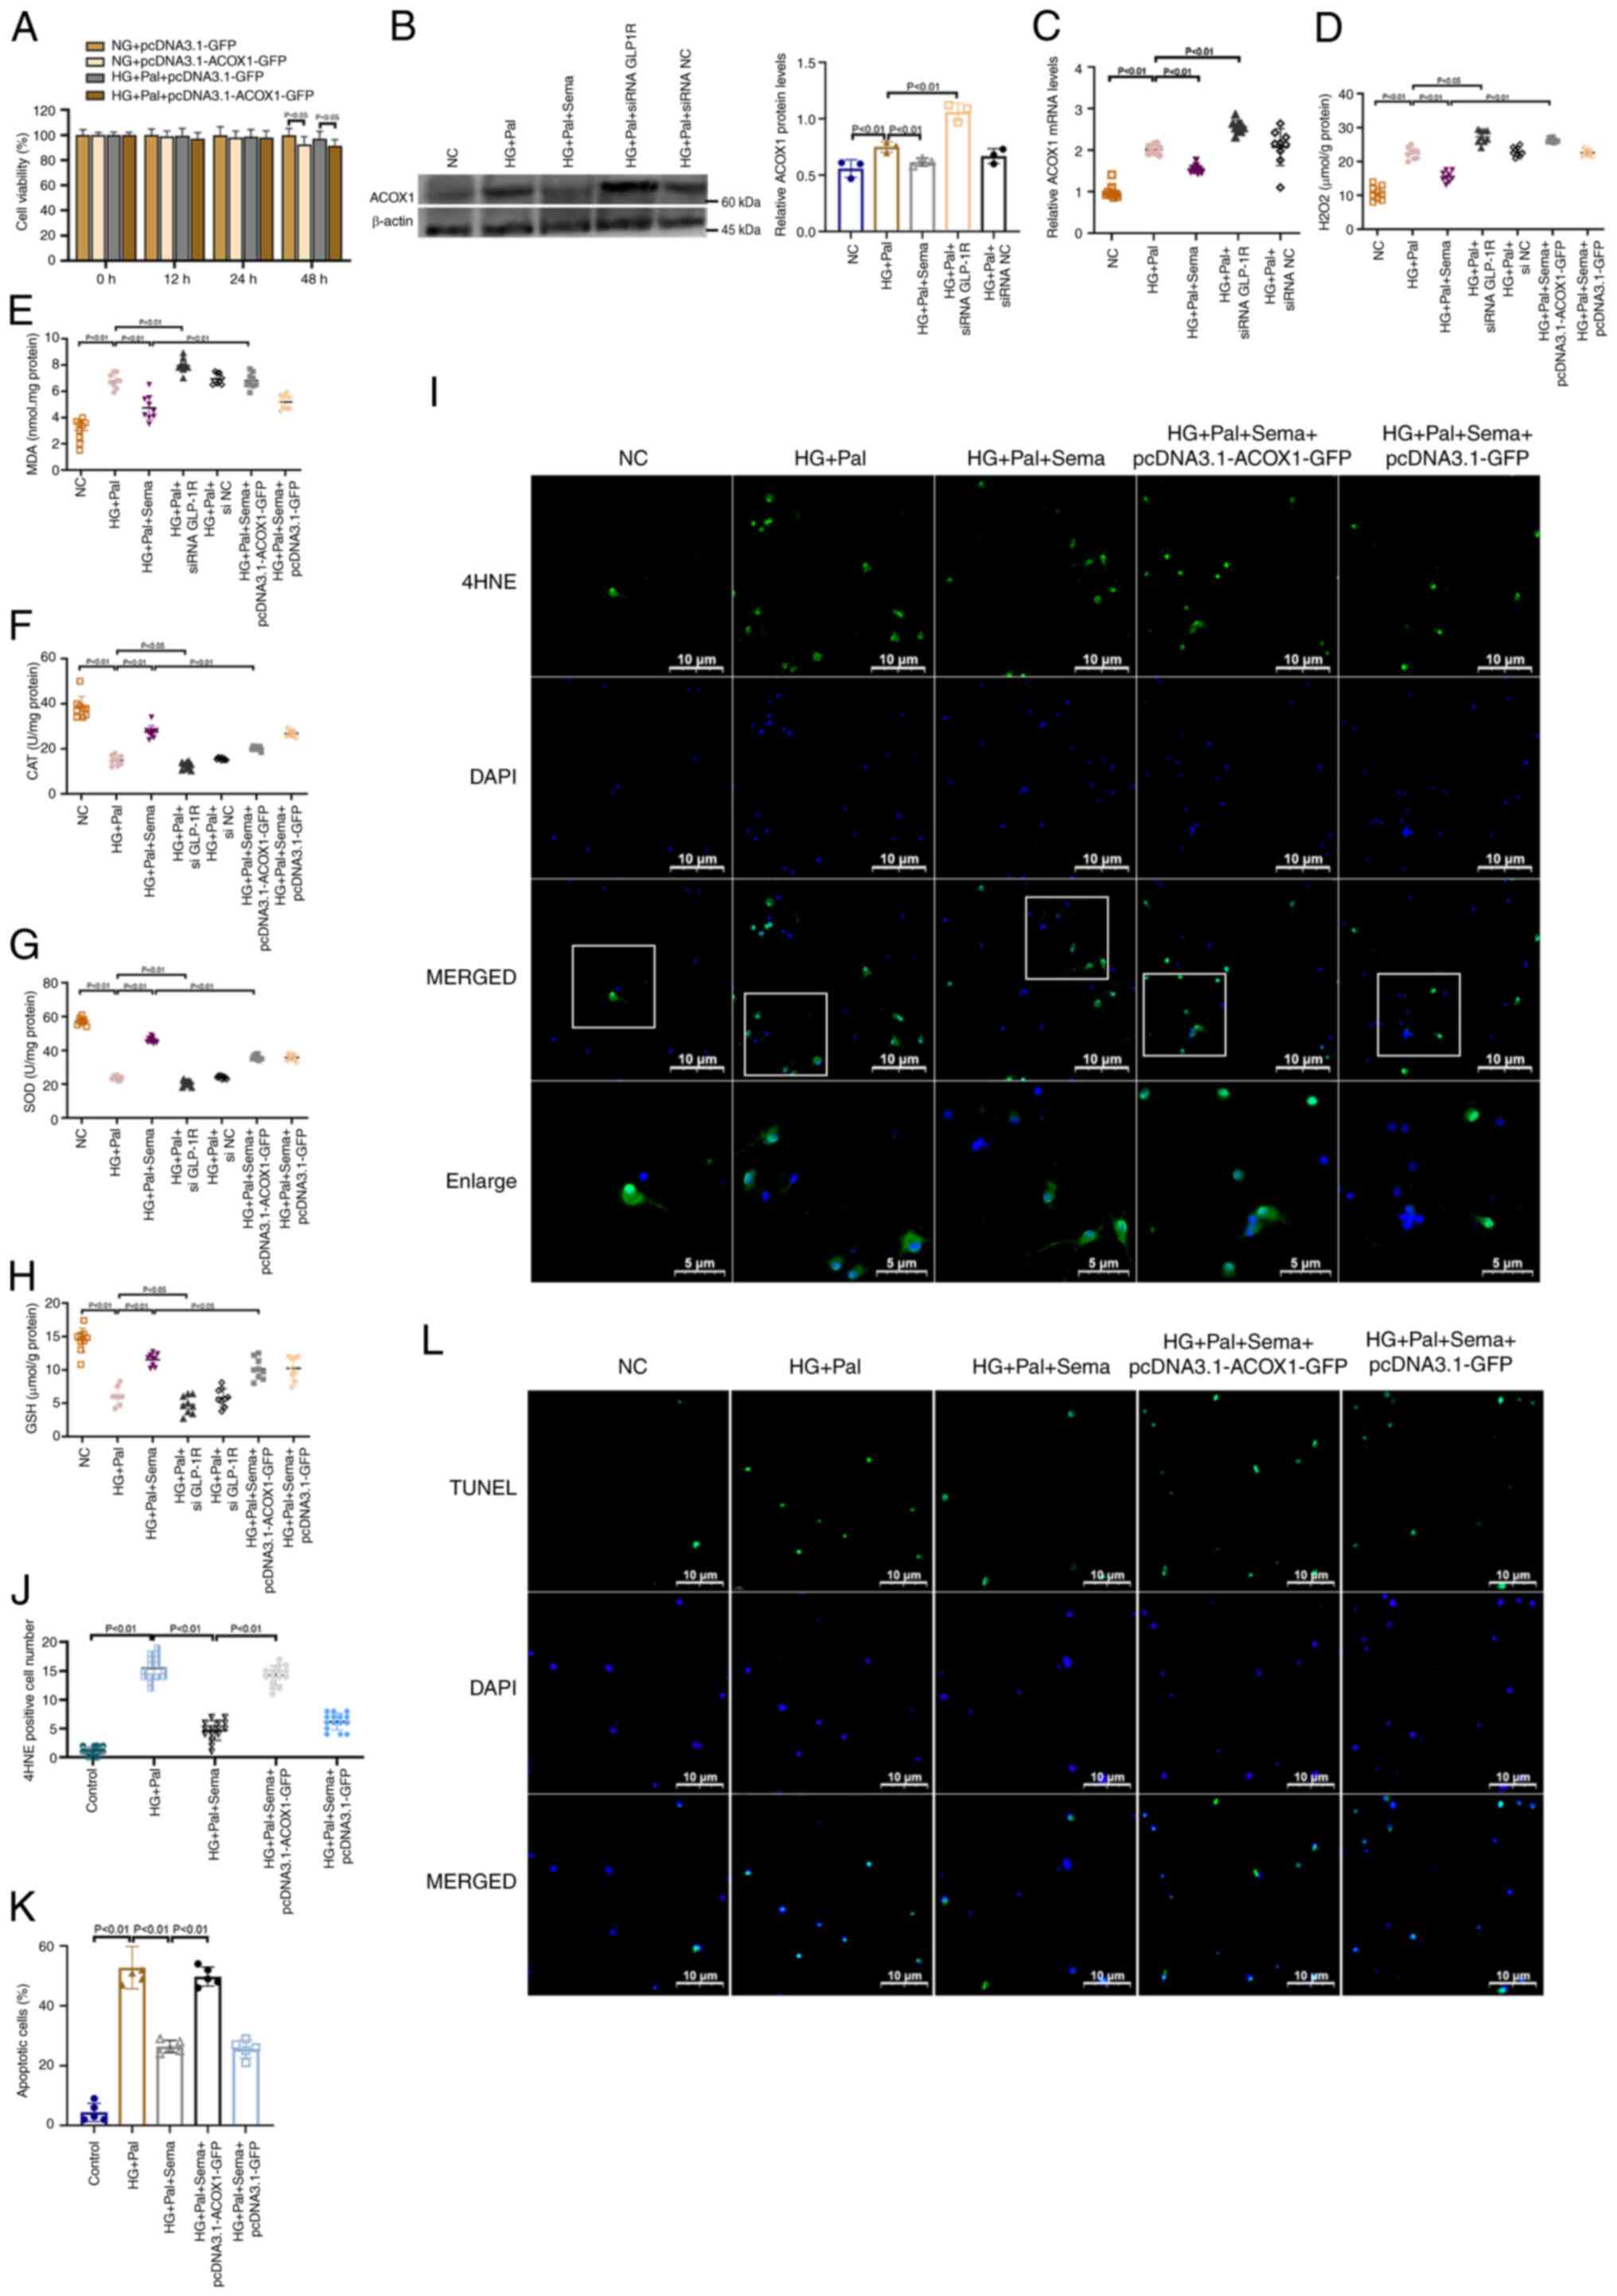 | Figure 7Semaglutide mitigates oxidative
stress through the inhibition of the ACOX1. (A) The Cell Counting
Kit-8 assay of cell viability of different time of
pcDNA3.1-ACOX1-GFP on primary microglia (n=3). (B) Western blot
analysis of ACOX1 in primary hippocampal neurons; graphs are
representative of three independent experiments (n=3). (C) mRNA
expression for ACOX1 in primary microglia (n=3). Examination for
(D) H2O2, (E) MDA, (F) CAT, (G) SOD and (H)
GSH in cells in all groups. (I) The representative images of
immunofluorescence staining with 4HNE immunofluorescence (green)
and nuclei (blue) in hippocampal neurons (magnification, ×500). A
total of five fields were randomly selected for observation. (J)
Quantitation of immunofluorescence for 4HNE in primary neurons
(n=3). (K) Bar graph of the proportion of apoptotic cells. (L)
Representative confocal images show TUNEL (green) and DAPI (blue)
staining of Primary microglia (magnification, ×400). A total of
five fields were randomly selected for observation. ACOX1, Acyl-CoA
oxidase 1; MDA, malondialdehyde; CAT, catalase; SOD, superoxide
dismutase; GSH, glutathione; HG, high glucose; Pal, palmitic acid;
NC, negative control. |
TUNEL assays revealed an increase in the number of
apoptotic TUNEL-positive cells upon HG + Pal treatment, whereas
semaglutide administration resulted in a decrease in these cells.
The antiapoptotic effects of semaglutide in the HG + Pal treatment
group were partially abolished following ACOX1 overexpression
(Fig. 7L and K). These findings
suggested that the neuroprotective effects of semaglutide were
significantly diminished by pcDNA3.1-ACOX1-GFP treatment.
Discussion
Cognitive decline is a frequent and associated
condition with diabetes (28-30). Individuals with diabetes are
1.5-2.0-fold more likely to experience cognitive decline,
impairment or dementia compared with those without diabetes
(31). The clinical progression
of DACD typically involves three stages: Diabetes-associated
cognitive decrements, mild cognitive impairment and dementia
(32). While multiple potential
mechanisms for DACD have been proposed (33-35), the exact cause remains unclear.
Numerous attempts have been made in the treatment DACD to use
agents that simultaneously lower blood glucose levels and provide
neuroprotective actions. Semaglutide is a GLP-1 receptor agonist
primarily used for the treatment of T2DM and obesity. Beyond its
metabolic effects, recent studies have indicated that semaglutide
may exert neuroprotective properties through oxidative stress
reduction, anti-inflammatory effects, and promoting neuronal
survival (17,20,36). The present study revealed that
hyperglycemia induced impairments of learning and memory. Long-term
hyperglycemia caused hippocampus damage and upregulated apoptotic
cells, but these defects were reversible by semaglutide. Further
systematic experiments are required to elucidate the precise
mechanisms through which the specific genes and proteins identified
in this study function.
High-throughput molecular biological techniques,
including transcriptomics and proteomics, have been employed to
investigate biological processes and the mechanisms of action of
natural drugs within the realm of systems biology. An increasing
number of studies indicates that the combined application of
transcriptomics and proteomics presents a promising avenue for
elucidating the complex molecular mechanisms underlying novel
hypoglycemic agents (37,38).
In the present study, a screening was performed to determine the
DEGs and DEPs after inducing T2DM and administering semaglutide. It
was found that the 13,511 genes and 588 proteins that were
significantly upregulated in the model group were notably improved
by semaglutide treatment, while 1,378 genes and 2,394 proteins
significantly downregulated in the model group were also
significantly ameliorated by semaglutide treatment. Upon KEGG
pathway enrichment analysis of these overlapping DEGs and DEPs, 40
pathways affected by semaglutide post-T2DM were identified. These
pathways primarily relate to fatty acid degradation, synaptic
function and neurodegeneration. Of note, the antioxidative stress
action of semaglutide was implicated in multiple factors, including
ACOX1.
In previous studies, semaglutide has never been
reported to reduce oxidative stress through regulating ACOX1. The
metabolic enzyme ACOX1, a key rate-limiting enzyme in fatty acid
β-oxidation, is expressed across various tissues (39,40). During the β-oxidation of
long-chain fatty acids, ACOX1 produces H2O2
as a byproduct. An excessive buildup of H2O2
can result in oxidative stress within cells (41). Further research has shown that in
the context of diabetes, especially T2DM, ACOX1 expression is
significantly altered, leading to metabolic dysregulation and
related complications. Previous studies using the ACOX1 knockout
mouse model revealed that ob/ob mice lacking ACOX1 exhibited
sustained activation of peroxisome proliferator-activated receptors
in the liver, resistance to obesity, and improved glucose tolerance
and insulin sensitivity (42,43). In the present study, it was shown
that HG increased ACOX1 expression and oxidative stress in
hippocampal tissue from T2DM mice, as well as primary hippocampal
neurons treated with HG + Pal. In the context of oxidative stress,
ACOX1's role becomes crucial. Loss-of-function mutations in ACOX1
have been associated with glial and axonal degeneration,
underscoring its vital role in neuronal health and development
(44). Furthermore, the
production of H2O2 and ROS during mutations
in ACOX1 have been associated with glial and axonal degeneration,
underscoring its vital role in neuronal health and oxidative
metabolism, making it particularly susceptible to oxidative stress
(45). In neurons, oxidative
stress not only leads to cell death but also affects
neurotransmission and synaptic plasticity, thereby impairing
cognitive function (46). In
addition, the antiapoptotic actions of GLP-1 have been demonstrated
in neuronal cell lineages. The activation of GLP-1 receptors can
inhibit the apoptosis of nerve cells caused by various reasons.
This is primarily due to their ability to activate various
intracellular signaling cascades that promote neuroprotection and
cell survival (47). GLP-1 helps
in the biogenesis of mitochondria and improves their overall
function, resulting in increased ATP production. It can also boost
energy production by enhancing glucose metabolism. By promoting
insulin signaling pathways, GLP-1 helps cells to respond more
effectively to insulin. In addition, GLP-1 has been shown to
inhibit the activation of caspases, which are enzymes involved in
the process of apoptosis (48).
Furthermore, it is well known that semaglutide not only effectively
lowers blood glucose levels but also regulates lipid metabolism,
enhancing the function and metabolic activity of adipocytes
(49). By improving fat
metabolism, semaglutide may help reduce the risk of obesity-related
metabolic diseases. Research has also found that semaglutide can
regulate energy balance by stimulating insulin secretion, further
promoting fat utilization and reducing fat storage. It was
therefore hypothesized that semaglutide might regulate ACOX1 to
influence the balance between oxidative stress and the antioxidant
defense system, further promoting fat utilization and reducing fat
storage.
Other GLP-1 receptor agonists, such as Liraglutide,
have also been reported to offer multiple benefits to patients with
diabetes. Long-acting and short-acting GLP-1RAs have similar
mechanisms of action but different durations of drug action.
Liraglutide has garnered attention for its neuroprotective
properties, particularly in the context of oxidative stress
associated with diabetes. Studies have demonstrated that
liraglutide can effectively mitigate oxidative stress in neuronal
cells, which is crucial given the link between diabetes and
neurodegenerative diseases such as Alzheimer's disease. For
instance, liraglutide has been shown to prevent
beta-amyloid-induced neurotoxicity in SH-SY5Y cells through a
phosphoinositide 3-kinase (PI3K)-dependent signaling pathway,
thereby inhibiting neuronal apoptosis and oxidative stress
(50). This protective mechanism
is particularly relevant as oxidative stress is a significant
contributor to neuronal damage in diabetic conditions. Research
also indicates that semaglutide can mitigate oxidative stress in
neuronal cells by promoting antioxidant defenses. For instance,
HFD-induced obese mice had reduced body weight, improved oxidative
stress indexes, significantly increased the percentage of water
maze trips and the number of platform crossings, and significantly
shortened the water maze platform latency after semaglutide
intervention (51). Besides
diabetic animal models, semaglutide amended
encephalomyelitis-induced cognitive and motor deficits, hippocampal
damage and corpus callosum demyelination caused by
encephalomyelitis. Additionally, semaglutide activates the PI3K/Akt
axis, which eventually hampers GSK-3β activity, which boosts Nrf2
and SOD levels, inhibiting oxidative stress (52). Future comprehensive research
could offer valuable insights into comparing the neuroprotective
properties of these two GLP-1 receptor agonists, providing a robust
theoretical foundation for their evaluation.
There are several limitations to the present study.
First, this study reported the mechanism in regulation of
antioxidative genes and proteins by semaglutide. It is possible
that semaglutide enhances cognitive function by simultaneously
influencing multiple biological pathways and processes rather than
relying on a single mechanism. However, identifying the primary
contributors to this improvement has been challenging. Further
research is necessary to fully understand the various ways in which
semaglutide protects the brain. Furthermore, one potential
limitation of our research lies in the inherent differences between
rodent and human brain structures. Consequently, further
experimental evidence is necessary to substantiate the clinical
applicability of the current findings.
In conclusion, the present study clarified the role
of semaglutide in the hippocampus and its ability to alleviate
cognitive impairments. These findings provided a scientific basis
for the clinical application of semaglutide and encouraged further
exploration of the potential benefits of novel glucose-lowering
medications. The present study is significant as it offers a deeper
understanding of how semaglutide functions to reduce oxidative
stress caused by hyperglycemia.
Supplementary Data
Availability of data and materials
The data generated in the present study may be found
in the Sequence Read Archive under accession number PRJNA1176207 or
at the following URL: https://dataview.ncbi.nlm.nih.gov/object/PRJNA1176207;
and in the iProX under accession number PXD056999 or at the
following URL: https://www.iprox.cn/page/subproject.html?id=IPX0010017001.
The data generated in the present study may be requested from the
corresponding author.
Authors' contributions
YY and BZ conceived the study and contributed to the
interpretation of the results, accessed and verified the underlying
data. YY conducted statistical analyses and drafted the first
manuscript. LS, LY and JZ analyzed and interpreted the data,
reviewed and revised the manuscript, and contributed in language
editing. BZ provided general supervision and obtained funding. YY
and BZ confirm the authenticity of all the raw data. All authors
read and approved the final version of the manuscript.
Ethics approval and consent to
participate
The present study was approved (approval no.
zryhyy61-24-02-25) by the Ethics Committee of China-Japan
Friendship Hospital (Beijing, China).
Patient consent for publication
Not applicable.
Competing interests
The authors declare that they have no competing
interests.
Acknowledgements
Not applicable.
Funding
The present study was supported by National High Level Hospital
Clinical Research Funding (grant nos. 2023-NHL HCRF-YXHZ-ZR-01 and
2022-NHLHCRF-YS-01) and the National Key Research and Development
Program of China (grant no. 2018YFC1313902).
References
|
1
|
Biessels GJ and Whitmer RA: Cognitive
dysfunction in diabetes: How to implement emerging guidelines.
Diabetologia. 63:3–9. 2020. View Article : Google Scholar
|
|
2
|
Biessels GJ and Despa F: Cognitive decline
and dementia in diabetes mellitus: Mechanisms and clinical
implications. Nat Rev Endocrinol. 14:591–604. 2018. View Article : Google Scholar : PubMed/NCBI
|
|
3
|
Moore EM, Mander AG, Ames D, Kotowicz MA,
Carne RP, Brodaty H, Woodward M, Boundy K, Ellis KA, Bush AI, et
al: Increased risk of cognitive impairment in patients with
diabetes is associated with metformin. Diabetes Care. 36:2981–2987.
2013. View Article : Google Scholar : PubMed/NCBI
|
|
4
|
Simó R, Ciudin A, Simó-Servat O and
Hernández C: Cognitive impairment and dementia: A new emerging
complication of type 2 diabetes-The diabetologist's perspective.
Acta Diabetol. 54:417–424. 2017. View Article : Google Scholar : PubMed/NCBI
|
|
5
|
Zilliox LA, Chadrasekaran K, Kwan JY and
Russell JW: Diabetes and cognitive impairment. Curr Diab Rep.
16:872016. View Article : Google Scholar : PubMed/NCBI
|
|
6
|
Shao J, Yang X, Liu T, Zhang T, Xie QR and
Xia W: Autophagy induction by SIRT6 is involved in oxidative
stress-induced neuronal damage. Protein Cell. 7:281–290. 2016.
View Article : Google Scholar : PubMed/NCBI
|
|
7
|
An Y, Xu BT, Wan SR, Ma XM, Long Y, Xu Y
and Jiang ZZ: The role of oxidative stress in diabetes
mellitus-induced vascular endothelial dysfunction. Cardiovasc
Diabetol. 22:2372023. View Article : Google Scholar : PubMed/NCBI
|
|
8
|
Mi Y, Qi G, Vitali F, Shang Y, Raikes AC,
Wang T, Jin Y, Brinton RD, Gu H and Yin F: Loss of fatty acid
degradation by astrocytic mitochondria triggers neuroinflammation
and neurodegeneration. Nat Metab. 5:445–465. 2023. View Article : Google Scholar : PubMed/NCBI
|
|
9
|
Bridge G, Rashid S and Martin SA: DNA
mismatch repair and oxidative DNA damage: Implications for cancer
biology and treatment. Cancers. 6:1597–1614. 2014. View Article : Google Scholar : PubMed/NCBI
|
|
10
|
Zhang W, Xiao D, Mao Q and Xia H: Role of
neuroinflammation in neurodegeneration development. Signal
Transduct Target Ther. 8:2672023. View Article : Google Scholar : PubMed/NCBI
|
|
11
|
Cai D: Neuroinflammation and
neurodegeneration in overnutrition-induced disease. Trends
Endocrinal Metab. 24:40–47. 2013. View Article : Google Scholar
|
|
12
|
Drucker DJ: Mechanisms of action and
therapeutic application of glucagon-like peptide-1. Cell Metab.
27:740–756. 2018. View Article : Google Scholar : PubMed/NCBI
|
|
13
|
Andersen A, Knop FK and Vilsbøll T: A
pharmacological and clinical overview of oral semaglutide for the
treatment of type 2 diabetes. Drugs. 81:1003–1030. 2021. View Article : Google Scholar : PubMed/NCBI
|
|
14
|
Chao AM, Tronieri JS, Amaro A and Wadden
TA: Semaglutide for the treatment of obesity. Trends Cardiovasc
Med. 33:159–166. 2023. View Article : Google Scholar
|
|
15
|
Marso SP, Bain SC, Consoli A, Eliaschewitz
FG, Jódar E, Leiter LA, Lingvay I, Rosenstock J, Seufert J, Mark L,
et al: Semaglutide and cardiovascular outcomes in patients with
type 2 diabetes. New Engl J Med. 375:1834–1844. 2016. View Article : Google Scholar : PubMed/NCBI
|
|
16
|
Carney EF: A pre-specified analysis of the
SELECT trial suggests a kidney benefit of semaglutide in patients
without diabetes. Nat Rev Nephrol. 20:4932024.PubMed/NCBI
|
|
17
|
Tipa RO, Balan DG, Georgescu MT, Ignat LA,
Vacaroiu IA, Georgescu DE, Raducu L, Mihai DA, Chiperi LV and
Balcangiu-Stroescu AE: A systematic review of semaglutide's
influence on cognitive function in preclinical animal models and
cell-line studies. Int J Mol Sci. 25:49722024. View Article : Google Scholar : PubMed/NCBI
|
|
18
|
Zhou TT, Quan LL, Chen LP, Du T, Sun KX,
Zhang JC, Yu L, Li Y, Wan P, Chen LL, et al: SP6616 as a new Kv2.1
channel inhibitor efficiently promotes β-cell survival involving
both PKC/Erk1/2 and CaM/PI3K/Akt signaling pathways. Cell Death
Dis. 7:e22162016. View Article : Google Scholar
|
|
19
|
McLean BA, Wong CK, Kaur KD, Seeley RJ and
Drucker DJ: Differential importance of endothelial and
hematopoietic cell GLP-1Rs for cardiometabolic versus hepatic
actions of semaglutide. JCI Insight. 6:e1537322021. View Article : Google Scholar : PubMed/NCBI
|
|
20
|
Wang ZJ, Li XR, Chai SF, Li WR, Li S, Hou
M, Li JL, Ye YC, Cai HY, Hölscher C and Wu MN: Semaglutide
ameliorates cognition and glucose metabolism dysfunction in the
3xTg mouse model of Alzheimer's disease via the GLP-1R/SIRT1/GLUT4
pathway. Neuropharmacology. 240:1097162023. View Article : Google Scholar : PubMed/NCBI
|
|
21
|
Vorhees CV and Williams MT: Morris water
maze: Procedures for assessing spatial and related forms of
learning and memory. Nat Protoc. 1:848–858. 2006. View Article : Google Scholar
|
|
22
|
Zhang B, Wang L, Zhan A, Wang M, Tian L,
Guo W and Pan Y: Long-term exposure to a hypomagnetic field
attenuates adult hippocampal neurogenesis and cognition. Nat
Commun. 12:11742021. View Article : Google Scholar : PubMed/NCBI
|
|
23
|
Warnes GR, Bolker B, Lumley T and Johnson
RC: gmodels: Various R Programming Tools for Model Fitting. R
package version. 2.18.1 edition. SAIC-Frederick, Inc.; New Jersey,
NJ: 2018
|
|
24
|
Zhang N, Jiang N, Zhang K, Zheng L, Zhang
D, Sang X, Feng Y, Chen R, Yang N, Wang X, et al: Landscapes of
protein post-translational modifications of African trypanosoma
parasites. iScience. 23:1010742020. View Article : Google Scholar
|
|
25
|
Livak KJ and Schmittgen TD: Analysis of
relative gene expression data using real-time quantitative PCR and
the 2(-Delta Delta C(T)) method. Methods. 25:402–408. 2001.
View Article : Google Scholar
|
|
26
|
Beaudoin GM III, Lee SH, Singh D, Yuan Y,
Ng YG, Reichardt LF and Arikkath J: Culturing pyramidal neurons
from the early postnatal mouse hippocampus and cortex. Nat Protoc.
7:1741–1754. 2012. View Article : Google Scholar : PubMed/NCBI
|
|
27
|
Nakashima H, Hamamura K, Houjou T, Taguchi
R, Yamamoto N, Mitsudo K, Tohnai I, Ueda M, Urano T and Furukawa K
and Furukawa K: Overexpression of caveolin-1 in a human melanoma
cell line results in dispersion of ganglioside GD3 from lipid rafts
and alteration of leading edges, leading to attenuation of
malignant properties. Cancer Sci. 98:512–520. 2007. View Article : Google Scholar : PubMed/NCBI
|
|
28
|
Srikanth V, Sinclair AJ, Hill-Briggs F,
Moran C and Biessels GJ: Type 2 diabetes and cognitive
dysfunction-towards effective management of both comorbidities.
Lancet Diabetes Endocrinol. 8:535–545. 2020. View Article : Google Scholar : PubMed/NCBI
|
|
29
|
Vagelatos NT and Eslick GD: Type 2
diabetes as a risk factor for Alzheimer's disease: The confounders,
interactions, and neuropathology associated with this relationship.
Epidemiol Rev. 35:152–160. 2013. View Article : Google Scholar : PubMed/NCBI
|
|
30
|
Zhang J, Chen C, Hua S, Liao H, Wang M,
Xiong Y and Cao F: An updated meta-analysis of cohort studies:
Diabetes and risk of Alzheimer's disease. Diabetes Res Clin Pract.
124:41–47. 2017. View Article : Google Scholar : PubMed/NCBI
|
|
31
|
Ennis GE, Saelzler U, Umpierrez GE and
Moffat SD: Prediabetes and working memory in older adults. Brain
Neurosci Adv. 4:23982128209617252020. View Article : Google Scholar : PubMed/NCBI
|
|
32
|
Koekkoek PS, Kappelle LJ, van den Berg E,
Rutten GE and Biessels GJ: Cognitive function in patients with
diabetes mellitus: Guidance for daily care. Lancet Neurol.
14:329–340. 2015. View Article : Google Scholar : PubMed/NCBI
|
|
33
|
Arnold SE, Arvanitakis Z, Macauley-Rambach
SL, Koenig AM, Wang HY, Ahima RS, Craft S, Gandy S, Buettner C,
Stoeckel LE, et al: Brain insulin resistance in type 2 diabetes and
Alzheimer disease: Concepts and conundrums. Nat Rev Neurol.
214:168–181. 2018. View Article : Google Scholar
|
|
34
|
Liu Z, Dai X, Zhang H, Shi R, Hui Y, Jin
X, Zhang W, Wang L, Wang Q, Wang D, et al: Gut microbiota mediates
intermittent-fasting alleviation of diabetes-induced cognitive
impairment. Nat Commun. 11:8552020. View Article : Google Scholar : PubMed/NCBI
|
|
35
|
Marseglia A, Fratiglioni L, Kalpouzos G,
Wang R, Bäckman L and Xu W: Prediabetes and diabetes accelerate
cognitive decline and predict microvascular lesions: A
population-based cohort study. Alzheimers Dement. 15:25–33. 2019.
View Article : Google Scholar
|
|
36
|
Maskery MP, Holscher C, Jones SP, Price
CI, Strain WD, Watkins CL, Werring DJ and Emsley HC: Glucagon-like
peptide-1 receptor agonists as neuroprotective agents for ischemic
stroke: A systematic scoping review. J Cereb Blood Flow Metab.
41:14–30. 2021. View Article : Google Scholar :
|
|
37
|
Billing AM, Kim YC, Gullaksen S, Schrage
B, Raabe J, Hutzfeldt A, Demir F, Kovalenko E, Lassé M, Dugourd A,
et al: Metabolic communication by SGLT2 inhibition. Circulation.
149:860–884. 2024. View Article : Google Scholar :
|
|
38
|
Sachs S, Niu L, Geyer P, Jall S, Kleinert
M, Feuchtinger A, Stemmer K, Brielmeier M, Finan B, DiMarchi RD, et
al: Plasma proteome profiles treatment efficacy of incretin dual
agonism in diet-induced obese female and male mice. Diabetes Obes
Metab. 23:195–207. 2021. View Article : Google Scholar
|
|
39
|
Hashimoto T: Peroxisomal beta-oxidation:
Enzymology and molecular biology. Ann NY Acad Sci. 804:86–98. 1996.
View Article : Google Scholar : PubMed/NCBI
|
|
40
|
Van Veldhoven PP, Vanhove G, Assselberghs
S, Eyssen HJ and Mannaerts GP: Substrate specificities of rat liver
peroxisomal acyl-CoA oxidases: Palmitoyl-CoA oxidase (inducible
acyl-CoA oxidase), pristanoyl-CoA oxidase (non-inducible acyl-CoA
oxidase), and trihydroxycoprostanoyl-CoA oxidase. J Biol Chem.
267:20065–20074. 1992. View Article : Google Scholar : PubMed/NCBI
|
|
41
|
Reddy JK and Mannaerts GP: Peroxisomal
lipid metabolism. Annu Rev Nutr. 14:343–370. 1994. View Article : Google Scholar : PubMed/NCBI
|
|
42
|
Huang J, Jia Y, Fu T, Viswakarma N, Bai L,
Rao MS, Zhu Y, Borensztajn J and Reddy JK: Sustained activation of
PPAR by endogenous ligands increases hepatic fatty acid oxidation
and prevents obesity in ob/ob mice. FASEB J. 26:628–638. 2012.
View Article : Google Scholar :
|
|
43
|
Huang J, Viswakarma N, Yu S, Jia Y, Bai L,
Vluggens A, Cherkaoui-Malki M, Khan M, Singh I, Yang G, et al:
Progressive endoplasmic reticulum stress contributes to
hepatocarcinogenesis in fatty acyl-CoA oxidase 1-deficient mice. Am
J Pathol. 179:703–713. 2011. View Article : Google Scholar : PubMed/NCBI
|
|
44
|
Chung HL, Wangler MF, Marcogliese PC, Jo
J, Ravenscroft TA, Zuo Z, Duraine L, Sadeghzadeh S, Li-Kroeger D,
Schmidt RE, et al: Loss-or gain-of-function mutations in ACOX1
cause axonal loss via different mechanisms. Neuron. 106:589–606.e6.
2020. View Article : Google Scholar
|
|
45
|
Cobley JN, Fiorello ML and Bailey DM: 13
reasons why the brain is susceptible to oxidative stress. Redox
Biol. 15:490–503. 2018. View Article : Google Scholar : PubMed/NCBI
|
|
46
|
Cenini G, Lloret A and Cascella R:
Oxidative stress in neurodegenerative diseases: From a
mitochondrial point of view. Oxid Med Cell Longev.
2019:21056072019. View Article : Google Scholar : PubMed/NCBI
|
|
47
|
Brubaker PL and Drucker DJ: Minireview:
Glucagon-like peptides regulate cell proliferation and apoptosis in
the pancreas, gut, and central nervous system. Endocrinology.
145:2653–2659. 2004. View Article : Google Scholar : PubMed/NCBI
|
|
48
|
During MJ, Cao L, Zuzga DS, Francis JS,
Fitzsimons HL, Jiao X, Bland RJ, Klugmann M, Banks WA, Drucker DJ
and Haile CN: Glucagon-like peptide-1 receptor is involved in
learning and neuroprotection. Nat Med. 9:1173–1179. 2003.
View Article : Google Scholar : PubMed/NCBI
|
|
49
|
Dhillon S: Semaglutide: First global
approval. Drugs. 78:275–284. 2018. View Article : Google Scholar : PubMed/NCBI
|
|
50
|
Liu XY, Wang LX, Chen Z and Liu LB:
Liraglutide prevents beta-amyloid-induced neurotoxicity in SH-SY5Y
cells via a PI3K-dependent signaling pathway. Neurol Res.
38:313–319. 2016. View Article : Google Scholar : PubMed/NCBI
|
|
51
|
Chen X, Ma L, Gan K, Pan X and Chen S:
Phosphorylated proteomics-based analysis of the effects of
semaglutide on hippocampi of high-fat diet-induced-obese mice.
Diabetol Metab Syndr. 15:632023. View Article : Google Scholar : PubMed/NCBI
|
|
52
|
Sadek MA, Kandil EA, El Sayed NS, Sayed HM
and Rabie MA: Semaglutide, a novel glucagon-like peptide-1 agonist,
amends experimental autoimmune encephalomyelitis-induced multiple
sclerosis in mice: Involvement of the PI3K/Akt/GSK-3β pathway. Int
Immunopharmacol. 115:1096472023. View Article : Google Scholar
|