Introduction
Prostate cancer is the most common malignancy affecting men, representing a significant public health threat in developed countries (1,2). At an early stage, the growth and expansion of prostate cancer are driven by androgen stimulation. Androgen-deprivation therapy (ADT) has demonstrated efficacy in suppressing the tumorigenicity of the cancer cells (3); however, a more aggressive and androgen-independent form of cancer, known as castration-resistant prostate cancer (CRPC), has been shown to emerge in the majority of cases within ~2 years after such treatment (4,5). The growth and expansion of the cancer are then no longer dependent on androgen stimulation. Despite the range of therapies that are currently available, including ADT, CRPC remains incurable at present. Hence, there is an urgent clinical need to identify and validate novel therapeutic targets to develop effective treatment strategies for CRPC (3,6). One such target is fatty acid-binding protein 5 (FABP5), which is a member of the FABP family that facilitates the intracellular and extracellular transportation of fatty acids (7). FABP5 has a high affinity for medium- and long-chain fatty acids, and is a 15-kDa cytosolic protein that fulfills an important role in various metabolic diseases (8). Involvement of FABP5 in promoting the malignant progression of cancer cells was first identified in prostate and breast cancer (9,10). The underlying mechanism through which it functions was further elaborated using the antisense RNA technique (11); moreover, immunohistochemical analysis revealed that the expression of FABP5 in prostate carcinoma was significantly increased with increasing combined Gleason scores, and an increased expression level of FABP5 was demonstrated to a valuable prognostic factor in predicting patient survival times (12). Therefore, it has been suggested that FABP5 is a potential therapeutic target for prostate cancer.
Previously, FABP5 inhibitors have been developed and used to suppress the biological activity of FABP5 in prostate cancer cells. The first inhibitor to be developed was the chemically synthesized molecule SB-FI-26, which exhibited an especially potent tumour-suppressive effect in nude mice (13). SB-FI-26 is the active component (α-truxillic acid 1-naphthyl monoester) of a Chinese herbal medicine (Incarvillea sinensis), which was used originally for treatment of inflammatory and metabolic diseases or as an analgesic anti-inflammatory agent (7,14-17). Previously, a bio-inhibitor of FABP5, dmrFABP5, was discovered (13). When nude mice were treated with dmrFABP5, the compound completely prevented metastasis from occurring, and a 13-fold decrease in the average size of the primary tumours was observed. Therefore, it is of paramount importance to understand the molecular mechanisms underlying the tumour- and metastasis-promoting activities of FABP5 in prostate cancer cells in order to develop targeted therapies.
Previous studies on FABP5 led to the discovery of a fatty acid-initiated signaling pathway, which was eventually shown to be associated with an enhanced malignant progression of prostate cancer cells (13,18). This pathway was triggered by demethylation of the promoter region of the FABP5 gene in CRPC cells, which resulted in a large-scale increase in FABP5 expression (19). The increase in FABP5 expression, in turn, led to the transportation of large amounts of fatty acids into the cancer cells, which had the effect of fueling their rapid growth, with a concomitant reduction in the apoptotic rate (20). Moreover, excessive amounts of fatty acids were translocated into the nucleus, where they acted as signalling molecules to activate, via phosphorylation, the peroxisome proliferator-activated receptor-γ (PPARγ) nuclear fatty acid receptor. The activated PPARγ subsequently triggers a cascade of molecular events that result in an expansion of the tumour and an increase in its aggressiveness, mainly due to a reduction in apoptosis and an increase in angiogenesis (21). In a subsequent study, suppression of PPARγ in the highly malignant prostatic cancer PC3-M cell line was found to lead to a significant reduction in cell proliferation, invasiveness and colony formation on soft-agar plates (21,22). Further investigation revealed that the FABP5-PPARγ-vascular endothelial growth factor (VEGF) signalling pathway was a more critical therapeutic target for the angiogenic suppression of CRPC than was blockade of the androgen-regulated pathway alone. Moreover, subsequent experiments demonstrated that, although the androgen receptor (AR)-initiated pathway fulfilled a significant role in androgen-dependent cancer cells, the effect of the AR-initiated pathway was gradually reduced, and then gradually replaced, by the FABP5-associated pathway, which became the more dominant one in CRPC cells (21,23).
However, despite all previous efforts, it remains unclear how FABP5 is involved in promoting the transition of androgen-dependent cells into androgen-resistant CRPC cells and, with the AR, in promoting the malignant progression of prostate cancer cells. In the present study, the gene-editing tool Clustered Regularly Interspaced Short Palindromic Repeats (CRISPR)/Cas9 was first used to completely knock out (KO) FABP5 or AR from the prostate cancer cells, and the effect of their KO on both the malignant characteristics of the resultant cells and on the levels of key proteins associated with the FABP5 and AR pathways were subsequently investigated. Through comparing RNA profiles between the parental cells and the FABP5- or AR-KO cells, the most significant changes in differentially expressed genes (DEGs) and relevant signal transduction pathways were identified. Taken together, the findings of the present study will not only enable the therapeutic potential of the newly identified genes to be tested, but they should also provide valuable insights into the underlying molecular mechanism(s) of FABP5 in prostate cancer, especially with regard to the malignant transition of prostate cancer to CRPC.
Materials and methods
Cell lines and culture
The following four prostate cell lines were used in the present study: The prostate epithelial cell line PNT2, established from a road-traffic victim without a history of prostatic diseases (24-26); the moderately malignant, AR-positive cell line, 22RV1 (27); and the highly malignant, AR-negative prostate cancer cell lines, DU145 (28) and PC3-M (29). Cells were maintained as monolayer cultures at 37°C in an atmosphere of 5% (v/v) CO2 in RPMI-1640 medium (Thermo Fisher Scientific, Inc.) supplemented with Invitrogen® L-glutamine (20 mM) (Thermo Fisher Scientific, Inc.), penicillin (100 U/ml) and streptomycin (100 μg/ml) and 10% (v/v) fetal bovine serum (FBS) (both from Biosera).
Cell proliferation assay
To assess their rate of proliferation, PC3-M, DU145 and 22RV1 cells, their FABP5-KO derivative lines, and the AR-KO line derived from 22RV1 were seeded at a density of 5,000 cells/well in 96-well plates. A Presto Blue HS proliferation assay kit (cat. no. A13261; Thermo Fisher Scientific, Inc.) was then used to measure the cell proliferation rates, following the manufacturer's instructions. The results obtained from the gene-KO cell lines were subsequently compared with those obtained from the parental control lines. The assays were performed in triplicate.
Invasion assay
The invasive capabilities of the cell lines PC3-M, DU145, 22RV1, their FABP5-KO derivative lines and the AR-KO derivative line from 22RV1 were assessed using a Boyden Matrigel™ chamber assay kit (BD Biosciences). The assay was performed using a 24-well plate with 8-μm pore membranes. Cells were seeded into the top compartment of the chamber in serum-free RPMI-1640 medium, whereas the lower compartment, containing the chemoattractant, contained Complete™ RPMI-1640 supplemented with 10% FBS and penicillin/streptomycin, as aforementioned. Identical conditions were used for all cell lines tested. The EVOS Fluorescent Imaging System, under ×20 magnification, was used was used to observe the cells. Cells capable of passing through the pores of the Matrigel membrane were counted as invasive cells. The cell invasion assays were performed in triplicate.
Gap closure assay
Cell motility rates were measured according to the ability of cells to migrate, and repair wounds were created in Ibidi™ culture insets (Ibidi GmbH) placed in micro-dishes. The cells were serum-starved (FBS<5%) at the beginning of the assay. The wound space gaps of PC3-M and DU145 cells were examined at 0, 12 and 24 h after the start of the experiment, while those of the relatively slow-growing 22RV1 cells were examined at 0, 24, 48 and 72 h after the start of the experiment. The gene-KO cell lines were assessed under identical conditions, and the results were compared with those obtained from the parental control cell lines. The gap closure assays were performed in triplicate.
Colony formation assay
The anchorage-independent growth (AIG) of cells was measured according to their ability to form colonies in soft agar. The protocol used in the present study was similar to that previously described (21). Colonies in soft agar were visualized by treating the plates with 3-(4,5-dimethylthiazolyl-2)-2,5-diphenyltetrazolium bromide (MTT) at a concentration of 0.5 mg/ml for 4 h after 3 weeks' culture of the cells, cultured and incubated at 37°C in the presence of 5% (v/v) CO2 in a humidified incubator. GelCount™ (a mammalian-cell colony, spheroid and organoid counter; Oxford Optronix, Ltd.) was used to count the number of colonies with diameters >200 μm.
Western blot analysis
Protein expression levels in the benign and the malignant prostate cancer cells were analyzed using western blot assay. Cell lysates were centrifuged with 4,000 × g, at 4°C, for 30 min, and the total protein concentration from each cell line was measured by the Bradford assay (Thermo Fisher Scientific, Inc.). Total proteins (20 μg/well) were loaded in polyacrylamide (12-15%) gel and separated in electrophoresis. After blotting the gel for 60 min at ambient temperature, the resultant PVDF membrane was blocked with 5% (w/v) TBST blocking solution, and the membrane was then incubated with primary antibodies overnight at 4°C. The membrane was subsequently washed and incubated with secondary antibody. Antibody-bound proteins were visualized using Immobilon® ECL Ultra Western HRP Substrate (Merck KGaA). An anti-β-actin antibody was incubated with each blot as a control to standardize the band intensity of FABP5 and its signal pathway-related proteins. The ChemiDoc Imaging System (Bio-Rad Laboratories, Inc.) and ImageJ v.1.48 were used to assess the areas and the intensities of the bands on the blots. The names, sources and dilutions of the primary and the secondary antibodies used in the present study are shown in Table I.
 |
Table I
Proteins detected by western blot and antibodies used.
|
Table I
Proteins detected by western blot and antibodies used.
| Protein |
Primary antibody |
Secondary antibody |
| FABP5 |
Monoclonal Rabbit Anti-human FABP5 (1:500; Hycult; cat. no. HP-9030) |
Swine polyclonal anti-rabbit Immunoglobulin/HRP (Dako; Agilent Technologies, Inc.; 1:20,000; cat no: P039901-2) |
| PPARγ |
Rabbit polyclonal anti-human PPARγ (Santa Cruz Biotechnology, Inc.; cat. no. sc-7196; 1:200) |
Swine polyclonal anti-rabbit Immunoglobulin/HRP (Dako; Agilent Technologies, Inc.; 1:20,000) |
| p-PPARγ |
Phospho-PPARγ (Ser112) Polyclonal Rabbit antibody (1:250; (Thermo Fisher Scientific, Inc.; cat. no. PA5-104884) |
Polyclonal Swine Anti-Rabbit Immunoglobulins-HRP (1:10,000; Abcam) |
| VEGF |
Mouse monoclonal Anti-VEGFA (Santa Cruz Biotechnology, Inc.; cat. no sc-7196; 1:200) |
Rabbit polyclonal anti-mouse Immunoglobulin/HRP (Dako; Agilent Technologies, Inc.; 1:10,000) |
| AR |
Mouse monoclonal Anti-AR Antibody (Santa Cruz Biotechnology, Inc.; cat. no. sc-7305; 1:1,000) |
Rabbit polyclonal anti-mouse Immunoglobulin/HRP (Dako; Agilent Technologies, Inc.; 1:20,000) |
| GRPR |
Rabbit polyclonal Anti-GRPR (Abcam; cat. no. ab-39883; 1:1,000) |
Swine polyclonal anti-rabbit Immunoglobulin/HRP (Dako; Agilent Technologies, Inc.; 1:20,000) |
| CAV1 |
Rabbit polyclonal Anti- Caveolin-Caveolae Marker (Abcam; cat. no. ab-2910; 1:1,000) |
Swine polyclonal anti-rabbit Immunoglobulin/HRP (Dako; Agilent Technologies, Inc.; 1:20,000) |
| NR1H4 |
Rabbit polyclonal Anti-Bile acid Receptor NR1H4 (Abcam; cat. no. ab-85606; 1:500) |
Swine polyclonal anti-rabbit Immunoglobulin/HRP (Dako; Agilent Technologies, Inc.; 1:10,000) |
| EGR3 |
Rabbit polyclonal Anti-EGR3 (Abcam; cat. no. ab-272903; 1:750) |
Swine polyclonal anti-rabbit Immunoglobulin/HRP (Dako; Agilent Technologies, Inc.; 1:10,000) |
| CRIP2 |
Rabbit polyclonal Anti-CRIP2 (Abcam; cat. no. ab-229110; 1:1,000) |
Swine polyclonal anti-rabbit Immunoglobulin/HRP (Dako; Agilent Technologies, Inc.; 1:10,000) |
| FOSB |
Rabbit polyclonal Anti-FOSB (Abcam; cat. no. ab-17204; 1:1,000) |
Swine polyclonal anti-rabbit Immunoglobulin/HRP (Dako; Agilent Technologies, Inc.; 1:10,000) |
| β-Actin |
Mouse monoclonal anti β-actin (MilliporeSigma; 1:50,000; cat no. A5316) |
Rabbit polyclonal anti-mouse Immunoglobulin/HRP (Dako; Agilent Technologies, Inc.; 1:20,000) |
Generation of FABP5- or AR-KO cell lines
FABP5- or AR-KO cell lines were generated through CRISPR/Cas9-mediated gene editing. The CRISPR RNA (crRNA) sequences, shown in Table II, were designed to target FABP5 or AR in various exons with the Alt-R® CRISPR-Cas9 guide RNA designing tools. ATTO-550-labeled crRNA and trans-activating crRNA (tracrRNA) were designed with the same tools (Integrated DNA Technologies, Inc.). The cells were seeded in 6-well plates for 24 h prior to the transfection at a density of 2.5×10⁵ cells per well. To form a duplex, crRNA and tracrRNA-ATTO-550 were heated and cooled, and then assembled with Cas9 protein in Opti-MEM® for 10 min. The ATTO-550 ribonucleoprotein CRISPR cas9 (RNP) complex was combined with Lipofectamine® CRISPRMAX™ (Thermo Fisher Scientific, Inc.) by incubation at 4°C for 30 min, and the mixture was subsequently used for transfection. A highly efficient procedure (30) was followed precisely for the transfection experiments.
|
Table II
The guide RNAs, PAM sequences, and the genomic locations of the KO genes.
|
Table II
The guide RNAs, PAM sequences, and the genomic locations of the KO genes.
| Guide RNA and PAM seq |
Cell line |
KO gene |
Exon |
Locus |
Region |
| AAGTATCAACTTCATCATAGCAA |
22RV1 |
FABP5 |
1 |
NG_028154 |
5079..5138 |
| GATGAATACATGAAGGAGCTAGG |
DU145 |
FABP5 |
1 |
HQ384161 |
5130..5189 |
| AAGTATCAACTTCATCATAGCAA |
PC3M |
FABP5 |
3 |
NM_000044 |
8156..8209 |
| CAACGCCAAGGAGTTGTGTAAGG |
22RV1 |
AR |
1 |
NM_00134806 |
1828..1847 |
| GGTTACACCAAAGGGCTAGAAGG |
22RV1 |
AR |
1 |
NM_00134806 |
1467..1486 |
| GCAGAAATGATTGCACTATTCAA |
22RV1 |
AR |
2 |
NM_00134806 |
2234..2253 |
Flow cytometry/cell-sorting analysis
To verify whether the transfection was successful and to isolate the single colony harbouring a fluorescent RNP complex, the transfected cells were harvested and separated by fluorescence-activated cell sorting (FACS) analysis at 24 h after transfection. The cell suspension was then split into two parts: One part was subjected to cell sorting to isolate the fluorescent cells, whereas the second part was subjected to western blot analysis to confirm that the expected alterations in targeted gene expression were achieved, as assessed by the level of the proteins of interest. Flow cytometric analyses were performed at the Faculty of Health and Life Sciences at Liverpool University (UK) using a FACSAria flow cytometer (BD Biosciences), fitted with an ATTO-550 filter with the assistance of Cell Quest software BD FACSDiva 8.02 (BD Biosciences).
PCR amplification of DNA and DNA sequencing
To test the KO efficiency of the FABP5 gene in cells originating from a single clone, an ~500 bp segment of genomic DNA, adjacent to the guide (g)RNA region, was amplified by PCR using positive (5′-GGC AAG AGG AGC TGG TTA G-3′) and negative (5′-GAG GGT CAC GGT AGT TAT TTC A-3′) primers, before being sequenced using a 3730×l DNA Analyzer (Azenta Life Sciences) after successive treatments with the Applied Biosystems® BigDye™ Terminator v3.1 kit, (cat. no. 4337455; Thermo Fisher Scientific, Inc.), following the manufacturer's instructions. The resulting sequence data, which covered DNA regions from 100 bp upstream to 400 bp downstream of different gRNAs, was then used to assess the effect of knocking out the different genes. The KO efficiency was subsequently verified by comparing the natural DNA sequence with the sequence obtained from the KO cell lines at the same DNA region.
RNA extraction, RNA library preparation and NovaSeq™ sequencing
Total RNA was extracted from frozen cell pellets using a Qiagen® RNeasy Mini kit (cat. no. 74004) following the manufacturer's instructions. The Qiagen FastSelect™ rRNA HMR kit was used for preparing the rRNA depletion sequencing library. A NEBNext Ultra II RNA Library Production kit (cat. no. HB-2580; Qiagen, Inc.) for Illumina was used to prepare the RNA sequencing library. The libraries were verified using a Tapestation™ 4200 kit (cat. no. G2991BA; Agilent Technologies, Inc.), quantified with a Qubit 2.0 Fluorometer (Thermo Fisher Scientific, Inc.), and validated by quantitative (q)PCR. The multiplexed sequencing libraries were sequenced using the Illumina NovaSeq 6000 System with a 2×150 Pair-End Configuration, version 1.5. The raw sequence data produced by the Illumina NovaSeq was converted into FASTQ files using the Illumina bcl2fastq application version 2.20, which were subsequently de-multiplexed based on index sequence identification.
RNA sequencing data analysis
Trimmomatic (a flexible read trimming tool for Illumina NGS data) was used to trim the sequence reads, to remove adapter sequences, and to exclude low-quality nucleotides. STAR aligner (https://github.com/alexdobin/STAR) was then used to map the trimmed reads to the human reference genome, resulting in BAM files. Unique gene hits were computed using feature counts, and only readings that occurred inside exon regions were included for further assessments. The expression of DEGs was analyzed using the package DESeq2, and gene ontology (GO) studies were performed using the real-time based functional enrichment tool, GeneSCF. Clustering of genes according to biological processes and determining the statistical significance was accomplished using the goa human GO list (https://www.biorxiv.org/content/10.1101/148411v2). The IDEP.96 Web Application (http://bioinformatics.sdstate.edu/idep96/) was used to generate several visualizations, including volcano plots, hierarchical clustering heatmaps, and GO-enriched chart analysis of DEGs. The Bioinformatics Analysis Workflow was developed using GENEWIZ from Azenta Life Sciences.
Statistical analysis
The data in the present study was analysed using GraphPad Prism 9 (Dotmatics) and ImageJ software version 1.51 (National Institutes of Health). Two-tail paired Student's t-test and one-way ANOVA test used to compare the difference between the means of two groups and multiple groups, respectively, were performed with respect to the experimental and the control groups in various experiments, including western blotting analysis, cell proliferation and invasion, and soft-agar assays. Dunnett's post hoc test was utilized for multiple comparisons following the ANOVA. P<0.05 was considered to indicate a statistically significant difference.
Results
Western blot analysis was first used to detect the expression levels of certain key proteins associated with the FABP5 signalling pathway in benign and malignant prostate cells, and these results were then combined with DNA sequencing analysis to verify the successful gene KO cell clones. The levels of proteins associated with the FABP5 pathway in prostate cell lines and their KO variants, and the effect of FABP5-KO on the malignant characteristics of 22RV1 and on the proteins downstream of the FABP5 pathway, were investigated, and the results are revealed in Fig. 1.
 |
Figure 1
Western blot analysis of some key proteins associated with the FABP5 pathway in benign and malignant prostate cells, and western blot analysis was combined with DNA-sequencing analysis to verify the successful gene KO cell clones. An anti-β-actin antibody was incubated with each blot to standardize the immunological responses. Quantitative analysis was performed by densitometrical scanning of the area and peak of each band on the blot. The protein relative levels were reproduced independently three times, and the differences were assessed by Student's t-test for results with 2 datasets, and one-way ANOVA test for results with 3 or more datasets. Dunnett's post hoc test was utilized for multiple comparisons following the ANOVA. (A) Relative expression of FABP5 pathway-associated proteins in benign and malignant prostate epithelial cells is shown. a) Western blot analysis of FABP5 in benign PNT2 cells, the moderately malignant 22RV1 cells, and the highly malignant prostate carcinoma cell lines, DU145 and PC3M. b) Relative levels of FABP5 protein in PNT2, 22RV1, DU145 and PC3M cells. The level of FABP5 in 22RV1 cells was set at '1', and the levels in DU145 and PC3M were obtained by comparing with that of 22RV1. c) Western blot detection of PPARγ in PNT2, 22RV1, DU145 and PC3M cells. d) Relative levels of PPARγ in PNT2, 22RV1, DU145, and PC3M cells. The level in PNT2 cells was set at '1', and the levels in the other cell lines were obtained by comparing with that of PNT2. e) Western blot analysis of pPPARγ in PNT2, 22RV1, DU145 and PC3M cells. f) Relative levels of pPPARγ in PNT2, 22RV1, DU145, and PC3M cells. The level in 22RV1 cells was set at '1', and levels in DU145 and PC3M were obtained by comparing with that of 22RV1. g) Western blot analysis of ARFL protein in PNT2, 22RV1, DU145 and PC3M cells. h) Relative levels of ARFL in prostate cell lines. The level of ARFL in 22RV1 cells was set at '1', and levels in the other cell lines were not detectable. i) Western blot analysis of VEGF protein in PNT2, 22RV1, DU145 and PC3M cells. j) Relative levels of VEGF; the level in PNT2 was set at '1', and levels in the other cell lines were obtained by comparing with that of PNT2. (B) Western blot and DNA sequencing analyses were performed to verify successful gene suppression in KO cell clones. a) Western blots of FABP5 protein in 22RV1 cells and its derivative FABP5-KO clones. b) Relative levels of FABP5 in 22RV1 cells and in its derivative FABP5-KO clones. The level of FABP5 in 22RV1 cells was set at '1', and levels in different clones were obtained by comparing with that in 22RV1. c) Further Western blots of FABP5 protein in 22RV1 cells and in the successful FABP5-KO clone C3. d) DNA sequence analysis revealed the location where the guide RNA-induced mutation occurred (depicted by the black arrow). e) Western blot analysis of FABP5 protein in DU145 cells and in its derivative FABP5-KO clones. f) Relative levels of FABP5 in DU145 and in the different FABP5-KO clones. The level of FABP5 in DU145 was set at '1', and the levels in the different clones were obtained by comparing with that in DU145. g) Western blot analysis of FABP5 protein in DU145 cells and in a selected FABP5-KO clone (C2). h) DNA sequence analysis revealed the location where the guide RNA-induced mutation occurred (depicted by the black arrow). i) Western blot detection of FABP5 expression in PC3M and in different FABP5-KO clones. j) Relative levels of FABP5 in PC3M and in its different FABP5-KO clones. The level of FABP5 in PC3M was set at '1', and the levels in its different FABP5-KO clones were obtained by comparing with that in PC3M. k) Western blot analysis of FABP5 protein in PC3M and in its selected FABP5-KO clone, C6. l) DNA sequence analysis revealed the location where the guide RNA-induced mutation occurred (depicted by the black arrow). m) Western blot analysis of AR protein in 22RV1 cells and in its different AR-KO clones. n) Relative levels of AR in 22RV1 cells and in its AR-KO clones. The level of AR in 22RV1 was set at '1', and the levels of AR in different clones were obtained by comparing with that in 22RV1. o) Western blot analysis of AR expression in 22RV1 cells and in its AR-KO clones. p) Relative levels of AR in 22RV1 and in its AR-KO clones. The level of AR in 22RV1 was set at '1', and the levels of AR in different clones were obtained by comparing with that in 22RV1 cells. ***P<0.0001 and ****P<0.00001. KO, knockout; FABP5, fatty acid-binding protein 5; AR, androgen receptor; PPARγ, peroxisome proliferator-activated receptor-γ; VEGF, vascular endothelium growth factor; pPPARγ, phosphorylated PPARγ; ns, not statistically significant.
|
Levels of FABP5-associated proteins in prostate cell lines and their KO variants
The expression statuses of FABP5 and the proteins associated with the FABP5 signaling pathway in prostate cells are presented in Table SI. In addition, the effects on protein levels in prostate cancer cell lines following FABP5- or AR-KO are summarized in Table SII. The FABP5 pathway-associated proteins detected by western blotting in the benign and the malignant prostate epithelial cells included PPARγ1, PPARγ2, phosphorylated (p)PPARγ1, pPPARγ2, full-length AR (ARFL), AR splicing variant 7 (ARV7) and VEGF (Fig. 1A). Whereas FABP5 protein was not detectable in the benign PNT2 cells, it was detected at a moderately increased level in the moderately malignant cell line 22RV1, and at high levels in the two highly malignant prostate cell lines, namely DU145 and PC3M (Fig. 1Aa and b). PPARγ1 protein was strongly expressed in PNT2 cells, and at an even higher level in 22RV1 cells, although its expression was at a markedly lower level in DU145 and PC3M cells. PPARγ2 protein was also found to be highly expressed in PNT2 cells, although its expression level was markedly lower in all three malignant cell lines (Fig. 1Ac and d). Concerning the phosphorylated forms of these proteins, both pPPARγ1 and pPPARγ2 were undetectable in benign PNT2 cells, weakly expressed in 22RV1 cells, and highly expressed in the highly malignant DU145 and PC3M cell lines (Fig. 1Ae and f). ARFL and ARV7 proteins were found to be expressed only in androgen-responsive 22RV1 cells, and no expression of ARV7 was detected in either the benign PNT2 cells or in the highly malignant DU145 and PC3M cells (Fig. 1Ag and h). Finally, VEGF was expressed in all cell lines, with a lower level of expression observed in the benign PNT2 cells, albeit strong expression levels were detected in all three malignant cell lines (Fig. 1Ai and j).
To establish the roles of FABP5 and AR, several sub-lines were established by FABP5-KO or AR-KO of the 22RV1, DU145 and PC3M cell lines, as aforementioned in the Materials and methods section. Western blotting combined with DNA sequence analysis were used to verify the gene KO efficiency, as demonstrated in Fig. 1B. In the original five single-cell clones established by FABP5-KO in 22RV1 cells, the levels of FABP5 were found to be greatly reduced, and at least in one clone (colony 5), termed C5, its expression was completely lost (Fig. 1Ba and b). This result was confirmed further by western blot analysis (Fig. 1Bc). Therefore, C5 was expanded and established as the sub-line, 22RV1-FABP5-KO. The original clone C5 failed to express FABP5 protein (Fig. 1Bb), and the genomic DNA sequence revealed that a single-point mutation occurred at bp 61 of the targeted region of the FABP5 gene (as denoted by the arrow in Fig. 1Bd, wherein a G in the parental cells was mutated to a C). This fatal frameshift mutation led to a complete KO of the expression of the FABP5 gene. Western blot analysis of FABP5 in the DU145 cell line and in its two FABP5-KO clones, C1 and C2, revealed that the level of protein expression was the highest in the parental control cells, whereas the levels in both C1 and C2 were greatly reduced (Fig. 1Be and f). After several rounds of additional selections, a single cell clone from the original C2 cells was cultured continuously, and the original mutation was found to be retained. Further western blot analysis revealed no detectable expression of the FABP5 protein (Fig. 1Bg), indicating that the expression of the FABP5 gene had been completely knocked out. DNA sequence analysis subsequently revealed that several base-pairs (bp 117-130) of the FABP5 gene had been deleted by KO (shown by the arrow in Fig. 1Bh), causing a complete frameshift of the FABP5 gene. Therefore, the C2 clone was expanded to form the sub-line, DU145-FABP5-KO. Expression of FABP5 protein in PC3M cells and in the six FABP5-KO clones, namely C1-C6, was found to be high in parental PC3M cells, although the expression level was greatly reduced in clones C1-5. No FABP5 protein expression was detected in clone C6 (Fig. 1Bi and j), and an additional western blot was run to confirm this result (Fig. 1Bk). Therefore, clone C6 was expanded to establish the cell line PCM-FABP5-KO. DNA sequence analysis revealed a single base T was deleted at bp 286 in the FABP5 gene by KO (as shown by the arrow in Fig. 1Bl), causing a frameshift that led to a complete KO of expression of the FABP5 gene in PC3M cells. Expression of AR protein in 22RV1 cells and in its eight AR-KO clones, C1-C8, identified that both the ARFL and ARV7 proteins were highly expressed in 22RV1 and C2 cells. The AR levels in all the other sub-lines were found to be lower than that of the control (Fig. 1Bm and n). When the newly established clones that has been developed from a single cell of the original C1, C3 and C4 clones (which were renamed as C9, C10 and C11, respectively) were examined (Fig. 1Bo and p), the expression of AR was found to be completely undetectable in the new C11 colony. Therefore C11, expressing neither ARFL nor ARV7, was expanded to establish the sub-line, 22RV1-AR-KO.
Effect of FABP5-KO both on malignant characteristics of 22RV1 cells and on the downstream proteins of the FABP5 signalling pathway
The effect of FABP5-KO both on the malignant characteristics of AR-positive 22RV1 cells and on several proteins in the FABP5-associated signal transduction pathway was assessed (Fig. 2). The microscopic appearances of the cultured cells revealed a markedly less aggressive morphology in the 22RV1-FABP5-KO cells compared with the parental 22RV1 cells (Fig. 2A). Moreover, the proliferation rate of 22RV1-FABP5-KO cells was significantly reduced from day 2 onwards; by day 6, it was significantly (Student's t-test; P<0.001) suppressed by 38% compared with that of the 22RV1 cells (Fig. 2B). When the invasive capabilities of 22RV1 cells and the derivative 22RV1-FABP5-KO cells were compared (Fig. 2C), 489±10 cells were found to have invaded from the control 22RV1 cells, whereas only 5±2 cells had invaded from the 22RV1-FABP5-KO cells (Fig. 2D), a highly significant reduction in the invasion rate of 99% (Student's t-test; P<0.0001). Upon performing a soft-agar assay to assess the AIG of the 22RV1 and 22RV1-FABP5-KO cells, the average colony count for 22RV1 was found to be 60±2, whereas for 22RV1-FABP5-KO cells, it was only 4±3 (Fig. 2E and F), representing a highly significant reduction in the colony count of 93% (Student's t-test; P<0.0001). A cell migration assay was subsequently performed to assess the motility of the 22RV1 and 22RV1-FABP5-KO cells. Although there was no noticeable difference between the 22RV1 cells and the derivative 22RV1-FABP5-KO cells after 24 h incubation, after 48 h, the control cells had closed 96% of the wound gap. By contrast, the 22RV1-FABP5-KO cells had closed only 60% of the wound gap (Student's t-test, P<0.001). At 72 h, the wound gap in the 22RV1 cells was closed by 98%, whereas in the 22RV1-FABP5-KO cells, only 67% of the wound gap was closed (Student's t-test, P<0.0002) (Fig. 2G and H). Western blot analyses were then performed to analyze the expression levels of the proteins previously identified in the FABP5-associated signal pathway (21), and the first of these to be investigated was PPARγ (Fig. 2I and J). Although the expression level of PPARγ1 was found to increase significantly by 75% (Student's t-test, P<0.0001), that of PPARγ2 was significantly decreased by 99% (Student's t-test, P<0.0001) in the 22RV1-FABP5-KO cells compared with the 22RV1 cells (Fig. 2I). The parental 22RV1 cells exhibited moderate expression levels of both pPPARγ1 and pPPARγ2. The expression level of pPPARγ1 was revealed to be reduced significantly by 64% (Student's t-test, P<0.0001), whereas that of pPPARγ2 was reduced by 88% in the 22RV1-FABP5-KO cells (Student's t-test, P<0.0001) compared with that in the control 22RV1 cells (Fig. 2K and L). Concerning the other investigated proteins, the relative protein expression level of VEGF in the 22RV1-FABP5-KO cells was significantly decreased by 90% compared with that of the 22RV1 cells (Student's t-test, P<0.0001) (Fig. 2M and N). Although both the ARFL and ARV7 proteins were observed in the control 22RV1 cells, only ARFL was detectable in the 22RV1-FABP5-KO cells, and no band associated with ARV7 was observed (Fig. 2O). Upon normalizing the levels of ARFL and ARV7 in 22RV1 to '1', the relative levels of ARFL and ARV7 in the 22RV1-FABP5-KO cells were 1 and 0, respectively (Fig. 2P). Therefore, the expression of ARV7 was shown to be entirely abolished (by 100%) in the 22RV1-FABP5-KO cells (Student's t-test, P<0.0001).
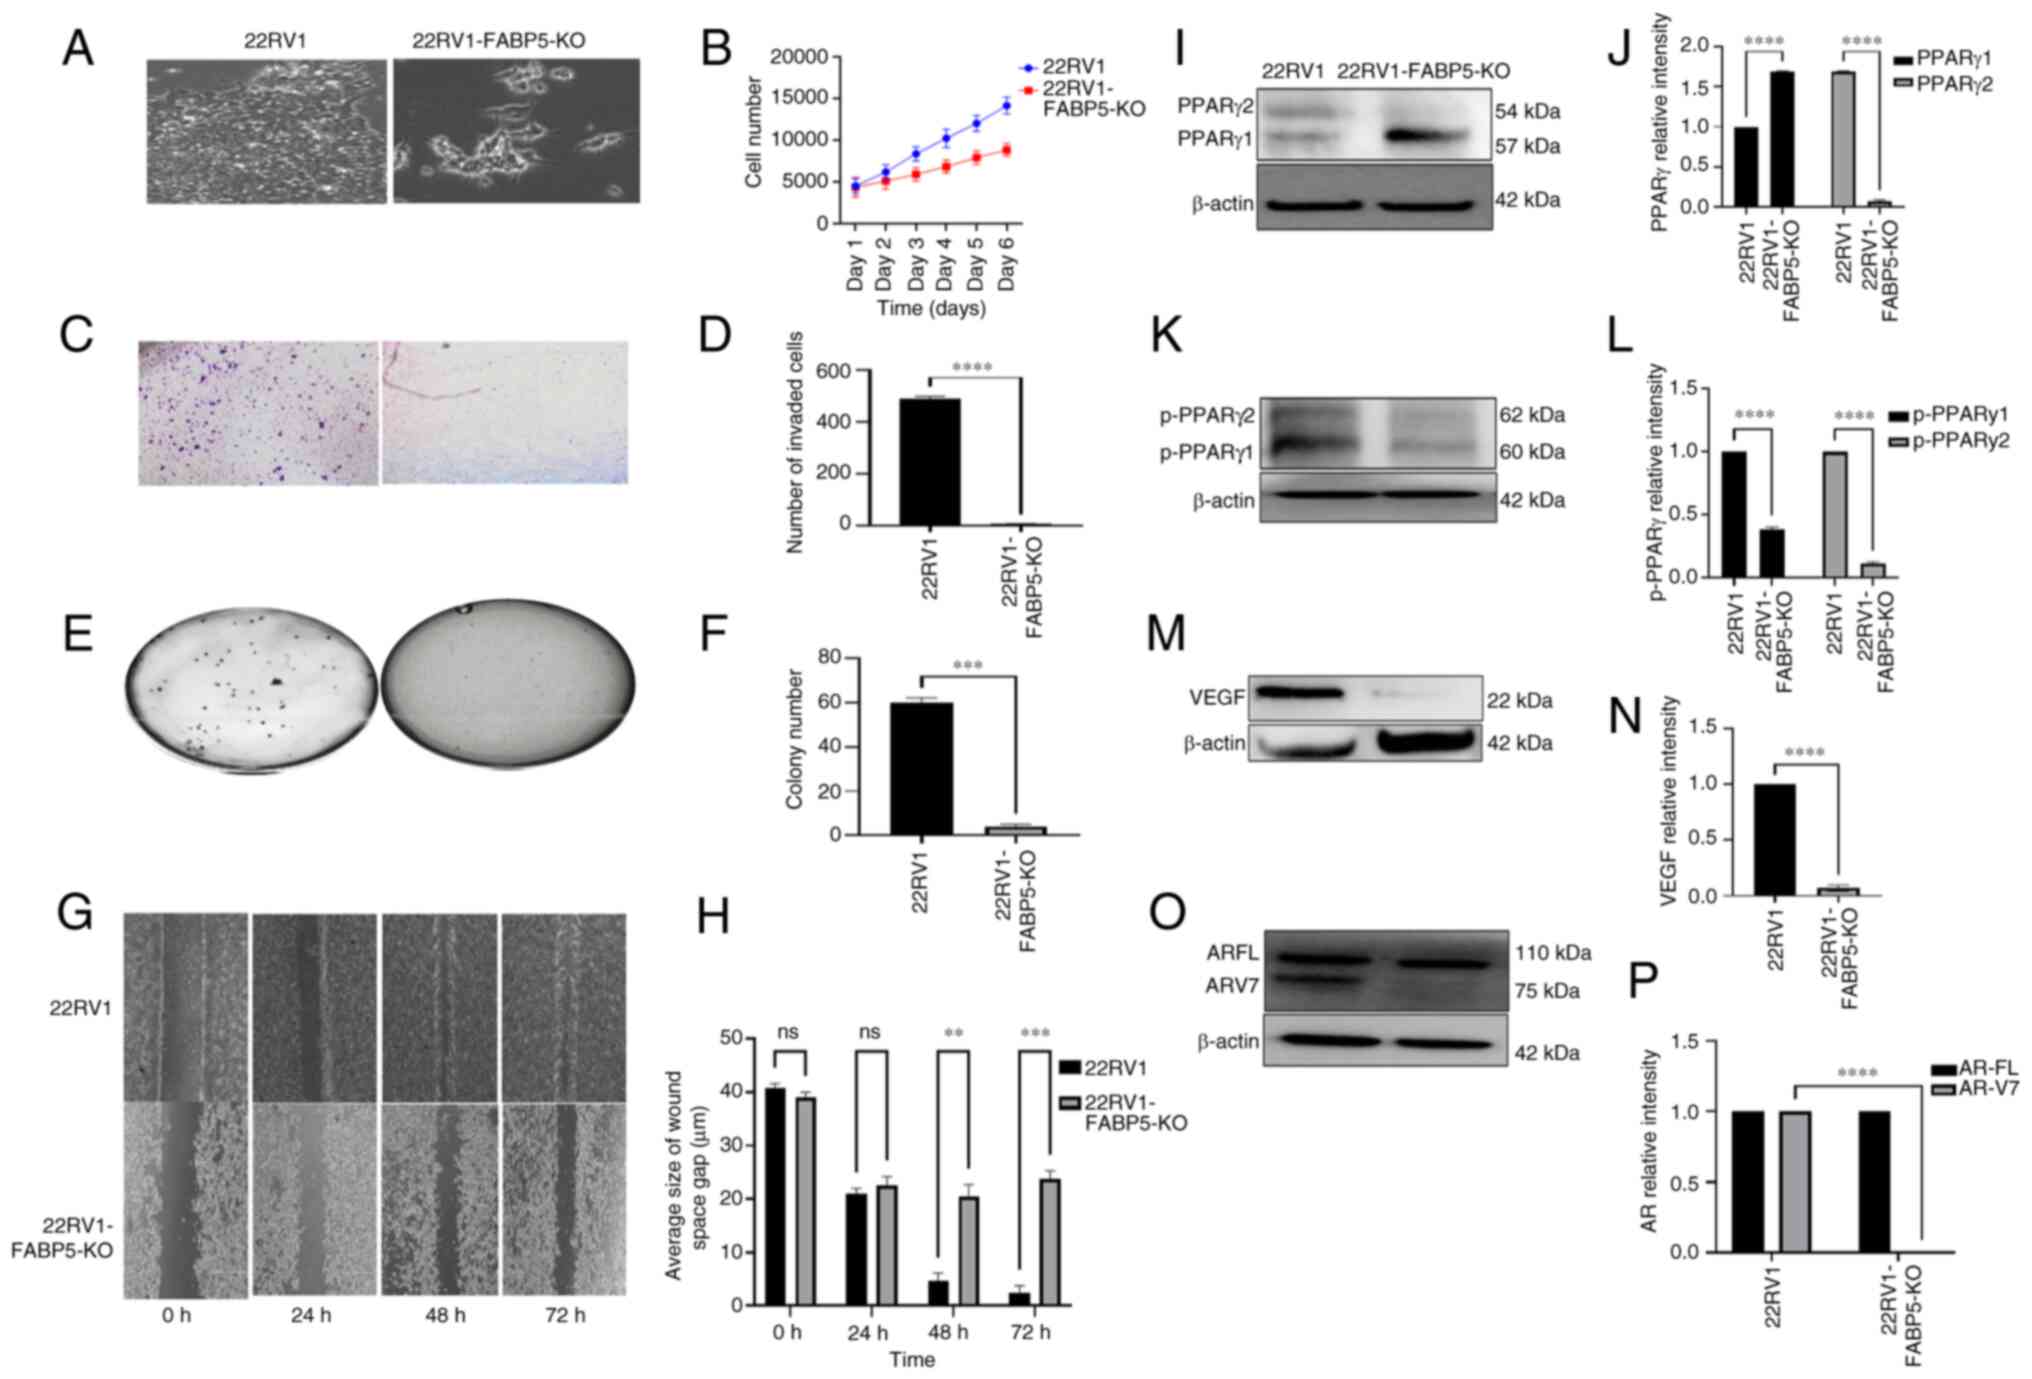 |
Figure 2
Effect of FABP5-KO on malignant characteristics of 22RV1 cells and on the levels of downstream proteins of the FABP5 signaling pathway. (A) Microscopical appearances of 22RV1-FABP5-KO cells and their parental 22RV1 cells. (B) Effect of FABP5-KO on proliferation of 22RV1 cells. C) Effect of FABP5-KO on invasion of 22RV1 cells. (D) Quantitative assessment of the numbers of invasive cells. (E) Effect of FABP5-KO on anchorage-independent growth of 22RV1 cells. (F) Quantitative assessment on cell colony numbers formed in soft agar. (G) Effect of FABP5-KO on motility of 22RV1 cells. (H) Quantitative assessment of the average wound width of the space of the gap (μm) at different times is shown. (I) Western blot analysis of PPARγ1 and PPARγ2 in 22RV1 and in 22RV1-FABP5-KO cells. (J) Relative levels of PPARγ1 and PPARγ2. The levels of PPARγ1 and PPARγ2 in 22RV1 cells were each set at '1', and their levels in 22RV1-FABP5-KO cells were obtained by comparing with those in 22RV1. (K) Western blot analysis of pPPARγ1 and pPPARγ2 in 22RV1 and in 22RV1-FABP5-KO cells. (L) Relative levels of pPPARγ1 and pPPARγ2. The levels of pPPARγ1 and pPPARγ2 in 22RV1 were each set at '1', and those in 22RV1-FABP5-KO cells were obtained by comparing with those in 22RV1. (M) Western blot analysis of VEGF in 22RV1 and in 22RV1-FABP5-KO cells. (N) Relative levels of VEGF protein. The level of VEGF in 22RV1 cells was set at '1', and the level of VEGF in 22RV1-FABP5-KO cells was obtained by comparing with that in 22RV1. (O) Western blot analysis of ARFL and ARV7 in 22RV1 and in 22RV1-FABP5-KO cells. (P) Relative levels of ARFL and ARV7. Levels of ARFL and ARV7 in 22RV1 cells were set at '1', and the levels of ARFL and ARV7 in 22RV1-FABP5-KO cells were obtained by comparing with those in 22RV1. The protein relative levels were reproduced independently three times, and the differences were assessed by Student's t-test. Results were considered significant when P<0.05. **P<0.001, ***P<0.0001 and ****P<0.00001. KO, knockout; FABP5, fatty acid-binding protein 5; AR, androgen receptor; ARFL, full-length AR; ARV7, AR splicing variant 7; PPARγ, peroxisome proliferator-activated receptor-γ; pPPARγ, phosphorylated PPARγ; ns, not statistically significant.
|
Effect of AR-KO on the malignant characteristics of 22RV1 cells, and on the FABP5-associated signalling pathway proteins
The effects of AR-KO both on the malignant characteristics of AR-positive 22RV1 cells and on protein expression levels in the FABP5-associated pathway were assessed (Fig. 3). The appearance of the 22RV1-AR-KO cells under a microscope revealed a markedly less aggressive morphology compared with the 22RV1 cells (Fig. 3A). The proliferation rate of the 22RV1-AR-KO cells was found to be markedly lower compared with that of the parental 22RV1 cells. By day 6, the proliferation rate of the 22RV1-AR-KO cells was only 64% that of the control cells (Fig. 3B). Therefore, AR-KO had the result of significantly reducing the proliferation rate of 22RV1 cells by 36% (Student's t-test, P<0.001). When the invasive capabilities of the 22RV1 and 22RV1-AR-KO cells were compared, the number of invasive 22RV1 cells was found to be 566±25, compared with only 45±10 in the 22RV1-AR-KO cells (Fig. 2C and D), a significant suppression of 92% (Student's t-test, P<0.0001). When the AIG was tested, 22RV1 cells formed 72±3 colonies, although this number was reduced to 3.0±2.5 colonies formed by 22RV1-AR-KO cells (Fig. 3E and F), representing a substantial reduction of 97.2% (Student's t-test, P<0.0001). When the motility rates were compared, no significant differences were identified between the two cell types at 24 h after wounding the cells. However, at 48 h after wounding the cells, control cells exhibited a closure of 30% of the wound gap, whereas only 18% of the wound gap was observed to be closed in the experiment with the 22RV1-AR-KO cells (Student's t-test, P<0.05). At 48 and 72 h after forming the wound, the wound-gap closure in the 22RV1 cells was 94 and 99%, respectively, whereas the gap closures in 22RV1-AR-KO cells were significantly reduced by 21 and 19%, to only 75 and 80%, respectively (Student's t-test, P<0.0001 in both cases) (Fig. 3G and H).
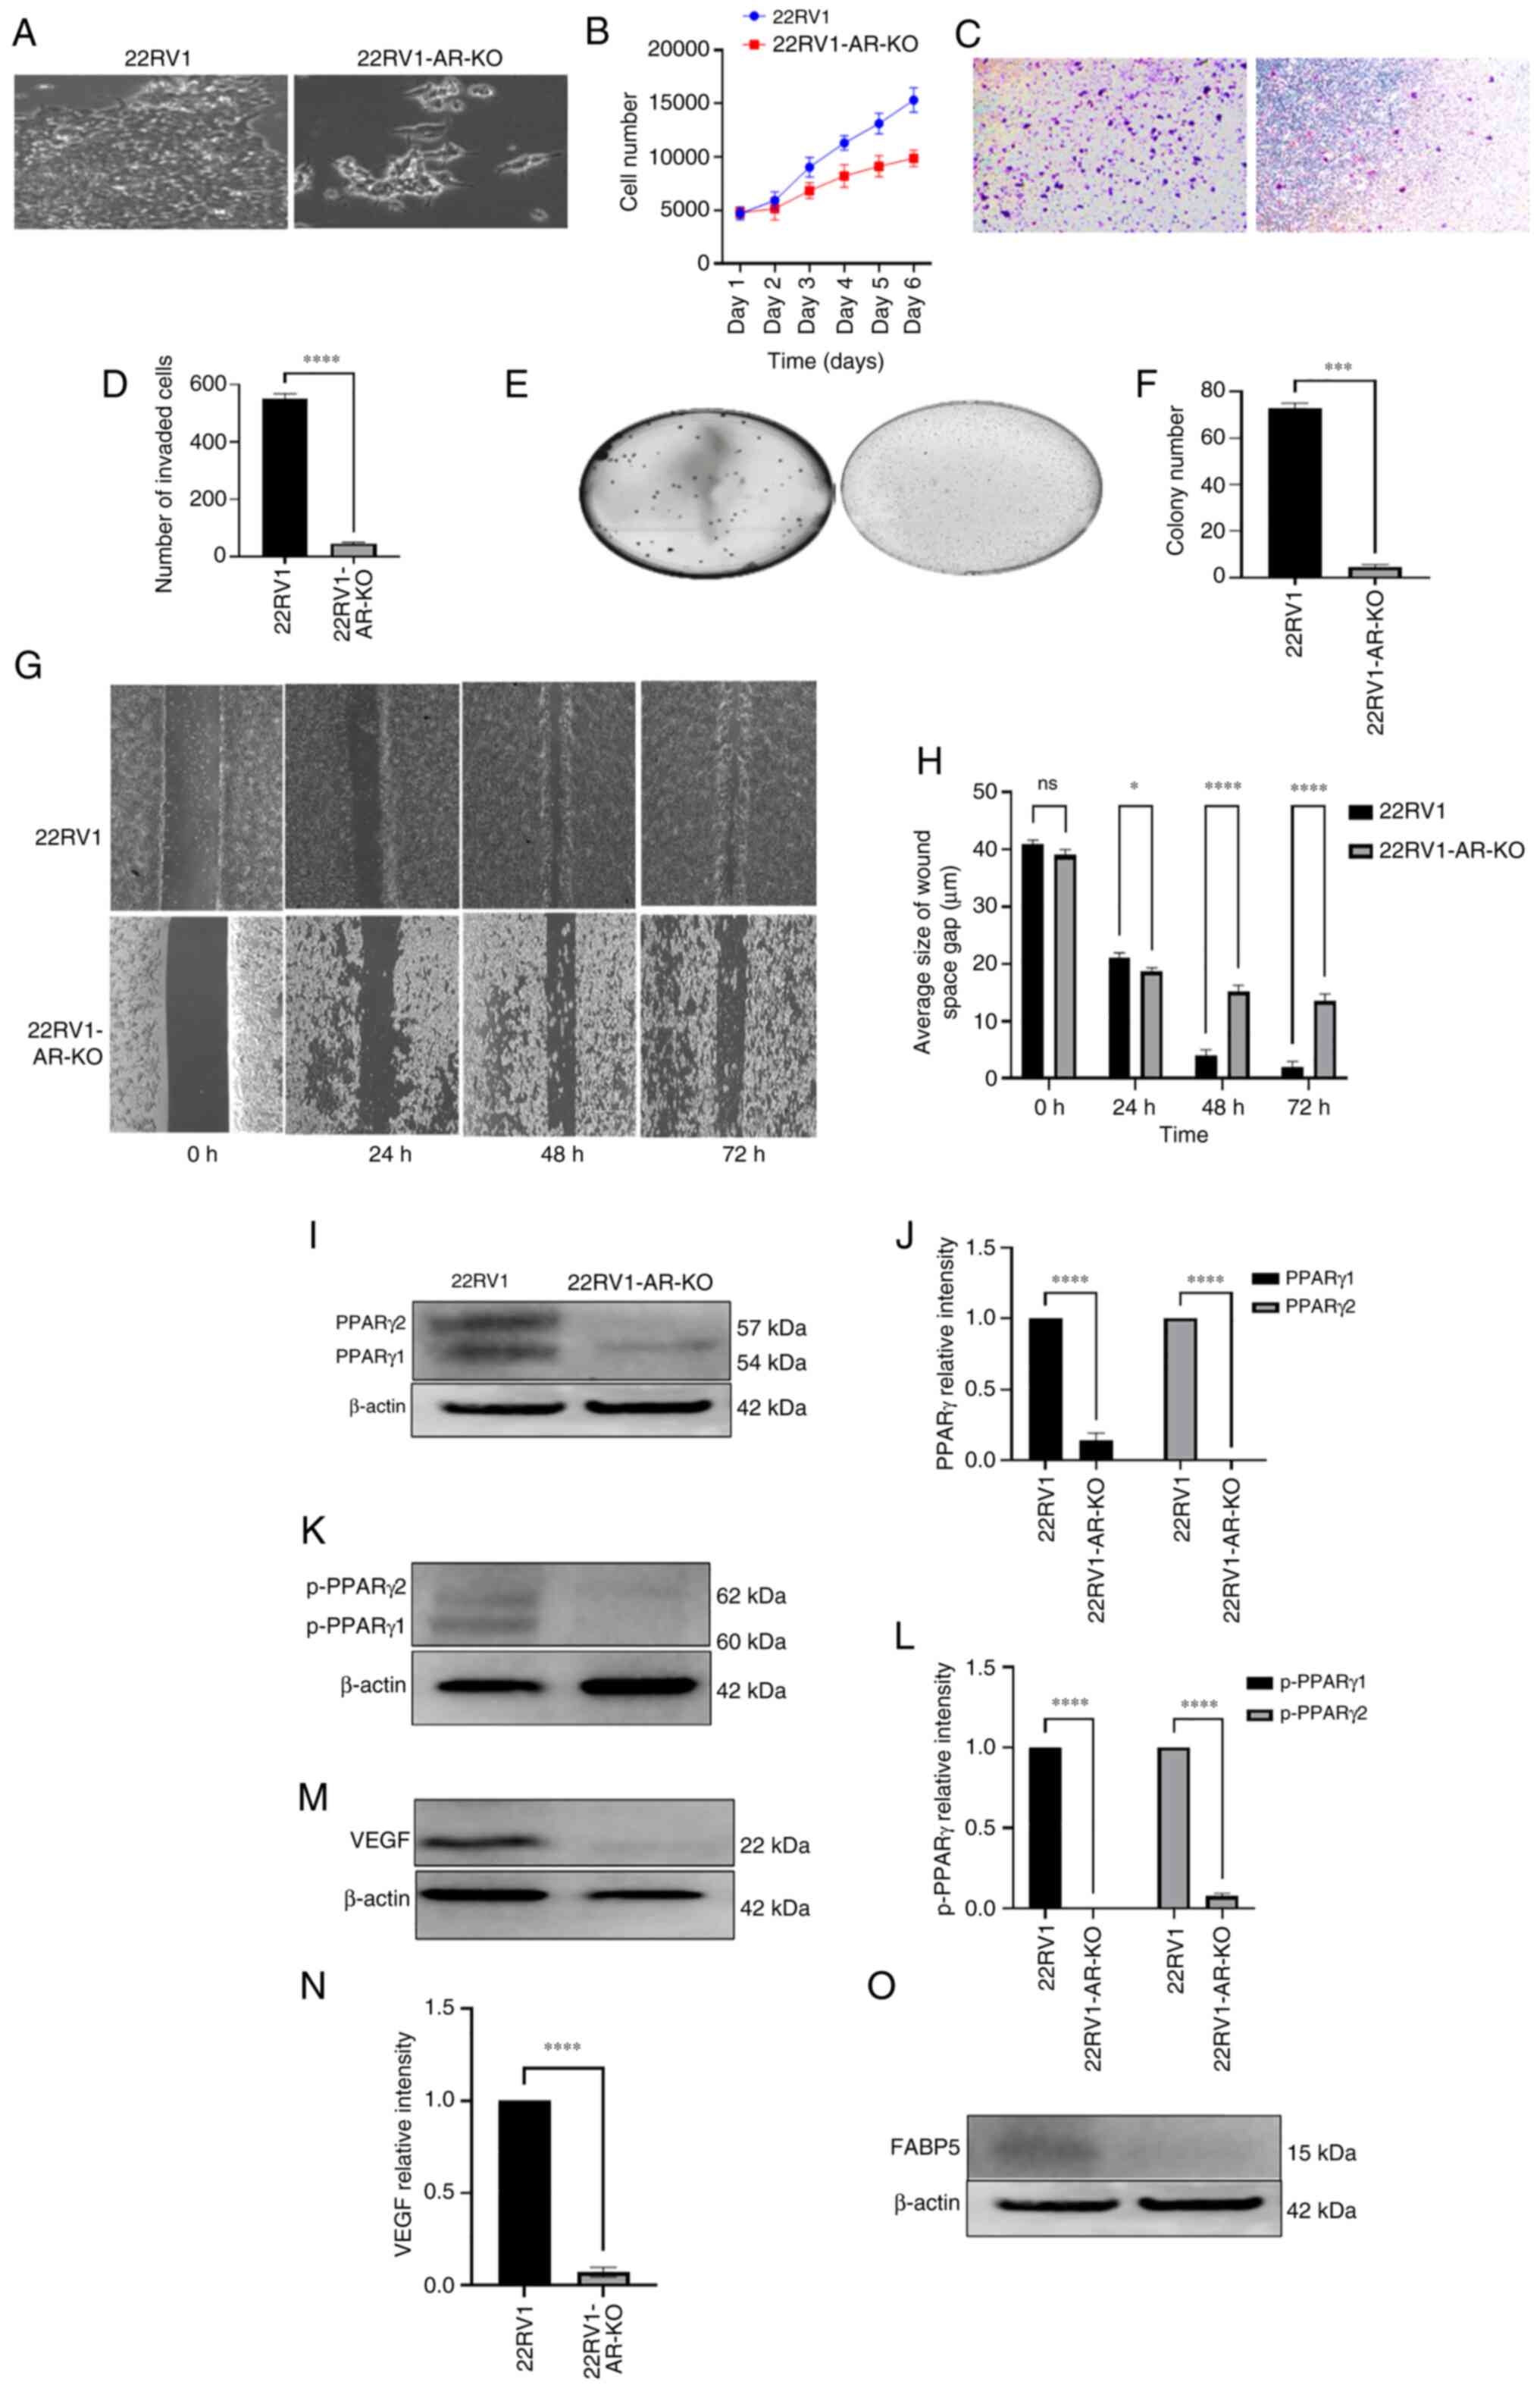 |
Figure 3
Effect of AR-KO on the malignant characteristics of 22RV1 cells and on levels of the down-stream proteins of the FABP5 signalling pathway. (A) Microscopical appearances of 22RV1 and 22RV1-AR-KO. (B) Effect of AR-KO on proliferation of 22RV1 and 22RV1-AR-KO cells. (C) Effect of AR-KO on 22RV1 cell invasion. (D) Average number of invasive cells from 22RV1 and 22RV1-AR-KO cells. (E) Effect of AR knockout on anchorage-independent growth of 22RV1 cells. (F) Relative numbers of colonies formed in soft agar by 22RV1 and 22RV1-AR-KO cells. (G) Effect of AR-KO on gap closure of 22RV1 and 22RV1-AR-KO cells. (H) Quantitative assessment of average sizes of the wound space or gap in 22RV1 and 22RV1-AR-KO cells in μm at different times. (I) Western blot analysis of PPARγ1 and PPARγ2 in 22RV1 and 22RV1-AR-KO cells. (J) Relative levels of PPARγ1 and PPARγ2 in 22RV1 and 22RV1-AR-KO cells. (K) Western blot analysis of pPPARγ1 and pPPARγ2 in 22RV1 and 22RV1-AR-KO cells. (L) Quantitative assessment of levels of pPPARγ1 and pPPARγ2 proteins. Levels of pPPARγ1 and pPPARγ2 in 22RV1 were set at '1', and the levels in 22RV1AR-KO cells were obtained by comparing with those in 22RV1. (M) Western blot analysis of VEGF in 22RV1 and 22RV1-AR-KO cells. (N) Relative levels of VEGF in 22RV1 and 22RV1-AR-KO cells. The level of VEGF in 22RV1 cells was set at '1', and that in 22RV1-AR-KO cells was obtained by comparing with that in 22RV1. (O) Western blot detection of FABP5 protein in 22RV1 and 22RV1-AR-KO cells (no quantification was made, since the level in 22RV1-FABP5-KO cells was negligible). The protein relative levels were reproduced independently three times, and the differences were assessed by Student's t-test. *P<0.05, ***P<0.0001 and ****P<0.00001. KO, knockout; FABP5, fatty acid-binding protein 5; AR, androgen receptor; PPARγ, peroxisome proliferator-activated receptor-γ; pPPARγ, phosphorylated PPARγ; VEGF, vascular endothelium growth factor; ns, not statistically significant.
|
According to the western blot analysis, the expression of PPARγ1 protein was significantly suppressed by 86% (Student's t-test, P<0.0001), whereas the expression of PPARγ2 protein was not detectable in 22RV1-AR-KO cells (Fig. 3I and J). Moreover, active phosphorylated forms of both pPPARγ1 and pPPARγ2 were found to be expressed in 22RV1 cells, whereas in 22RV1-AR-KO cells, the expression of pPPARγ1 was undetectable, while that of pPPARγ2 was greatly reduced (Fig. 3K and L) (Student's t-test, P<0.0001). Moreover, when the level of VEGF in 22RV1 was set at '1', the level of VEGF in 22RV1-AR-KO cells was significantly reduced by 95% to 0.05±0.01 (Fig. 3M and N) (Student's t-test, P<0.0001). The effect of AR-KO on FABP5 expression was subsequently measured by western blot analysis. While a moderate level of FABP5 expression was detected in 22RV1 cells, expression of FABP5 in 22RV1-AR-KO cells was undetectable (Fig. 3O).
Effect of FABP5-KO on malignant characteristics of DU145 and on FABP5-associated proteins
The effects of FABP5-KO on malignant characteristics of highly malignant DU145 cells and on proteins of the FABP5-associated pathway were then assessed (Fig. 4). The morphology of the cells was changed after knocking down AR, and the DU145 cells appeared to be more malignant and more aggressive-looking compared with DU145-AR-KO cells (Fig. 4A). After performing the cell proliferation experiments, it was noted that there was a substantial reduction in the number of growing DU145-FABP5-KO cells from day 2 (6,210±102 cells vs. 9,885±431 control cells, P<0.02), and this trend continued until day 6, resulting in a 61% reduction in the cell number of growing DU145-FABP5-KO cells compared with control DU145 cells (Fig. 4B) (Student's t-test, P<0.0001). When tested for their invasive capabilities (Fig. 4C and D), the percentage of invasive cells was reduced by almost 65%, from 510±10 cells for the DU145 cell line to only 181±7 invading DU145-FABP5-KO cells (Student's t-test, P<0.0002). Regarding AIG (Fig. 4E and F), the average number of colonies per plate for the DU145 cell line was 113±8, whereas this total was reduced to only 14±4 for DU145-FABP-KO cells (Student's t-test, P<0.0001). In terms of cell motility (Fig. 4G), a significant change between DU145 and DU145-FABP5-KO cells was not observed after 6 h of incubation. However, after 12 h, the difference became significant: 90% of the wound gap was closed in the DU145 cells, whereas only 76% of the gap was closed in the DU145-FABP5-KO cells, and moreover, this disparity was widened further after 24 h of incubation: The wound gap in DU145 cells was closed by 96%, compared with 80% closure in the FABP5-KO DU145 cells (Fig. 4H) (Student's t-test, P<0.0002). Levels of PPARγ1 and PPARγ2 proteins were subsequently assessed by western blotting (Fig. 4I). Both the PPARγ1 and PPARγ2 proteins were detected in DU145, although their levels were undetectable in DU145-FABP5-KO cells (Fig. 4J) (Student's t-test, P<0.0001). When the levels of pPPARγ1 and pPPARγ2 proteins were assessed by western blotting (Fig. 4K), the relative levels of pPPARγ1 and pPPARγ2 in DU145-FABP5-KO cells were significantly reduced to 0.15±0.02 and 0 (complete suppression), respectively (Fig. 4L) (Student's t-test, P<0.0001 in both cases). Upon detecting the expression levels of VEGF by western blotting (Fig. 4M), its relative level in DU145-FABP5-KO cells was found to be significantly reduced by 90%, to 0.1±0.05 (Fig. 4N) (Student's t-test, P<0.0001). By contrast, when AR was probed (Fig. 4O), its expression was undetectable in either of the cell lines.
 |
Figure 4
Effect of FABP5-KO on the malignant characteristics of DU145 and on protein levels of the downstream proteins of the FABP5 pathway. (A) Microscopical appearances revealed morphological difference between DU145 and DU145-FABP5-KO cells. (B) Effect of FABP5-KO on the proliferation of DU145 cells. (C) Effect of FABP5-KO on DU145 cell invasion was assessed by an invasion assay, and (D) the average number of invasive cells from DU145 and DU145-FABP5-KO cells were recorded. (E) Anchorage-independent growth of DU145 and DU145-FABP5-KO cells, and (F) their average colony numbers formed in soft agar. (G) Effect of FABP5-KO on migration was assessed at different times in a gap closure assay. (H) The quantitative assessment of the average size of wound space gap at different times. (I) Western blot analysis of PPARγ1 and PPARγ2 proteins. (J) Relative levels of PPARγ1 and PPARγ2 in DU145 and DU145-FABP5-KO cells. (K) Western blots were performed for pPPARγ1 and pPPARγ2 in DU145 and DU145-FABP5-KO cells. (L) Relative levels of pPPARγ1 and pPPARγ2. Levels of pPPARγ1 and pPPARγ2 in DU145 cells were each set at '1', and the levels in DU145-FABP5-KO cells were obtained by comparing with those in DU145. (M) Western blot analysis of VEGF protein in DU145 and DU145-FABP5-KO cells. (N) Relative levels of VEGF in DU145 and DU145-FABP5-KO cells; the level of VEGF in DU145 cells was set at '1', and the level in DU145-FABP5-KO cells was obtained by comparing with that in DU145. (O) Western blot analysis of ARFL and ARV7 proteins in DU145 and DU145-FABP5-KO cells. Since neither of the proteins were detectable in either cell line, no quantification was possible. The relative protein levels were reproduced independently three times, and the differences were assessed by Student's t-test. ***P<0.0001 and ****P<0.00001. KO, knockout; FABP5, fatty acid-binding protein 5; AR, androgen receptor; ARFL, full-length AR; ARV7, AR splicing variant 7; PPARγ, peroxisome proliferator-activated receptor-γ; pPPARγ, phosphorylated PPARγ; VEGF, vascular endothelium growth factor; ns, not statistically significant.
|
Effect of FABP5-KO on malignant characteristics of PC3M cells and on FABP5-associated proteins
The effect of FABP5-KO on both the malignant characteristics of the highly malignant PC3M cell line and on proteins in the FABP5-associated pathway were assessed (Fig. 5). The morphology of the cells was found to change: PC3M-FABP5-KO cells had a markedly lower level of malignancy, and a less aggressive-looking appearance, compared with PC3M cells (Fig. 5A). After investigating the cell proliferation rates (Fig. 5B), the rate of PC3M-FABP5-KO cell proliferation was 26% lower compared with that of PC3M cells at day 3 (Student's t-test, P<0.0001). This difference was increased by day 4, and the trend continued, with a 54% reduction observed on day 6 compared with that of the control cells. Therefore, the effect of FABP5-KO on the PC3M cells led to a significant suppression of the cell proliferation rate by 46% (Student's t-test, P<0.0001). When the cell invasion rates were investigated (Fig. 5C), the number of invasive cells was reduced by almost 81%, from 267±21 for PC3M cells to only 53±6 for PC3M-FABP5-KO cells (Fig. 5D) (Student's P-test, P<0.0001). In terms of the AIG (Fig. 5E), the average number of colonies generated per plate for the PC3M cells (61±3) was reduced significantly by 97%, to only 2.0±0.6 for PC3M-FABP5-KO cells (Fig. 5F) (Student's t-test, P<0.0001). Regarding cell motility (Fig. 5G), significant changes between the PC3M and the PC3M-FABP5-KO cells were not detected after 6 h incubation, although after 12 h, a striking difference was observed between the two groups: 90% of the wound gap was closed in PC3M, whereas only 68% was closed in PC3M-FABP5-KO cells. By 24 h, 98% of the wound gap was closed in the PC3M cells, but only 80% was closed in PC3M-FABP5-KO cells (Fig. 5H) (Student's t-test, P<0.0002). The protein levels of PPARγ1 and PPARγ2 were then assessed by western blot analysis (Fig. 5I). Both proteins were detected in PC3M cells, whereas in the PC3M-FABP5-KO cells, only a faint PPARγ1 band was observed, and no PPARγ2 band at all was identified (Fig. 5J). When PPARγ1 and PPARγ2 in the PC3M cells were set at '1', the relative levels of PPARγ1 and PPARγ2 in the PC3M-FABP5-KO cells were found to be significantly reduced to 0.022±0.003 and 0, respectively (Fig. 5K) (Student's t-test, P<0.0001). After western blotting had been employed to detect the levels of the proteins, pPPARγ1 and pPPARγ2 were found to have been expressed at much higher levels in PC3M when compared with those in PC3M-FABP5-KO (Fig. 5K). When the protein levels in the PC3M cells were relativized to a setting of '1', the relative levels of pPPARγ1 and pPPARγ2 in the PC3M-FABP5-KO cells were found to be significantly different, at 0.45±0.05 and 0.57±0.04, respectively (Fig. 5L) (Student's t-test, P<0.001 and P<0.005, respectively). For VEGF expression, a strong band was detected in PC3M and a much smaller band was observed in PC3M-FABP5-KO cells (Fig. 5M). When the VEGF levels were compared, the PC3M-FABP5-KO cells exhibited a 58% reduction in the level of VEGF compared with the PC3M cells (Fig. 5N) (Student's t-test, P<0.001). Finally, western blot analysis revealed that the protein expression of AR was not detectable in either the PC3M or the PC3M-FABP5-KO cells (Fig. 5O), and therefore FABP5-KO could not be said to have affected the AR level in PC3M cells.
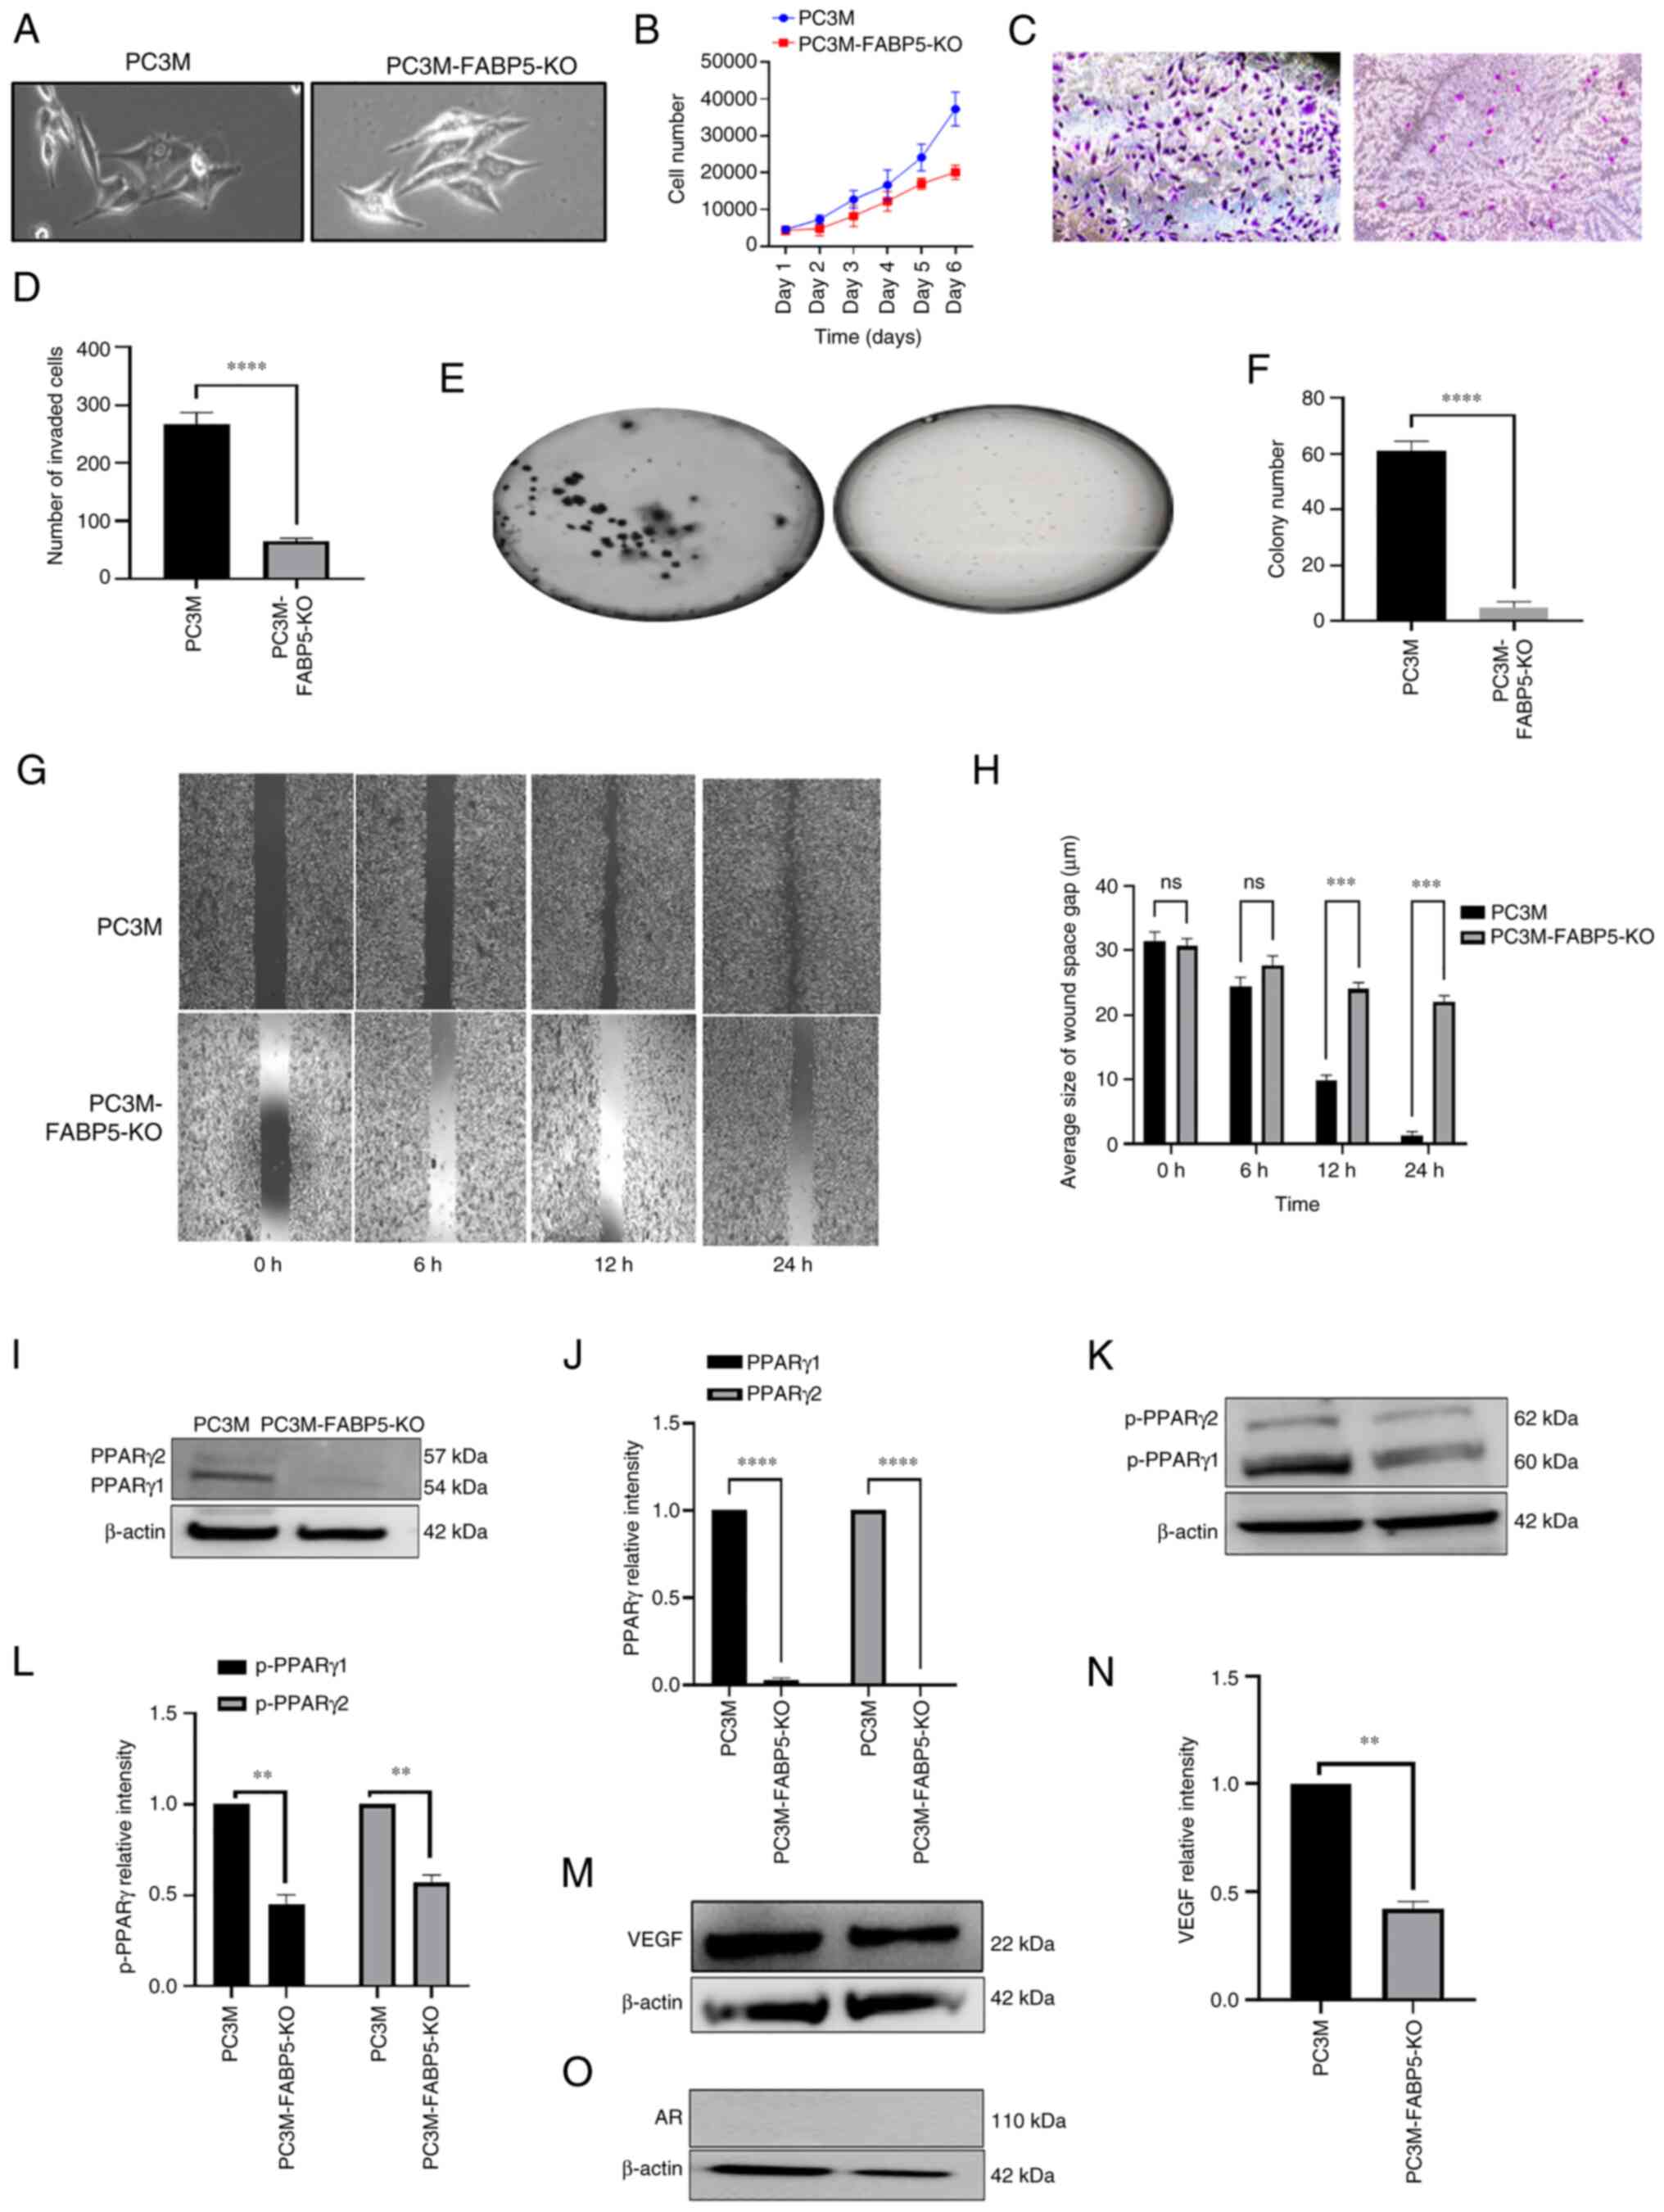 |
Figure 5
Effect of FABP5-KO on malignant characteristics of PC3M and on levels of the downstream proteins of the FABP5 signalling pathway. (A) Microscopical images of PC3M and PC3M-FABP5-KO cells. (B) Proliferation rates of PC3M and PC3M-FABP5-KO cells over the course of the 6-day experimental period. (C) Images of invasive cells from PC3M and PC3M-FABP5-KO at the end of the 6-day experimental period. (D) The average numbers of invasive cells from PC3M and PC3M-FABP5-KO cells. (E) Images of colonies in soft agar formed by PC3M and PC3M-FABP5-KO cells. (F) Average numbers of colonies in soft agar formed by PC3M and PC3M-FABP5-KO cells. (G) Images of wounds in PC3M and PC3M-FABP5-KO cells at the different times. (H) Quantitative assessment of the average size of wound space gap (μm) in PC3M and PC3M-FABP5-KO cells. (I) Western blot analysis of PPARγ1 and PPARγ2 in PC3M and PC3M-FABP5-KO cells. (J) Relative levels of PPARγ1 and PPARγ2. Levels of PPARγ1 and PPARγ2 in PC3M were each set at '1', and the levels in PC3M-FABP5-KO cells were obtained by comparing with those in PC3M. (K) Western blots of pPPARγ1 and pPPARγ2 in PC3M and PC3M-FABP5-KO cells. (L) Relative levels of pPPARγ1 and pPPARγ2. Levels of pPPARγ1 and pPPARγ2 in PC3M cells were each set at '1', and the levels in PC3M-FABP5-KO cells were obtained by comparing with those in PC3M. (M) Western blot analysis of VEGF in PC3M and PC3M-FABP5-KO cells was performed. (N) The relative level of VEGF. The level of VEGF in PC3M cells was set at '1', and the level of VEGF in the PC3M-FABP5-KO cells was obtained by comparing with that in the PC3M cells. (O) Western blot analysis of ARFL and ARV7 in the PC3M and PC3M-FABP5-KO cells. Since only ARFL was present, and no ARV7 was detected, no quantification of the data was possible. The relative protein levels were reproduced independently three times, and the differences were assessed by Student's t-test. **P<0.001, ***P<0.0001 and ****P<0.00001. KO, knockout; FABP5, fatty acid-binding protein 5; AR, androgen receptor; ARFL, full-length AR; ARV7, AR splicing variant 7; PPARγ, peroxisome proliferator-activated receptor-γ; pPPARγ, phosphorylated PPARγ; VEGF, vascular endothelium growth factor; ns, not statistically significant.
|
Identification of DEGs comparing between the parental cells and their FABP5- or AR-KO derivatives, and the relevant signaling pathways
DEGs between the control cells and their FABP5- or AR-KO derivatives and relevant pathways are shown in Fig. 6. Based on an analysis of microarray heatmaps, the top 40 (top 20 up- and 20 downregulated) most significant DEGs comparing between the 22RV1 and 22RV1-FABP5-KO cells, between the 22RV1 and 22RV-AR-KO cells, and between the DU145 and DU145-FABP5-KO cells, are demonstrated in Fig. 6A, C and E, respectively. Their IDs, names, levels of differences (log2 fold changes), and the significance levels (P-values) of the changes are shown in Tables SIII-SV. Enrichment bar-chart analysis revealed numerous pathways associated with these DEGs caused by the FABP5- and AR-KOs, as shown in Fig. 6B, D and F and in Tables SVI-SVIII These pathways are involved in cellular response to fatty acids, cholesterol biosynthesis, steroid hormone synthesis, and hormone responses. The DEGs that were identified comparing between the 22RV1 and 22RV1-FABP5-KO cells, caused by FABP5-KO, were associated with processes such as cellular responses to fatty acids, prostaglandin D stimulus, and progesterone and corticosteroid metabolism. The majority of them were involved in the fatty acid response pathway. Therefore, as revealed in Fig. 6B, both the steroid metabolic processes and hormone-responsive pathways could be blocked by FABP5-KO in the 22RV1 cells. The DEGs comparing between 22RV1 and 22RV1-AR-KO cells, as demonstrated in Fig. 6D, were associated with cholesterol biosynthesis, and sterol hormone synthesis and metabolism. Finally, the DEGs comparing between DU145 and DU145-FABP5-KO cells (Fig. 6F) were associated with such processes as positive regulation of lipid transport and localization, positive regulation of fatty acid transport and cholesterol efflux, as well as the response to progesterone. The majority of these DEGs are involved in lipid and fatty acid transport and metabolic pathways, and also in the regulation of cholesterol hormone responses.
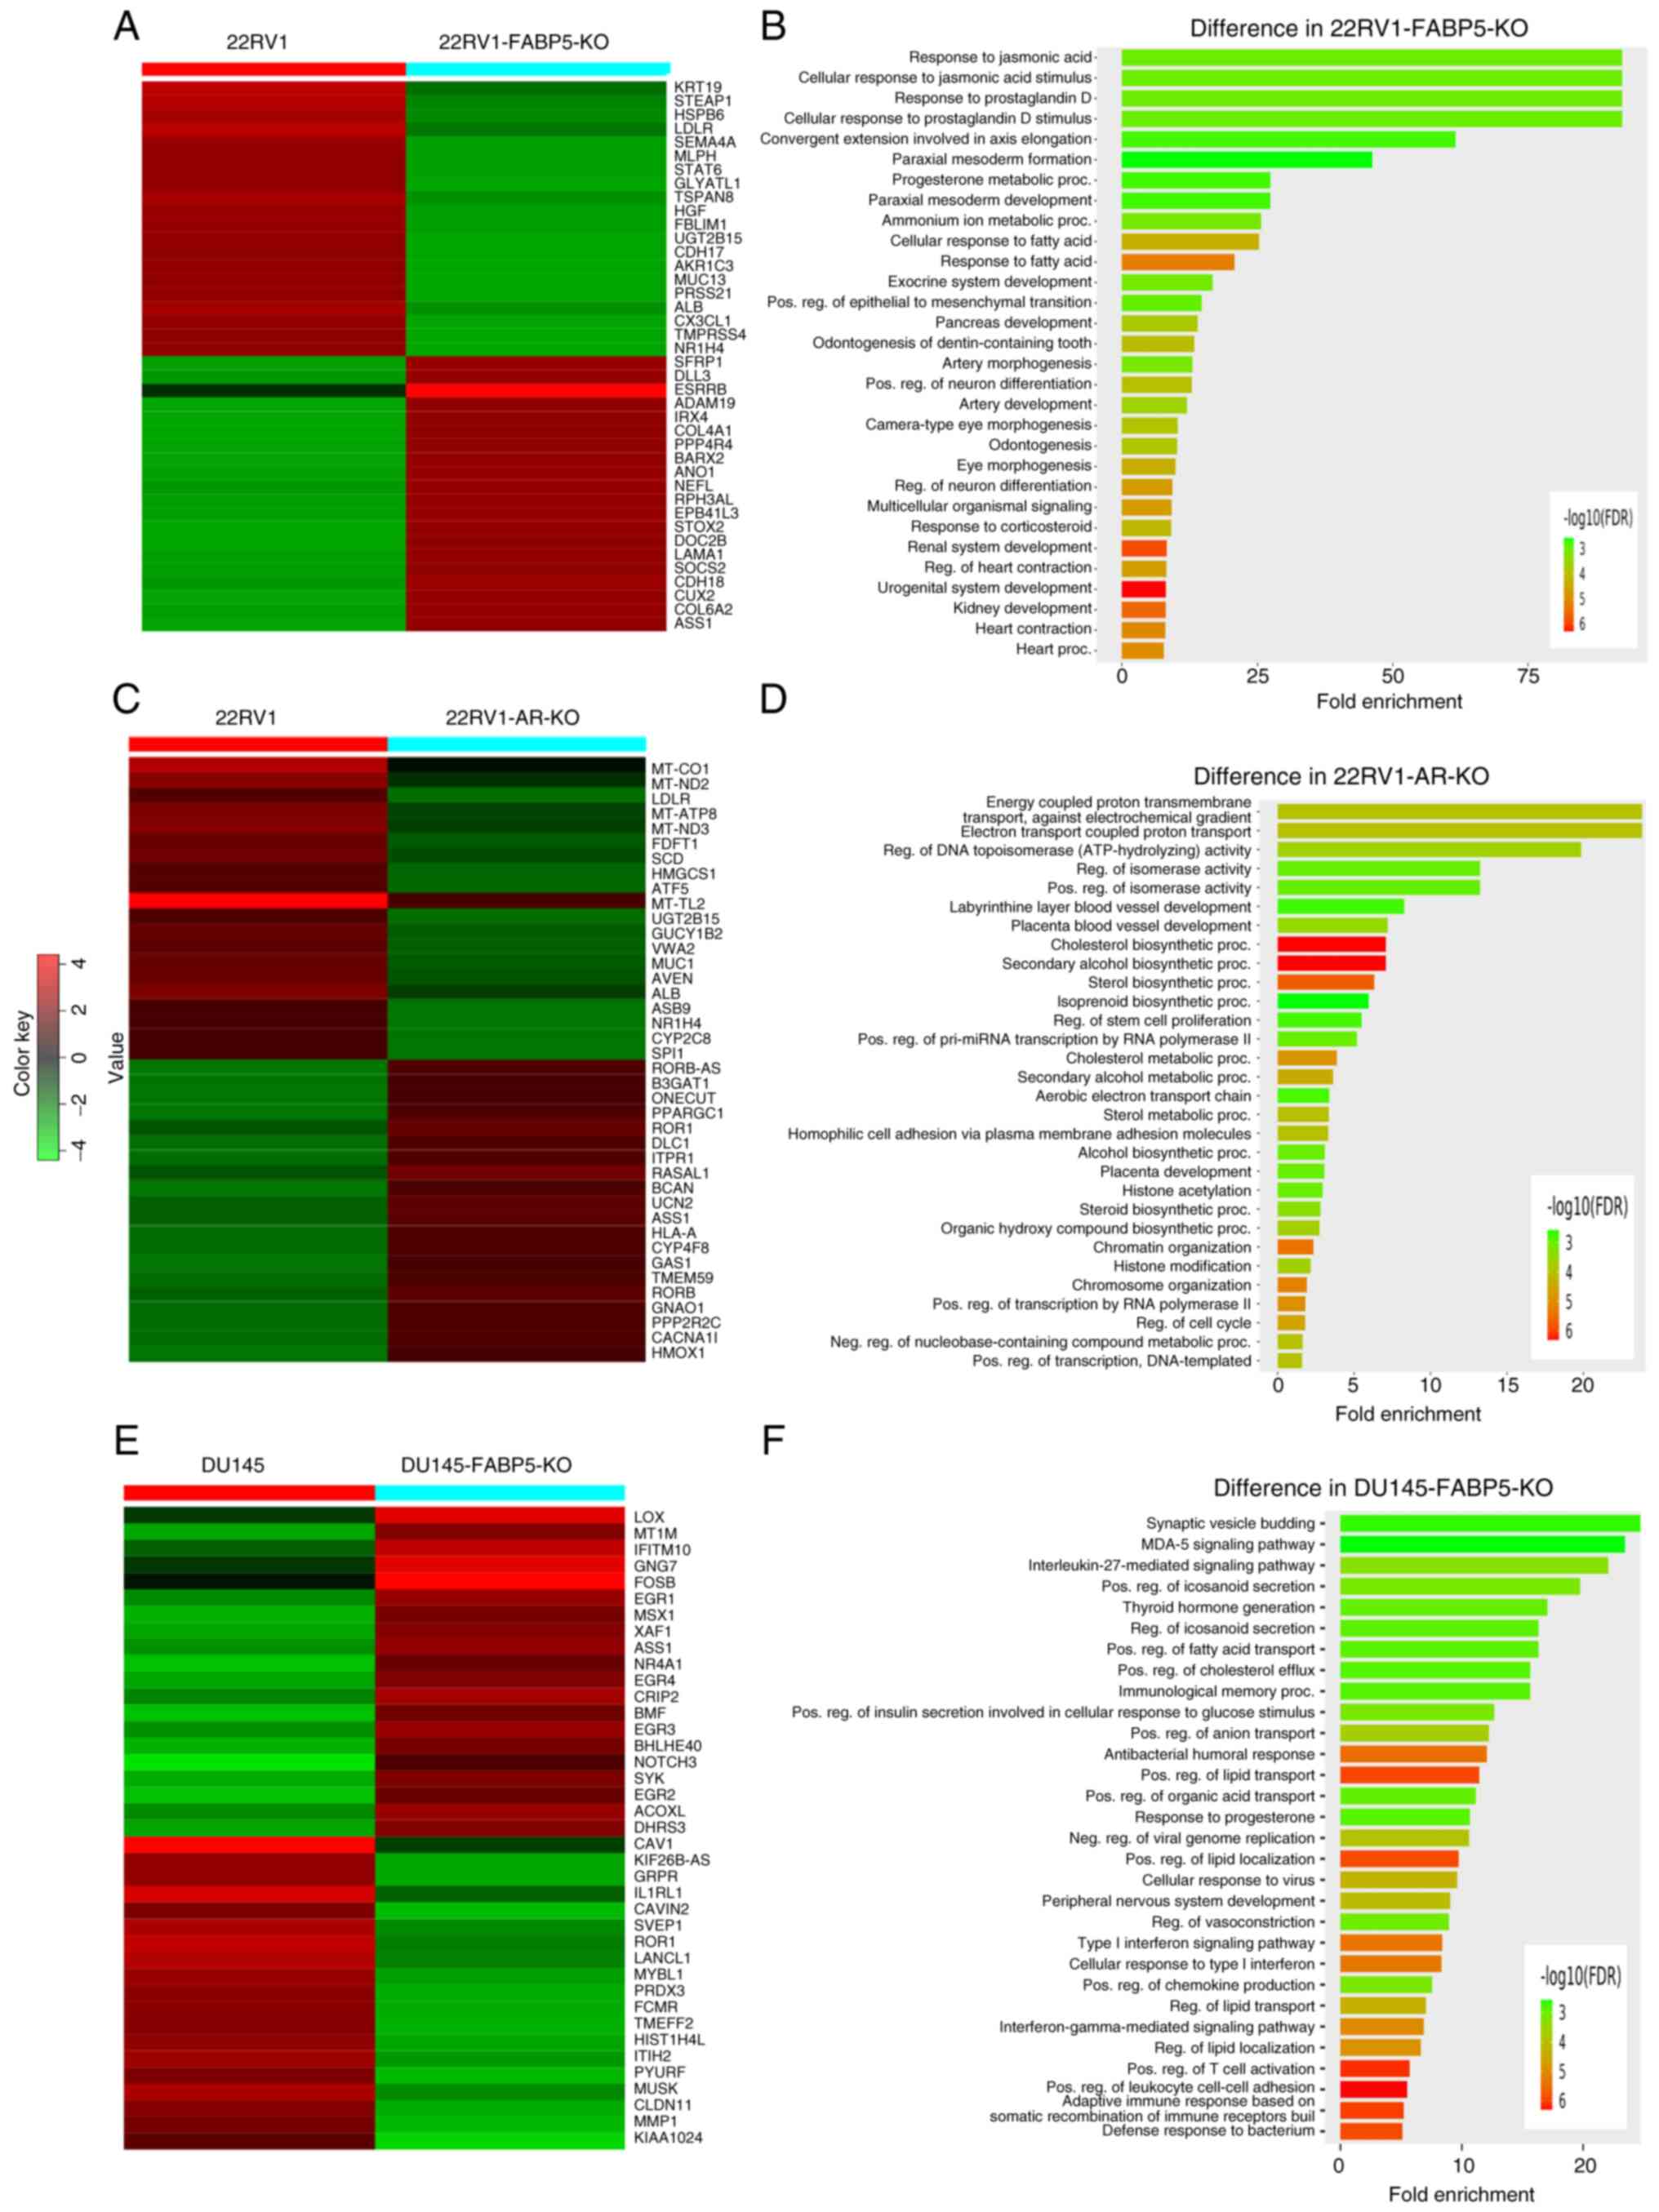 |
Figure 6
Identification of DEGs between the parental cells and their FABP5- or AR-KO derivatives and the relevant pathways. (A) Top up (red)- or down (green)-regulated 40 DEGs identified from analysis of the microarray heatmaps of 22RV1 and 22RV1-FABP5-KO cells. Red color represents 'up'. (B) Top 30 pathways associated with DEGs with the 22RV1-FABP5-KO cells were revealed by the enrichment bar chart method. (C) Top up (red)- or down (green)-regulated 40 DEGs from analysis of microarray heatmaps of 22RV1 and 22RV1-AR-KO cells. (D) The top 30 pathways associated with the DEGs in 22RV1-AR-KO cells were identified by the enrichment bar chart method. (E) Top up (red)- or down (green)-regulated 40 DEGs identified by analysis of microarray heatmaps of the DU145 and DU145-FABP5-KO cells. (F) Enrichment bar chart, revealing the top 30 pathways associated with DEGs of DU145-FABP5-KO cells. DEGs, differentially expressed genes; KO, knockout; FABP5, fatty acid-binding protein 5; AR, androgen receptor.
|
Identification of the six most pronounced DEGs comparing between 22RV1 cells and their FABP5- or AR-KO derivatives, and between DU145 cells and their DU145-FABP5-KO derivatives
The top 6 DEGs identified via RNA profile comparisons, with verification of their protein expression levels according to western blot analysis, are shown in Fig. 7. The top 6 DEGs obtained by either FABP5- or AR-KO in 22RV1 cells were revealed to be CRIP2, ERG3, FOSB, GRPR, CAV1 and NR1H4, with the first three being upregulated, and the latter three being downregulated, in 22RV1-KO cells (Fig. 7A). The identical top DEGs were obtained by FABP5-KO in DU145, with the exception of NR1H4, which was expressed neither in DU145 nor in DU145-FABP5-KO cells (Fig. 7B, G and H). To confirm the differences in the six most pronounced DEGs, western blots were performed. As demonstrated in Fig. 7C, the ERG3 and FOSB proteins were hardly detectable, whereas CRIP2 was not detectable in the parental 22RV1 cells, and all three proteins were found to be highly expressed in 22RV1-FABP5-KO cells (Fig. 7D). By contrast, the levels of the GRPR, CAV1 and NR1H4 proteins were either greatly reduced or completely abrogated in 22RV1-FABP5-KO cells (Fig. 7C); specifically, the relative levels of the GRPR and CAV1 proteins were decreased significantly by 96 and 80%, respectively (Student's t-test, P<0.0001). Those for NR1H4 could not be computed (Fig. 7D). Regarding the 22RV1 and 22RV1-AR-KO cells, the expression levels of ERG3 and FOSB were detectable, although CRIP2 was not detected in 22RV1 cells. However, in the 22RV1-AR-KO derivative cells, all three proteins were highly expressed (Fig. 7E and F). By contrast, the protein levels of GRPR, CAV1 and NR1H4 were either greatly reduced, or completely abrogated, in 22RV1-AR-KO cells (Fig. 7E), and the relative levels of GRPR and CAV1 were decreased by 98 and 85%, respectively, in comparison with those in the control cells (Student's t-test, P<0.0001). Similar to the change produced by FABP5-KO, the expression of NR1H4 was not detectable in 22RV1-AR-KO cells (Fig. 7E). In highly malignant DU145 cells, the CRIP2, ERG3 and FOSB proteins were detectable, whereas all three proteins were found to be highly expressed in DU145-FABP5-KO cells (Fig. 7F and G). Furthermore, the relative levels of CRIP2, ERG3 and FOSB in the DU145-FABP5-KO cells were increased significantly when compared with the levels in the control cells (Fig. 7F) (Student's t-test, P<0.0001). The GRPR and CAV1 proteins were detectable in DU145 cells, although their levels were significantly reduced in DU145-FABP5-KO cells by 96% (Student's t-test, P<0.0001) and 85% (Student's t-test, P<0.0001), respectively (Fig. 7H). By contrast, NR1H4 was only detected in the androgen-responsive cell line 22RV1, and was not detectable in either the AR-negative CRPC cells or in the DU145 or DU145-FABP5-KO cells (Fig. 7C, E and G).
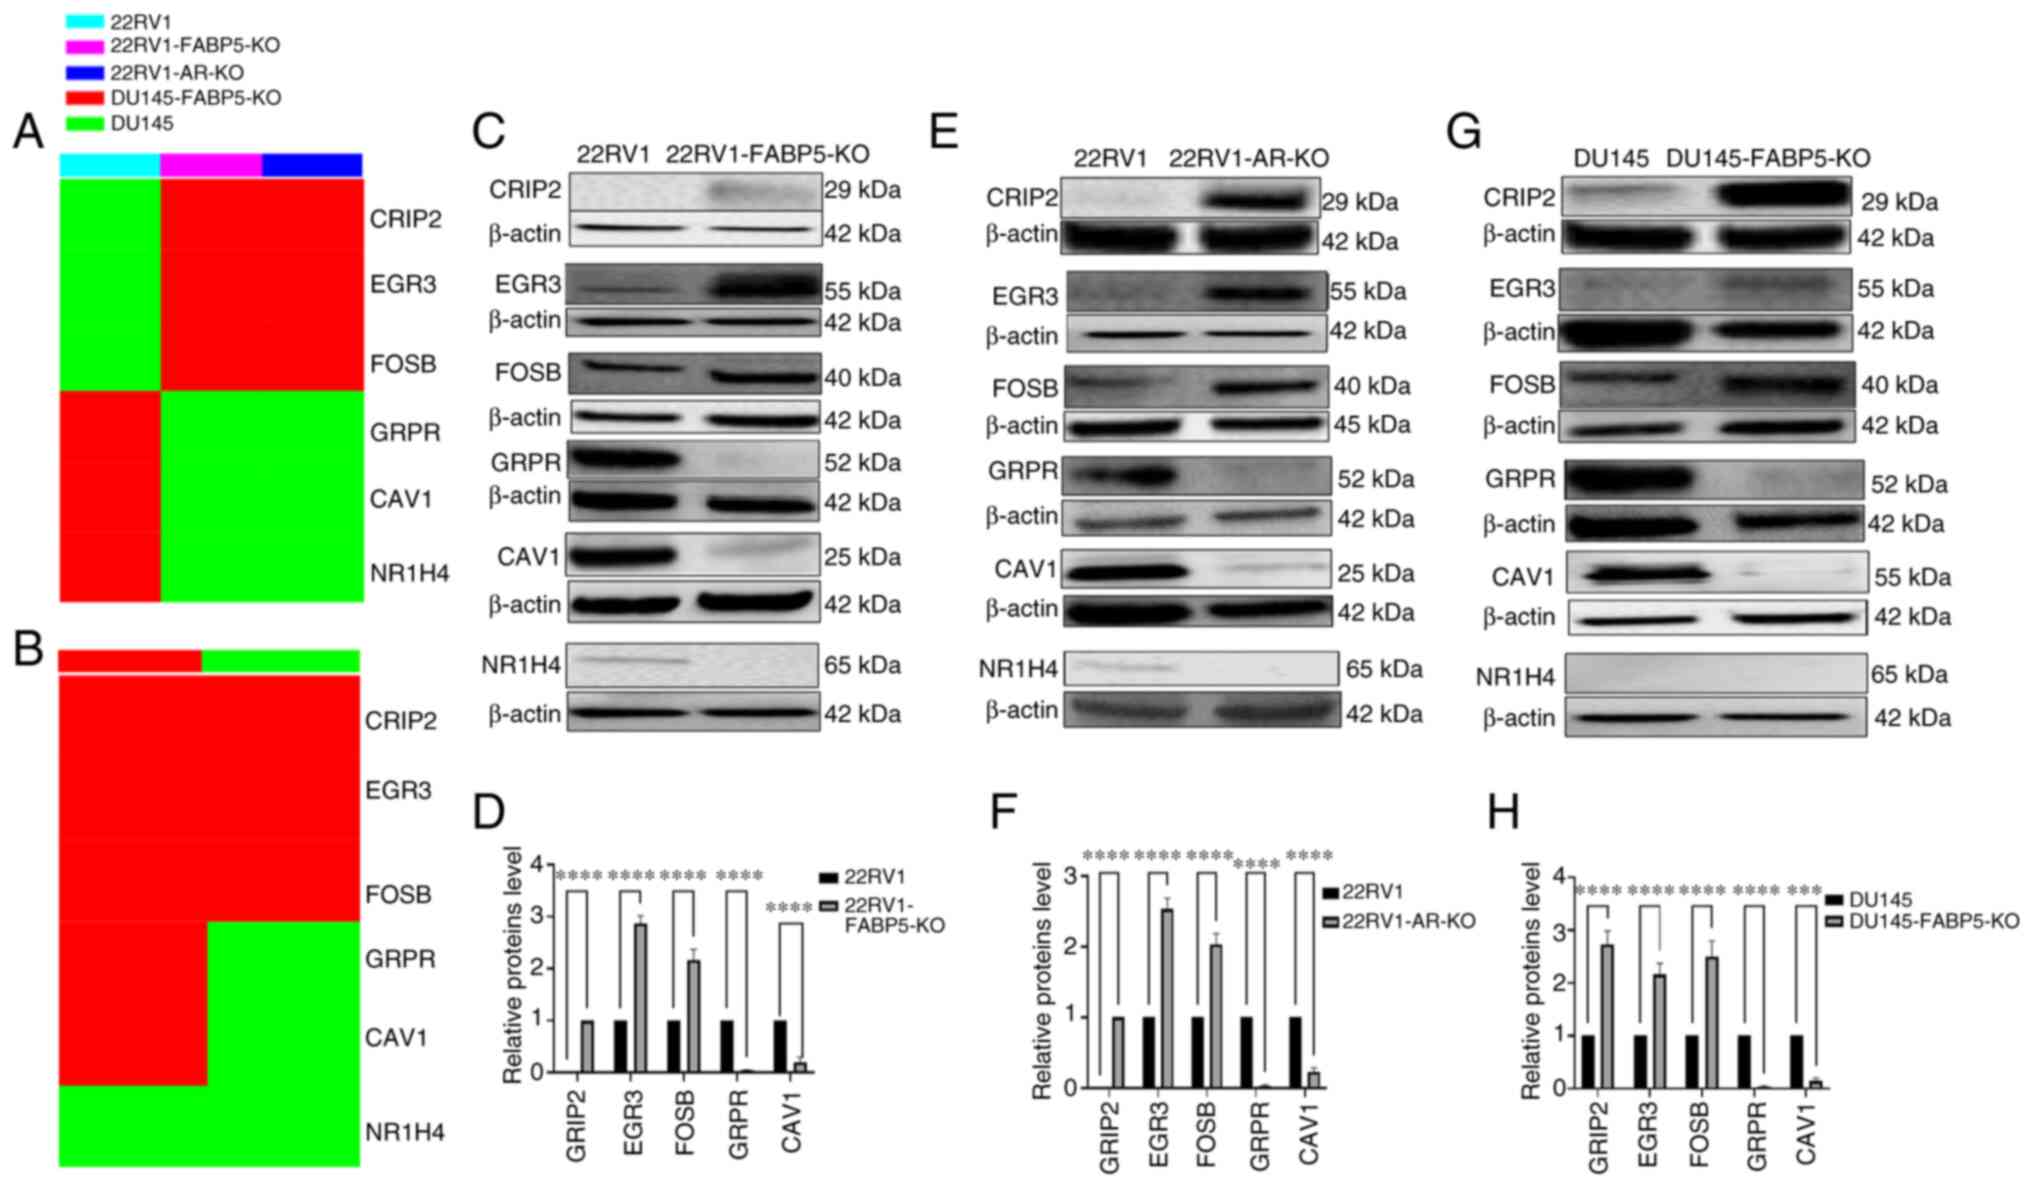 |
Figure 7
Identification and verification of the six most prominent DEGs between 22RV1 cells and their FABP5- or AR-KO derivatives, and between DU145 and DU145-FABP5-KO cells. (A) The top 6 DEGs between 22RV1 and 22RV1-FABP5-KO cells, or between 22RV1 and 22RV1-AR-KO cells (cells are represented by different colors), as identified by heatmap analysis. (B) The top 6 DEGs between DU145 and DU145-FABP5-KO cells identified by heatmap analysis. (C) Western blot verification of the top 3 up- and down-regulated DEGs between 22RV1 and 22RV1-FABP5-KO cells. (D) Relative levels of the top 3 up- and down-regulated DEGs between 22RV1 and 22RV1-FABP5-KO cells. (E) Western blot verification of the top 3 up- and down-regulated DEGs between 22RV1 and 22RV1-AR-KO cells. (F) Relative levels of the top 3 up- and down-regulated DEGs between 22RV1 and 22RV1-AR-KO cells. (G) Western blot verification of the top 3 up- and down-regulated DEGs between DU145 and DU145-FABP5-KO cells. (H) Relative levels of the top 3 up- and down-regulated DEGs between DU145 and DU145-FABP5-KO cells. The relative protein levels were reproduced independently three times, and the differences were assessed by Student's t-test. ***P<0.0001 and ****P<0.00001. DEGs, differentially expressed genes; KO, knockout; FABP5, fatty acid-binding protein 5; AR, androgen receptor; ns, not statistically significant.
|
Discussion
FABP5, an important fatty acid-transporting protein, has been implicated as a stimulator of cell proliferation and metastasis in prostate cancer by transporting fatty acids into the cells, and delivering them to their nuclear receptor, PPARγ (21,22). Previous studies have suggested that FABP5 may also have a role in promoting the transition to CRPC (19,21), although direct evidence of this role has hitherto been lacking. In the present study, prostatic tumour cell lines of varying malignant potential, ranging from benign PNT2 cells, through weakly malignant, AR-positive 22RV1 cells, to highly malignant, AR-negative DU145/PC3M cells, were used to investigate this potential malignant pathway. In the present study, proportionate increases in the relative FABP5 protein level were identified, ranging from 0 to nearly 3-fold increases over that found in 22RV1 cells, an increase in the protein levels of its target (21), pPPARγ1/γ2, from 0 to >2-fold compared with that in 22RV1 cells (despite a fall in the level of unphosphorylated PPARγ1), and an almost 2-fold increase in one particular end-product of the FABP5 signalling pathway, namely VEGF (21) (Fig. 1A). The expression of ARFL and ARV7 was only observed in the weakly malignant 22RV1 cells, and the expression level of both was lost in the highly malignant cell lines, despite the 1.5-fold increase in VEGF observed in 22RV1 cells being maintained, or even enhanced to nearly 2-fold, in the DU145/PC3M cells (Fig. 1A). These results gave credence to the notion that FABP5 can replace AR in maintaining, or even enhancing, malignant progression (19).
Simple correlations do not, however, prove causal relationships. Therefore, a common strategy for proof of causality has been to eliminate the biological activity of a gene using either RNA interference (RNAi) or CRISPR/Cas9 technology, and to assess what effect this elimination produces on the malignant progression of the cancer cells under investigation (31,32). Although RNAi is well established as a procedure and is frequently used, its inability to produce complete suppression is a major drawback, whereas CRISP/Cas9 is able to effectively delete a gene and generate a permanent and stable suppression of the corresponding protein (31). In the present study, CRISP/Cas9 genome editing technology was utilized (33,34) to produce a single cell clone, respectively, from AR-positive 22RV1 cells with FAB5 knocked out (C5), from 22RV1 cells with AR knocked out (C4), and from highly malignant DU145 and PC3M cells with FABP5 knocked out (C2 and C6, respectively); all the selected clones had frameshift mutations, leading to the production of no detectable target protein (Fig. 1B). To investigate the abilities of FABP5 and AR to directly regulate properties characteristic of the malignant state, four commonly used in vitro assays were employed: Cell proliferation and invasion assays, AIG assay and motility of the KO prostatic tumour cell lines (35-38). Since a lack of the target proteins FABP5 or AR produced only a moderate decrease in cell numbers (between 36-61% in 6 days), which was substantially less of a change compared with the 3-50-fold reduction in the cell invasion rate over 24 h and the 8-30-fold decrease in AIG over a period of 3 weeks (Figs. 2-4 and 5A-F), these results were sufficient to eliminate the possibility that the reduction in proliferation rates made any substantial contribution towards the decrease in invasion rates or AIG reported here. The fact that knocking out FABP5 in all cell lines tested produced decreases in malignant morphology, as well as reductions in the rates of cell proliferation, invasion, AIG and wound closure compared with the parental cells, demonstrated that FABP5 causes a substantial degree of malignancy in the original parental cells; however, the individual malignant properties were found not to be changed to the same extent in the different cell lines wherein FABP5 was knocked out. The greatest reduction occurred for the cell invasion rate in 22RV1-FABP5-KO cells (50-fold; Fig. 2D), which suggested that increases in invasion occur primarily in driving the AR-positive prostatic cancer cells towards a more malignant state. Moreover, the decreases in malignant properties in the 22RV1-FABP5-KO and in 22RV1-AR-KO cells were found to be similar: 38 and 36% in terms of cell proliferation, 50- and 12-fold in cell invasion, 15- and 24-fold in AIG, and 67 and 80% in wound closure, respectively (Figs. 2 and 3B-H). Taken together, these results suggested that FABP5 is able to substitute for AR in promoting biological properties associated with the malignant state in AR-positive prostatic cancer cells, and that FABP5 alone can perform this role in AR-negative cancer cells (Figs. 4 and 5A-H). FABP5 is a member of fatty acid-transporting protein family. Although a previous study reported that most other FABPs were not directly involved in prostate cancer, with the notable exceptions of FABP9 (39), it is still interesting to know whether possible changes in other FABPs and CD36 have taken place. Thus, the expression levels of other FABP proteins and CD36 in our KO cell lines is the subject of a future manuscript in this area.
With respect to any direct relationship between FABP5 and AR, previous studies have revealed that overexpression of FABP5 in highly malignant prostatic cancer cells may be caused by the hypomethylation of CpG islands in its promoter region, and that this hypomethylation is caused, in part, by the AR-inducible transcription factor, SP1 (19). In the present study, FABP5-KO resulted in a complete suppression of ARV7, but not of ARFL (Fig. 2O). ARV7 is a variant of AR that lacks the ligand-binding domain, hence allowing the downstream malignant progression signals of the cancer cells to continue, even without androgen binding and stimulation (40). Therefore, the emergence of ARV7 in CRPC provides the main reason underlying the development of resistance to anti-androgen therapy (41). The present findings, combined with those reported previously (19), collectively suggest that FABP5 and ARV7 are prerequisites for each other's expression in the AR-positive 22RV1 cells. Both proteins coexist in AR-positive cells, and appear to promote malignant progression in a coordinated manner. However, when cells have progressed to the highly malignant AR-negative CRPC condition, as represented by the DU145 and PC3M cell lines in the present study, both ARV7 and ARFL are lost, and are apparently replaced in functional terms by FABP5 (Fig. 1Ab and h). More studies are needed, however, to understand the exact association between FABP5 and ARV7 in AR-positive cells, and how their interaction contributes to the malignant progression of CRPC cells. Moreover, the exact relationships between PPARγ1, PPARγ2, AR and FABP5 are also unknown, but the effect of knocking out PPARγ1 or PPARγ2, the subject of a future work, may go some way to answer these questions.
Previously, it has been reported the authors that FABP5 stimulates a signalling pathway for the production of VEGF via phosphorylation of PPARγ (21,42). The results obtained in the present study were consistent with this hypothesis. Therefore, although FABP5-KO increased PPARγ1 by 75% in the 22RV1 cells, it reduced PPARγ2 by 99%, thereby reducing the phosphorylation-activated pPPARγ1 and pPPARγ2 by 64 and 88%, respectively (Fig. 2I-L), and PPARγ1 and PPARγ2 were suppressed to a similar extent in the highly malignant DU145 and PC3M cells (Fig. 4 and 5I-L), resulting in similar levels of suppression of VEGF in 22RV1 (90%), DU145 (90%) and PC3M (58%) cells (Figs. 2, 4, 5M and N). These coordinated decreases following FABP5-KO in the VEGF pathway and in the properties of malignant progression, however, in themselves could not have been attributed to any causal association without further knocking down the downstream proteins in the pathway, and observing their particular effects on the resultant malignant properties. Moreover, AR-KO in the 22RV1 cells produced similar decreases to those observed with FABP5-KO in terms of PPARγ1, PPARγ2, pPPARγ1, pPPARγ2 and VEGF (Figs. 2 and 3I-N), results which once again were consistent with the notion that FABP5 may substitute for AR in prostatic cancer cells. Taken together, these results suggested that targeting FABP5 or the FABP5-PPARγ-VEGF pathway, rather than suppressing the AR pathway alone, may be more effective in terms of suppressing malignant progression of the CRPC cells. Although FABP5 was found to replace AR during the malignant progression of prostate cancer in the current study, further study is needed to understand how FABP5 and AR may differentially regulate PPARγ and how both PPARγ isoforms work in this pathway.
In the present study, the six most pronounced DEGs were identified as CRIP2, ERG3, FOSB, GRPR, CAV1 and NR1H4, the first three of which were commonly upregulated, and the latter three were downregulated, in all three KO cell lines, with the exception of NR1H4, which was only expressed in 22RV1, and not in DU145 cells (Fig. 6A and B). Western blot analysis largely confirmed the differences in these six DEGs at the protein level (Fig. 7A and B). Therefore, CRIP2 was highly expressed in 22RV1-FABP5-KO and 22RV1-AR-KO cells, but was undetectable in the 22RV1 parental cells, and its expression level was increased by 170% in the DU145-FABP5-KO cells compared with its parental cell line. ERG3 and FOSB were upregulated by a similar extent in 22RV1-FABP5-KO cells (187 and 110, respectively), in 22RV1-AR-KO cells (150 and 100%, respectively) and in DU-145-FABP5-KO cells (116 and 150%, respectively) (Fig. 7C-H). Moreover, the levels of the downregulated proteins GRPR and CAV1 were reduced by similar levels in 22RV1-FABP5-KO cells (96 and 80%, respectively), in 22RV1-AR-KO cells (98 and 85%, respectively) and in DU145-FABP5-KO cells (96 and 85%, respectively) compared with their parental cells. NR1H4 was highly expressed in 22RV1 cells, but was not found to be detectable in DU145-FABP5 cells, or in any of the KO cell lines (Fig. 7C-H). Once again, the similar changes in DEGs identified among the three cell lines emphasize the similarity in gene/protein expression induced by FABP5 and AR in these prostatic cancer cell lines. GO-enriched pathway analysis of the three most significantly upregulated DEGs (CRIP2, ERG3 and FOSB) revealed their involvement in the regulation of cellular responses to the Type I interferon pathway, to the progesterone signalling pathway, and in development of the peripheral nervous system (Fig. 6B, D and F) (43-45). Previous studies have identified that these pathways fulfil important roles in suppressing the initiation and progression of prostate cancer (44,46,47). On the other hand, analysis of the three most significantly downregulated DEGs (GRPR, CAV1 and NR1H4) revealed their involvement in fatty acid and lipid transport-associated pathways, and in steroid and cholesterol metabolic processes (48-51); overactivation of these pathways has been implicated in development and progression of prostate and other cancer cells (52,53). Collectively, these results highlighted possible key roles of the top six DEGs in progression from the androgen-responsive, to the androgen-non-responsive, state.
In conclusion, the results of the present study have demonstrated that both FABP5- and AR-KO may significantly reduce the malignancy of prostate cancer cells, in part through their interactions in regulating the FABP5 (or AR)-PPARγ-VEGF pathway and possibly, in part, through regulation of the six most pronounced DEGs and their associated pathways. Moreover, FABP5 can control expression of the auto-stimulatory ARV7 variant of AR, and AR, in turn, can control expression of FABP5. The results also revealed that functional changes similar to those induced by AR are also caused by FABP5. Therefore, FABP5 may gradually replace AR and become the dominant protein with or without ARV7 during the malignant progression to CPRC cells. Taken together, these results have provided a theoretical basis for the design of novel FABP5-targeted therapeutic strategies in order to suppress the malignant progression of CRPC cells.
Supplementary Data
Availability of data and materials
The datasets used and/or analyzed during the current study are available from the corresponding author on reasonable request.
Authors' contributions
AAN, SAA, GH, BTA, JZ and HM performed the experimental work. YK designed and supervised the study, and prepared the manuscript. HZ, XJ and PSR discussed the results and contributed critical suggestions. AAN and PSR were also involved in manuscript writing and editing. All authors read and approved the final version of the manuscript. YK and AAN confirm the authenticity of all the raw data.
Ethics approval and consent to participate
Not applicable.
Patient consent for publication
Not applicable.
Competing interests
The authors declare that they have no competing interests.
Abbreviations:
|
FABP5
|
fatty acid-binding protein 5
|
|
CRPC
|
castration-resistant prostate cancer
|
|
AR
|
androgen receptor
|
|
ADT
|
androgen-deprivation treatment
|
|
PPARγ
|
peroxisome proliferator-activated receptor-γ
|
|
VEGF
|
vascular endothelium growth factor
|
|
KO
|
knockout
|
|
DEG
|
differentially expressed gene
|
|
pPPARγ
|
phosphorylated PPARγ
|
|
ARV7
|
AR splicing variant 7
|
Acknowledgments
AAN and SAA would like to thank the College of Science and Health Professions, King Saud Bin Abdulaziz University for Health Sciences (Jeddah, Saudi Arabia); and BTA would like to thank the Faculty of Medicine of Northern Borders University (Saudi Arabia) for their kind supports of PhD studentships.
Funding
No funding was received.
References
|
1
|
De Angelis R, Sant M, Coleman MP, Francisci S, Baili P, Pierannunzio D, Trama A, Visser O, Brenner H, Ardanaz E, et al: Cancer survival in Europe 1999-2007 by country and age: Results of EUROCARE-5-a population-based study. Lancet Oncol. 15:23–34. 2014.
|
|
2
|
Ferlay J, Parkin DM and Steliarova-Foucher E: Estimates of cancer incidence and mortality in Europe in 2008. Eur J Cancer. 46:765–781. 2010.
|
|
3
|
Huggins C, Stevens RE Jr and Hodges CV: Studies on prostatic cancer: II. the effects of castration on advanced carcinoma of the prostate gland. Arch Surg. 43:209–223. 1941.
|
|
4
|
Sharifi N, Gulley JL and Dahut WL: Androgen deprivation therapy for prostate cancer. JAMA. 294:238–244. 2005.
|
|
5
|
Huggins C and Hodges CV: Studies on prostatic cancer: I. The effect of castration, of estrogen and of androgen injection on serum phosphatases in metastatic carcinoma of the prostate. 1941. J Urol. 168:9–12. 2002.
|
|
6
|
Attar RM, Takimoto CH and Gottardis MM: Castration-resistant prostate cancer: Locking up the molecular escape routes. Clin Cancer Res. 15:3251–3255. 2009.
|
|
7
|
Furuhashi M and Hotamisligil GS: Fatty acid-binding proteins: Role in metabolic diseases and potential as drug targets. Nat Rev Drug Discov. 7:489–503. 2008.
|
|
8
|
Haunerland NH and Spener F: Fatty acid-binding proteins-insights from genetic manipulations. Prog Lipid Res. 43:328–349. 2004.
|
|
9
|
Jing C, Beesley C, Foster CS, Chen H, Rudland PS, West DC, Fujii H, Smith PH and Ke Y: Human cutaneous fatty acid-binding protein induces metastasis by up-regulating the expression of vascular endothelial growth factor gene in rat Rama 37 model cells. Cancer Res. 61:4357–4364. 2001.
|
|
10
|
Jing C, Beesley C, Foster CS, Rudland PS, Fujii H, Ono T, Chen H, Smith PH and Ke Y: Identification of the messenger RNA for human cutaneous fatty acid-binding protein as a metastasis inducer. Cancer Res. 60:2390–2398. 2000.
|
|
11
|
Adamson J, Morgan EA, Beesley C, Mei Y, Foster CS, Fujii H, Rudland PS, Smith PH and Ke Y: High-level expression of cutaneous fatty acid-binding protein in prostatic carcinomas and its effect on tumorigenicity. Oncogene. 22:2739–2749. 2003.
|
|
12
|
Morgan EA, Forootan SS, Adamson J, Foster CS, Fujii H, Igarashi M, Beesley C, Smith PH and Ke Y: Expression of cutaneous fatty acid-binding protein (C-FABP) in prostate cancer: Potential prognostic marker and target for tumourigenicity-suppression. Int J Oncol. 32:767–775. 2008.
|
|
13
|
Al-Jameel W, Gou X, Forootan SS, Al Fayi MS, Rudland PS, Forootan FS, Zhang J, Cornford PA, Hussain SA and Ke Y: Inhibitor SBFI26 suppresses the malignant progression of castration-resistant PC3-M cells by competitively binding to oncogenic FABP5. Oncotarget. 8:31041–31056. 2017.
|
|
14
|
Berger WT, Ralph BP, Kaczocha M, Sun J, Balius TE, Rizzo RC, Haj-Dahmane S, Ojima I and Deutsch DG: Targeting fatty acid binding protein (FABP) anandamide transporters-a novel strategy for development of anti-inflammatory and anti-nociceptive drugs. PLoS One. 7:e509682012.
|
|
15
|
Lehmann F, Haile S, Axen E, Medina C, Uppenberg J, Svensson S, Lundbäck T, Rondahl L and Barf T: Discovery of inhibitors of human adipocyte fatty acid-binding protein, a potential type 2 diabetes target. Bioorg Med Chem Lett. 14:4445–4448. 2004.
|
|
16
|
Kaczocha M, Rebecchi MJ, Ralph BP, Teng YH, Berger WT, Galbavy W, Elmes MW, Glaser ST, Wang L, Rizzo RC, et al: Inhibition of fatty acid binding proteins elevates brain anandamide levels and produces analgesia. PLoS One. 9:e942002014.
|
|
17
|
Thanos PK, Clavin BH, Hamilton J, O'Rourke JR, Maher T, Koumas C, Miao E, Lankop J, Elhage A, Haj-Dahmane S, et al: Examination of the addictive and behavioral properties of fatty acid-binding protein inhibitor SBFI26. Front Psychiatry. 7:542016.
|
|
18
|
Myers JS, von Lersner AK and Sang QX: Proteomic upregulation of fatty acid synthase and fatty acid binding protein 5 and identification of cancer- and race-specific pathway associations in human prostate cancer tissues. J Cancer. 7:1452–1464. 2016.
|
|
19
|
Kawaguchi K, Kinameri A, Suzuki S, Senga S, Ke Y and Fujii H: The cancer-promoting gene fatty acid-binding protein 5 (FABP5) is epigenetically regulated during human prostate carcinogenesis. Biochem J. 473:449–461. 2016.
|
|
20
|
Zhang J, He G, Jin X, Alenezi BT, Naeem AA, Abdulsamad SA and Ke Y: Molecular mechanisms on how FABP5 inhibitors promote apoptosis-induction sensitivity of prostate cancer cells. Cell Biol Int. 47:929–942. 2023.
|
|
21
|
Forootan FS, Forootan SS, Gou X, Yang J, Liu B, Chen D, Al Fayi MS, Al-Jameel W, Rudland PS, Hussain SA and Ke Y: Fatty acid activated PPARγ promotes tumorigenicity of prostate cancer cells by up regulating VEGF via PPAR responsive elements of the promoter. Oncotarget. 7:9322–9339. 2016.
|
|
22
|
Forootan FS, Forootan SS, Malki MI, Chen D, Li G, Lin K, Rudland PS, Foster CS and Ke Y: The expression of C-FABP and PPARγ and their prognostic significance in prostate cancer. Int J Oncol. 44:265–275. 2014.
|
|
23
|
Bao Z, Malki MI, Forootan SS, Adamson J, Forootan FS, Chen D, Foster CS, Rudland PS and Ke Y: A novel cutaneous fatty acid-binding protein-related signaling pathway leading to malignant progression in prostate cancer cells. Genes Cancer. 4:297–314. 2013.
|
|
24
|
Berthon P, Cussenot O, Hopwood L, Leduc A and Maitland N: Functional expression of sv40 in normal human prostatic epithelial and fibroblastic cells-differentiation pattern of nontumorigenic cell-lines. Int J Oncol. 6:333–343. 1995.
|
|
25
|
Cussenot O, Berthon P, Berger R, Mowszowicz I, Faille A, Hojman F, Teillac P, Le Duc A and Calvo F: Immortalization of human adult normal prostatic epithelial cells by liposomes containing large T-SV40 gene. J Urol. 146:881–886. 1991.
|
|
26
|
Cussenot O, Berthon P, Cochand-Priollet B, Maitland NJ and Le Duc A: Immunocytochemical comparison of cultured normal epithelial prostatic cells with prostatic tissue sections. Exp Cell Res. 214:83–92. 1994.
|
|
27
|
Sramkoski RM, Pretlow TG II, Giaconia JM, Pretlow TP, Schwartz S, Sy MS, Marengo SR, Rhim JS, Zhang D and Jacobberger JW: A new human prostate carcinoma cell line, 22Rv1. In Vitro Cell Dev Biol Anim. 35:403–409. 1999.
|
|
28
|
Stone KR, Mickey DD, Wunderli H, Mickey GH and Paulson DF: Isolation of a human prostate carcinoma cell line (DU 145). Int J Cancer. 21:274–281. 1978.
|
|
29
|
Kozlowski JM, Fidler IJ, Campbell D, Xu ZL, Kaighn ME and Hart IR: Metastatic behavior of human tumor cell lines grown in the nude mouse. Cancer Res. 44:3522–3529. 1984.
|
|
30
|
Leszczyński P, Śmiech M, Salam Teeli A, Haque E, Viger R, Ogawa H, Pierzchała M and Taniguchi H: Deletion of the Prdm3 gene causes a neuronal differentiation deficiency in P19 Cells. Int J Mol Sci. 21:71922020.
|
|
31
|
Doudna JA and Charpentier E: Genome editing. The new frontier of genome engineering with CRISPR-Cas9. Science. 346:12580962014.
|
|
32
|
Unniyampurath U, Pilankatta R and Krishnan MN: RNA interference in the age of CRISPR: Will CRISPR interfere with RNAi? Int J Mol Sci. 17:2912016.
|
|
33
|
Tyumentseva MA, Tyumentsev AI and Akimkin VG: Protocol for assessment of the efficiency of CRISPR/Cas RNP delivery to different types of target cells. PLoS One. 16:e02598122021.
|
|
34
|
Xu X, Wan T, Xin H, Li D, Pan H, Wu J and Ping Y: Delivery of CRISPR/Cas9 for therapeutic genome editing. J Gene Med. 21:e31072019.
|
|
35
|
Albini A, Iwamoto Y, Kleinman HK, Martin GR, Aaronson SA, Kozlowski JM and McEwan RN: A rapid in vitro assay for quantitating the invasive potential of tumor cells. Cancer Res. 47:3239–3245. 1987.
|
|
36
|
Fisher PR, Merkl R and Gerisch G: Quantitative analysis of cell motility and chemotaxis in Dictyostelium discoideum by using an image processing system and a novel chemotaxis chamber providing stationary chemical gradients. J Cell Biol. 108:973–984. 1989.
|
|
37
|
Graham FL and van der Eb AJ: Transformation of rat cells by DNA of human adenovirus 5. Virology. 54:536–539. 1973.
|
|
38
|
Reitman S and Frankel S: A colorimetric method for the determination of serum glutamic oxalacetic and glutamic pyruvic transaminases. Am J Clin Pathol. 28:56–63. 1957.
|
|
39
|
Al Fayi MS, Gou X, Forootan SS, Al-Jameel W, Bao Z, Rudland PR, Cornford PA, Hussain SA and Ke Y: The increased expression of fatty acid-binding protein 9 in prostate cancer and its prognostic significance. Oncotarget. 7:82783–82797. 2016.
|
|
40
|
Wadosky KM and Koochekpour S: Androgen receptor splice variants and prostate cancer: From bench to bedside. Oncotarget. 8:18550–18576. 2017.
|
|
41
|
Antonarakis ES, Nakazawa M and Luo J: Resistance to androgen-pathway drugs in prostate cancer. N Engl J Med. 371:22342014.
|
|
42
|
Al-Jameel W, Gou X, Jin X, Zhang J, Wei Q, Ai J, Li H, Al-Bayati A, Platt-Higgins A, Pettitt A, et al: Inactivated FABP5 suppresses malignant progression of prostate cancer cells by inhibiting the activation of nuclear fatty acid receptor PPARγ. Genes Cancer. 10:80–96. 2019.
|
|
43
|
Lanningham-Foster L, Green CL, Langkamp-Henken B, Davis BA, Nguyen KT, Bender BS and Cousins RJ: Overexpression of CRIP in transgenic mice alters cytokine patterns and the immune response. Am J Physiol Endocrinol Metab. 282:E1197–E1203. 2002.
|
|
44
|
Mitchell JA, Shynlova O, Langille BL and Lye SJ: Mechanical stretch and progesterone differentially regulate activator protein-1 transcription factors in primary rat myometrial smooth muscle cells. Am J Physiol Endocrinol Metab. 287:E439–E445. 2004.
|
|
45
|
Papa M, Boscia F, Canitano A, Castaldo P, Sellitti S, Annunziato L and Taglialatela M: Expression pattern of the ether-a-gogo-related (ERG) K+ channel-encoding genes ERG1, ERG2, and ERG3 in the adult rat central nervous system. J Comp Neurol. 466:119–135. 2003.
|
|
46
|
Howe BM, Bruno SB, Higgs KA, Stigers RL and Cunningham JT: FosB expression in the central nervous system following isotonic volume expansion in unanesthetized rats. Exp Neurol. 187:190–198. 2004.
|
|
47
|
Shin SH, Kim I, Lee JE, Lee M and Park JW: Loss of EGR3 is an independent risk factor for metastatic progression in prostate cancer. Oncogene. 39:5839–5854. 2020.
|
|
48
|
Christoforou P, Christopoulos PF and Koutsilieris M: The role of estrogen receptor β in prostate cancer. Mol Med. 20:427–434. 2014.
|
|
49
|
Mansi R, Fleischmann A, Macke HR and Reubi JC: Targeting GRPR in urological cancers-from basic research to clinical application. Nat Rev Urol. 10:235–244. 2013.
|
|
50
|
Meshulam T, Simard JR, Wharton J, Hamilton JA and Pilch PF: Role of caveolin-1 and cholesterol in transmembrane fatty acid movement. Biochemistry. 45:2882–2893. 2006.
|
|
51
|
Trigatti BL, Anderson RG and Gerber GE: Identification of caveolin-1 as a fatty acid binding protein. Biochem Biophys Res Commun. 255:34–39. 1999.
|
|
52
|
Edwards PA, Kast HR and Anisfeld AM: BAREing it all: The adoption of LXR and FXR and their roles in lipid homeostasis. J Lipid Res. 43:2–12. 2002.
|
|
53
|
Nath A and Chan C: Genetic alterations in fatty acid transport and metabolism genes are associated with metastatic progression and poor prognosis of human cancers. Sci Rep. 6:186692016.
|


