Introduction
Signal recognition particles (SRPs) are essential
for regulating protein transport and secretion within cells
(1). According to the Human
Protein Atlas database (https://www.proteinatlas.org), patients with
pancreatic cancer with high SRP9 expression tend to have poorer
overall survival (OS). Several studies have reported the
significance of SRP9 expression in several tumors, such as breast
and colorectal cancer (2,3). SRP9 is highly expressed in breast
(2) and colorectal (3) cancer and is considered to play a
role in tumor proliferative function in colorectal cancer (4). In addition to being cancer-related,
SRP9 is a febrile seizure susceptibility gene, suggesting that it
may provide new clues for early diagnosis and treatment (5). SRP9, together with SRP14, binds to
Alu-conserved repetitive sequences in RNA, plays a role in the
translational regulation of gene expression and metabolism of Alu
transcripts (6), and combines
with 40S ribosomal subunits to form stress granules (7). When binding to RN7SL1, a noncoding
RNA, SRP9 inhibits the release of the RNA sensor, retinoic
acid-inducible gene 1 protein (RIG-I), suppressing tumor growth
(8). However, the localization of
SRP9 in the tumor microenvironment remains unclear.
As summarized in previous reports, the GeneCards
database (https://www.genecards.org) indicates
that SRP9 is dominantly localized in the cytoplasm. However, the
relationship between its localization and tumor prognosis has not,
to the best of our knowledge, been elucidated. Therefore, the
present study aimed to investigate the relationship between the
nuclear translocation of SRP9 and patient prognosis.
Given that tumors have long been known to be stunted
in methionine-deficient environments, a phenomenon known as the
'Hoffman effect' (9-13), the present study investigated
whether nutrient conditions surrounding cancer cells may affect the
biological behaviors of SRP9. The nuclear translocation rate of
SRP9 was also examined in pancreatic cancer cells cultured in not
only methionine-deficient but also tryptophan/niacin-deficient
environments, which are located upstream of the methionine cycle
and appear to exert a critical function in the 'Hoffman effect'
(14). Furthermore, the present
study examined the splicing variants of SRP9 (v1 and v2) and their
deletion mutants (deletion of C-terminal regions) by molecular
cloning techniques, where the genes were introduced into MiaPaCa
pancreatic cancer cells, and investigated whether they were
translocated to the nucleus to determine which part of the SRP9
gene contained the coding region important for nuclear
translocation. Additionally, RNA immunoprecipitation (RIP)
sequencing was performed on cells where v1 and v2 migrated to the
nucleus, and the function of v1 and v2 was evaluated. Therefore,
the present study contributed to the early detection and
establishment of new treatment methods, not only for the precise
evaluation and therapeutic control of pancreatic cancer, but also
for other carcinomas.
Materials and methods
Patient eligibility and antibodies used
for immunohistochemistry/immunocytochemistry and SRP9 variants
A total of 38 patients with pancreatic cancer who
underwent surgical resection without preoperative chemotherapy or
radiotherapy at Osaka University Hospital (Osaka, Japan) from
December 2011 to February 2019 were included in the present study.
Cases in which specimens could not be submitted because the cancer
was unresectable during the surgery were excluded. The median
[range] patient age was 70 [50-87] years. Resected pancreatic
cancer tissues and adjacent normal tissues were obtained.
Immunohistochemistry was performed on the tissues, and OS and
recurrence-free survival (RFS) were examined using log rank tests
depending on whether SRP9 stained ≤50% or >50% of the total
number of nuclei.
Tissues were paraffin-embedded in a 10% formalin
solution and stored at −20°C postoperatively. Sections were a
thickness of 20 µm. Immunohistochemistry using antibodies
against SRP9 (cat. no. 11195-1-AP; RRID: AB_2239820; Proteintech
Group, Inc.) (Fig. 1A and B) and
Ki-67 (cat. no. 27309-1-AP; Proteintech Group, Inc.) (Fig. S1A) were performed using the
excised specimens at concentrations of 1:200, and 1:2,500,
respectively, and both were incubated at 4°C for 24 h. Normal goat
serum blocking solution (cat. no. S-1000-20; Vector Laboratories,
Inc.; Maravai Life Sciences) was used at a concentration of 1:200
for 60 min at room temperature for blocking, and anti-IgG (H+L),
rabbit, goat-polyclonal secondary antibody (cat. no. BA-1000-1.5;
Vector Laboratories Inc.; Maravai Life Sciences) was used at a
concentration of 1:500 for 60 min at room temperature. Antigen
activation was performed by heating at 100°C for 40 min in Antigen
retrieval buffer (1 l of distilled water mixed with 1.92 g of
anhydrous citric acid to reach pH 6), and phosphate buffered saline
(PBS) was used as the washing reagent. Rehydration in an alcohol
series was performed with gradually increasing concentrations of
60, 70, 80, 90, 95 and 100% ethanol. VECTASTAIN®
Elite® ABC-HRP Kit, Peroxidase (cat. no. PK-6100; Vector
Laboratories Inc.; Maravai Life Sciences) was used for
primary/secondary antibody binding, followed by visualization with
a DAB Tablet (cat. no. 045-22833; Vector Laboratories Inc.; Maravai
Life Sciences). For color development, the specimen was incubated
with 3,3′-diaminobenzidine for 60 sec. Specimens with
immunohistochemical staining were observed using an all-in-one
fluorescence microscope (BZ-X710; Keyence Corporation).
Subsequently, the relationship between nuclear staining rate and
Ki-67 was examined using single regression analysis. The rate of
nuclear staining and Ki-67 was evaluated by an expert
pathologist.
This study was approved by the Research Ethics
Committee of Osaka University (approval number. 23158). Written
informed consent for participation was obtained from all subjects
involved in the study and for publication.
Cell lines and culture conditions
The cell culture dish used was a VTC-D100, ϕ93×20 mm
in size (cat. no. 2-8590-03; Violamo). Within the present study,
all medium used was maintained at 37°C with 5% CO2, and
medium was replaced every other day with 10 ml medium. During cell
passages, the cells were washed with 5 ml Dulbecco's
phosphate-buffered saline (D-PBS; cat. no. 14249-24; Nacalai
Tesque, Inc.) and incubated with 3 ml trypsin (cat. no. 12605010;
Thermo Fisher Scientific, Inc.) for 3 min at 37°C, then centrifuged
(4°C, 120 x g, 4 min). After the supernatant was removed, the cells
were resuspended with the original medium and seeded into a new
dish at the desired density with 10 ml medium.
The cell lines we used in the present study were
MiaPaCa [human pancreatic cancer (ATCC®
CRL-1420TM)], Panc10.05 [human pancreatic cancer
(ATCC® CRL-2547TM)], Caski [human cervical
cancer (ATCC® CRL-1550TM)], 293T [human fetal
renal cells (ATCC® CRL-3216TM)] and HT-29
[human colon cancer cells (ATCC® HTB-38TM)]
cells. The cell lines were utilized at early passages after being
obtained from the cell bank (ATCC) and examined for negative
mycoplasma infections before the in vivo experiment by the
Central Institute for Experimental Animals, Japan (https://www.ciea.or.jp/about/).
Immunocytochemistry to evaluate
differences in nuclear translocation rates between pancreatic
cancer lines cultured in normal and amino acid-deficient media
The following in vitro experiments were
conducted to investigate the relationship between differences in
nuclear translocation rates and amino acid availability. The
deficient nutrients were the essential amino acid, methionine, plus
niacin/tryptophan, which is located in its upstream mechanism of
the methionine cycle (Fig.
2A).
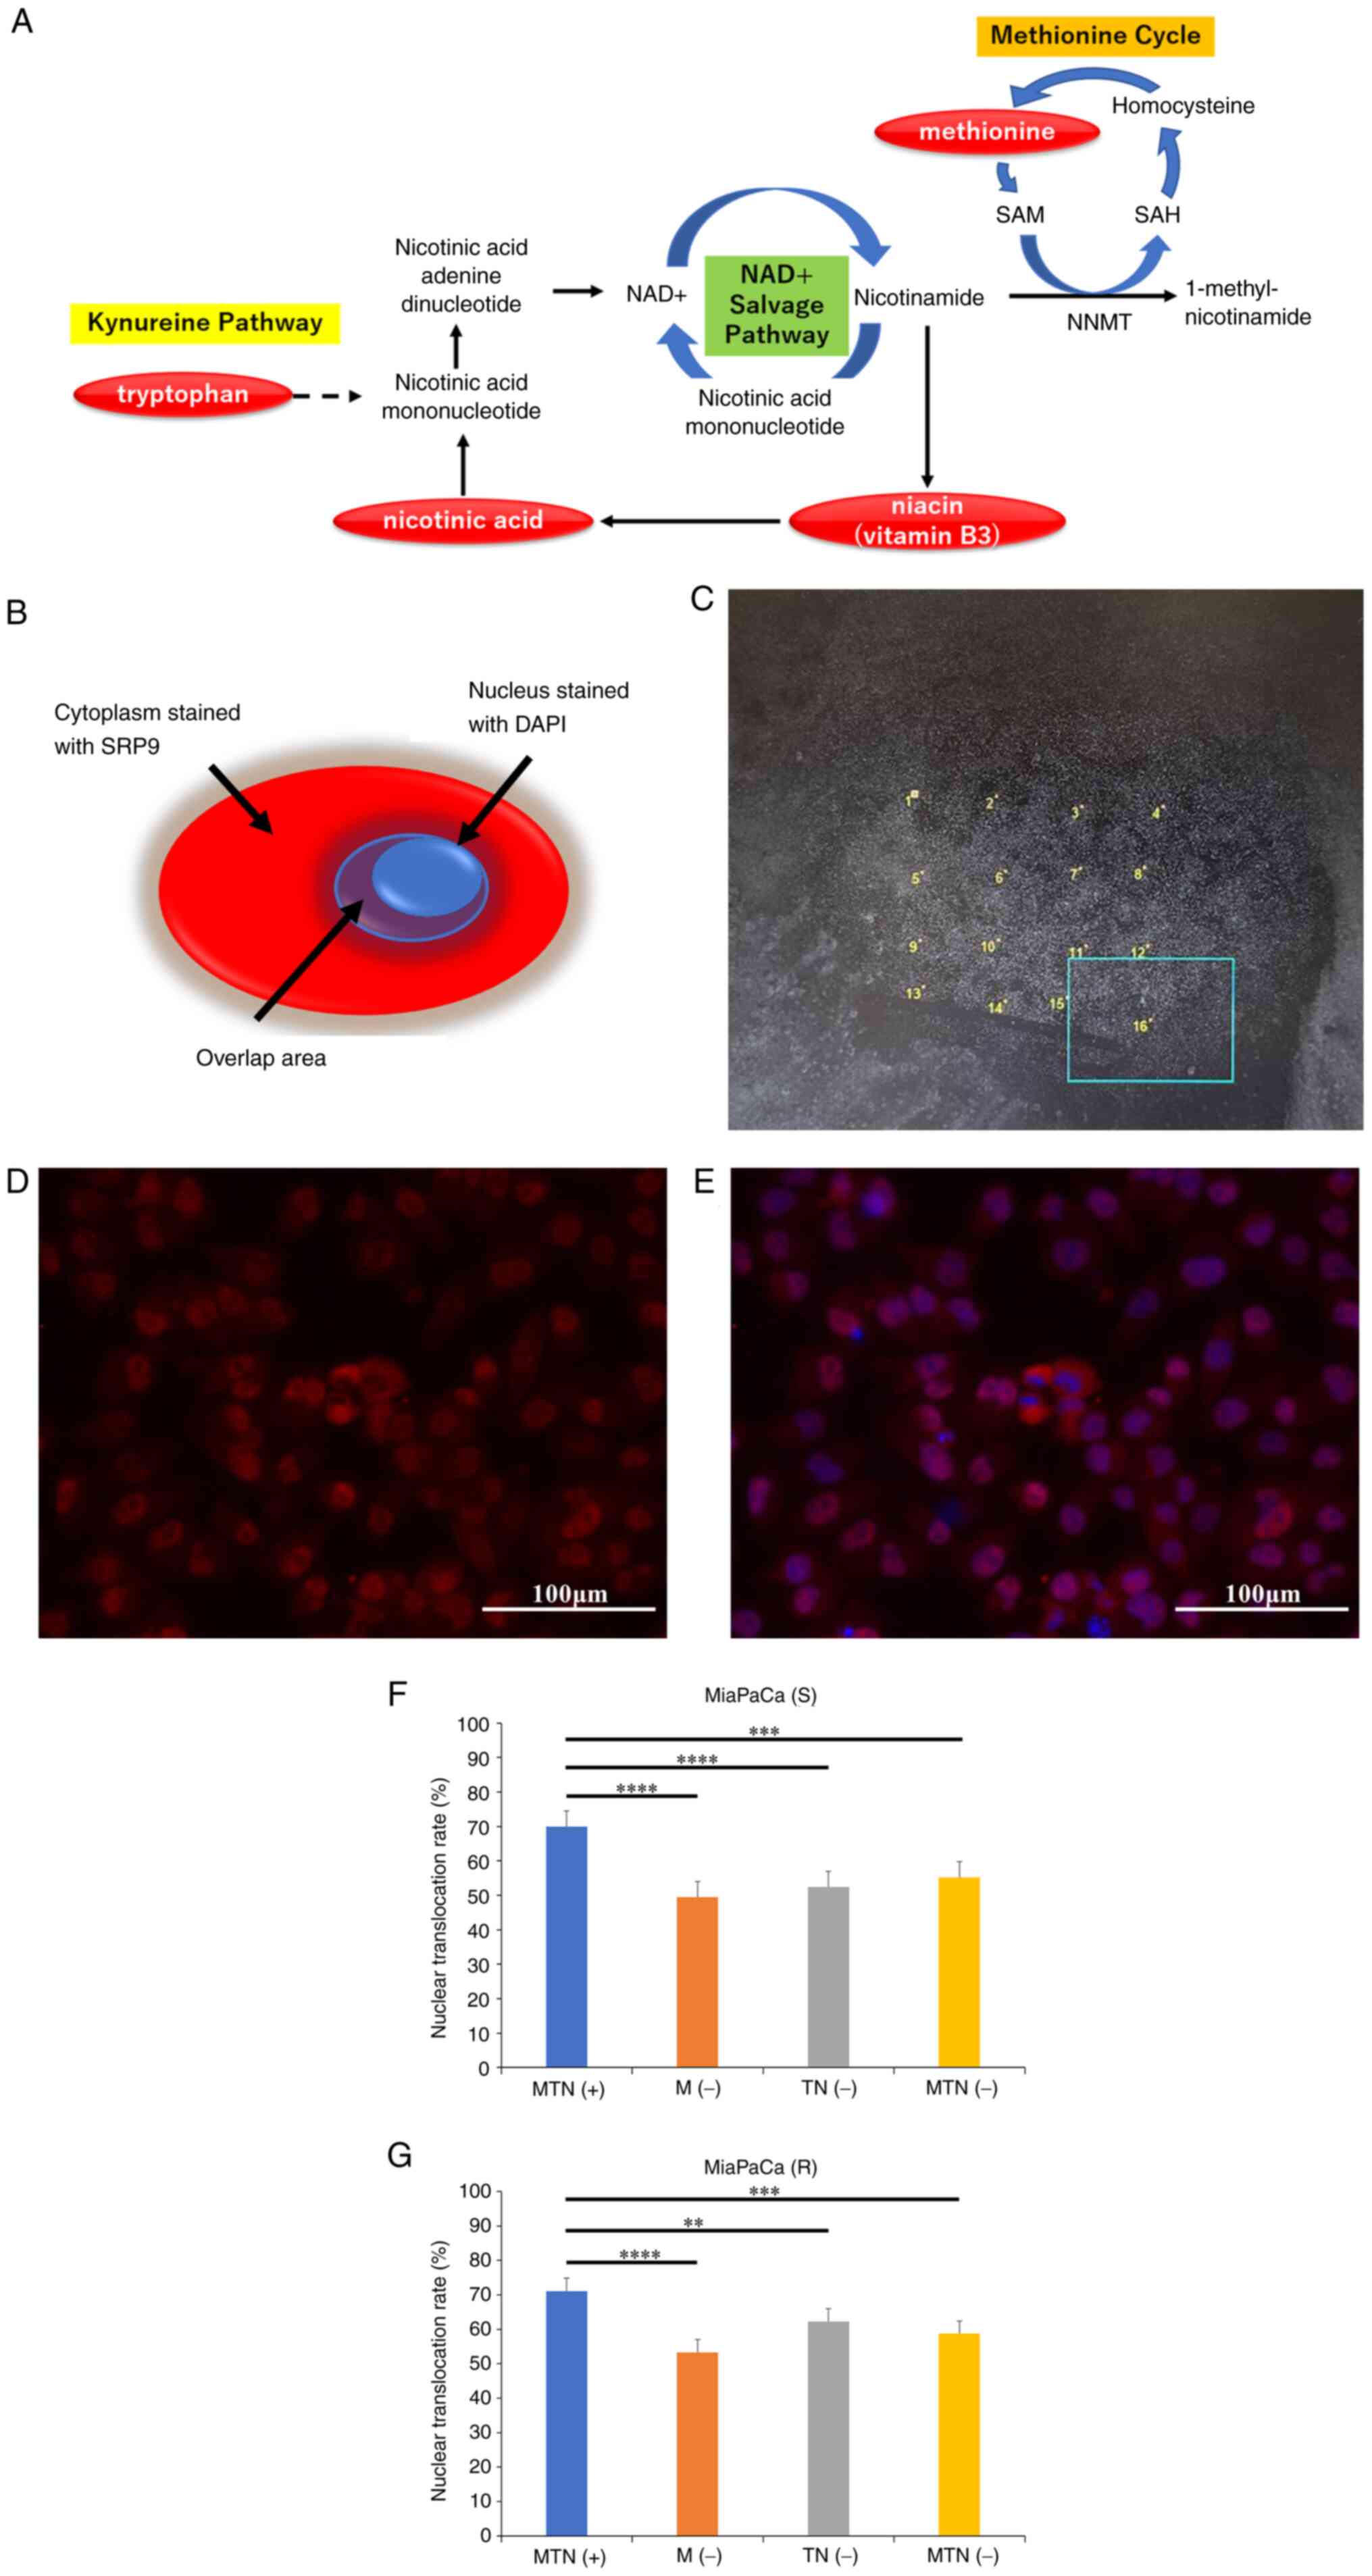 | Figure 2Immunocytochemistry to evaluate
differences in nuclear translocation rates between pancreatic
cancer lines cultured in normal and amino acid-deficient medium.
(A) The pathway of methionine and tryptophan/niacin upstream of the
cycle, which is deficient in the medium used in the present study.
(B) The 'Cytoplasm stained with SRP9' and the 'Overlap area,' which
are the staining covers of DAPI and SRP9 used in the 'S' and 'R'
equations. The MiaPaCa pancreatic cancer cell line was cultured in
regular medium for 24 h and then divided into four different media:
MTN(+), M(−), TN(−) and MTN(−). After 24 h of incubation, SRP9 and
nuclear immunocytochemistry tests were performed. (C) A total of 16
locations were randomly selected in one sample. The area of SRP9
(Sall, defined as 'cytoplasm stained with SRP9') and the
area where SRP9 and DAPI overlapped (Snuclei, defined as
'overlapping area') were measured to determine S (nuclear transfer
rate=Snuclei/Sall), and the nuclear
translocation rate expressed by the equation S was calculated. The
nuclear transfer rate was defined as R [nuclear transfer
rate=Rnuclei/Rall (R=S x fluorescence
intensity)] by taking the ratio of the area of SRP9 multiplied by
the fluorescence intensity. Representative images with (D) SRP9
fluorescence and (E) DAPI overlap. MiaPaCa cells were cultured in
MTN(+), M(−), TN(−) or MTN(−), and the nuclear transfer rates were
compared using the equations expressed as (F) S and (G) R. Error
bars indicate standard error. **P<0.01,
***P<0.001, ****P<0.0001 by Dunn test.
Images of immunocyte staining were collected at ×40 magnification,
and the scale bars indicate 100 µm. SAM,
S-adenosylmethionine; SAH, S-adenosylhomocysteine; NNMT,
nicotinamide N-methyltransferase; NAD+, nicotinamide
adenine dinucleotide; SRP9, signal recognition particle 9; MTN(+),
consisting of L-amino acids, niacin and tryptophan; M(−),
methionine-free medium; TN(−), tryptophan- and niacin-free medium;
MTN(−), methionine-, tryptophan- and niacin-free medium. |
The pancreatic cancer cell line, MiaPaCa, cultured
in Dulbecco's Modified Eagle's Medium with amino acids (cat. no.
08456-36; Nacalai Tesque, Inc.) and 10% fetal bovine serum (FBS)
(hereinafter referred to as 'regular medium') for 24 h was divided
and cultured in four types of media: i) Medium containing
methionine, tryptophan and niacin [hereinafter referred to as
'MTN(+)'], consisting of L-amino acids (arginine, cysteine,
glutamine, histidine, isoleucine, leucine, lysine, methionine,
phenylalanine, threonine, tryptophan, tyrosine and valine), niacin
[despite not strictly being an amino acid, it is located upstream
of the methionine cycle with tryptophan (Fig. 2A)], amino-free Dulbecco's Modified
Eagle's Medium (cat. no. 20780-25; specially prepared reagent, DMEM
(Low Glucose) with Sodium Pyruvate, without Amino Acids and
Nicotinamide; Nacalai Tesque, Inc.) and 10% dialyzed FBS
(SH30079.03; Cytiva); ii) methionine-free medium [hereinafter
referred to as 'M(−)']; iii) tryptophan- and niacin-free medium
[hereinafter referred to as 'TN(−)']; and iv) methionine-,
tryptophan- and niacin-free medium [hereinafter referred to as
'MTN(−)']. After 24 h of incubation, cells were fixed with 4%
paraformaldehyde for 15 min at room temperature and were
permeabilized with a solution containing 0.1% Triton X-100 and 1%
bovine serum albumin (cat. no. A7906; Sigma-Aldrich; Merck KGaA) in
PBS for 30 min at room temperature. Blocking was performed using a
solution composed of Blocking One Histo (cat. no. 06349-64; Nacalai
Tesque, Inc.), diluted in PBS with 0.1% Tween-20, for 30 min at
room temperature. Immunocytochemistry of SRP9 and the nuclei was
performed using the same SRP9 primary antibody as aforementioned.
The Goat anti-Rabbit IgG (H+L) Cross-Adsorbed Secondary Antibody,
Alexa Fluor™ 594 (1:200: cat. no. A-11012; Invitrogen; Thermo
Fisher Scientific, Inc.) was then incubated with the sample for 30
min at room temperature in the dark. The cell nuclei were stained
with DAPI (Dojindo Laboratories, Inc.). The treated cells were then
observed under an all-in-one fluorescence microscope (BZ-X710;
Keyence Corporation). Image analysis was performed using the
Analysis Application Hybrid cell count software (BZ-H3C; Keyence
Corporation).
After confirming that SRP9 and DAPI fluorescence was
observed in all four conditions, MTN(+) (Fig. S2A), M(−) (Fig. S2B), TN(−) (Fig. S2C) and MTN(−) (Fig. S2D), the nuclear translocation
rate was determined as follows. The area of SRP9 staining
[Sall, area defined as 'Cytoplasm and nucleus stained
with SRP9' (Fig. 2B)] and the
area where SRP and DAPI staining overlapped [Snuclei,
area defined as 'Overlap area' (Fig.
2B)] were measured. In one sample, 16 locations were randomly
selected (Fig. 2C), and for each,
an image with SRP9 fluorescence (Fig.
2D) and an image with DAPI overlap (Fig. 2E) were collected to determine the
nuclear translocation rate, which is represented by the formula 'S'
(nuclear translocation rate=Snuclei/Sall).
The ratio of the area of SRP9 staining multiplied by the
fluorescence intensity was also taken to define the nuclear
transfer rate as 'R' (nuclear translocation
rate=Rnuclei/Rall). R=S x fluorescence
intensity.
Evaluation of SRP9 variants in different
nutrient conditions and the nuclear translocation of artificially
constructed SRP9 isoforms
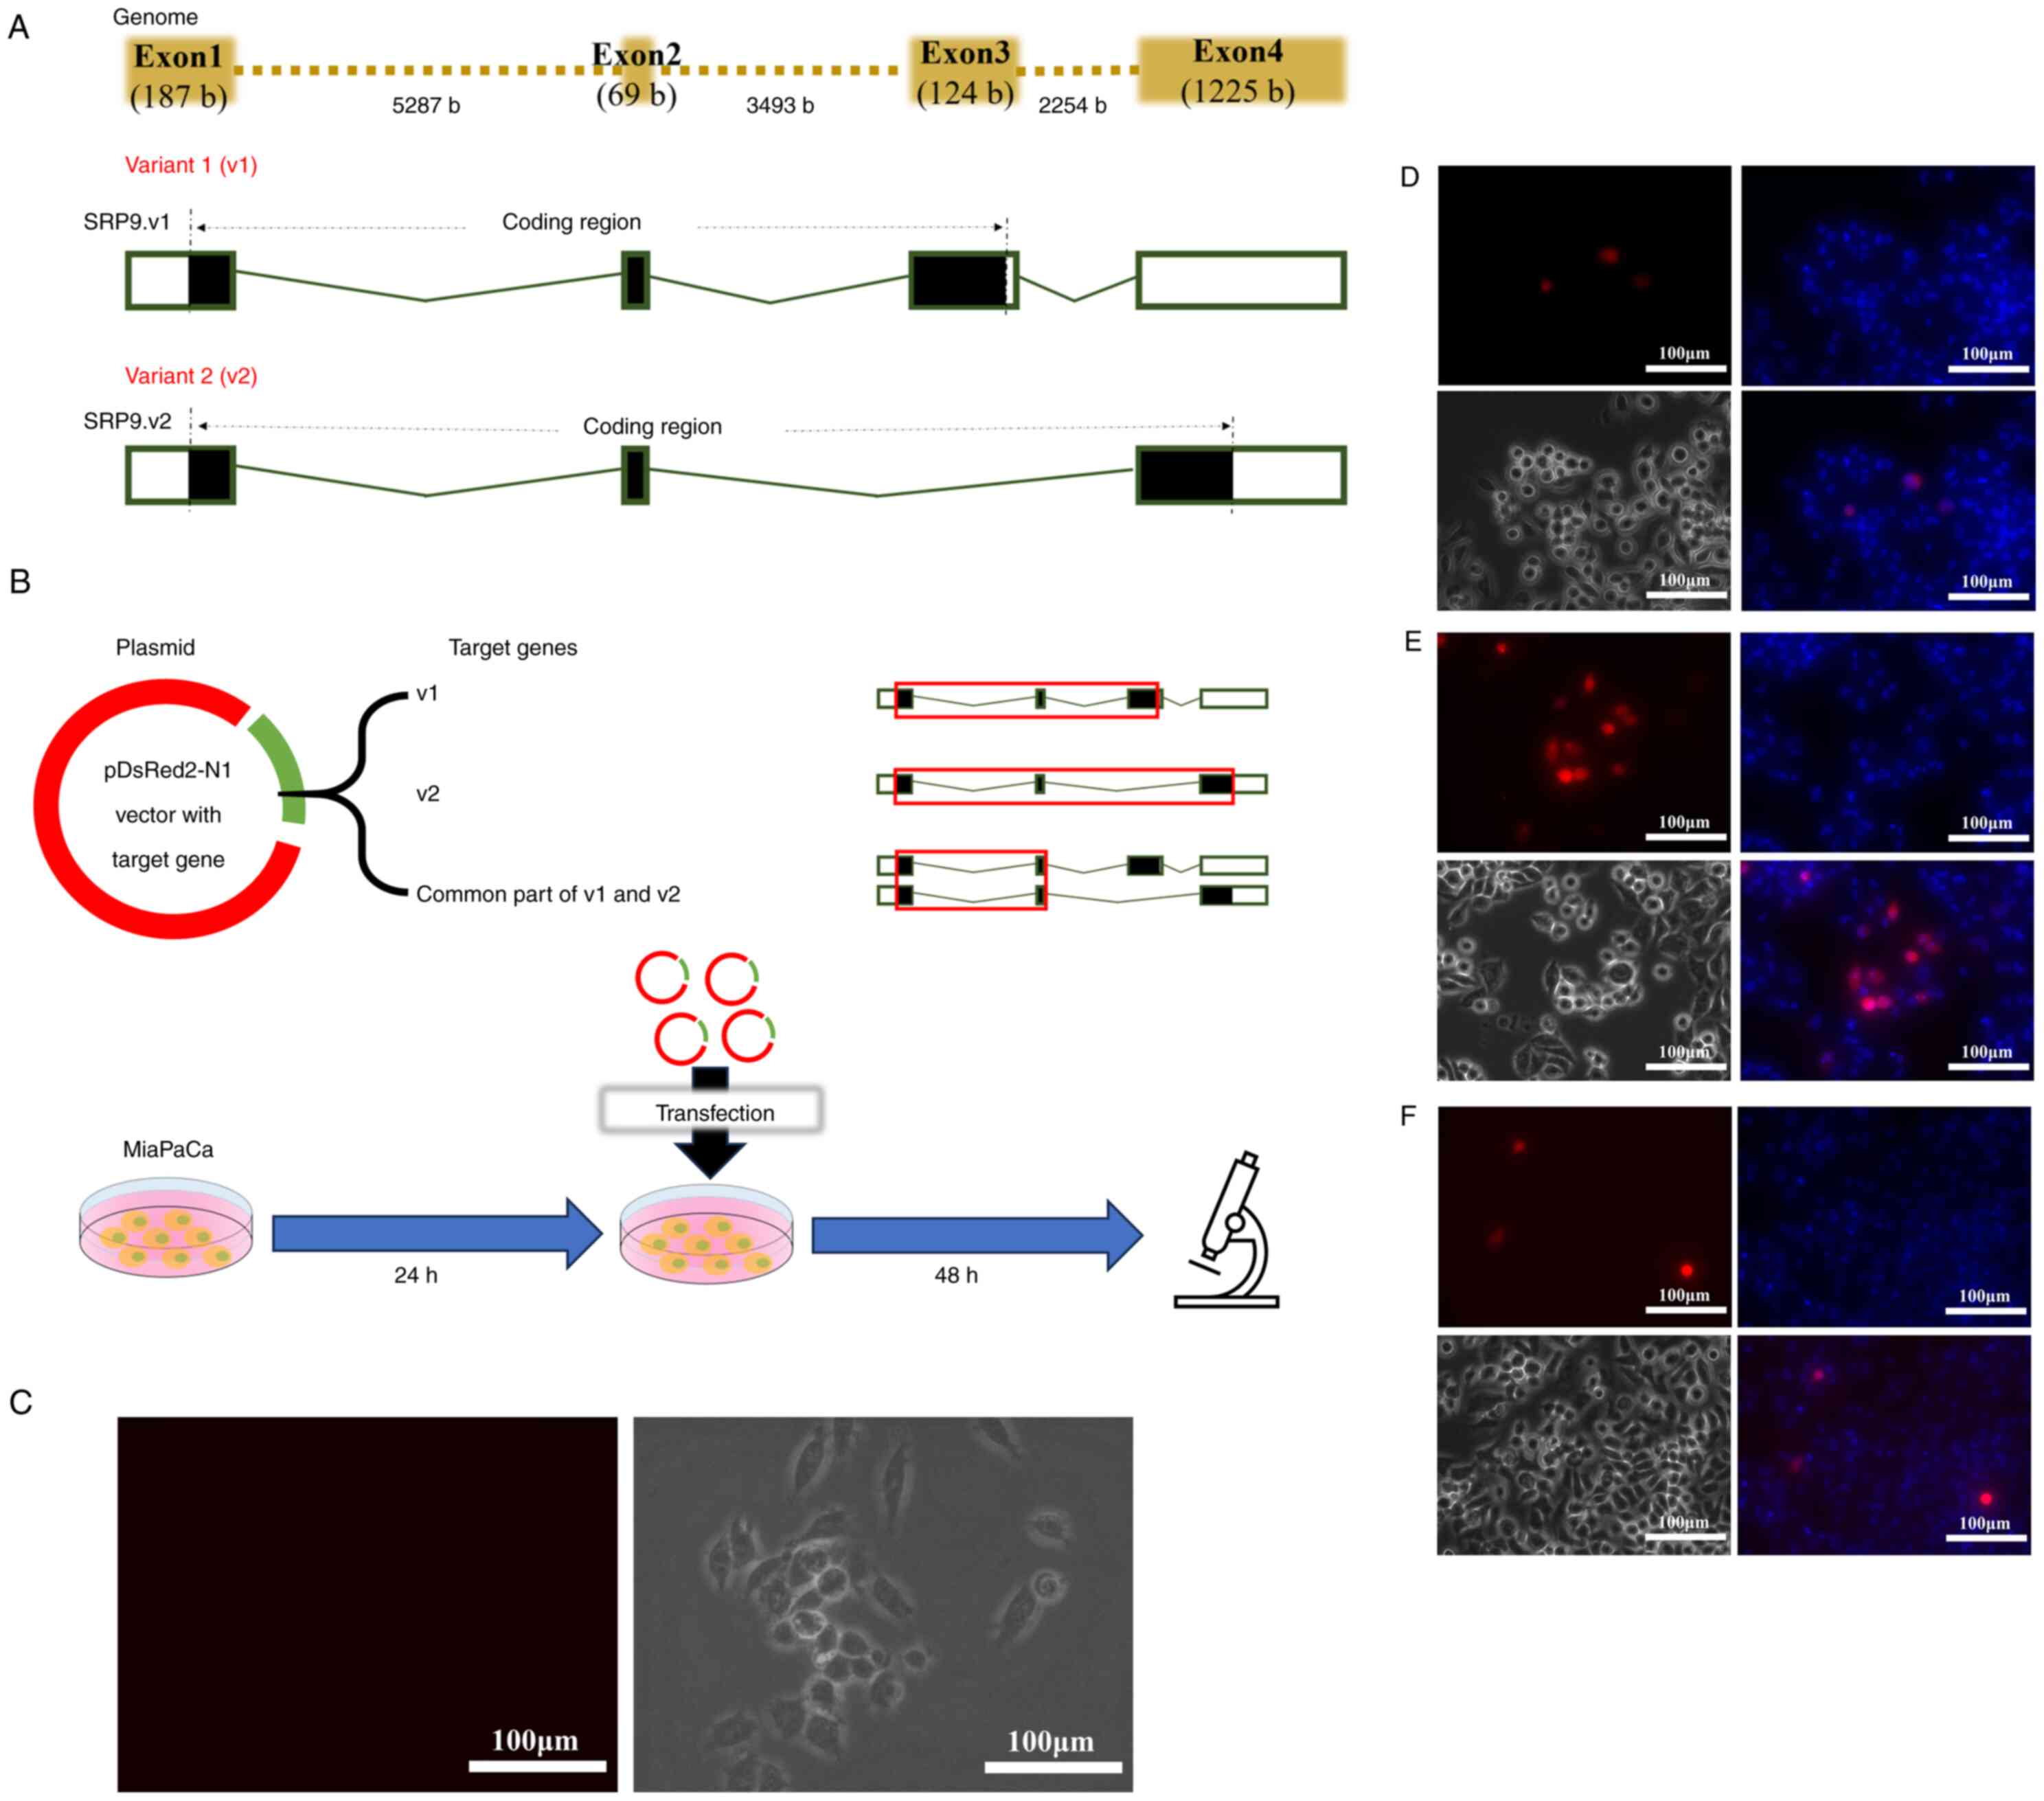
A total of two variants of SRP9 are known to exist,
variant 1 (v1) and variant 2 (v2) (https://www.ncbi.nlm.nih.gov/gene/6726) (Fig. 3A). v1 contains exons 1, 2 and 3 in
the coding region, and v2 contains exons 1, 2 and 4 in the coding
region.
MiaPaCa cells were cultured in regular medium for 24
h and then cultured in M(−), TN(−), MTN(−) or MTN(+) for 24 h.
Total RNA extraction was performed using ISOGEN (Nippon Gene Co.,
Ltd.), and reverse transcription was performed using PrimeScript RT
Master Mix (Takara Bio USA, Inc.) according to the manufacturer's
instructions. In this process, proteins were removed by
phenol-associated extraction. Polymerase chain reaction (PCR) was
then performed using PrimeSTAR Max DNA Polymerase (Takara Bio USA,
Inc.) according to the manufacturer's instructions. Electrophoresis
was performed using a 0.9% agarose gel at a voltage of 100 V, with
Midori Green Direct (cat. no. MG06; NIPPON Genetics EUROPE GmbH)
used as the fluorescent dye for visualization. Images were acquired
using a ChemiDoc multiplex fluorescence imaging system (ChemiDoc
MP; Bio-Rad Laboratories, Inc.), and the results were quantified
using Image Lab software v6.1 (Bio-Rad Laboratories, Inc.). v1 (500
bp) and v2 (274 bp) of SRP9 were amplified using the same forward
and reverse primers: Forward, 5′-CACTCTAGGCCACGATGCCG-3′ and
reverse, 5′-CACTCAGTTTCCATGGTAAC-3′ (Fig. S3A and B). PCR and electrophoresis
were also performed under the same conditions for GAPDH as the
housekeeping gene (Fig. S3C),
using the following primers: Forward 5′-TGGTATCGTGGAAGGACTCATG-3′
and reverse, 5′-AGAGGCAGGGATGATGTTCTG-3′.
Then, the following experiment was performed to
determine the nuclear localization signal of SRP9 (Fig. 3B). After culturing MiaPaCa cells
in regular medium for 24 h, a portion of the cells were observed
under an all-in-one fluorescence microscope as the negative control
MOCK cells (Fig. 3C). The cells
were then transfected with plasmids consisting of the pDsRed2-N1
vector and artificial genes of v1 or v2 or the common part of v1
and v2 (containing exons 1 and 2). After culturing for 48 h, the
cell nuclei were stained with Hoechst 33342 nucleic acid stain
(Invitrogen; Thermo Fisher Scientific, Inc.) and observed under an
all-in-one fluorescence microscope.
The inserts for v1 or v2 or the common part of v1
and v2 were purchased from Eurofins Genomics K.K. The pDsRed2-N1
vector, which expresses DsRed2 red fluorescent protein, is
kanamycin-resistant and was purchased from Takara Bio USA, Inc.
Plasmid digestion of the inserts and vector was performed using the
restriction enzymes XhoI (on the 5′ side) and BamHI
(on the 3′ side) (Takara Bio Inc.). Ligation was then conducted
using T4 DNA ligase (Takara Bio Inc.). Lipofectamine 3000
Transfection Reagent (Invitrogen; Thermo Fisher Scientific, Inc.)
was used for transfection with 500 ng of nucleic acid. The
transfection was performed at 37°C with 5% CO2 for 48 h.
Following transfection, cell nuclei were stained with Hoechst 33342
(cat. no. H1399; Invitrogen; Thermo Fisher Scientific, Inc.) and
observed using the all-in-one fluorescence microscope.
Functional evaluation of v1 and v2 by RIP
sequencing
An overview of the RIP sequencing protocol is shown
in Fig. 4A. A total of
1×10⁷ MiaPaCa pancreatic cancer cells were cultured in a
15-cm plastic culture dish (Nunc; Thermo Fisher Scientific, Inc.)
in RPMI1640 (Nacalai Tesque, Inc.) with 10% FBS under 5%
CO2 at 37°C. The MiaPaCa cell lines before transfection
of v1 (Fig. 4B) or v2 (Fig. 4C) plasmids were observed as MOCK
cells using a fluorescent all-in-one microscope, and no AcGFP
signal was observed in both cases. SRP9V1-3xFLAG and SRP9V2-3xFLAG
genes were prepared by DNA synthesis (Eurofins Genomics K.K.), the
sequences of which were confirmed by Sanger sequencer (ABI GmbH).
pIRES2-AcGFP1-NLS-SRP9V1-3xFLAG and pIRES2-AcGFP1-NLS-SRP9V2-3xFLAG
vectors were designed to express exogenous SRP9V1-3xFLAG or
SRP9V2-3xFLAG genes in the split protein by the internal ribosome
entry site signal, an RNA element enabling cap-independent
initiation of translation as part of the process of protein
synthesis, from AcGFP1 under NLS, which is fused with exogenous
SRP9V1-3xFLAG or SRP9V2-3xFLAG. The SRP9V1 or SRP9V2 peptide was
translated in-frame with a 3xFLAG peptide
(MDYKDHDGDYKDHDIDYKDDDDK). Transfection of pIRES2-AcGFP1-NSL-SRP9V1
or pIRES2-AcGFP1-NSL-SRP9V2 plasmids was performed by
electroporation using a Nepa Gene Co., Ltd. system, which allows
for the preservation of membrane damage during transfection
compared with Lipofectamine methods. The cells were cultured in
RPMI1640 with 10% FBS and 200 mg/ml geneticin (Nacalai Tesque,
Inc.) for 2 weeks to select gene-transfected cells. Protein
expression was then confirmed by the presence of AcGFP signal using
a fluorescent all-in-one microscope for both v1 (Fig. 4D) and v2 (Fig. 4E).
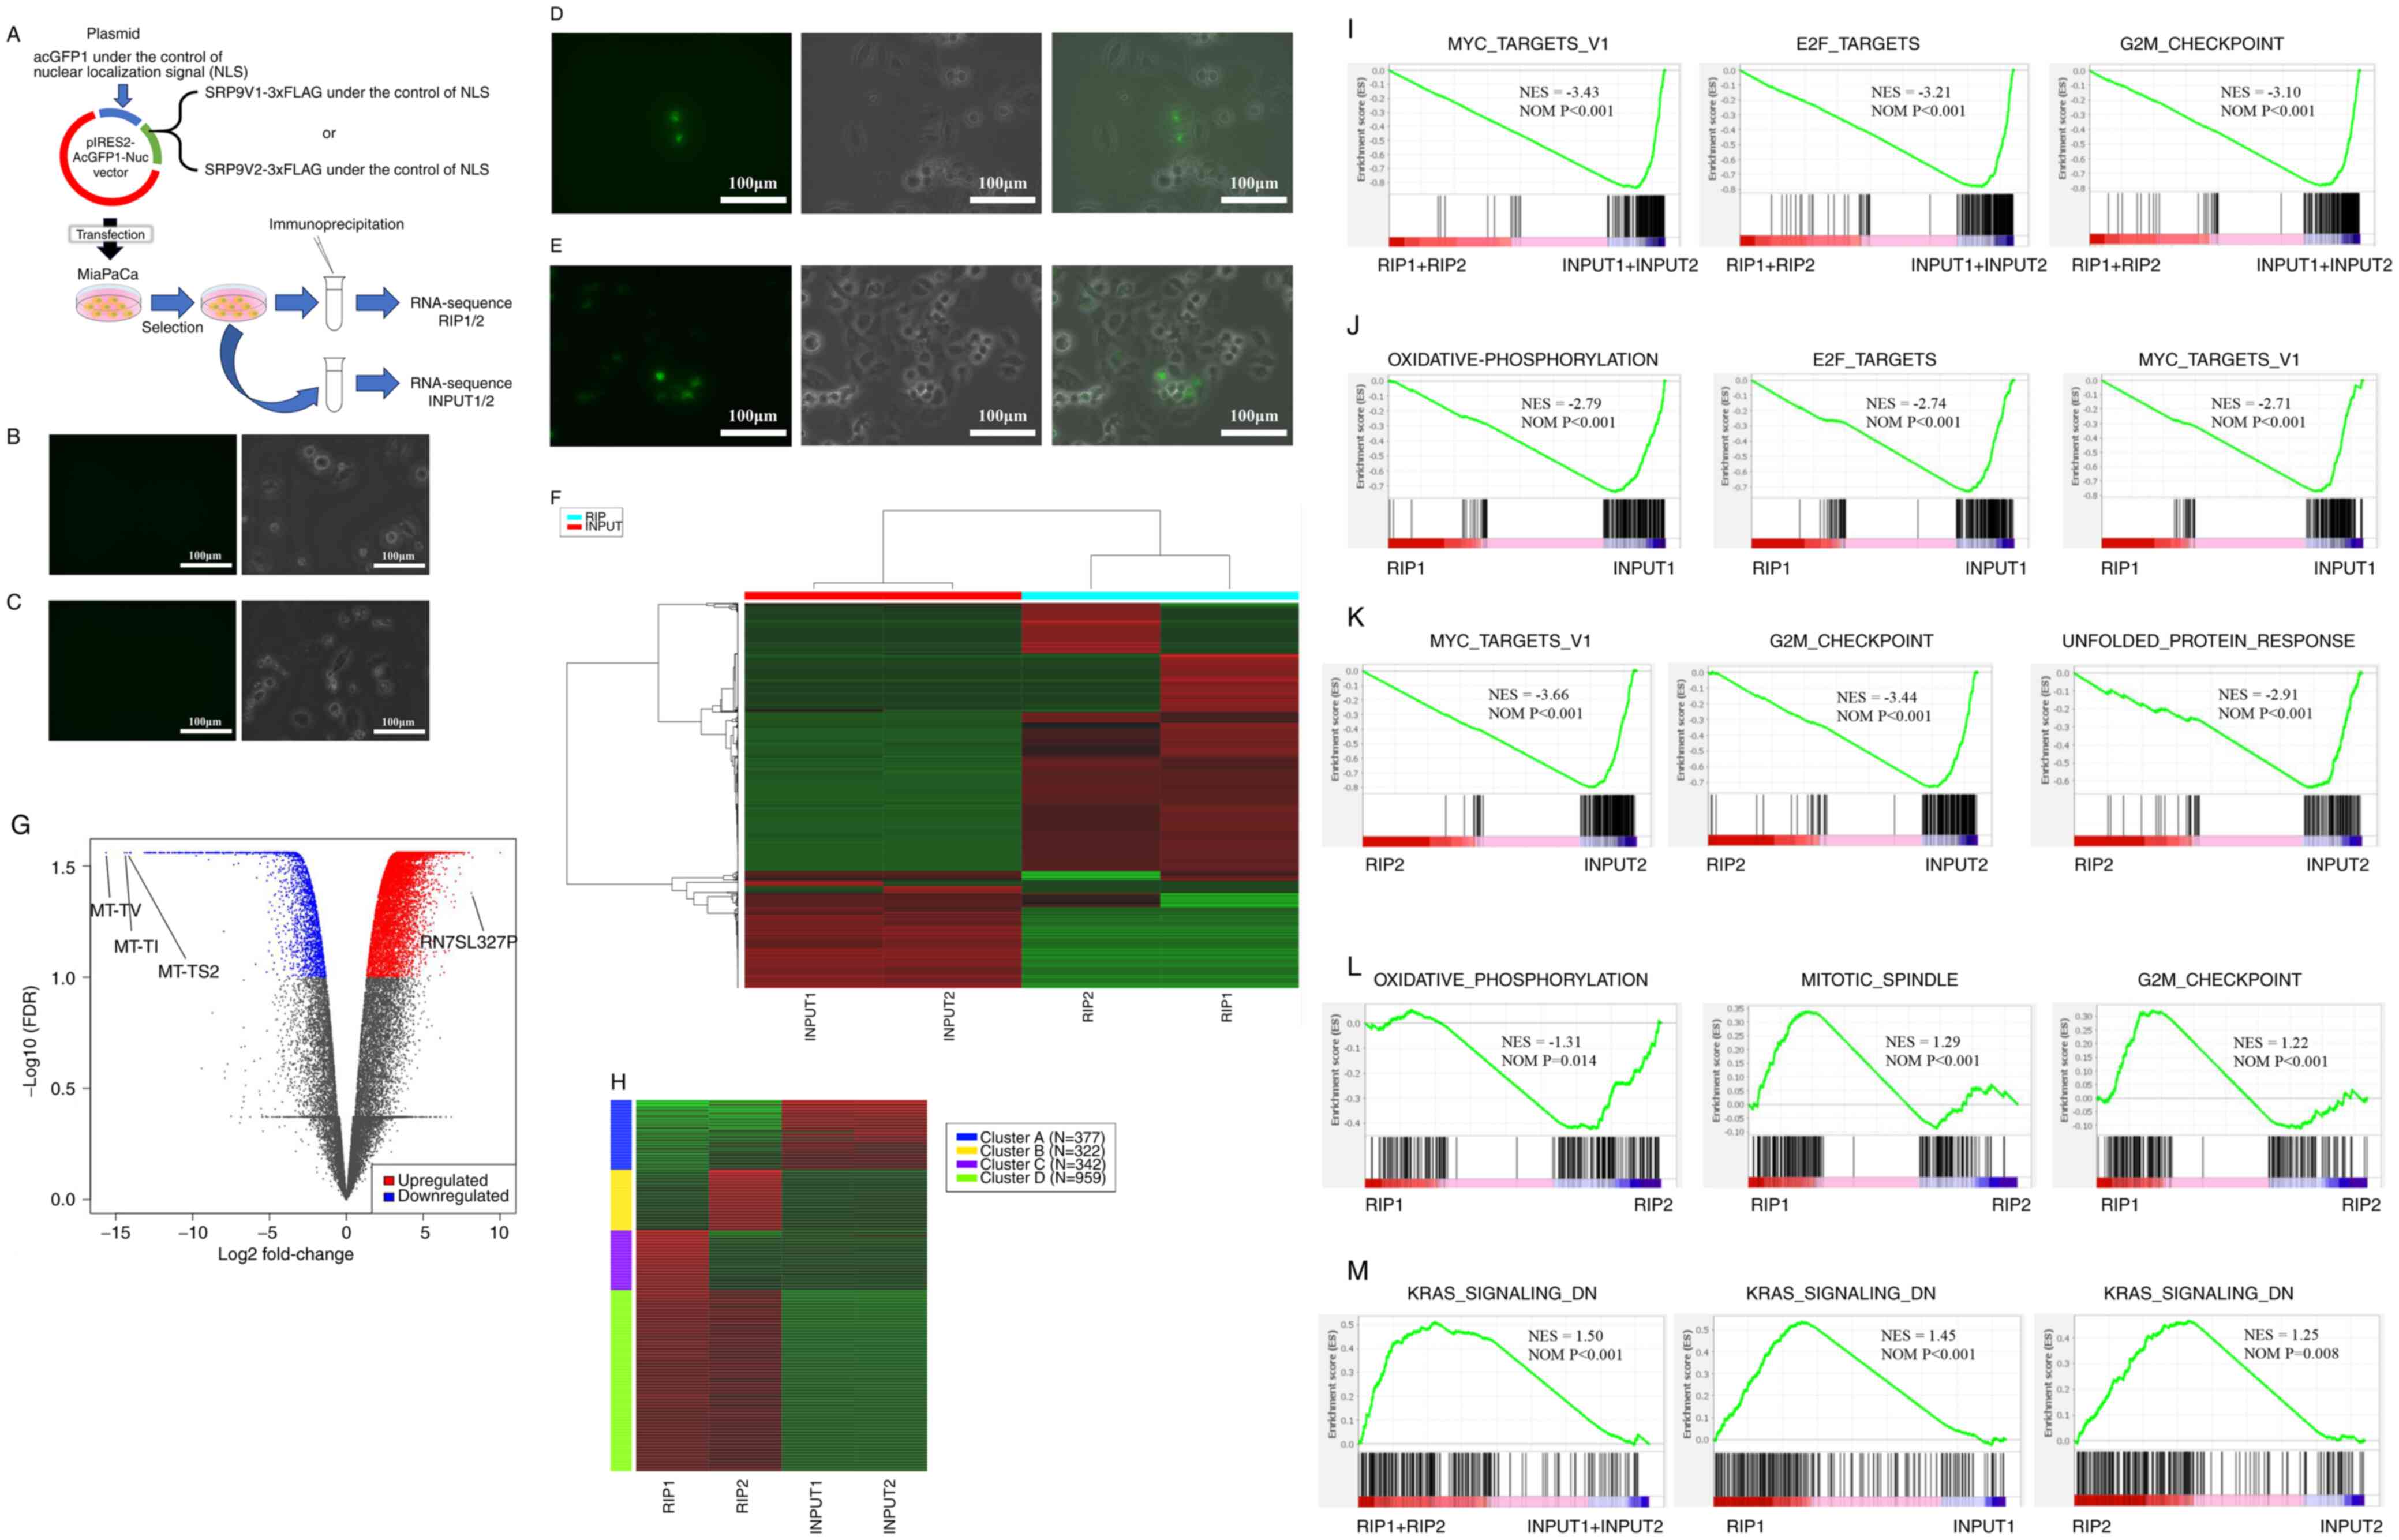 | Figure 4Functional evaluation of v1 and v2 by
RIP sequencing. (A) Overview of RIP sequencing. The MiaPaCa cell
line before transfection of the SRP9 (B) v1 and (C) v2 plasmids
(MOCK cells) showed no AcGFP signal in both cases when observed
using a fluorescent all-in-one microscope. Then, protein expression
of (D) v1 and (E) v2 via AcGFP signal was confirmed following
transfection with pIRES2-AcGFP1-NSL-SRP9V1 or
pIRES2-AcGFP1-NSL-SRP9V2 plasmids. Results of the (F) heatmap, (G)
volcano plot and (H) cluster analysis using the k-means algorithm
for RIP1, RIP2, INPUT1 and INPUT2. Top pathways enriched in GSEA
for (I) RIP1 + RIP2 vs. INPUT1 + INPUT2, (J) RIP1 vs. INPUT1, (K)
RIP2 vs. INPUT2 and (L) RIP1 vs. RIP2. (M) In the GSEA, the KRAS
signaling DN pathway was the most upregulated in the RIP samples
for RIP1 + RIP2 vs. INPUT1 + INPUT2, RIP1 vs. INPUT1, and RIP2 vs.
INPUT2. v1, variant 1; v2, variant 2; SRP9, signal recognition
particle 9; RIP, RNA immunoprecipitation (sample); FDR, false
discovery rate; GSEA, Gene Set Enrichment Analysis; DN,
downregulated; NES, Normalized Enrichment Score; NOM, nominal. |
A total of 5×10⁶ AcGFP expressing cells
were collected by fluorescence-activated cell sorting (BD
Biosciences), cultured in RPMI1640 with 10% FBS for 24 h and
subjected to protein extraction. For protein extraction, adherent
cells were washed with PBS(−) (Nacalai Tesque, Inc.) three times in
a 15-cm plastic culture dish to exclude amino acids in the medium
that can interfere with the cross-linker. The cells were harvested
with plastic cell scrapers and collected in 2 ml tubes. Samples
were then centrifuged at 280 x g at 4°C for 5 min, and the
collected cell pellets were lysed in 1 ml HEPES-RIPA [150 mM KCl,
50 mM HEPES-NaOH (pH7 4), 1% NP-40 and 1X Roche cOmplete proteinase
inhibitor, prepared from 50X stock reagent (cat. no. 04693116001;
Roche Diagnostics)]. Samples were centrifuged again at 280 x g at
4°C for 5 min, and the collected cell lysates were incubated for 30
min at room temperature with the cross-linking agent,
bis(sulfosuccinimidyl)suberate (Thermo Fisher Scientific, Inc.),
which does not permeate cell membranes. Therefore, permeabilization
was conducted with the treatment of the surfactant, NP-40, as
aforementioned. Newly purchased bis(sulfosuccinimidyl)suberate (lot
no. YB351210) was used due to its ability to absorb moisture from
the atmosphere and become inactive. After the cross-linking
reaction, 1/50 (final concentration, 20 mM) 1 M Tris-HCl (pH 7.5)
was added to the tube to quench the excess cross-linking agent,
followed by gentle mixing by inversion for 15 min. Samples were
subjected to immunoprecipitation to purify the target SRP9V1-3xFLAG
or SRP9V2-3xFLAG proteins. To this end, 20 µl anti-DDDDK
antibody (undiluted at a concentration of 0.675 mg/ml; cat. no.
ab205606; Abcam), which binds to the FLAG tag sequence, was added
to each sample in 10 µl (6.75 µg of antibody),
incubated at 4°C overnight (16 h) and purified with protein A and G
conjugated magnetic beads (Bio-Rad Laboratories, Inc.). The total
amount of Protein A and G added was 1 mg (0.5 mg Protein A + 0.5 mg
Protein G) per sample. The immunoprecipitated SRP9V1-3xFLAG or
SRP9V2-3xFLAG protein cross-linked with endogenous RNA was washed
with 1 ml HEPES-RIPA [150 mM KCl, 50 mM HEPES-NaOH (pH 7.4], and 1%
NP-40), 1 ml high salt HEPES-RIPA [300 mM KCl, 50 mM HEPES-NaOH (pH
7.4), and 1% NP-40] and once again with 1 ml HEPES-RIPA, which were
used to remove non-specific bound substances from the protein A and
G conjugated magnetic beads. Finally, samples were treated with 100
mg 3X DYKDDDDK peptide (FP-1; Sigma-Aldrich; Merck KGaA) to elute
endogenous RNA-bound SRP9V1-3xFLAG or SRP9V2-3xFLAG proteins
(hereinafter referred to as 'RIP1' and 'RIP2,' respectively).
RNA was extracted from the samples using the RNeasy
Mini Kit (cat. no. 74104; Qiagen GmbH), and 100 ng RNA was
subjected to the high-speed sequencing system, NovaSeq6000
(Illumina, Inc.). Each Illumina sequencing library was prepared
using SMARTer Stranded Total RNA-seq Kit v2-Pico Input Mammalian
Components (cat. no. 634417; Takara Bio USA, Inc.). As controls,
input RNAs from geneticin-selected transfected cells with
SRP9V1-3xFLAG or SRP9V2-3xFLAG (hereinafter referred to as 'INPUT1'
and 'INPUT2,' respectively) (Fig.
4A) were prepared and used. To confirm the quality/completeness
of the processed samples, the length distribution of the
constructed libraries was inspected by LabChip GX (Perkin Elmer,
Inc.), with 101 bp paired ends as the sequencing type. The
sequencing kits, NovaSeq 6000 S1 Reagent Kit v1.5 (200 cycles; cat.
no. 20028318; Illumina, Inc.) or NovaSeq 6000 S2 Reagent Kit v1.5
(200 cycles; cat. no. 20028315; Illumina, Inc.) were used. The
loading concentration of the final library was 320 pM and
concentrations were measured using KAPA Library Quantification DNA
Control Standard (KAPA Biosystems; Roche Diagnostics). The
sequencing was performed by the NGS core facility at the Research
Institute for Microbial Diseases of Osaka University (Osaka,
Japan).
The normalized fragments per kilobase million data
from RIP1, RIP2, INPUT1 and INPUT2 were used to create a heatmap,
volcano plot, and k-means clustering and to perform pathway and
enrichment analyses using iDEP.96 (sdstate. edu). Gene set
enrichment analysis (GSEA) was performed using GSEAPreranked
(GSEAPreranked v4.3.2; 1,000 permutations; enrichment
statistic=weighted; max size=500; min size=15; normalization
mode=meandiv; ranked by t-score), based on genes that were either
up- or downregulated with P<0.05, using these collections of
gene sets from the Molecular Signatures Database
(h.all.v2023.Hs.symbols.gmt): i) Hallmarks, ii) canonical, iii)
Gene Ontology, iv) chemical and genetic perturbations, v)
immunologic signatures, vi) oncogenic signatures, and vii) cancer
modules. Gene sets were considered significantly enriched and met
the threshold of NOM P<0.05.
In vitro tumor viability under amino acid
depletion
A total of 4×10³/ml of each tumor cell
line (Panc10.05, Caski and 293T) was divided into two groups (n=4)
and cultured in regular medium for 24 h. The media of one group
were then changed to MTN(+) medium (as the control), and the media
of another group were changed to M(−) medium for 48 h. The MTT
formazan product assay was then conducted (Fig. S4A). Dimethyl sulfoxide was used
to dissolve the purple formazan, and the wavelength used for the
formazan measurement was 450 nm.
Amino acid dependence of cancer in
mice
All experiments were approved by the Osaka
University Animal Experiments Committee, the formal ethics
committee for institutional animal study at Osaka University
(approval no. 30-011), and conducted in accordance with the Osaka
University Regulations on Animal Experiments. Female 5-week-old
wild-type NOD SCID mice, derived from a mouse strain with a
naturally occurring mutant, exhibiting an autosomal recessive
inheritance pattern and severe immunodeficiency due to the absence
of T and B cells, which results in minimal rejection of xenogeneic
cells and tissues, were procured from Japan SLC, Inc. Mice were
randomly divided into cages for each feeding condition described
below. Not only methionine but also its upstream pathways are
involved in cancer immunity. Tryptophan/niacin located upstream of
the methionine cycle is metabolized to form nicotinamide, which is
related to the methionine pathway, and 1-methyl-nicotinamide (MNAM)
is formed from S-adenosylmethionine (SAM) synthesized from
methionine via nicotinamide N-methyltransferase. Thus, MNAM
synthesized in this methionine cycle is said to suppress T cells
and promote cancer (15).
Therefore, the HT-29 human colon cancer cell line cultured in
regular medium containing all nutrients was used to induce tumors
that did not cause detectable clinical side effects. For this,
2×10⁵ cells, were transplanted subcutaneously into the
back of NOD SCID mice in accordance with the Guidance on the
Operation of Animals (Scientific Procedures) Act 1986. Some mice
were reared for 2 weeks on a diet devoid of methionine, tryptophan
and niacin. The median (range) body weight of the mice at the
beginning of the experiment was 16 (13-17) g. Mice raised on a normal diet
containing methionine, tryptophan and niacin were defined as
MTN(+), mice raised on a methionine-free diet were defined as M(−),
mice raised on a tryptophan- and niacin-free diet were defined as
TN(−) and mice raised on a methionine-, tryptophan- and niacin-free
diet were defined as MTN(−). Special diets for the mice were
custom-ordered with as much appearance and taste as the normal diet
as possible. Rearing conditions were such that the floor was
changed daily to minimize the intake of excretory-derived amino
acids (Fig. S5A). The room
temperature was maintained at ~23°C and the lights were turned on
in 12 h cycles. Although the initial plan was to euthanize the mice
if the tumor size exceeded 150 mm3 or if the weight of
the mice increased by >20% within 1 week, the intended 3-week
experimental period was successfully completed without encountering
any breaches of these restrictions. Euthanasia experiments using
CO2 were conducted in accordance with the American
Veterinary Medical Association (AVMA) guidelines and with ethical
considerations to minimize suffering. For mice weighing ~20 g, the
concentration of CO2 used for euthanasia was 40%, with a
flow rate of 0.5 l/min for an inhalation time of 10 min. For
smaller mice weighing ≤16 g, the concentration of CO2
was reduced within the range of 30-40%, with a lower flow rate of
0.2-0.5 l/min and for a shorter inhalation time of 5-10 min, to
minimize stress and pain to the mice during the procedure. Mice
were continuously observed during the procedure and, since the AVMA
guideline recommends a 30-70% vol/min displacement rate of the
euthanasia chamber, the euthanasia chamber was set at 30-40%. The
experiment was first performed with 1 MTN(−) mouse as a first step
(Fig. S5B), followed by a second
step with an additional MTN(+) mouse with n=1, M(−) mice with n=2,
TN(−) mouse with n=1 and MTN(−) mouse with n=1 (Fig. S5C).
The tumors were then removed from the mice and
evaluated for RNA expression and type by RNA sequencing (Fig. S5A). After confirming the
cessation of mouse respiratory movements, tumors were promptly
excised within 30 min in a well-maintained environment with
laboratory air conditioning and a clean experimental table.
Subsequently, the tumors were immersed in RNA LATER reagent
(Sigma-Aldrich; Merck KGaA), and RNA was extracted using QIAzol
Lysis Reagent (cat. no. 79306; Qiagen GmbH), followed by RNA
sequencing analysis. RNA libraries were prepared using a TruSeq
Stranded mRNA Library Prep Kit (cat. no. 20020595; Illumina, Inc.).
To confirm the quality/completeness of the processed samples, the
length distribution of the constructed libraries was inspected by
LabChip GX (Perkin Elmer, Inc.), with 101 bp paired ends as the
sequencing type. The sequencing kits, NovaSeq 6000 S1 Reagent Kit
v1.5 (200 cycles; cat. no. 20028318; Illumina, Inc.) or NovaSeq
6000 S2 Reagent Kit v1.5 (200 cycles; cat. no. 20028315; Illumina,
Inc.) were used. The loading concentration of the final library was
420 pM or 380 pM, and concentrations were measured using KAPA
Library Quantification DNA Control Standard (KAPA Biosystems; Roche
Diagnostics). The sequencing was performed by the NGS core facility
at the Research Institute for Microbial Diseases of Osaka
University.
Mutated serine and arginine rich splicing
factor 2 (SRSF2) in myelodysplastic syndrome (MDS) compared with
healthy controls for the percentage of exon 3
Mutations in genes encoding RNA splicing factors
have been found in myeloid tumors, such as MDS (16,17), chronic myelomonocytic leukemia
(17) and secondary acute myeloid
leukemia (18,19), lymphoid tumors, such as chronic
lymphocytic leukemia (19), and
solid tumors, such as breast (20), lung (21) and pancreatic (22) cancer at high frequency. The
present study focused on the splicing defects in MDS. Given that
splicing factor 3B subunit 1, SRSF2 and U2 small nuclear RNA
auxiliary factor 1 are the most frequently mutated splicing factor
genes in MDS (16), and since the
splicing mechanism of SRP9 in pancreatic cancer remains to be fully
investigated, the present study focused on the altered control of
the SRP9 splicing mechanism in a well-characterized hematopoietic
malignancy as a disease model. Using the state-of-the-art
supercomputer system at the National Institute of Genetics (Japan),
which provides services equipped with large-scale clustered and
memory-sharing computers (https://sc.ddbj.nig.ac.jp/en/), a comprehensive
analysis was performed to determine the effects of mutated SRSF2 on
pre-mRNA splicing in splicing factor mutant MDS stem/progenitor
cells and erythroid/myeloma progenitor cells.
Using the Gene Expression Omnibus database
(https://www.ncbi.nlm.nih.gov/geo/;
accession no. GSE114922), 15 samples from healthy individuals and
15 samples from patients with MDS (SRSF2 mutation) were collected.
Data (fastq files) were downloaded and the fastq files were mapped
using Hisat2. Then, they were sorted, creating bam files (Fig. S6A and B). The sorted bam files
were then checked for SRP9 expression using Integrative Genomics
Viewer (IGV; mapping results visualization software; https://igv.org), and the percentage of exon 3 or v1
was compared between the healthy and SRSF2-mutant groups (Fig. S6C).
Statistical analysis
Data are presented as the mean and standard
deviation or the median and range. The relationship between two
groups was examined using the Mann-Whitney U and log rank tests.
The relationship between nuclear staining rate and Ki-67 was
examined by single regression analysis. For multi-group comparisons
of three or more groups, the Kruskal-Wallis test and subsequent
Dunn test were performed. Bonferroni correction was performed for
Dunn test (P<0.05/3 were significant). Statistical analyses were
performed using Statcel (version 4; OMS). P<0.05 was considered
to indicate a statistically significant difference.
Results
Comparison of patient background and
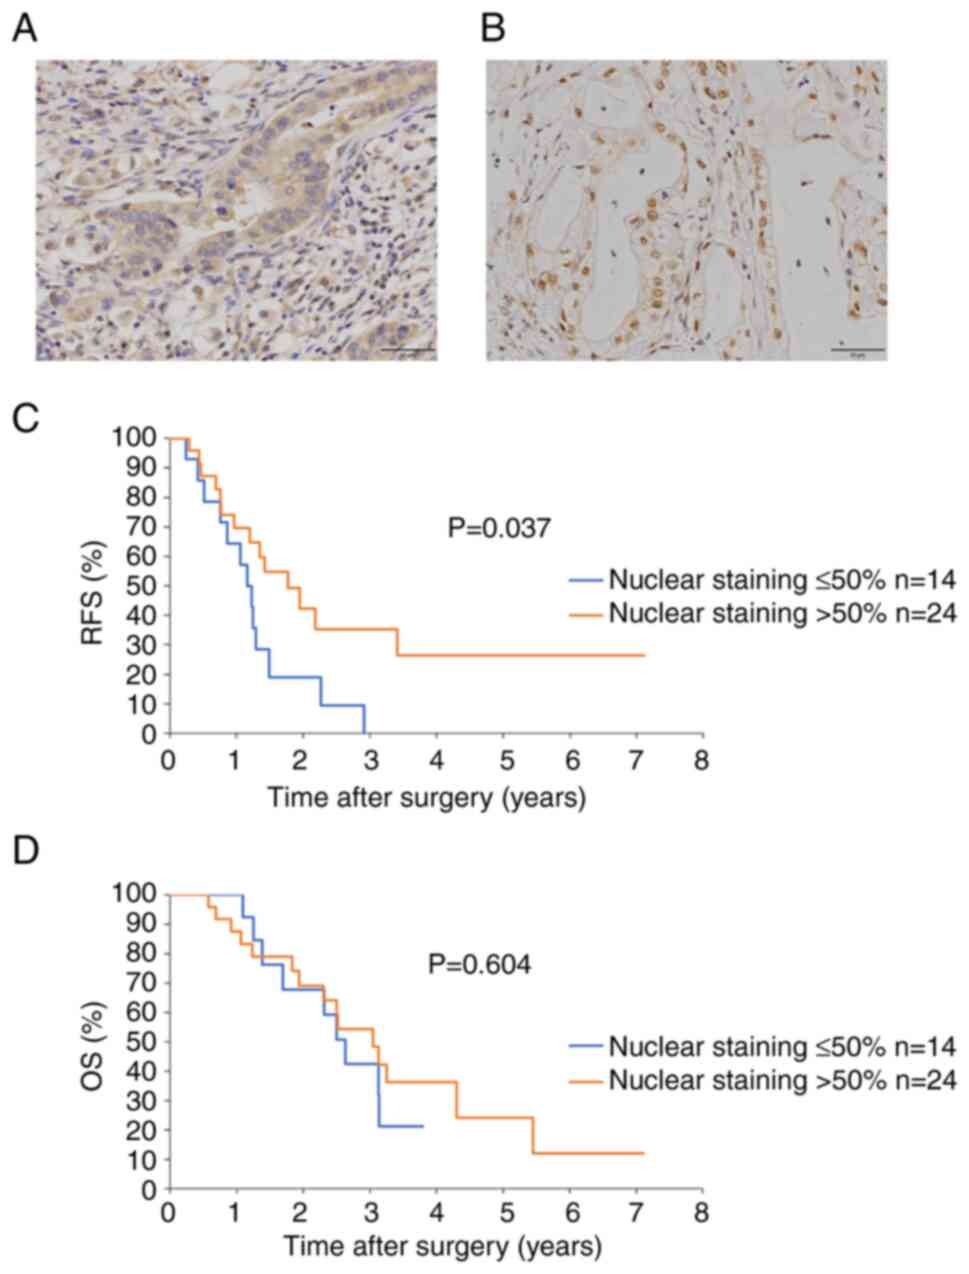
prognosis (RFS and OS) between two SRP9 expression groups
Patients were divided into two groups: Those with
≤50% of the total number of nuclei stained at the tumor site (n=14;
Fig. 1A) and those with >50%
staining (n=24; Fig. 1B). The
patient background (Table I) and
prognoses, such as RFS and OS, were compared between the two groups
(Fig. 1C and D). The percentage
of no lymphatic invasion (ly0) was significantly higher in the
nuclear staining >50% group. However, no significant differences
in the other parameters, including the tumor diameter and the
prognostic nutritional index (PNI), which indicates the nutritional
status of the patients, were observed between the two groups
(Table I and Fig. S7). The group with nuclear
staining >50% had a significantly better RFS (P=0.037; Fig. 1C), whereas OS was not
significantly different between the two groups (P=0.604; Fig. 1D). These results showed that
nuclear translocation of SRP9 contributed to patient prognosis (in
terms of RFS), although no significant difference in OS was
observed.
 | Table IPatient background. |
Table I
Patient background.
| Clinical
characteristic | Nuclear staining
≤50%, n=14 | Nuclear staining
>50%, n=24 | P-value |
|---|
| Age, years
[range] | 69.5 [50-84] | 70.5 [51-87] | 0.440 |
| Female:male (%
female) | 6:8 (42.9) | 5:19 (20.8) | 0.266 |
| Tumor site,
Ph:Pb:Pt | 9:4:1 | 10:7:7 | 0.455 |
| Procedure
classification, DP:PD (% DP) | 5:9 (35.7) | 14:10 (58.3) | 0.202 |
| pTa (%) | | | 0.927 |
| 1 | 1 (7.1) | 1 (4.2) | |
| 2 | 0 (0.0) | 1 (4.2) | |
| 3 | 13 (92.9) | 22 (91.7) | |
| 4 | 0 (0.0) | 0 (0.0) | |
| pNa (%) | | | 0.145 |
| 0 | 4 (28.6) | 9 (37.5) | |
| 1 | 4 (28.6) | 12 (50.0) | |
| 2 | 6 (42.9) | 3 (12.5) | |
| pStagea (%) | | | 0.338 |
| IA | 1 (7.1) | 1 (4.2) | |
| IB | 0 (0.0) | 1 (4.2) | |
| IIA | 3 (21.4) | 8 (33.3) | |
| IIB | 9 (64.3) | 14 (58.3) | |
| III | 1 (7.1) | 0 (0.0) | |
|
pN+:pN− (%
pN+) | 10:4 (71.4) | 15:9 (62.5) | 0.728 |
| CA19-9, U/ml
[range] | 156 [0.4-1221] | 181 [0.8-1839] | 0.525 |
| CEA, ng/ml
[range] | 3 [1-12] | 3.5 [1-59] | 0.446 |
| DUPAN-2, U/ml
[range] | 265 [25-7700] | 110 [25-1600] | 0.069 |
| HbA1c, % (NGSP)
[range] | 6.5 [5.9-8.2] | 6.3 [5.4-8] | 0.524 |
| Prognostic
nutritional index [range] | 46.9
[37.8-54.0] | 44.1
[38.0-54.9] | 0.096 |
| Tumor diameter, mm
[range] | 24.5 [8-43] | 24 [10-120] | 0.716 |
| Histological type,
muc:tub1:tub2:por | 0:5:8:1 | 2:6:14:2 | 1.000 |
| CH0:CH1 (%
CH0) | 9:5 (64.3) | 20:4 (83.3) | 0.245 |
| DU0:DU1 (%
DU0) | 10:4 (71.4) | 19:5 (79.2) | 0.699 |
| S0:S1 (% S0) | 4:10 (28.6) | 7:17 (29.2) | 1.000 |
| RP0:RP1 (%
RP0) | 5:9 (35.7) | 8:16 (33.3) | 1.000 |
| A0:A1 (% A0) | 13:1 (92.9) | 18:6 (75.0) | 0.227 |
| PV0:PV1 (%
PV0) | 10:4 (71.4) | 14:10 (58.3) | 0.501 |
| PL0:PL1 (%
PL0) | 14:0 (100.0) | 24:0 (100.0) | 1.000 |
| INFb:INFc (%
INFb) | 12:2 (85.7) | 23:1 (95.8) | 0.542 |
| ly0:ly1 (%
ly0) | 5:9 (35.7) | 17:7 (70.8) | 0.047b |
| v0:v1:v2:v3 | 9:4:1:0 | 15:3:4:2 | 0.610 |
|
ne0:ne1:ne2:ne3 | 0:10:3:1 | 4:9:9:2 | 0.805 |
| OO0: OO1 (%
OO0) | 14:0 (100.0) | 22:2 (91.7) | 0.522 |
| Postoperative
chemotherapy (% received treatment) | 13 (92.9) | 16 (66.7) | 0.115 |
Relationship between Ki-67 and the
nuclear staining rate
Immunohistochemistry with Ki-67 was performed on the
same aforementioned cases to confirm whether the significant
difference in RFS obtained in Fig.
1C was due to tumor proliferative capacity. For this, the
correlation between Ki-67 and nuclear staining rate was examined. A
representative image of immunohistochemical staining of pancreatic
cancer with Ki-67 is presented (Fig.
S1A). No clear trend was observed (R2=0.007;
P=0.622; Fig. S1B). The results
therefore indicated that the nuclear staining rate was associated
with RFS but not with the proliferative capacity.
Immunocytochemistry to evaluate
differences in nuclear translocation rates between pancreatic
cancer lines cultured in normal and amino acid-deficient media
Representative images of SRP9 and nuclei
immunocytochemically stained samples from the four groups [MTN (+)
(Fig. S2A), M(−) (Fig. S2B), TN(−) (Fig. S2C), and MTN (−) (Fig. S2D)] are shown. MiaPaCa cells were
cultured in regular medium [MTN(+)], M(−), TN(−), and MTN(−), and
the nuclear translocation rates were compared using the equations
expressed as S and R. The Kruskal-Wallis test was used to determine
the difference in nuclear translocation rates of MiaPaCa cells
cultured in M(−), TN(−), MTN(−) and MTN(+) media, as determined by
the S and R equations, which showed significant differences
(P<0.0001 for each; Fig. 2F and
G). The nuclear transfer rates in the control MTN(+) medium
were then compared with that in the other three media [MTN(+) vs.
M(−), MTN(+) vs. TN(−), and MTN(+) vs. MTN(−)] using the
Kruskal-Wallis test followed by the Dunn test. The nuclear
translocation rate of MiaPaCa cells was significantly lower when
cultured in M(−), TN(−) or MTN(−) media compared with the MTN(+)
medium, for both the equations expressed as S (Fig. 2F) or R (Fig. 2G). These results indicated that
amino acid deficiency suppressed nuclear translocation of SRP9.
PCR quantification of v1 and v2 when
cells were cultured in amino acid-deficient medium
The PCR results showed that the bands were separated
into v1 and v2 in the four medium groups (Fig. S3A). v1 was predicted to be 398
bp. However, it was shown that the band was 500 bp due to ~100 bp
of some unexpected sequences. The ratio of v1 to v2 (v1/v2) of
those cells cultured in M(−), TN(−), MTN(−) and MTN(+) media was
quantified by measuring the band density following electrophoresis.
No notable differences were observed among the four groups [M(−)
vs. TN(−) vs. MTN(−) vs. MTN(+), 0.59 vs. 0.54 vs. 0.57 vs. 0.53);
Fig. S3B]. The housekeeping
gene, GAPDH, was also confirmed to be amplified by electrophoresis
(Fig. S3C).
Evaluation of nuclear translocation of
artificially constructed SRP9 isoforms
Transfection of plasmids containing the genes for v1
(Fig. 3D) and v2 (Fig. 3E) and the common parts of v1 and
v2 (Fig. 3F) confirmed the
nuclear translocation of v1 and v2, when compared with MOCK cells
(Fig. 3C). This result indicated
that the common parts of v1 and v2, exons 1 and 2, contain the
coding regions important for nuclear translocation.
Functional evaluation of v1 and v2 using
RIP sequencing
First, the genes and pathways that were
upregulated/downregulated in the RIP1, RIP2, INPUT1 and INPUT2
samples were examined (Fig. 4A).
Fig. 4F shows the heatmap for
RIP1, RIP2, INPUT1 and INPUT2, and detailed heatmap data are shown
in Table SI. The number of genes
upregulated and downregulated in the RIP samples compared with the
INPUT samples was 9,802 and 2,117, respectively (Table SI). In the volcano plot, genes
related to tRNAs in mitochondria, such as MT-TV (log2 fold
change=−15.63; P=2.75×10⁻²), MT-TI (log2 fold
change=−14.42; P=2.75×10⁻²) and MT-TS2 (log2 fold
change=−14.28; P=2.75×10⁻²), were found to be
downregulated in the RIP samples (Fig. 4G). The third largest fold change
gene upregulated in the RIP samples was RN7SL327P (log2 fold
change=8.14; P=4.19×10⁻²), which is a mutant of RN7SL1
(Fig. 4G). The first and second
largest fold changes were those whose gene symbols had not been
identified.
Table II shows
the enriched pathways related to the differentially expressed genes
for RIP1 + RIP2 vs. INPUT1 + INPUT2. Next, RIP1, RIP2, INPUT1 and
INPUT2 were clustered using the k-means algorithm (Fig. 4H), and Table III shows the pathways enriched
in each cluster. Pathways involved in translation and protein
synthesis, such as mitochondrial translational elongation,
mitochondrial translational termination, translational termination,
mitochondrial translation, cellular protein complex disassembly and
protein-containing complex subunit organization, were classified.
Table SII shows the detailed
k-means data, and the pathways enriched in the Generally Applicable
Gene-set Enrichment are shown in Table IV. Pathways involved in protein
synthesis, such as ribonucleoprotein complex biogenesis, ribosome
biogenesis and RNA splicing, were found to be downregulated in the
RIP samples. GSEA was then used to analyze the gene expression data
for RIP1 + RIP2 vs. INPUT1 + INPUT2, showing the three highest
absolute values of normalized enrichment score (Fig. 4I). MYC, E2F and G2M checkpoints,
which are pathways related to cancer progression, were found to be
downregulated in the RIP samples. Furthermore, the GSEA of RIP1 vs.
INPUT1 (Fig. 4J) and RIP2 vs.
INPUT2 (Fig. 4K) showed
downregulation of pathways related to cancer progression, although
the ranking of the pathways varied. In GSEA comparing RIP1 vs.
RIP2, the oxidative phosphorylation pathway was more downregulated
in RIP1, whereas pathways related to the mitotic spindle and GM2
checkpoint were more downregulated in RIP2 (Fig. 4L). In RIP1 + RIP2 vs. INPUT1 +
INPUT2, RIP1 vs. INPUT1, and RIP2 vs. INPUT2, the KRAS signaling DN
(downregulated) pathway was the most upregulated pathway in the RIP
samples (Fig. 4M). Details of the
upregulated KRAS signaling DN pathways in RIP1 + RIP2 vs. INPUT1 +
INPUT2 (Table SIII), RIP1 vs.
INPUT1 (Table SIV), and RIP2 vs.
INPUT2 (Table SV) are presented.
The results demonstrated that the nuclear-translocated v1 and v2
downregulated genes and pathways are involved in protein
translation and pathways associated with cancer progression.
| Table IIEnriched pathways in the
differentially expressed genes for RIP1 + RIP2 vs. INPUT1 +
INPUT2. |
Table II
Enriched pathways in the
differentially expressed genes for RIP1 + RIP2 vs. INPUT1 +
INPUT2.
| Direction | adj.P-value | Genes, n | Function in Gene
Ontology |
|---|
| Downregulated |
7.1×10−46 | 229 | RNA processing |
|
2.1×10−43 | 211 | MRNA metabolic
process |
|
2.2×10−36 | 465 | Cellular component
biogenesis |
|
4.6×10−36 | 510 | Organelle
organization |
|
7.7×10⁻³⁵ | 473 | Cellular
localization |
|
1.0×10⁻³² | 296 | Cell cycle |
|
2.6×10⁻³² | 137 | MRNA
processing |
|
9.1×10⁻³¹ | 203 | Mitotic cell
cycle |
|
2.2×10⁻³⁰ | 122 | RNA splicing |
|
3.2×10⁻³⁰ | 106 | RNA splicing, via
transesterification reactions |
|
1.7×10⁻²⁹ | 414 | Macromolecule
localization |
|
2.9×10⁻²⁹ | 104 | RNA splicing, via
transesterification reactions with bulged adenosine as
nucleophile |
|
2.9×10⁻²⁹ | 104 | MRNA splicing, via
spliceosome |
|
9.4×10⁻²⁹ | 184 | Protein
localization to organelle |
|
2.1×10⁻²⁸ | 381 | Establishment of
localization in cell |
| Upregulated |
1.1×10−59 | 765 | System process |
|
2.3×10−42 | 526 | Nervous system
process |
|
1.1×10−36 | 484 | G protein-coupled
receptor signaling pathway |
|
1.6×10⁻³⁰ | 364 | Sensory
perception |
|
1.7×10⁻³⁰ | 499 | Ion transport |
|
7.4×10⁻²⁵ | 258 | Regulation of ion
transport |
|
7.5×10⁻²⁵ | 382 | Cation
transport |
|
1.3×10⁻²⁴ | 462 | Biological
adhesion |
|
1.6×10⁻²⁴ | 460 | Cell adhesion |
|
4.0×10⁻²⁴ | 309 | Metal ion
transport |
|
6.6×10⁻²³ | 228 | Detection of
stimulus involved in sensory perception |
|
2.8×10⁻²² | 365 | Ion transmembrane
transport |
|
2.7×10⁻²¹ | 268 | Detection of
stimulus |
|
4.4×10⁻²¹ | 282 | Inorganic ion
transmembrane transport |
|
2.2×10⁻²⁰ | 246 | Chemical synaptic
transmission |
| Table IIIEnriched pathways for each
cluster. |
Table III
Enriched pathways for each
cluster.
| Cluster | adj.P-value | Genes, n | Function in Gene
Ontology |
|---|
| A |
8.1×10⁻⁹ | 9 | Mitochondrial
translational elongation |
|
8.1×10⁻⁹ | 9 | Mitochondrial
translational termination |
|
2.3×10⁻⁸ | 9 | Translational
termination |
|
1.5×10⁻⁷ | 9 | Mitochondrial
translation |
|
2.2×10⁻⁷ | 9 | Translational
elongation |
|
4.2×10⁻⁷ | 10 | Cellular protein
complex disassembly |
|
4.2×10⁻⁷ | 26 | Protein-containing
complex subunit organization |
|
4.2×10⁻⁷ | 9 | Mitochondrial gene
expression |
|
1.0×10⁻⁶ | 9 | Electron transport
chain |
|
1.3×10⁻⁶ | 11 | Protein-containing
complex disassembly |
|
3.5×10⁻⁶ | 8 | Oxidative
phosphorylation |
|
3.7×10⁻⁶ | 7 | ATP synthesis
coupled electron transport |
|
8.9×10⁻⁶ | 7 | Respiratory
electron transport chain |
|
1.9×10⁻⁵ | 8 | Aerobic
respiration |
|
2.4×10⁻⁵ | 12 | Cellular component
disassembly |
| B |
6.9×10⁻³ | 2 | L-phenylalanine
metabolic process |
|
6.9×10⁻³ | 2 | Amino acid
neurotransmitter reuptake |
|
6.9×10⁻³ | 2 | Lung-associated
mesenchyme development |
|
6.9×10⁻³ | 2 | Erythrose
4-phosphate/phosphoenolpyruvate family amino acid metabolic
process |
| D |
4.7×10⁻¹¹ | 53 | Sensory
perception |
|
8.2×10⁻¹¹ | 39 | Detection of
stimulus involved in sensory perception |
|
8.2×10⁻¹¹ | 83 | System process |
|
1.7×10⁻¹⁰ | 36 | Detection of
chemical stimulus involved in sensory perception |
|
3.5×10⁻¹⁰ | 37 | Sensory perception
of chemical stimulus |
|
3.5×10⁻¹⁰ | 63 | Nervous system
process |
|
3.5×10⁻¹⁰ | 33 | Detection of
chemical stimulus involved in sensory perception of smell |
|
6.0×10⁻¹⁰ | 36 | Detection of
chemical stimulus |
|
1.0×10⁻⁹ | 33 | Sensory perception
of smell |
|
1.8×10⁻⁹ | 41 | Detection of
stimulus |
|
5.4×10⁻⁶ | 51 | G protein-coupled
receptor signaling pathway |
|
4.5×10⁻⁵ | 57 | Locomotion |
|
1.5×10⁻⁴ | 28 | Chemotaxis |
|
1.5×10⁻⁴ | 28 | Taxis |
|
2.4×10⁻⁴ | 29 | Regulation of ion
transport |
| Table IVEnriched pathways for GAGE. |
Table IV
Enriched pathways for GAGE.
| Direction | GAGE analysis: RIP
vs. INPUT | Statistic | Gene, n | adj.P-value |
|---|
| Downregulated | Ribonucleoprotein
complex biogenesis | −20.0362 | 466 |
4.2×10−69 |
| Ribosome
biogenesis | −17.4508 | 328 |
2.3×10−51 |
| RNA splicing | −17.1448 | 446 |
2.1×10−53 |
| NcRNA
processing | −16.8357 | 425 |
3.2×10−51 |
| RNA splicing, via
transesterification reactions | −16.1232 | 353 |
1.2×10−46 |
| RNA splicing, via
transesterification reactions with bulged adenosine as
nucleophile | −15.982 | 350 |
5.1×10−46 |
| MRNA splicing, via
spliceosome | −15.982 | 350 |
5.1×10−46 |
| RRNA
processing | −15.734 | 262 |
9.5×10−42 |
| RRNA metabolic
process | −15.4495 | 272 |
3.5×10−41 |
| RNA catabolic
process | −15.0928 | 418 |
1.0×10−42 |
| MRNA catabolic
process | −14.8794 | 376 |
3.5×10−41 |
| Translational
initiation | −14.2285 | 194 |
3.0×10⁻³³ |
| Proteasomal protein
catabolic process | −13.9713 | 490 |
5.9×10−38 |
| Regulation of cell
cycle phase transition | −13.4307 | 499 |
2.0×10⁻³⁵ |
| Regulation of mRNA
metabolic process | −13.2654 | 367 |
1.2×10⁻³³ |
| Proteasome-mediated
ubiquitin-dependent protein catabolic process | −13.2598 | 435 |
4.0×10⁻³⁴ |
| Protein
targeting | −13.1615 | 394 |
1.7×10⁻³³ |
| DNA
replication | −13.0678 | 336 |
2.0×10⁻³² |
| Regulation of
mitotic cell cycle phase transition | −13.0076 | 413 |
6.1×10⁻³³ |
| Regulation of
translation | −12.9471 | 404 |
1.3×10⁻³² |
| Nuclear-transcribed
mRNA catabolic process | −12.8684 | 209 |
2.6×10⁻²⁹ |
| Establishment of
protein localization to membrane | −12.672 | 380 |
2.7×10⁻³¹ |
| Regulation of
cellular amide metabolic process | −12.5776 | 466 |
2.2×10⁻³¹ |
| Viral gene
expression | −12.4686 | 235 |
1.5×10⁻²⁸ |
| Mitotic nuclear
division | −12.4212 | 340 |
7.9×10⁻³⁰ |
| Upregulated | Detection of
chemical stimulus involved in sensory perception | 13.0713 | 392 |
2.2×10⁻³¹ |
| Detection of
chemical stimulus involved in sensory perception of smell | 12.8671 | 352 |
1.7×10⁻³⁰ |
| Detection of
stimulus involved in sensory perception | 12.8423 | 455 |
2.8×10⁻³¹ |
| Detection of
chemical stimulus | 12.5666 | 426 |
4.4×10⁻³⁰ |
| Sensory perception
of smell | 12.3795 | 376 |
6.5×10⁻²⁹ |
In vitro tumor viability under amino acid
depletion
The relationship between methionine and cancer
development was investigated, as shown in Fig. S4A. Methionine deficiency
suppressed tumor viability in Panc10.05, Caski and 293T cells
(Fig. S4B-D). The results
suggested that tumors were underdeveloped in a methionine-deficient
environment.
RNA sequencing of tumors from mice fed
diets excluding methionine/tryptophan/niacin
The relationship between amino acid deficiency and
specific gene expression in vivo was examined (Fig. S5A). RNA sequencing of the tumor
from a mouse (n=1) fed a diet devoid of
methionine/tryptophan/niacin showed increased expression of RN7SL1,
a non-coding RNA (Fig. S5B).
During the experimental period, the maximum tumor volume was 144
mm3 and the maximum tumor diameter was 8 mm. The details
of this RNA sequencing result are shown in Table SVI.
The aforementioned experiment was repeated and RNA
sequencing of MTN(+) (n=1), M(−) (n=2), TN(−) (n=1) and MTN(−)
(n=1) mice was also performed. It was found that mice without
methionine or/and tryptophan or/and niacin [M(−), TN(−) and MTN (−)
mice] tended to have elevated RN7SL1 levels compared with mice
raised on a normal food diet [MTN(+)] (Fig. S5C). During the experimental
period, the maximum tumor volume of the MTN(+) mouse was 100
mm3 and the maximum tumor diameter was 8 mm; the maximum
tumor volume of M(−) mouse 1 was 126 mm3 and the maximum
tumor diameter was 7 mm; the maximum tumor volume of M(−) mouse 2
was 144 mm3 and the maximum tumor diameter was 8 mm; the
maximum tumor volume of TN(−) mouse was 87.5 mm3 and the
maximum tumor diameter was 7 mm; and the MTN(−) mouse had a maximum
tumor volume of 108 mm3 and a maximum tumor diameter of
6 mm.
Mutated SRSF2 in MDS compared with
healthy controls for the percentage of exon 3
In MDS, mutations in SRSF2 increased the percentage
of exon 3 (v1) by an average of 4.2% compared with healthy controls
(healthy vs. SRSF2 mutant, 14.9 vs. 19.1%) and by a median of 5.05%
(healthy vs. SRSF2 mutant, P=0.002; Fig. S6C). This finding indicated that
the splicing of SRP9 is affected by mutations in SRSF2.
Discussion
The present study focused on the localization of
SRP9 and its variants. For this purpose, the 'Hoffman effect'
(9-13) and the relationship between amino
acid deficiency and cancer development is first discussed, then
RN7SL1 (8,23,24), a non-coding RNA that binds to SRP9
and is upregulated in vitro under amino acid deficiency, is
introduced.
A previous study involving animal experiments with
rats has shown that, by depleting various amino acids in the diet,
methionine deficiency inhibits tumor growth at the individual level
and that methionine plays an important role in the development and
progression of cancer (9).
Methionine is an essential amino acid and is the codon that
initiates protein translation from mRNA. Methionine is converted to
SAM, which is required for nucleic acid synthesis in cancer
(10). Tumors are underdeveloped
in a methionine-deficient environment, which is known as the
'Hoffman effect' (9-13). A previous report has shown that
tumor growth is suppressed in the absence of methionine, and
methionine has recently been shown to be essential in cancer stem
cells or 'tumor-initiating cells' (11). Additionally, methionine has been
reported to influence tumor cell metabolism (12), histone patterns and T-cell
immunity in the cancer microenvironment (13). Not only methionine, but also its
upstream pathways have been reported to be involved in cancer
immunity (14) (Fig. 2A). Tryptophan/niacin, which is
located upstream of the methionine cycle, is metabolized to form
nicotinamide, and MNAM is formed from SAM and nicotinamide via
nicotinamide N-methyltransferase (NNMT) (14). NNMT and MNAM have been reported to
participate in the mechanism of inhibition of the apoptosis
signal-regulated kinase 1-p38 MAPK pathway, resulting in increased
colon cancer cell resistance to 5-FU (25). NNMTs promote nicotinamide adenine
dinucleotide depletion and epigenetic reprogramming, which have
been implicated in the development of metabolic plasticity,
circumvention of the major tumor suppressive process of cellular
senescence, acquisition of stem cell properties, resistance to
therapy and poor clinical outcomes (26). Furthermore, MNAM synthesized in
this methionine cycle has been reported to suppress T cells and
promote cancer (15).
Therefore, in the present study, the HT-29 human
colon cancer cell line cultured in a normal medium with all
nutrients was implanted into NOD SCID mice, which were maintained
for 2 weeks on a diet without methionine/tryptophan/niacin. The
tumors of these mice were then removed and RNA sequencing was
performed. A marked increase in the expression of RN7SL1, a
noncoding RNA, was observed in the tumor. The RN7SL1 variant termed
'RN7SL327P' was also upregulated in SRP9 v1 and v2 transfected
cells subjected to RIP sequencing. A previous study at another
institution found that co-culturing breast cancer cells with
stromal fibroblasts resulted in the stromal fibroblasts releasing
RN7SL1 contained in exosomes, which were transported to the cancer
cells, resulting in tumor growth (8). RN7SL1 has also been reported to have
a reliable clinical performance for hepatocellular carcinoma
diagnosis and prognosis (23). It
has been reported that CAR-T cells transduce RN7SL1 into
extracellular vesicles and activate RIG-I, and that transfection of
immune-competent mice with tumor cells overexpressing RN7SL1 leads
to increased activation of RIG-I/MDA5 by immune cells and improved
survival rather than tumor growth (24). Therefore, this is still a highly
controversial topic.
Previously, we attempted to localize RN7SL1.
However, single-cell analysis is difficult due to RN7SL1 being a
non-coding RNA and not having a 3′-UTR poly A tail sequence.
Furthermore, in situ hybridization is difficult as RN7SL1
contains an Alu domain. Therefore, the present study focused on
proteins that are thought to bind to RN7SL1, which is divided into
Alu and S domains, with the Alu domain binding to SRP9/14 and the S
domain binding to SRP19/54/68/72 (1). Of these, high SRP9 expression tends
to be related to a worse OS in patients with pancreatic cancer,
according to the Human Protein Atlas database (https://www.proteinatlas.org/ENSG00000143742-SRP9/pathology/pancreatic+cancer).
The group with high SRP72 expression had a significantly worse OS
(https://www.proteinatlas.org/ENSG00000174780-SRP72/pathology/pancreatic+cancer).
Additionally, no significant differences regarding the other SRP
families [SRP9/14 (https://www.proteinatlas.org/ENSG00000140319-SRP14/pathology/pancreatic+cancer)/19
(https://www.proteinatlas.org/ENSG00000153037-SRP19/pathology/pancreatic+cancer)/54
(https://www.proteinatlas.org/ENSG00000100883-SRP54/pathology/pancreatic+cancer)/68
(https://www.proteinatlas.org/ENSG00000167881-SRP68/pathology/pancreatic+cancer)]
were observed between the two expression groups. Regarding the
relationship between SRP9 and tumors, a previous report on
colorectal cancer reported that SRP9 acts in a tumor proliferative
manner (4), and a report on
breast cancer showed that when tumor tissue and surrounding normal
breast tissue were collected from patients undergoing breast cancer
surgery, SRP9 expression was higher in the tumor cells (2).
Although the GeneCards database (https://www.genecards.org/cgi-bin/carddisp.pl?gene=SRP9)
shows that SRP9 is predominantly found in the cytoplasm, its
localization in the tumor microenvironment has not yet, to the best
of our knowledge, been clarified. The present study examined SRP9
in detail and its relationship with patient prognosis using
clinical data. Notably, in pancreatic cancer, the group with
>50% nuclear staining at the tumor site had a significantly
better RFS than the group with <50%. Next, cell immunostaining
was performed to determine the nuclear translocation rate,
referring to previous reports of DsRed incorporated into yeast
plasmid vectors and overlapping with DAPI (27) and a subsequent study examining
nuclear β-catenin translocation (28). Furthermore, the present study
confirmed that the nuclear translocation rate of SRP9 was
significantly reduced by methionine/niacin/tryptophan deficiency.
When integrating these results with the immunohistochemistry
results, it would appear that RFS is poor under a low nuclear
transfer rate, that is, amino acid deficiency, which may not be
consistent with the traditionally accepted Hoffman effect. However,
in vitro experiments and experiments using human specimens,
in which various factors overlap, can produce opposite results. In
other words, it is true that nuclear translocation of SRP9 protein
is closely related to the prognosis of patients with pancreatic
cancer, but this cannot be explained simply by the involvement of
methionine alone, suggesting that multiple factors are involved in
the phenomenon of nuclear translocation of SRP9 protein in
pancreatic cancer cells. Indeed, a cohort study conducted in Sweden
suggested that higher methionine intake may reduce the risk of
pancreatic cancer (29). In
another meta-analysis, a non-significant borderline risk reduction
(risk ratio=0.81; 95% confidence interval, 0.62-1.01) was found in
the overall population for methionine intake and risk of developing
pancreatic cancer, but no association was observed in any subgroup
by study design, region or number of cases (30). The Hoffman effect is well known
and important, but it should be noted that it is but one aspect of
the in vitro story. For example, hypothetically, cancer
cells themselves could deplete methionine and reduce biological
malignant traits such as cell proliferation, but at the individual
patient level, methionine depletion would be expected to be
involved not only in immune responses but also in sarcopenic
responses, such as glucose metabolism and even stromal and muscle
metabolism. In addition, with regards to the nuclear translocation
of SRP9, while amino acids such as methionine are certainly
involved, multiple other factors are involved in the nuclear
translocation phenomenon. Although it may be shortsighted, in the
present study, the PNI was also measured as a simple preoperative
nutritional indicator using lymphocyte and albumin levels for
patients with pancreatic cancer who underwent immunohistochemistry,
and no significant difference was found between the two groups,
nuclear staining ≤50% and nuclear staining >50%. These results
indicated that the prognostic change in the nuclear translocation
rate was not simply due to the nutritional index of the patient but
to functional changes in SRP9 molecules that have translocated to
the nucleus.
Subsequently, the present study focused on two
variants of SRP9, v1 and v2. The results indicated that there were
no notable splicing effects by depleting
methionine/niacin/tryptophan, as aforementioned. Transfection of
plasmids incorporating genes of v1 and v2 and the common parts of
v1 and v2 into a number of pancreatic cancer cell lines confirmed
the nuclear translocation of SRP9. This suggested that the common
parts of v1 and v2, exon1 and exon2, contained coding regions
important for nuclear translocation. In addition, there appeared to
be slightly less SRP9 staining in v1 and the common parts of v1 and
v2, which may be due to v2 being more dominant than v1.
Since both v1 and v2 were found to be nuclear
translocating molecules, RIP sequencing was subsequently performed
in the present study using cells transfected with either variant
(Fig. 4A). The results showed
that genes and pathways involved in protein translation were
downregulated by nuclear migration in both RIP1 and RIP2. A
previous report showed that SRP complexes, including RN7SL1, bind
to ribosomes and carry them to translocons in the endoplasmic
reticulum membrane to transport synthesized proteins to target
cells (31), and that this
function is inhibited by translocation into the nucleus. Therefore,
in the present study, amino acid deficiency may have suppressed
nuclear translocation of SRP9 in an attempt to promote translation
and may have also increased RN7SL1 expression, which binds to SRP9
and is responsible for translation, by a feedback mechanism.
Additionally, both RIP1 and RIP2 downregulated pathways were
involved in cancer progression, and this finding was consistent
with the SRP9 immunohistochemistry results, in which the nuclear
staining >50% group had significantly better RFS than the
nuclear staining ≤50% group. Consistent with the GSEA analysis,
c-Myc (32), E2F-1 (33), G2M checkpoint (34), oxidative phosphorylation (35), unfolded protein response (36) and KRAS mutation (37) have been reported to be associated
with pathways in pancreatic cancer development.
There are two limitations to the present study.
First, the immunohistochemistry of pancreatic cancer in Fig. 1, which was the origin of the
study, was limited to cases that had not been treated
preoperatively, in favor of ease of pathological evaluation. Future
studies are needed to determine the diagnostic value of SRP9
translocation in cases treated with preoperative chemotherapy or
preoperative radiation chemotherapy. Second, the present study
showed that SRP9 nuclear translocation is suppressed under amino
acid deficiency, and that the coding region important for nuclear
translocation may be located in exons 1 and 2, the common part of
v1 and v2, but the detailed mechanism of nuclear translocation
remains to be elucidated.
In conclusion, in the present study,
immunohistochemical staining of SRP9 in pancreatic cancer
specimens, a protein that binds to RN7SL1, showed that the RFS of
patients was significantly improved when the nuclear translocation
rate was >50% at the tumor site. In addition, amino acid
(methionine/niacin/tryptophan) deficiency reduced the nuclear
translocation rate. There are two variants of SRP9, v1 and v2.
However, splicing was not significantly affected by amino acid
deletion, and the common parts of v1 and v2, exons 1 and 2, contain
coding regions important for nuclear translocation. Additionally,
the RIP sequencing results obtained following nuclear translocation
of the v1 and v2 plasmids showed that both plasmids downregulated
the genes/pathways related to protein translation and the pathways
involved in cancer progression. However, further studies on the
mechanism of SRP9 nuclear translocation and its detailed function
are needed.
Supplementary Data
Availability of data and materials
The RIP and RNA sequencing data generated in the
present study may be found in the Gene Expression Omnibus
repository under accession numbers GSE246628, GSE256049, and
GSE256061. All other data generated in the present study may be
requested from the corresponding author.
Authors' contributions
HS, SM, KS, SK, KK, SU, KO, TS, YD, HE, TH and HI
made substantial contributions to conception and design. HS, SM,
KS, SK, KK, YTs, YA, YS, YI, DY, YTo, TN, HT, DM, KO, TS, YD, HE,
TH and HI acquired the data. HS, SM, KS, SK, KK, YTs, YI, DY, YTo,
TN, HT, DM, YD, HE, TH and HI analyzed and interpreted the data.
HS, SM, TH and HI confirmed the authenticity of all the raw data.
HS, SM, KK, YTs, YA, YS, DM, KO, TH and HI performed the research.
HS, SM, KK, TH and HI evaluated the percentage of nuclear staining
in the immunohistochemistry. HS, SM, SU, KO, TH and HI wrote the
manuscript. HS, SM, KS, SK, YI, DY, YTo, TN, HT, DM, SU, KO, TS,
YD, HE, TH and HI revised the manuscript. KS, SK, SU, TS, YD, HE,
TH and HI supervised the work. All authors read and approved the
final version of the manuscript.
Ethics approval and consent to
participate
This study was approved by the Research Ethics
Committee of Osaka University (Osaka, Japan; approval no. 23158).
Informed consent was obtained from all subjects involved in the
study.
Patient consent for publication
Written informed consent has been obtained from the
patients to publish this paper.
Competing interests
Partial institutional endowments were received from
Hirotsu Bio Science, Inc. (Tokyo, Japan); Kinshu-kai Medical
Corporation (Osaka, Japan); Kyowa-kai Medical Corporation (Osaka,
Japan); IDEA Consultants, Inc. (Tokyo, Japan); and Unitech Co.,
Ltd. (Chiba, Japan). KO is an employee of IDEA Consultants, Inc.
The remaining authors declare that they have no competing
interests.
Acknowledgements
Not applicable.
Funding
This work was supported in part by a Grant-in-Aid for Scientific
Research from the Ministry of Education, Culture, Sports, Science
and Technology [grant nos. 17cm0106414h0002, JP21lm0203007,
18KK0251, 19K22658, 20H00541, 21K19526, 22H03146, 22K19559,
23K19505 and 16H06279 (PAGS)]. Partial support was also offered by
the Mitsubishi Foundation (grant no. 2021-48) to HI.
References
|
1
|
Kellogg MK, Tikhonova EB and Karamyshev
AL: Signal recognition particle in human diseases. Front Genet.
13:8980832022. View Article : Google Scholar : PubMed/NCBI
|
|
2
|
Erdogan G, Trabulus DC, Talu CK and Guven
M: Investigation of SRP9 protein expression in breast cancer. Mol
Biol Rep. 49:531–537. 2022. View Article : Google Scholar
|
|
3
|
Rho JH, Qin S, Wang JY and Roehrl MH:
Proteomic expression analysis of surgical human colorectal cancer
tissues: Up-regulation of PSB7, PRDX1, and SRP9 and hypoxic
adaptation in cancer. J Proteome Res. 7:2959–2972. 2008. View Article : Google Scholar : PubMed/NCBI
|
|
4
|
Zhang M, Peng Y, Yang Z, Zhang H, Xu C,
Liu L, Zhao Q, Wu J, Wang H and Liu J: DAB2IP down-regulates
HSP90AA1 to inhibit the malignant biological behaviors of
colorectal cancer. BMC Cancer. 22:5612022. View Article : Google Scholar : PubMed/NCBI
|
|
5
|
Hessel EV, de Wit M, Wolterink-Donselaar
IG, Karst H, de Graaff E, van Lith HA, de Bruijn E, de Sonnaville
S, Verbeek NE, Lindhout D, et al: Identification of Srp9 as a
febrile seizure susceptibility gene. Ann Clin Transl Neurol.
1:239–250. 2014. View Article : Google Scholar
|
|
6
|
Bovia F, Fornallaz M, Leffers H and Strub
K: The SRP9/14 subunit of the signal recognition particle (SRP) is
present in more than 20-fold excess over SRP in primate cells and
exists primarily free but also in complex with small cytoplasmic
Alu RNAs. Mol Biol Cell. 6:471–484. 1995. View Article : Google Scholar : PubMed/NCBI
|
|
7
|
Berger A, Ivanova E, Gareau C, Scherrer A,
Mazroui R and Strub K: Direct binding of the Alu binding protein
dimer SRP9/14 to 40S ribosomal subunits promotes stress granule
formation and is regulated by Alu RNA. Nucleic Acids Res.
42:11203–11217. 2014. View Article : Google Scholar : PubMed/NCBI
|
|
8
|
Nabet BY, Qiu Y, Shabason JE, Wu TJ, Yoon
T, Kim BC, Benci JL, DeMichele AM, Tchou J, Marcotrigiano J and
Minn AJ: Exosome RNA unshielding couples stromal activation to
pattern recognition receptor signaling in cancer. Cell. 170:352–366
e13. 2017. View Article : Google Scholar : PubMed/NCBI
|
|
9
|
Sugimura T, Birnbaum SM, Winitz M and
Greenstein JP: Quantitative nutritional studies with water-soluble,
chemically defined diets. VIII. The forced feeding of diets each
lacking in one essential amino acid. Arch Biochem Biophys.
81:448–455. 1959. View Article : Google Scholar : PubMed/NCBI
|
|
10
|
Kaiser P: Methionine dependence of cancer.
Biomolecules. 10:5682020. View Article : Google Scholar : PubMed/NCBI
|
|
11
|
Wang Z, Yip LY, Lee JHJ, Wu Z, Chew HY,
Chong PKW, Teo CC, Ang HY, Peh KLE, Yuan J, et al: Methionine is a
metabolic dependency of tumor-initiating cells. Nat Med.
25:825–837. 2019. View Article : Google Scholar : PubMed/NCBI
|
|
12
|
Gao X, Sanderson SM, Dai Z, Reid MA,
Cooper DE, Lu M, Richie JP Jr, Ciccarella A, Calcagnotto A, Mikhael
PG, et al: Dietary methionine influences therapy in mouse cancer
models and alters human metabolism. Nature. 572:397–401. 2019.
View Article : Google Scholar : PubMed/NCBI
|
|
13
|
Bian Y, Li W, Kremer DM, Sajjakulnukit P,
Li S, Crespo J, Nwosu ZC, Zhang L, Czerwonka A, Pawłowska A, et al:
Cancer SLC43A2 alters T cell methionine metabolism and histone
methylation. Nature. 585:277–282. 2020. View Article : Google Scholar : PubMed/NCBI
|
|
14
|
Tatekawa S, Ofusa K, Chijimatsu R,
Vecchione A, Tamari K, Ogawa K and Ishii H: Methylosystem for
cancer sieging strategy. Cancers (Basel). 13:50882021. View Article : Google Scholar : PubMed/NCBI
|
|
15
|
Kilgour MK, MacPherson S, Zacharias LG,
Ellis AE, Sheldon RD, Liu EY, Keyes S, Pauly B, Carleton G, Allard
B, et al: 1-Methylnicotinamide is an immune regulatory metabolite
in human ovarian cancer. Sci Adv. 7:eabe11742021. View Article : Google Scholar : PubMed/NCBI
|
|
16
|
Pellagatti A, Armstrong RN, Steeples V,
Sharma E, Repapi E, Singh S, Sanchi A, Radujkovic A, Horn P,
Dolatshad H, et al: Impact of spliceosome mutations on RNA splicing
in myelodysplasia: Dysregulated genes/pathways and clinical
associations. Blood. 132:1225–1240. 2018. View Article : Google Scholar : PubMed/NCBI
|
|
17
|
Figg JW, Barajas JM and Obeng EA:
Therapeutic approaches targeting splicing factor mutations in
myelodysplastic syndromes and acute myeloid leukemia. Curr Opin
Hematol. 28:73–79. 2021. View Article : Google Scholar : PubMed/NCBI
|
|
18
|
Wang E, Pineda JMB, Kim WJ, Chen S,
Bourcier J, Stahl M, Hogg SJ, Bewersdorf JP, Han C, Singer ME, et
al: Modulation of RNA splicing enhances response to BCL2 inhibition
in leukemia. Cancer Cell. 41:164–180 e8. 2023. View Article : Google Scholar :
|
|
19
|
Rahman MA, Lin KT, Bradley RK, Abdel-Wahab
O and Krainer AR: Recurrent SRSF2 mutations in MDS affect both
splicing and NMD. Genes Dev. 34:413–427. 2020. View Article : Google Scholar : PubMed/NCBI
|
|
20
|
Yang Q, Zhao J, Zhang W, Chen D and Wang
Y: Aberrant alternative splicing in breast cancer. J Mol Cell Biol.
11:920–929. 2019. View Article : Google Scholar : PubMed/NCBI
|
|
21
|
Nanjo S, Wu W, Karachaliou N, Blakely CM,
Suzuki J, Chou YT, Ali SM, Kerr DL, Olivas VR, Shue J, et al:
Deficiency of the splicing factor RBM10 limits EGFR inhibitor
response in EGFR-mutant lung cancer. J Clin Invest.
132:e1450992022. View Article : Google Scholar : PubMed/NCBI
|
|
22
|
Wan L, Lin KT, Rahman MA, Ishigami Y, Wang
Z, Jensen MA, Wilkinson JE, Park Y, Tuveson DA and Krainer AR:
Splicing Factor SRSF1 promotes pancreatitis and KRASG12D-mediated
pancreatic cancer. Cancer Discov. 13:1678–1695. 2023. View Article : Google Scholar : PubMed/NCBI
|
|
23
|
Tan C, Cao J, Chen L, Xi X, Wang S, Zhu Y,
Yang L, Ma L, Wang D, Yin J, et al: Noncoding RNAs serve as
diagnosis and prognosis biomarkers for hepatocellular carcinoma.
Clin Chem. 65:905–915. 2019. View Article : Google Scholar : PubMed/NCBI
|
|
24
|
Johnson LR, Lee DY, Eacret JS, Ye D, June
CH and Minn AJ: The immunostimulatory RNA RN7SL1 enables CAR-T
cells to enhance autonomous and endogenous immune function. Cell.
184:4981–4995 e14. 2021. View Article : Google Scholar : PubMed/NCBI
|
|
25
|
Xie X, Liu H, Wang Y, Zhou Y, Yu H, Li G,
Ruan Z, Li F, Wang X and Zhang J: Nicotinamide N-methyltransferase
enhances resistance to 5-fluorouracil in colorectal cancer cells
through inhibition of the ASK1-p38 MAPK pathway. Oncotarget.
7:45837–45848. 2016. View Article : Google Scholar : PubMed/NCBI
|
|
26
|
Novak Kujundzic R, Prpic M, Dakovic N,
Dabelić N, Tomljanović M, Mojzeš A, Fröbe A and Trošelj KG:
Nicotinamide N-Methyltransferase in acquisition of stem cell
properties and therapy resistance in cancer. Int J Mol Sci.
22:56812021. View Article : Google Scholar : PubMed/NCBI
|
|
27
|
Rodrigues F, van Hemert M, Steensma HY,
Corte-Real M and Leao C: Red fluorescent protein (DsRed) as a
reporter in Saccharomyces cerevisiae. J Bacteriol. 183:3791–3794.
2001. View Article : Google Scholar : PubMed/NCBI
|
|
28
|
Kimura A, Toda Y, Matsumoto Y, Yamamoto H,
Yahiro K, Shimada E, Kanahori M, Oyama R, Fukushima S, Nakagawa M,
et al: Nuclear β-catenin translocation plays a key role in
osteoblast differentiation of giant cell tumor of bone. Sci Rep.
12:134382022. View Article : Google Scholar
|
|
29
|
Larsson SC, Giovannucci E and Wolk A:
Methionine and vitamin B6 intake and risk of pancreatic cancer: A
prospective study of Swedish women and men. Gastroenterology.
132:113–118. 2007. View Article : Google Scholar : PubMed/NCBI
|
|
30
|
Wei DH and Mao QQ: Vitamin B6, vitamin B12
and methionine and risk of pancreatic cancer: A meta-analysis. Nutr
J. 19:1112020. View Article : Google Scholar : PubMed/NCBI
|
|
31
|
Kellogg MK, Miller SC, Tikhonova EB and
Karamyshev AL: SRPassing Co-translational Targeting: The role of
the signal recognition particle in protein targeting and mRNA
protection. Int J Mol Sci. 22:62842021. View Article : Google Scholar : PubMed/NCBI
|
|
32
|
Ala M: Target c-Myc to treat pancreatic
cancer. Cancer Biol Ther. 23:34–50. 2022. View Article : Google Scholar : PubMed/NCBI
|
|
33
|
Peng YP, Zhu Y, Yin LD, Zhang JJ, Wei JS,
Liu X, Liu XC, Gao WT, Jiang KR and Miao Y: PEG10 overexpression
induced by E2F-1 promotes cell proliferation, migration, and
invasion in pancreatic cancer. J Exp Clin Cancer Res. 36:302017.
View Article : Google Scholar : PubMed/NCBI
|
|
34
|
Oshi M, Patel A, Le L, Tokumaru Y, Yan L,
Matsuyama R, Endo I and Takabe K: G2M checkpoint pathway alone is
associated with drug response and survival among cell
proliferation-related pathways in pancreatic cancer. Am J Cancer
Res. 11:3070–3084. 2021.PubMed/NCBI
|
|
35
|
Ashton TM, McKenna WG, Kunz-Schughart LA
and Higgins GS: Oxidative phosphorylation as an emerging target in
cancer therapy. Clin Cancer Res. 24:2482–2490. 2018. View Article : Google Scholar : PubMed/NCBI
|
|
36
|
Long D, Chen K, Yang Y and Tian X:
Unfolded protein response activated by endoplasmic reticulum stress
in pancreatic cancer: Potential therapeutical target. Front Biosci
(Landmark Ed). 26:1689–1696. 2021. View
Article : Google Scholar
|
|
37
|
Luo J: KRAS mutation in pancreatic cancer.
Semin Oncol. 48:10–18. 2021. View Article : Google Scholar : PubMed/NCBI
|
|
38
|
Brierley J, Gospodarowicz MK and Wittekind
C: TNM Classification of Malignant Tumours. Wiley Blackwell;
Hoboken, NJ: 2017
|