Introduction
Bladder cancer (BC) is a major health concern
worldwide, with an estimated 429,000 new cases leading to 165,000
deaths in 2012 (1). At initial
diagnosis, 70–75% of bladder cancers are classified as
non-muscle-invasive urothelial cell carcinomas, i.e., tumors of
urothelial origin confined to the mucosa or submucosa (2). The standard treatment for these lesions
is endoscopic removal of the malignant tissue, referred to as
transurethral resection of the bladder (TURB). A white-light (WL)
cystoscope is commonly used during TURB to visualize the tumors. WL
cystoscopy is sufficient for the detection of exophytic tumors, but
small papillary tumors and flat tumors, such as carcinoma in
situ (CIS), are often missed during the procedure, leading to
underdiagnosis and, eventually, recurrence and progression
(3). To overcome this problem,
different compounds have been clinically tested for their capacity
to efficiently photodiagnose bladder tumors, including
tetracycline, hypericin, Photofrin®, 5-aminolevulinic
acid and its hexyl ester hexaminolevulinate (HAL,
Hexvix®/Cysview®) (4). HAL-based detection of bladder tumors
has been shown to be most efficient and, therefore, is the compound
of choice when performing photodynamic diagnosis (PDD) for the
detection of bladder tumors (5).
Different studies have indicated that PDD following instillation of
tumoritropic (pro-) fluorescent compounds improves the detection of
tumors in clinical practice (6,7). Despite
the proven efficacy of PDD and recommendations by experts when CIS
or high-grade tumors are suspected (8), WL cystoscopy remains the technique
routinely used in urological clinics. This is mainly due to the
costly, specialized equipment that is required to perform PDD.
A possible alternative to PDD may be using a
tumoritropic dye with an intense color in combination with WL
cystoscopy. Such a compound, Evans blue (EB) dye, was previously
investigated in vitro and in vivo. In a study by
Roelants et al (9), the
accumulation of EB was significantly higher in spheroids composed
of malignant urothelial cells compared with that in spheroids
derived from normal human urothelial cells. Elsen et al
(10) investigated the accumulation
of EB in an orthotopic rat non-muscle-invasive bladder cancer
(NMIBC) model. The biodistribution of EB was examined in the
different layers of healthy rat bladders and rat bladders bearing a
malignant urothelium by quantifying the fluorescence of EB. It was
concluded that EB is selectively taken up by tumor tissue when
using a 1 mM instillation concentration, and that this specific
accumulation is possibly due to urothelial defects in tumor rat
bladders.
In the present study, the feasibility of using EB
for the detection of NMIBC in the orthotopic rat model was further
investigated. WL stereomicroscopy was applied at a low
magnification to visually inspect the accumulation of EB in the
malignant and normal inner bladder wall, and the amount of EB
present in homogenates of tumor bladders and healthy bladders was
quantified. Furthermore, the amount of EB present in the plasma
following intravesical instillation was investigated, as were the
possible histological adverse effects of repeated EB instillations.
The rat NMIBC tumor model was characterized in more detail by a
transcriptome analysis of malignant and normal rat urothelium, with
a specific focus on cell adhesion. The aim of this analysis was to
further investigate our previous hypothesis (10) that EB is able to selectively
accumulate in tumor tissue due to defects in the urothelial
barrier.
Materials and methods
Orthotopic AY-27 rat bladder tumor
model
A total of 51 female Fisher rats (F-344), aged 10
weeks and weighing 160–200 g, were used in all the experiments
(Charles River Laboratories, Lyon, France). All animal procedures
were performed in compliance with national and European regulations
and were approved by the Animal Care and Ethics Committee of the
University of Leuven (approval no. 142/2014). AY-27 cells were used
for tumor implantation experiments. Details regarding the
catheterization of animals and the tumor inoculation procedure were
previously described by our group (10). All the experiments were performed 2
days after the inoculation of AY-27 cells into the rat bladder. At
this timepoint, high-grade CIS was present, as confirmed by
histological analysis (10).
Accumulation of EB in rat bladders and
plasma following intravesical instillation
EB administration and stereomicroscopical
inspection of inner wall of rat bladder
Following sedation and catheterization of the
animals, the EB solution (0.3 ml) was instilled in the bladders.
Two conditions were tested: 1 mM EB instillation over 2 h and 5 mM
EB instillation over 1 h in healthy rats (n=5 per condition) and
rats with bladder tumors (n=5 per condition). After instillation,
the rat bladders were thoroughly flushed with phosphate-buffered
saline (PBS). The rats were then euthanized, the bladders were
rapidly dissected and the inner wall was visually inspected for
blue dye accumulation using WL stereomicroscopy (Leica MZ10 F;
Leica Microsystems GmbH, Wetzlar, Germany). Pictures were captured
with a DFC310 FX digital camera. Afterwards, the bladders were
extracted (see below).
Blood sampling
Immediately after instillation, the bladders were
flushed thoroughly and blood was collected via the tail vein of
living animals using a wing needle. The tubes were subsequently
centrifuged at 380 × g for 15 min. Three hours after the first
blood sampling, blood was collected a second time and
processed.
Quantification of EB
The extraction procedure of bladder and blood
samples was based on the method described by Gardner (11) using naphtol blue black as an internal
standard. The residues of the samples were redissolved in ultrapure
water (Milli-Q®; Merck Millipore, Darmstadt, Germany)
and processed using the LaChrom Elite High Performance Liquid
Chromatography (HPLC) system (VWR Hitachi; Hitachi, Tokyo, Japan)
equipped with diode array detection (L-2450). Chromatographic
separation was performed on a Phenomenex reversed phase column,
type Luna 3u C18 (150×4.6 mm, 3 µm) attached to a Phenomenex guard
column C18 (4×3 mm; Phenomenex, Torrance, CA, USA). The column was
operated at a flow rate of 1 ml/min at 40°C (detection wavelength,
614 nm). Acetonitrile:phosphate buffer (pH 7, 0.067 M; 45:55) with
2 mM tetrabutylammonium dihydrogen phosphate was used as the mobile
phase.
Statistical analysis
Results are expressed as means ± standard error of
the mean. To compare the concentration of EB under different
conditions, a non-parametric Mann-Whitney U test was performed
using GraphPad Prism software (GraphPad, La Jolla, CA, USA). The
significance level was set at 0.05.
Repeated intravesical instillation of EB
Healthy rats were instilled with EB solutions for 7
consecutive days during 1 h. Concentrations of 1 and 5 mM were
tested, whereas PBS instillations served as control (n=3 per
condition). Each day, the rats were anesthetized and catheterized,
as previously described. After the last instillation on day 7, the
rats were euthanized, the bladders were removed, cut open and
immediately transferred into Tissue Tek medium (Miles Inc., Elkart,
IN, USA). Consequently, the bladders were snap-frozen in
isopentane-cooled liquid nitrogen and cryostat bladder sections
were blindly analyzed by a trained histopathologist.
RNA sequencing experiment
Specimen collection and laser capture
microdissection (LCM)
Healthy rats (n=4) and rats bearing a malignant
urothelium (n=6) were euthanized, the bladders were dissected, cut
open and immediately embedded into Tissue Tek medium (Miles Inc.).
The bladders were then snap-frozen in isopentane-cooled liquid
nitrogen. Cryostat microtomy was performed to obtain 10-µm bladder
sections that were mounted onto DNAse- and RNAse-free polyethylene
terephthalate membrane-coated metal frame slides (1.4 µm, Leica
Microsystems GmbH). Immediately prior to performing LCM, the
cryosections were stained with standard hematoxylin and eosin
staining. Urothelial tissue was microdissected using a Leica
DM60000B microscope (Leica Microsystems GmbH). The lasered
fragments were captured on the cap of 200-µl polymerase chain
reaction tubes (Greiner Bio-One, Vilvoorde, Belgium), filled with
25 µl RLT plus buffer (Qiagen, Antwerp, Belgium) + 1%
2-mercaptoethanol. For each rat, four cryosections were
microdissected.
RNA extraction, sequencing and data analysis
Microdissected tissue from the same rats was pooled
together, after which time RNA was extracted according to the
protocol described in the RNeasy Plus microkit (Qiagen). Per
sample, 1 ng of total RNA was used as input for the SMART-Seq v4
Ultra Low Input RNA protocol (version ‘040215’) from Clontech
Laboratories Inc. (Mountain View, CA, USA). Subsequently, 1 ng of
purified cDNA was sheared to 300 bp using the Covaris M220
Focused-ultrasonicator (Woburn, MA, USA). Sequencing libraries of
each sample were finally equimolarly pooled and sequenced on
½NextSeq500 flow-cell at 1×75 bp. After cleaning and adapter
removal, preprocessed reads were mapped to the Rattus
norvegicus reference genome (rnor50) with Tophat v2.0.13
software (https://ccb.jhu.edu/software/tophat/index.shtml). The
number of reads in the alignment, overlapping with gene
characteristics, were counted using the featureCounts 1.4.6 program
(http://subread.sourceforge.net/)
(12). Subsequently, genes with less
than one count-per-million were removed and normalization was
performed for GC content, library size and RNA composition using
the EDASeq package from Bioconductor (Copenhagen, Denmark)
(13). Principal component analysis
was conducted to identify expression patterns in the dataset. To
obtain the differentially expressed genes between the two
conditions, statistical comparative analysis was performed with
EdgeR 3.4.0 (Bioconductor) (14).
The resulting P-values were corrected for multiple testing with
Benjamini-Hochberg to control the false discovery rate (FDR)
(15). Results are presented as
log2 fold change and a FDR P-value <0.05 was
considered to indicate statistically significant differences. Genes
with a log2-ratio <-1 and >1 were considered as
down- and upregulated, respectively.
Functional enrichment analysis
In order to convert the dataset into more
biologically interpretable data, a functional enrichment analysis
was performed. Since pathways in rats are poorly annotated and the
majority of databases are made for human genes, the putative
orthologous genes in human were extracted for the 14,115 genes
annotated in the rat genome used for the statistical analysis. A
total of 10,740 orthologous genes were obtained using one-to-one
orthologous relationship from Ensembl (BioMart Portal v0.9;
http://www.ensembl.org/index.html). The
gene enrichment analysis was performed online with WebGestalt
(WEB-based Gene SeT AnaLysis Toolkit; http://bioinfo.vanderbilt.edu/webgestalt/) using our
sets of differentially expressed genes. The pathway analysis was
performed using the annotated pathways of the Kyoto Encyclopedia of
Genes and Genomes (KEGG) database, with a default significance
level of 0.05 (FDR-corrected P-values).
Results
Accumulation of EB in rat bladders and
plasma following intravesical instillation
Visual inspection of inner wall of rat
bladder
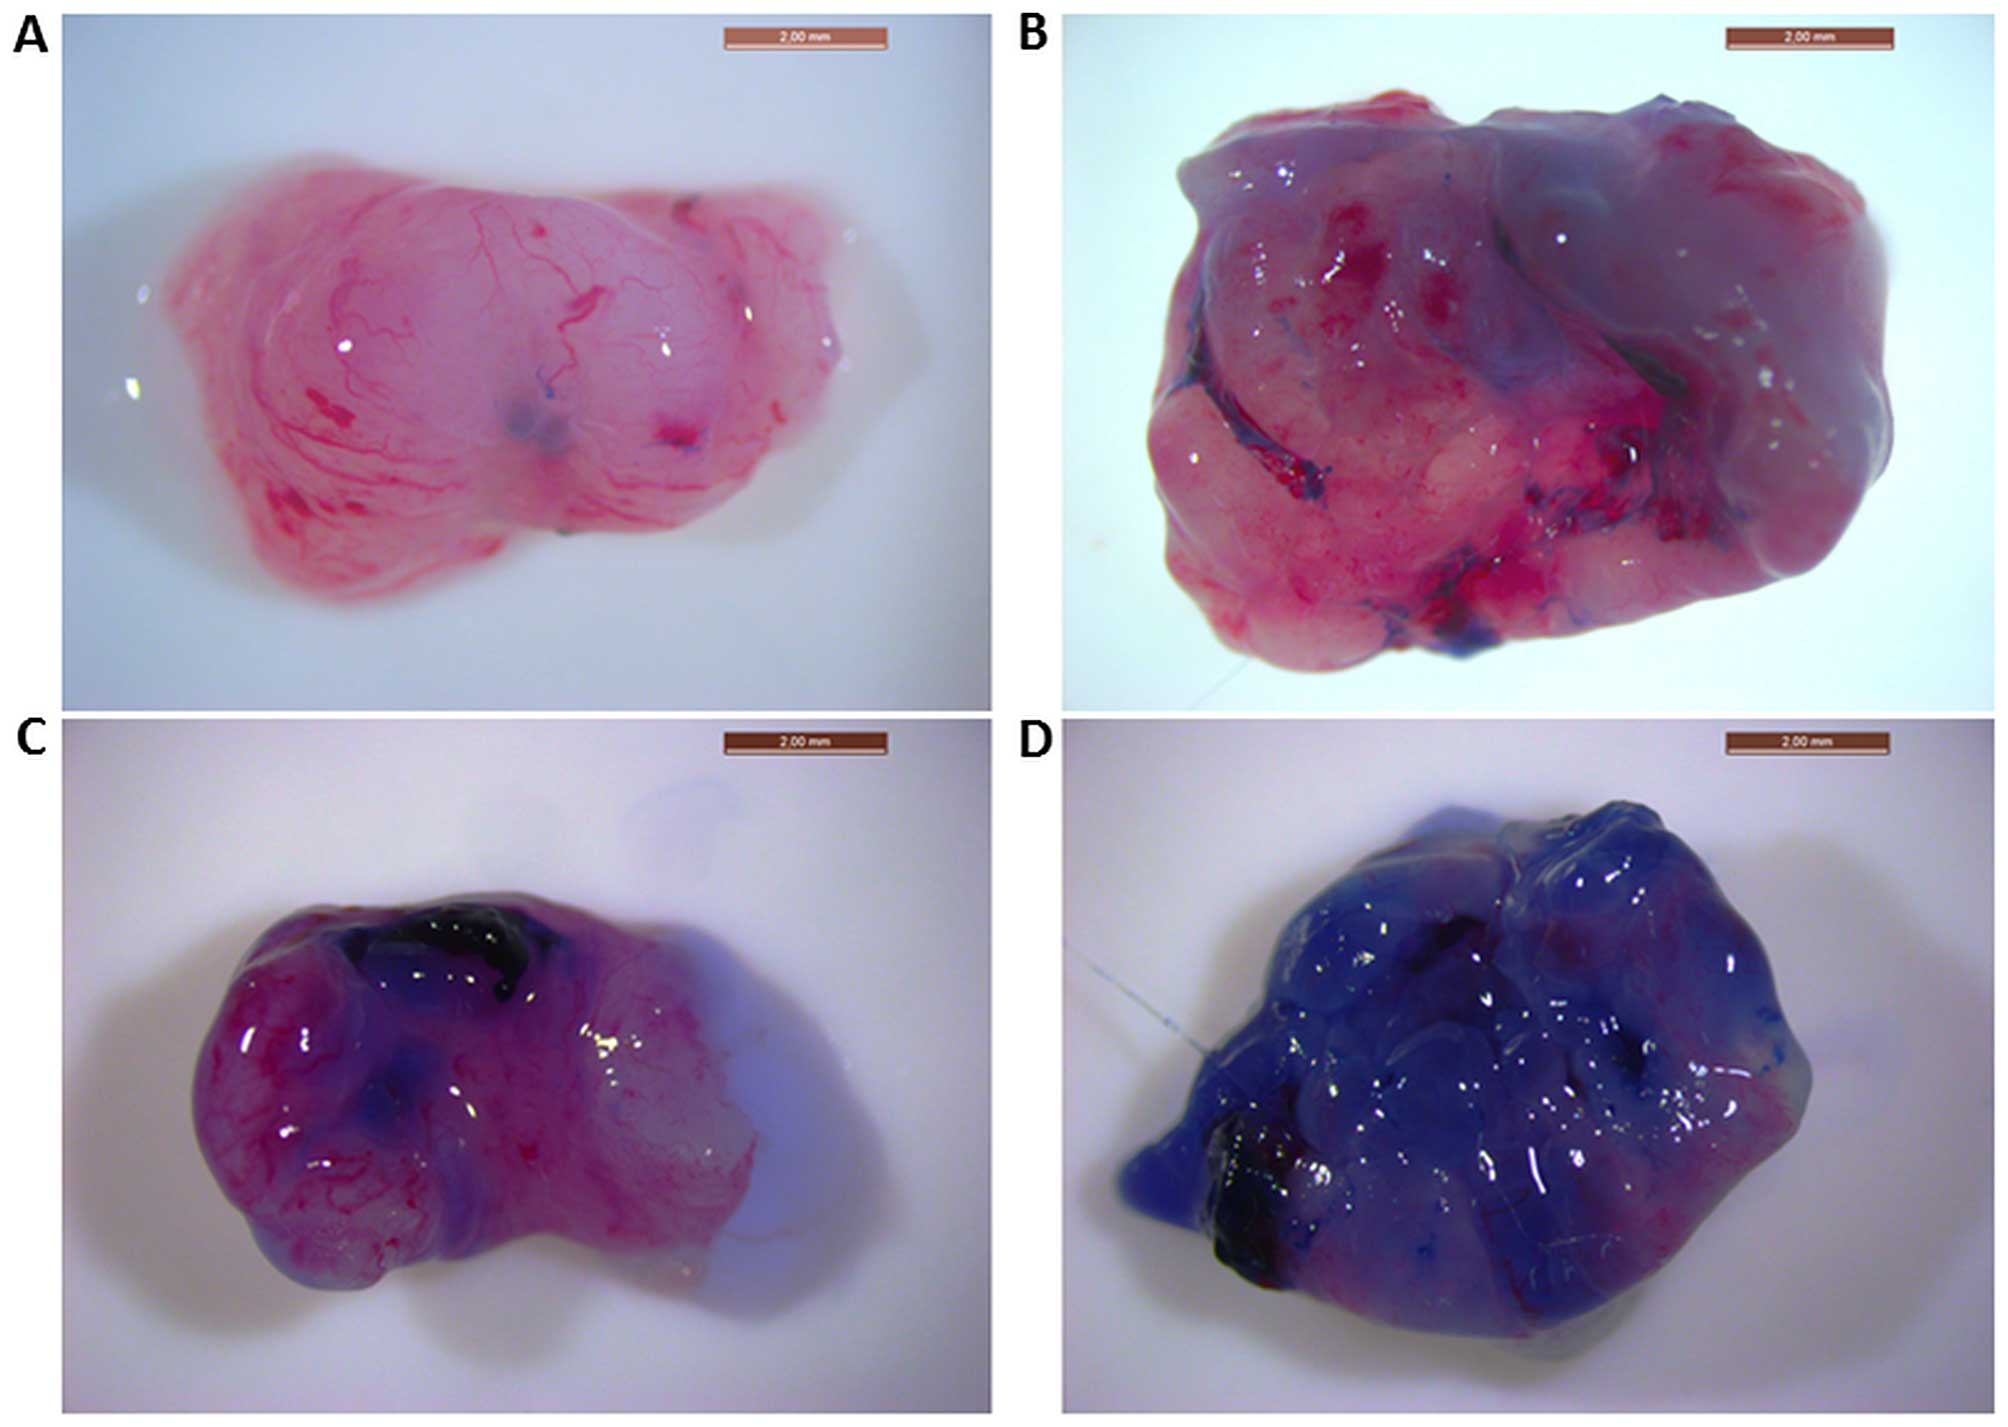
Representative images of the inner wall of rat
bladders following instillations of 1 mM EB for 2 h and 5 mM EB for
1 h, as visualized by WL stereomicroscopy, are shown in Fig. 1. In healthy bladders instilled with
the lowest concentration of EB, the blue staining is almost
non-existent (Fig. 1A), while a
clear blue, non-homogeneous staining is visible in the tumor
bladders (Fig. 1B). Healthy bladders
instilled with the highest concentration exhibited some
non-specific blue staining (Fig.
1C), whereas tumor bladders exhibited an intense blue color
(Fig. 1D). Under both conditions,
the healthy rat bladders were less stained when compared with those
bearing tumors.
In order to compare the amount of EB present in
healthy and malignant rat bladders following intravesical
instillation, EB was extracted and quantified using an HPLC
method.
Determination of EB in rat bladder homogenates
following intravesical instillation
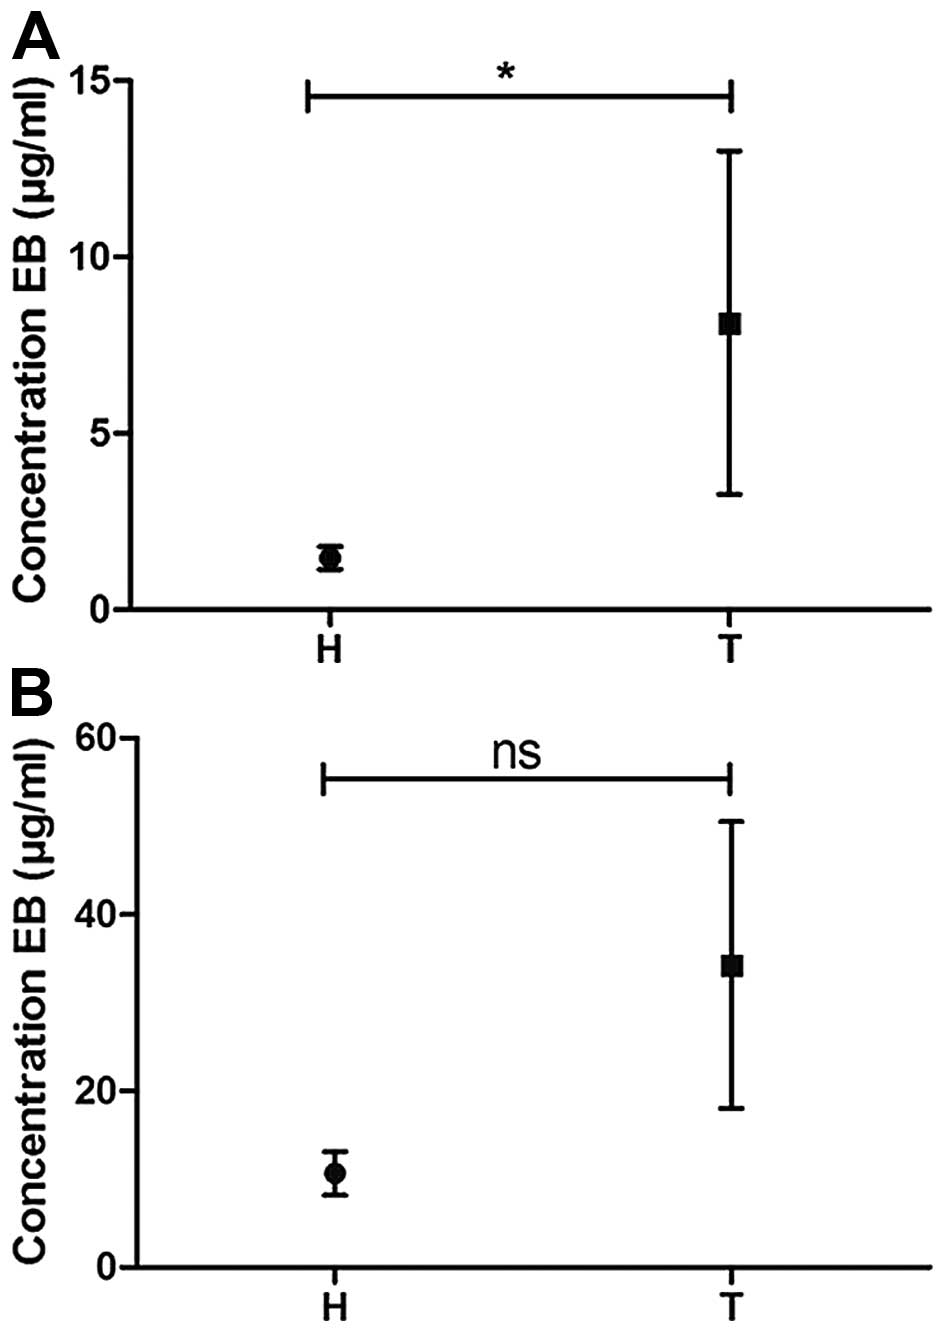
A quantitative comparison of the concentration of EB
in bladder homogenates following instillation of the compound in
healthy rat bladders and in bladders with malignant urothelium is
shown in Fig. 2: Graph 2 indicates
that under both tested conditions, more EB was taken up by
tumor-bearing compared with healthy bladders, although this
difference was only found to be significant in the 1 mM-2 h
condition. On average, the concentration of EB in tumor bladder
homogenates was 5.5 times higher compared with that in healthy
bladder homogenates in the 1 mM-2 h condition. In the 5 mM-1 h
condition, a 3.2-fold increase was observed. These findings match
the observations of blue color in the bladder samples, as
visualized in Fig. 1.
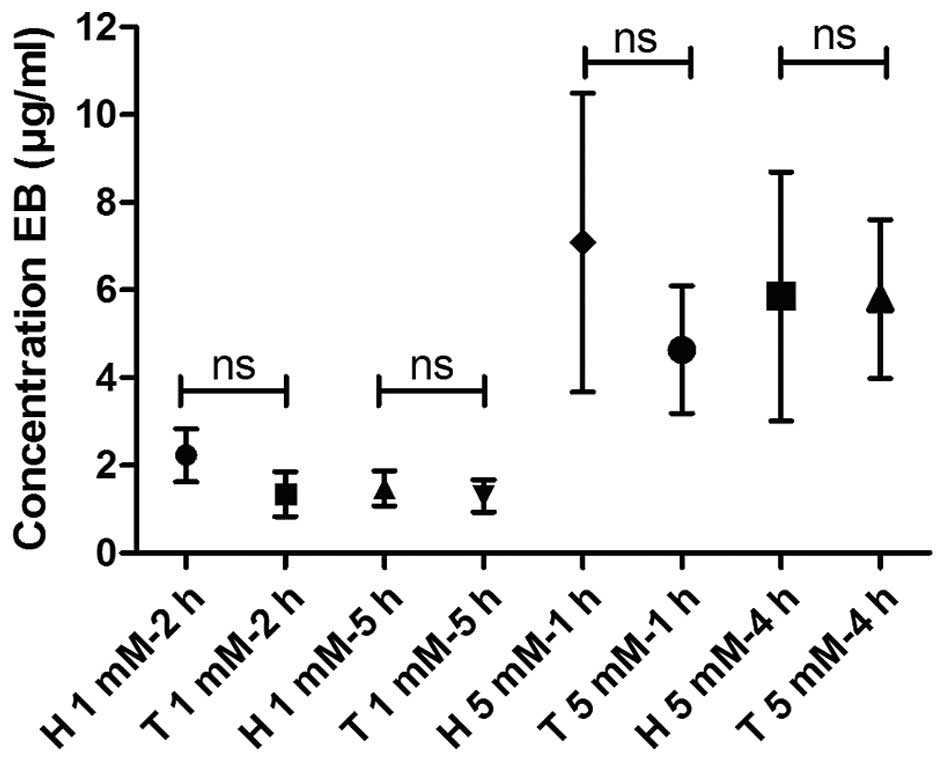
Determination of EB in rat plasma following
intravesical instillation
To determine the amount of EB that evades from the
bladder and enters the circulation, the concentration of EB in rat
plasma was quantified following intravesical instillation in both
healthy and malignant rat bladders. EB concentrations were also
determined 3 h after removal of the catheters to investigate
retention of EB in rat blood. As shown in Fig. 3, there were no significant
differences in EB concentrations between the plasma of normal rats
and the plasma of rats with a malignant urothelium following
instillation of EB under all tested conditions (1 mM for 2 and 5 h,
and 5 mM for 1 and 4 h). As expected, the 5-mM instillation led to
a higher concentration of EB in the plasma compared with the 1-mM
instillation (3- to 4-fold increase). The highest mean
concentration in rat plasma, 7 µg/ml, was observed for the 5 mM for
1 h condition in healthy rat bladders. After a 3-h EB
instillation-free period, the EB concentrations did not
significantly change.
Repeated intrabladder instillation of EB
EB solutions or PBS (control) were instilled for 7
consecutive days in normal rat bladders to investigate possible
adverse effects of EB on the bladder wall. In the control PBS
samples (Fig. 4C), the urothelium
appeared normal in all 3 rat bladders; in 2 bladders, a purulent
inflammation was found in the muscularis, while in the third rat,
oedema was present in the lamina propria. The histological injuries
seen under these control conditions were likely due to the repeated
instillation procedure.
A 7-day repeated instillation of 1 mM EB was not
associated with any more signs of adverse effects observed within
the bladder wall as compared with the control conditions (Fig. 4A). Histological analysis revealed
that the urothelium was normal in all cases. Mild inflammation and
oedema was noticed in the lamina propria and 1 bladder had a
purulent inflammation in the muscularis. In addition, in cases of 5
mM EB instillations, the urothelium of the 3 rat bladders was
normal (Fig. 4B), while inflammation
and oedema were observed in the lamina propria and the muscularis
of 2 rats.
RNA sequencing experiment
In order to better understand the differential
accumulation of EB in urothelial tumor tissue vs. healthy tissue,
an RNA sequencing experiment was designed to specifically
investigate the gene expression of urothelial tissue. To isolate
the urothelium, laser capture microdissection was performed.
Comparative analysis between tumor and healthy
samples
Principal component analysis demonstrated that 1
tumor sample did not cluster well with the other 5 tumor samples.
This sample was therefore considered as an outlier and was excluded
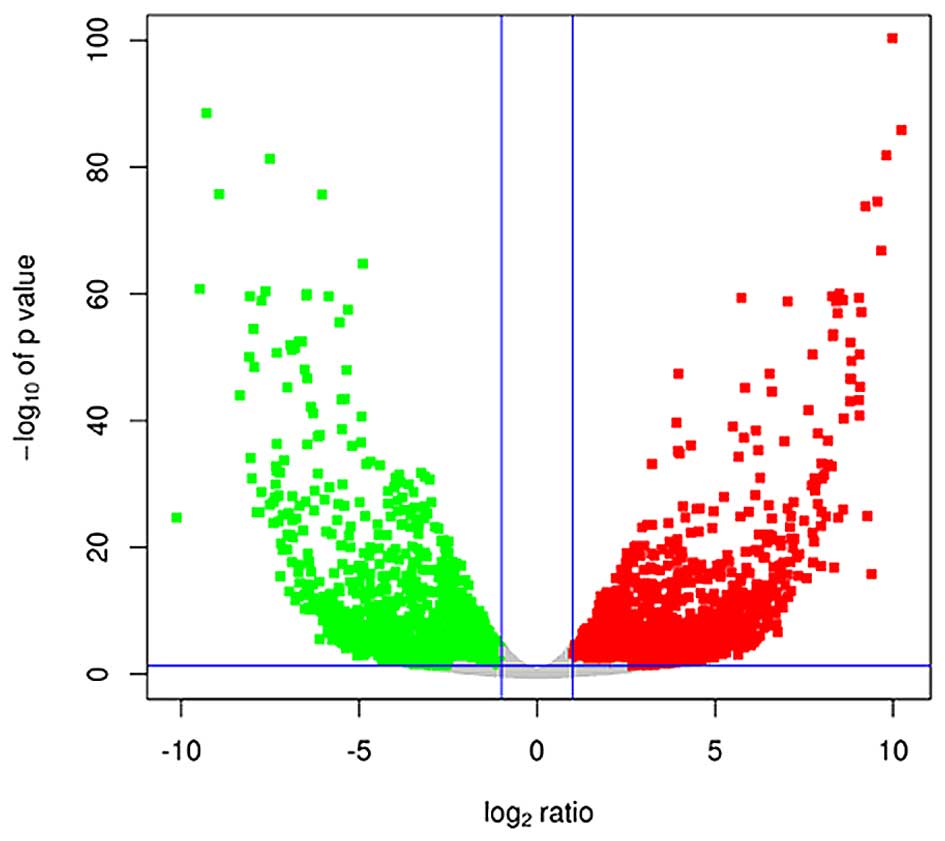
from the comparative analysis. Comparative analysis of the
remaining tumor samples and the 4 healthy samples revealed that
2,441 genes were downregulated (log2-ratio <-1) and
2,244 genes were upregulated (log2-ratio >1) in tumor
vs. healthy samples (P<0.05), as visualized by a Volcano plot
(Fig. 5).
Since we previously hypothesized that EB
specifically accumulates in tumor tissue due to defects in the
urothelial barrier (11), genes
correlated to cell-cell adhesion were selected and the expression
levels were analyzed. The focus was set on genes belonging to or
correlated with the three typical cell adhesion structures: Tight
junctions (TJs), adherens junctions (AJs) and desmosomes. The
results are presented in Table I.
This table clearly shows that several genes related to cell
adhesion were differentially expressed in the malignant urothelium
compared with normal urothelium. When investigating genes related
to TJs, 13 genes were found to be downregulated, whereas 8 genes
were upregulated. These genes include five different types of
claudins, the major building blocks of TJs. It is also clear that a
number of these genes were up- or downregulated at a very high
level, e.g., CLDN3 was 237-fold upregulated, whereas
CLDN23 was 110-fold downregulated in the tumor urothelium
vs. normal urothelium. In addition, genes encoding proteins
involved in AJs were differentially expressed, although at a lower
level compared with the TJ-related genes. Highest levels of
upregulation were observed for CDH17 (18-fold) and of
downregulation for PVRL3 (13-fold). Furthermore, 3 genes
correlated with desmosomes were detected, namely DSC2, DSP
and PKP1.
 | Table I.Differential expression of cell
adhesion genes in tumor vs. healthy samples. |
Table I.
Differential expression of cell
adhesion genes in tumor vs. healthy samples.
| Tight junctions | Adherens
junctions | Desmosomes |
|---|
|
|
|
|---|
| Gene ID | LogFC | P-value | Gene ID | LogFC | P-value | Gene ID | LogFC | P-value |
|---|
| Amotl1 | −4.45 | 1.86E-07 | Acp1 | 1.11 | 0.00527 | Dsc2 | 1.99 | 4.13E-06 |
| Cldn3 | 7.89 | 9.90E-39 | Actb | 3.00 | 3.51E-07 | Dsp | −1.64 | 0.00120 |
| Cldn8 | −6.78 | 3.00E-25 | Actg1 | 2.55 | 0.00552 | Pkp1 | 1.16 | 0.00179 |
| Cldn11 | −2.90 | 0.00956 | Actn1 | 3.18 | 3.05E-07 |
|
|
|
| Cldn18 | 3.85 | 0.00786 | Actn4 | 1.32 | 1.42E-06 |
|
|
|
| Cldn23 | −5.07 | 2.14E-13 | Baiap2 | 1.51 | 6.38E-06 |
|
|
|
| F11r | −1.22 | 7.62E-05 | Cdh3 | 2.01 | 0.00576 |
|
|
|
| Inadl | −1.51 | 0.0238 | Cdh4 | −3.42 | 0.0187 |
|
|
|
| Jam2 | −2.99 | 0.00219 | Cdh17 | 4.18 | 0.00247 |
|
|
|
| Jam3 | −2.35 | 0.0400 | Cdh18 | −2.97 | 0.0168 |
|
|
|
| Magi3 | −1.33 | 0.00173 | Csnk2b | −1.39 | 1.21E-07 |
|
|
|
| Mpdz | 2.74 | 0.00940 | Ctnnd1 | −1.26 | 0.00193 |
|
|
|
| Pard6a | 4.02 | 4.76E-05 | Insr | −1.90 | 0.0150 |
|
|
|
| Pard6b | 1.63 | 2.03E-05 | Ptpn1 | 1.92 | 1.19E-06 |
|
|
|
| Pard6g | −4.48 | 1.13E-13 | Ptprb | −3.54 | 0.00075 |
|
|
|
| Prkca | 1.92 | 0.00302 | Ptprf | −1.41 | 4.90E-06 |
|
|
|
| Prkch | −1.97 | 0.00018 | PVR | 2.11 | 4.36E-11 |
|
|
|
| Prkci | −1.26 | 0.00011 | Pvrl1 | −3.13 | 0.00099 |
|
|
|
| Prkcq | −6.70 | 5.77E-13 | Pvrl3 | −3.68 | 0.00333 |
|
|
|
| Rab3b | 4.33 | 0.00065 | Pvrl4 | −2.43 | 9.39E-07 |
|
|
|
| Ybx3 | 1.63 | 1.18E-06 | Snai2 | −2.76 | 0.00619 |
|
|
|
|
|
|
| Was | 4.01 | 0.00055 |
|
|
|
|
|
|
| Wasl | −1.17 | 9.02E-05 |
|
|
|
Functional enrichment analysis
To identify enriched pathways (PWs), our gene set
was compared to predefined categories of the KEGG database. This
analysis revealed that the upregulated differentially expressed
genes were associated with 99 KEGG pathways (Table II). The top 10 of these upregulated
enriched PWs is indicated in red. Notably, this table demonstrates
that the most significantly enriched PW is the cell cycle PW. In
relation to this PW, the DNA replication and mitogen-activated
protein kinase signaling PWs are also included in the top 10.
Alongside this top 10, other interesting categories that were
significantly enriched are the bladder cancer PW (R=5.21,
P=0.0054), the TJ PW (R=3.34, P=0.0025) and the AJ PW (R=3.62,
P=0.012).
| Table II.Enriched categories in up- and
downregulated genes using the Kyoto Encyclopedia of Genes and
Genomes (KEGG) database. |
Table II.
Enriched categories in up- and
downregulated genes using the Kyoto Encyclopedia of Genes and
Genomes (KEGG) database.
| Enriched KEGG PWs
for the upregulated genes in order of significance | Enriched KEGG PWs
for the downregulated genes in order of significance |
|---|
| Cell cycle | Metabolic
pathways |
| Metabolic
pathways | Lysosome |
| Smallcell lung
cancer | Valine, leucine
& isoleucine degradation |
| DNA
replication | Peroxisome |
| Pathways in
cancer | PPAR signaling |
| Focal adhesion | Endocytosis |
| Oocyte meiosis | Fatty acid
metabolism |
| MAPK signaling
pathway | Terpenoid backbone
synthesis |
| Regulation of actin
cytoskeleton | SNARE interactions
in vesicular transport |
| RNA transport | Glutathione
metabolism |
| Osteoclast
differentiation | Propanoate
metabolism |
| Leukocyte
transendothelial migration | Biosynthesis of
unsaturated fatty acids |
| Chemokine signaling
pathway | Protein processing
in endoplasmic reticulum |
| Spliceosome | Drug
metabolism-cytochrome P450 |
| Cytokine-cytokine
receptor interaction | Metabolism of
xenobiotics by cytochrome P450 |
| Leishmaniasis | Tryptophan
metabolism |
|
Progesterone-mediated oocyte
maturation | Sphingolipid
metabolism |
| p53 signaling
pathway | Steroid hormone
biosynthesis |
| Pyrimidine
metabolism | TGF-β signaling
pathway |
| NOD-like receptor
signaling pathway | Fatty acid
elongation in mitochondria |
| Chronic myeloid
leukemia | Steroid
biosynthesis |
| Purine
metabolism | Tight junction |
| Protein processing
in endoplasmic reticulum | Cysteine and
methionine metabolism |
| Glioma | Insulin signaling
pathway |
| Homologous
recombination | Circadian
rhythm-mammal |
| Pancreatic
cancer | Basal cell
carcinoma |
| Apoptosis | Hedgehog signaling
pathway |
| Hematopoietic cell
lineage | Inositol phosphate
metabolism |
| Amoebiasis |
Phosphatidylinositol signaling system |
| Prostate
cancer | Melanogenesis |
| Neurotrophin
signaling pathway |
Aldosterone-regulated sodium
reabsorption |
| Jak-STAT signaling
pathway | Collecting duct
acid secretion |
| Rheumatoid
arthritis | Pathways in
cancer |
| Tcell receptor
signaling pathway | p53 signaling
pathway |
| Nucleotide excision
repair | Amino sugar and
nucleotide sugar metabolism |
| Shigellosis | Epithelial cell
signaling in Helicobacter pylori infection |
| Ribosome biogenesis
in eukaryotes | Adipocytokine
signaling pathway |
| Mismatch
repair | Fc gamma R-mediated
phagocytosis |
| ECM-receptor
interaction | Other glycan
degradation |
| Base excision
repair | Glyoxylate and
dicarboxylate metabolism |
| Phagosome | Calcium signaling
pathway |
| Toxoplasmosis | Pancreatic
secretion |
| Arginine and
proline metabolism | Regulation of actin
cytoskeleton |
| Adipocytokine
signaling pathway | Amoebiasis |
| Non-smallcell lung
cancer | Pyruvate
metabolism |
| Fc gamma R-mediated
phagocytosis | Retinol
metabolism |
| Pathogenic
Escherichia coli infection | Proximal tubule
bicarbonate reclamation |
| Galactose
metabolism |
Glycolysis/gluconeogenesis |
| Fc epsilon RI
signaling pathway | Salivary
secretion |
| Toll-like receptor
signaling pathway | Lysine
degradation |
| Colorectal
cancer | Vascular smooth
muscle contraction |
| Proteasome | Synthesis and
degradation of ketone bodies |
| Chagas' disease
(American trypanosomiasis) |
Vasopressin-regulated water
reabsorption |
| Hypertrophic
cardiomyopathy |
|
|
Glycolysis/gluconeogenesis |
|
| Tight junction |
|
| Glutathione
metabolism |
|
| Dilated
cardiomyopathy |
|
| Malaria |
|
| Ubiquitinmediated
proteolysis |
|
| Bacterial invasion
of epithelial cells |
|
| Melanoma |
|
| Insulin signaling
pathway |
|
| Vibrio
cholerae infection |
|
| Arrhythmogenic
right ventricular cardiomyopathy |
|
| B-cell receptor
signaling pathway |
|
| Cytosolic
DNA-sensing pathway |
|
| VEGF signaling
pathway |
|
| Arachidonic acid
metabolism |
|
| Glycerophospholipid
metabolism |
|
| Endocytosis |
|
| Bladder cancer |
|
| Glycosphingolipid
biosynthesis-lacto and neolacto series |
|
| TGF-β signaling
pathway |
|
| Natural killer
cellmediated cytotoxicity |
|
| Glycosphingolipid
biosynthesis-ganglio series |
|
| Complement and
coagulation cascades |
|
| Viral
myocarditis |
|
| RNA
degradation |
|
| Glycerolipid
metabolism |
|
| RIG-I-like receptor
signaling pathway |
|
| Adherens
junction |
|
| Amyotrophic lateral
sclerosis |
|
| Staphylococcus
aureus infection |
|
| Acute myeloid
leukemia |
|
| Hepatitis C |
|
| Nitrogen
metabolism |
|
| ErbB signaling
pathway |
|
| Protein export |
|
| Type I diabetes
mellitus |
|
| Epithelial cell
signaling in Helicobacter pylori infection |
|
| Renal cell
carcinoma |
|
| Folate
biosynthesis |
|
| RNA polymerase |
|
| Histidine
metabolism |
|
| Axon guidance |
|
| Drug
metabolism-other enzymes |
|
| Endometrial
cancer |
|
| mTOR signaling
pathway |
|
When analyzing the downregulated differentially
expressed genes, 53 different PWs were enriched (Table II). The top 10 is marked in red.
Interestingly, several of the PWs in this top 10 are associated
with catabolism, in which the cells break down molecules into
smaller units to release energy: Lysosome PW, peroxisome PW and
endocytosis PW are among this category. The peroxisome
proliferator-activated receptor signaling, terpenoid backbone
synthesis, fatty acid metabolism and soluble NSF attachment protein
receptor interactions in vesicular transport PWs, are also
indirectly involved in the catabolism of the cells. Other
interesting categories that were significantly enriched are the TJ
PW (R=3.36, P=0.0055) and the p53 signaling PW (R=3.92,
P=0.017).
Discussion
In this study, using a preclinical setting, we
investigated certain practical aspects of the future use of EB as a
diagnostic dye in the detection of NMIBC in combination with WL
cystoscopy. Furthermore, by performing transcriptome analysis of
malignant and normal rat urothelium, we set out to mechanistically
elucidate the accumulation of the compound in malignant bladder
urothelium.
Our results demonstrated that the total amount of EB
accumulating in rat bladders bearing a malignant urothelium was
clearly higher compared with that in healthy bladders, at least in
case of the 1-mM EB instillation. These data are in line with a
previous study using an identical tumor model that quantified the
fluorescence of EB at the microscopic level in the different layers
of the bladder wall (10).
Consequently, a differential uptake of EB by the malignant and
normal inner bladder wall was also observed using WL
stereomicroscopy. The previous study (10) also demonstrated that EB readily
penetrates through the malignant urothelium, reaching and
afterwards accumulating in the deeper muscle layers and, hence, the
perpendicular stereomicoscopic view at the surface of the inner
wall (as in case of a cystoscope) likely visualizes both. The
images furthermore revealed a non-homogeneous distribution of the
blue color, which probably reflects the variable proliferation of
the AY-27 cells after inoculation, as previously reported (10).
Although the differences in the accumulation of EB
in bladders with tumor vs. healthy bladders were clear, this was
not the case for the EB plasma levels. We expected to find a lower
concentration of EB in the plasma of healthy rats due to the
presence of a functional urothelial barrier, as compared with the
disrupted barrier in the rats bearing bladder tumors. However, it
is possible that the catheterization procedure, also under control
conditions, caused small injuries, which enabled EB to penetrate
into the bloodstream without the need to pass through the
urothelial barrier. This possibility should be further investigated
using larger animals with bladders that are easily accessible.
Approximately 5% of the amount of EB instilled was
able to enter the bloodstream under the tested conditions. Although
this quantity may be an overestimation due to the specific
instillation conditions used, the absorption across the bladder
wall of EB into the bloodstream may raise some safety concerns. At
this point, it should be mentioned that EB has been frequently used
as a dye marker to determine blood volume in humans (16–19). To
that end, EB is injected directly into the bloodstream. Based on an
average blood volume of 5 l for an individual weighing 70 kg
(20), the final concentration of EB
in the circulatory system in humans ranges between 6.36 (19) and 12.73 µg EB/ml plasma (17) following intravenous injections. These
values are in the range of the highest mean concentration observed
in the present study (7 µg/ml). Moreover, Gibson and Gregerson
(21) concluded that doses of EB ≤20
mg/kg are non-toxic when administered intravenously to growing
rats. For an individual weighing 70 kg, this dose would result in a
plasma concentration of ~500 µg EB/ml plasma, which is 70-fold
higher compared with the highest mean concentration observed in our
study. Other uses of EB in clinical practice include the detection
of aspirated materials in patients with tracheostomy (22) and imaging in cardioscopy (23). Overall, the widespread use of EB for
different applications in clinical practice appears to indicate
that, even when intravesically instilled EB leaks into the
bloodstream, the safety risk for the patients is deemed very
low.
Of note, no adverse effects on the urothelium were
observed after daily instillation of EB for 7 days, even after
intravesical application of concentrations as high as 5 mM. Since
the urothelium is directly exposed to the EB solutions, these data
again underline the fact that the compound possesses a highly
non-toxic profile. However, some inflammation was noticed in the
other layers, namely the lamina propria and muscularis, of some,
but not all, rat bladder samples. Since these injuries were also
present in the control bladders, we hypothesize that the
inflammation observed was due to the repeated instillation
procedure and not to adverse effects induced by EB per
se.
We previously hypothesized that EB selectively
accumulates paracellularly in tumor tissue due to defects in the
urothelial barrier (10). To
investigate this hypothesis in more detail, transcriptome analysis
of the urothelium was performed and the differential expression
between healthy and malignant urothelium was analyzed. It is clear
from the data that several genes related to cell adhesion were
differentially expressed, particularly genes associated with TJs.
Furthermore, genes that are associated with AJs and desmosomes were
found to be significantly up- or downregulated.
A first important observation is the presence of 5
claudin genes, differentially expressed with high values. Claudin
proteins are the most important components of TJs. A study
investigating the expression of claudins in normal and neoplastic
human tissues concluded that most claudin genes are decreased in
tumors, except CLDN3, CLDN4 and CLDN7, which
are elevated in certain types of cancer, including bladder cancer
(24). This conclusion matches our
results, in which CLDN8, 11 and 23 were significantly
downregulated in malignant urothelium, while CLDN3 was 237
times upregulated.
When investigating in more detail the differentially
expressed genes correlated with AJs, four different cadherins and
one catenin, the major building blocks of AJs, were identified. The
most extensively investigated cadherin is E-cadherin (CDH1), the
most important mediator of cell-cell adhesion in epithelial
tissues, and also an important tumor suppressor (25). It is well documented that, during
epithelial-to-mesenchymal transition (EMT), an important first step
of cancer metastasis, a cadherin switch occurs. In different
malignancies, it was observed that the expression of E-cadherin
decreases, while the expression of N-cadherin (CDH2) and/or
P-cadherin (CDH3) increases (26).
In bladder cancer, a transition to N-cadherin and P-cadherin has
also been observed, although the exact timing and combination of
expression of the three cadherins remains to be elucidated
(26). When these studies are
considered in the light of our context, we may see that P-cadherin
is indeed significantly upregulated four times in tumor tissue
compared with healthy tissue, but the expression of E-cadherin and
N-cadherin was not significantly different. This observation may be
explained in two ways: It is possible that, in our tumor model, the
cadherin switch starts with an increased expression of P-cadherin
and that a decreased E-cadherin expression starts later during
tumorigenesis. Another possibility is that the EMT has not yet
started, and that the P-cadherin expression should be considered
separately. Bryan et al (27)
investigated the expression of P-cadherin in vivo and
concluded that, even in the presence of normal E-cadherin
expression, an increased expression of P-cadherin was associated
with a more malignant phenotype of bladder cancer. The protein
expression of E-cadherin in an identical animal model was
previously investigated by our group by means of
immunohistochemistry (10). It was
concluded that no differences in the expression of E-cadherin were
observed, confirming the gene expression of the CDH1 gene in
this study. Two other proteins were investigated by Elsen et
al (10): Claudin-1 and
desmoglein-1. The CLD1 and DSG1 genes were not
differentially expressed in our gene analysis, but we observed
decreased expression of desmoglein-1 in the malignant urothelium in
our previous study (10).
Interestingly, the enrichment analysis points to the
involvement of cell adhesion as well: The TJ PW was enriched in the
upregulated as well as in the downregulated genes, whereas the AJ
PW was enriched in the upregulated genes.
Taken together, the data show that several genes
involved in cell adhesion are differentially expressed in healthy
and malignant urothelium, pointing strongly to defects in the
urothelial barrier. Although the relative expression of genes does
not necessarily reflect the abundance of the corresponding
proteins, it is anticipated that major defects are also present at
the level of protein expression. Indeed, our results are fully in
line with the previously observed ultrastructural defects, as
malignant tissue displayed wider intercellular spaces and a
decreased number of cell junction components compared with normal
tissue (10).
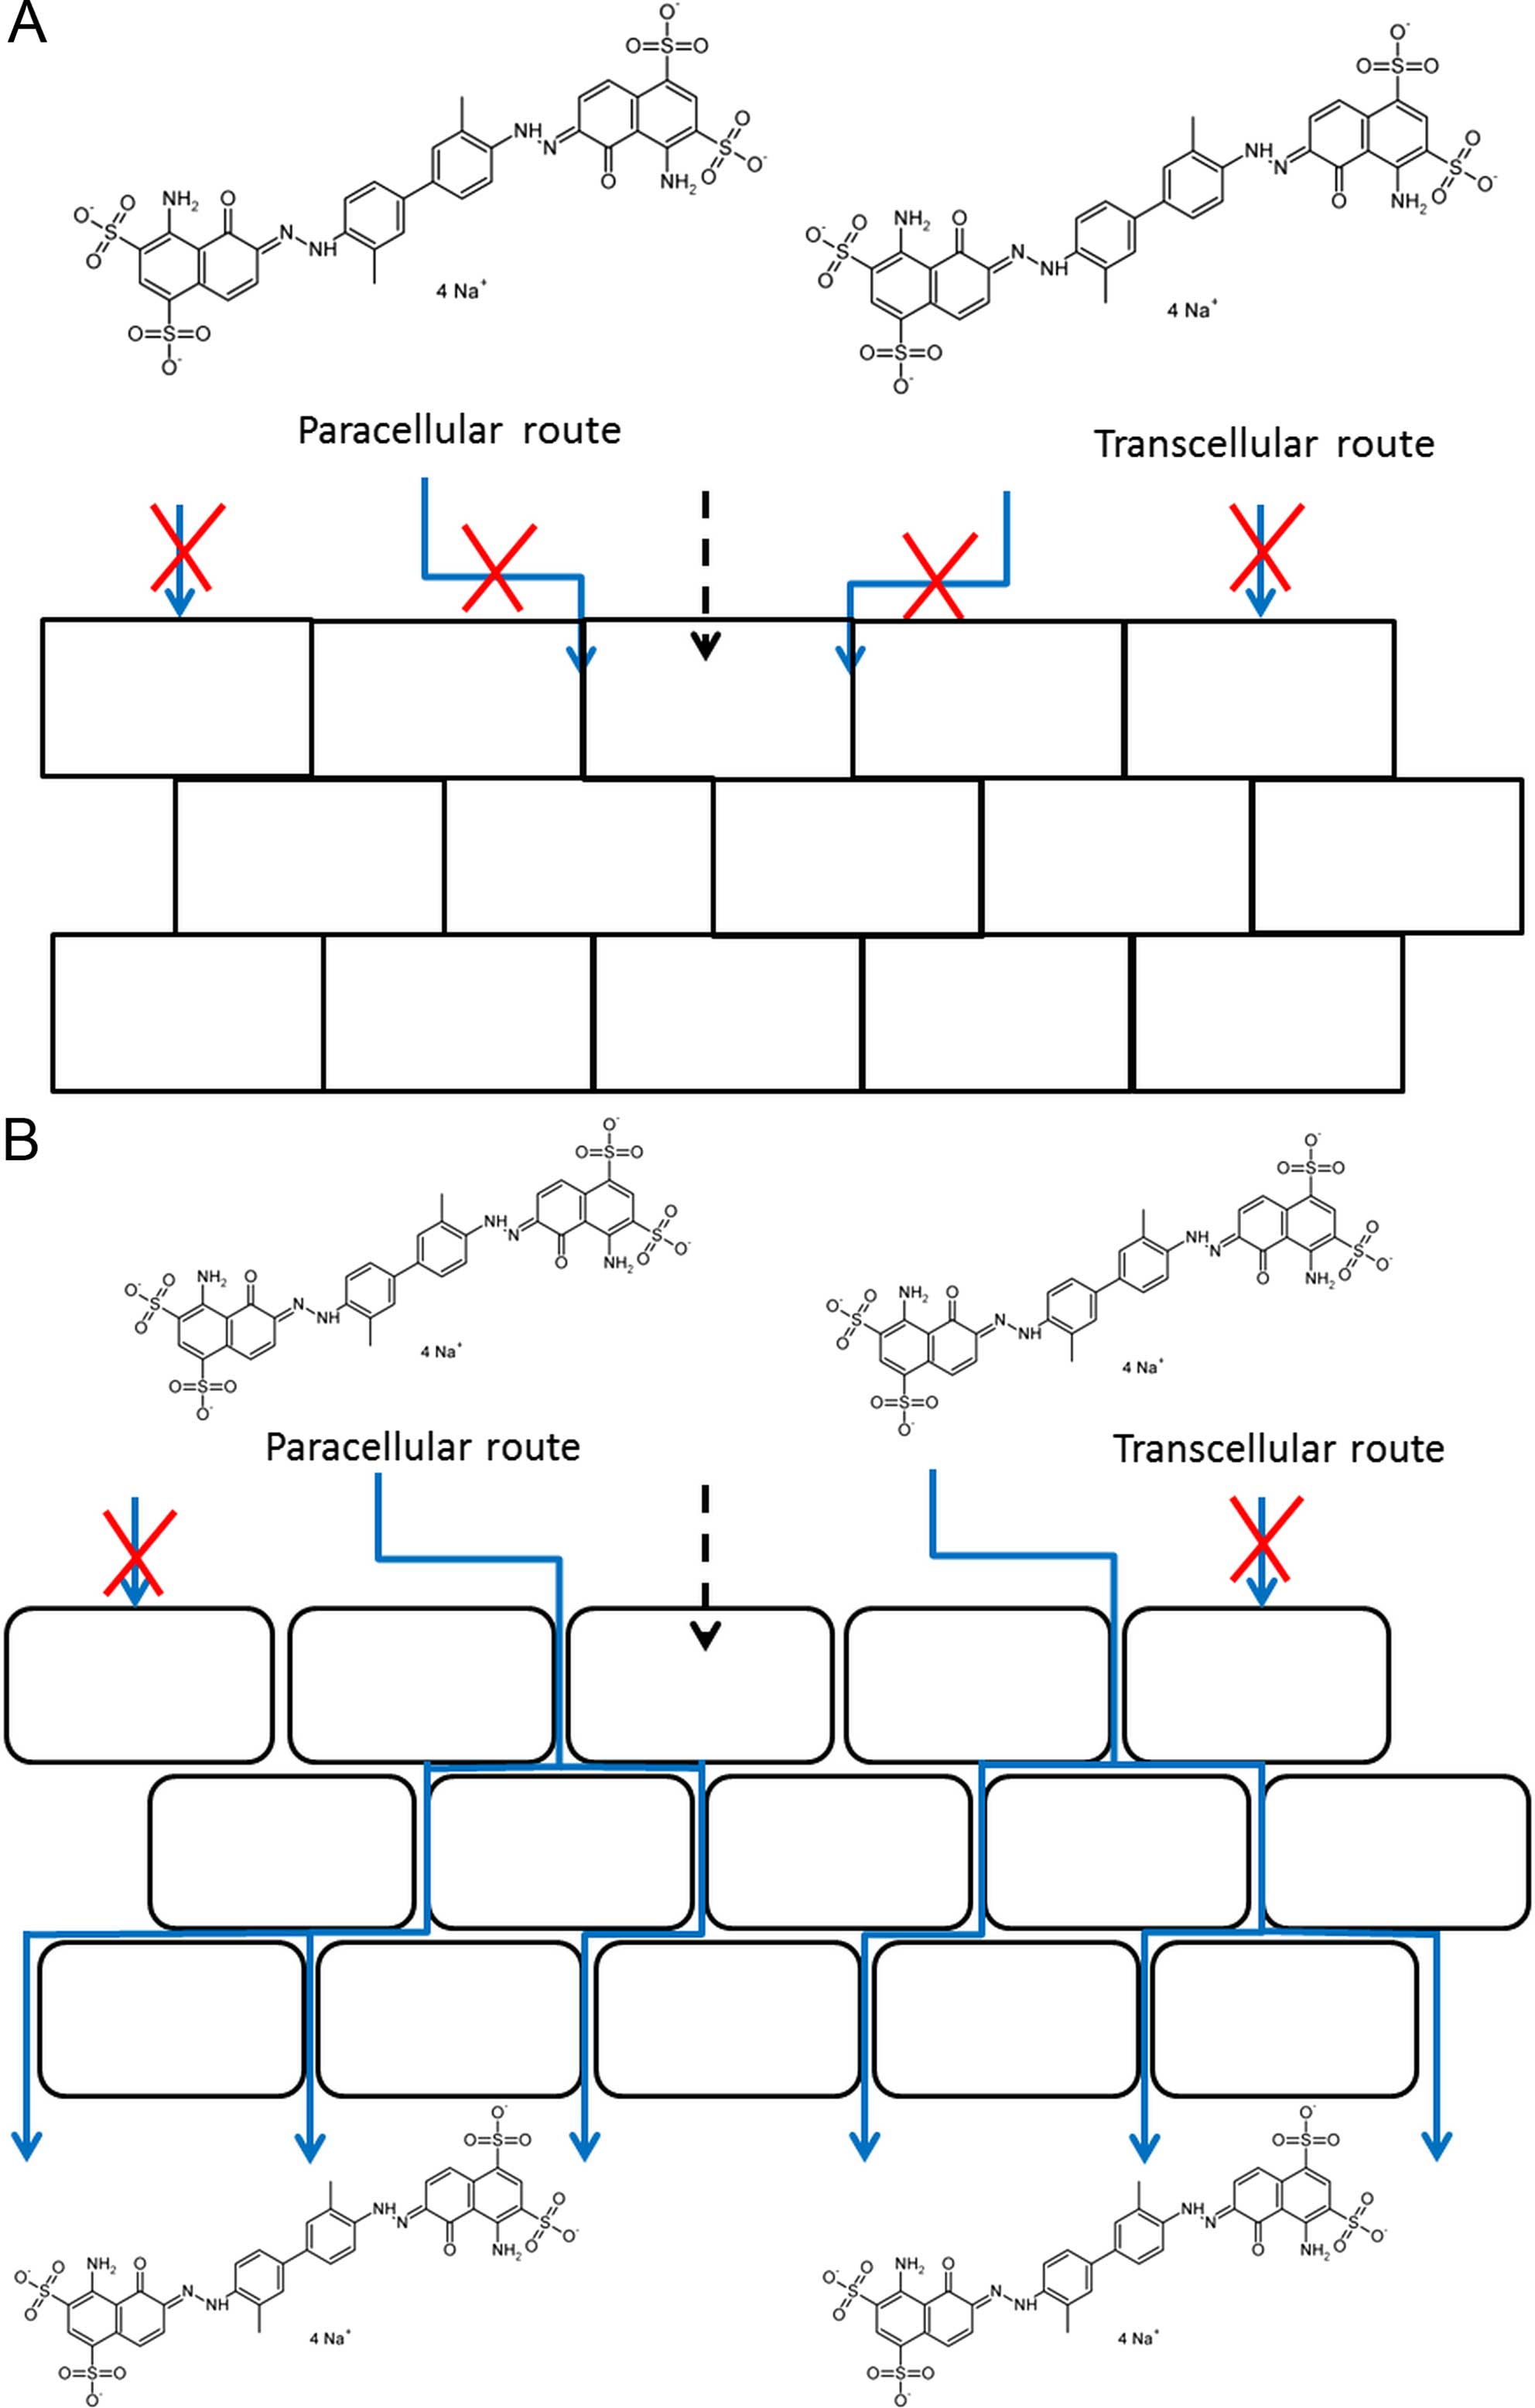
In conclusion, we demonstrated that EB is
selectively taken up by tumor tissue following intravesical
instillations in rats bearing bladder tumors compared with normal
rats. EB instillations do not harm the bladder wall and penetration
into the circulatory system is limited, particularly when low
concentrations are used. The selective uptake of EB is probably due
to defects in the urothelial barrier, as depicted in Fig. 6.
If these preclinical results on EB can be confirmed
in a human setting, our findings may be important for future
clinical developments in the field of diagnostics for bladder
cancer. Implementing the cost-effective protocol of EB
instillations in combination with WL cystoscopy may offer a benefit
to patients and the healthcare system compared with the costly
photodynamic procedure.
Acknowledgements
The present study was funded by the KU Leuven (OT
project no. OT/11/075). Library preparation, sequencing and
statistical analysis were performed by VIB Nucleomics Core
(www.nucleomics.be).
References
|
1
|
Ferlay J, Soerjomataram I, Dikshit R, Eser
S, Mathers C, Rebelo M, Parkin DM, Forman D and Bray F: Cancer
incidence and mortality worldwide: Sources, methods and major
patterns in GLOBOCAN 2012. Int J Cancer. 136:E359–E386. 2015.
View Article : Google Scholar : PubMed/NCBI
|
|
2
|
Park JC, Citrin DE, Agarwal PK and Apolo
AB: Multimodal management of muscle-invasive bladder cancer. Curr
Probl Cancer. 38:80–108. 2014. View Article : Google Scholar : PubMed/NCBI
|
|
3
|
van Rhijn BW, Burger M, Lotan Y, Solsona
E, Stief CG, Sylvester RJ, Witjes JA and Zlotta AR: Recurrence and
progression of disease in non-muscle-invasive bladder cancer: From
epidemiology to treatment strategy. Eur Urol. 56:430–442. 2009.
View Article : Google Scholar : PubMed/NCBI
|
|
4
|
Jocham D, Stepp H and Waidelich R:
Photodynamic diagnosis in urology: State-of-the-art. Eur Urol.
53:1138–1148. 2008. View Article : Google Scholar : PubMed/NCBI
|
|
5
|
Yang LP: Hexaminolevulinate blue light
cystoscopy: A review of its use in the diagnosis of bladder cancer.
Mol Diagn Ther. 18:105–116. 2014. View Article : Google Scholar : PubMed/NCBI
|
|
6
|
Cordeiro ER, Anastasiadis A, Bus MT,
Alivizatos G, de la Rosette JJ and de Reijke TM: Is photodynamic
diagnosis ready for introduction in urological clinical practice?
Expert Rev Anticancer Ther. 13:669–680. 2013. View Article : Google Scholar : PubMed/NCBI
|
|
7
|
Burger M, Grossman HB, Droller M,
Schmidbauer J, Hermann G, Drăgoescu O, Ray E, Fradet Y, Karl A,
Burgués JP, et al: Photodynamic diagnosis of non-muscle-invasive
bladder cancer with hexaminolevulinate cystoscopy: A meta-analysis
of detection and recurrence based on raw data. Eur Urol.
64:846–854. 2013. View Article : Google Scholar : PubMed/NCBI
|
|
8
|
Babjuk M, Böhle A, Burger M, Capoun O,
Cohen D, Compérat EM, Hernández V, Kaasinen E, Palou J, et al: EAU
Guidelines on Non-Muscle-invasive Urothelial Carcinoma of the
Bladder: Update 2016. Eur Urol. Jun 17–2016.(Epub ahead of print).
View Article : Google Scholar
|
|
9
|
Roelants M, Huygens A, Crnolatac I, Van
Cleynenbreugel B, Lerut E, Van Poppel H and de Witte PA: Evans blue
as a selective dye marker for white-light diagnosis of
non-muscle-invasive bladder cancer: An in vitro study. BJU Int.
109:300–305. 2012. View Article : Google Scholar : PubMed/NCBI
|
|
10
|
Elsen S, Lerut E, Van Cleynenbreugel B,
Van der Aa F, Van Poppel H and de Witte PA: Biodistribution of
Evans blue in an orthotopic AY-27 rat bladder urothelial cell
carincinoma model: Implication for the improved diagnosis of
non-muscle-invasive bladder cancer (NMIBC) using dye-guided
white-light cystoscopy. BJU Int. 116:468–477. 2015. View Article : Google Scholar : PubMed/NCBI
|
|
11
|
Gardner MJ: Micromethod for the analysis
of evans blue in plasma using ion-pair high-performance liquid
chromatography. J Chromatogr. 381:295–303. 1986. View Article : Google Scholar : PubMed/NCBI
|
|
12
|
Liao Y, Smyth GK and Shi W: FeatureCounts:
An efficient general purpose program for assigning sequence reads
to genomic features. Bioinformatics. 30:923–930. 2014. View Article : Google Scholar : PubMed/NCBI
|
|
13
|
Risso D, Schwartz K, Sherlock G and Dudoit
S: GC-content normalization for RNA-seq data. BMC Bioinformatics.
12:4802011. View Article : Google Scholar : PubMed/NCBI
|
|
14
|
Robinson MD and Smyth GK: Moderated
statistical tests for assessing differences in tag abundance.
Bioinformatics. 23:2881–2887. 2007. View Article : Google Scholar : PubMed/NCBI
|
|
15
|
Benjamini Y and Hochberg Y: Controlling
the false discovery rate: A practical and powerful approach to
multiple testing. J R Statist Soc B. 57:289–300. 1995.
|
|
16
|
Gibson JG and Evans WA: Clinical studies
of the blood volume. I. Clinical application of a method employing
the azo dye ‘Evans blue’ and the spectrophotometer. J Clin Invest.
16:301–316. 1937. View Article : Google Scholar : PubMed/NCBI
|
|
17
|
Crooke AC and Morris CJ: The determination
of plasma volume by the Evans blue method. J Physiol. 101:217–223.
1942. View Article : Google Scholar : PubMed/NCBI
|
|
18
|
Brown MA, Mitar DA and Whitworth JA:
Measurement of plasma volume in pregnancy. Clin Sci (Lond).
83:29–34. 1992. View Article : Google Scholar : PubMed/NCBI
|
|
19
|
Farquhar WB, Hunt BE, Taylor JA, Darling
SE and Freeman R: Blood volume and its relation to peak O(2)
consumption and physical activity in patients with chronic fatigue.
Am J Physiol Heart Circ Physiol. 282:H66–H71. 2002.PubMed/NCBI
|
|
20
|
Boron WF and Boulpaep EL: Arteries and
veinsMedical physiology. Elsevier Inc.; Philadelphia, PA: pp.
447–462. 2005
|
|
21
|
Gibson JG and Gregersen MI: Toxicity of
two vital dyes used in plasma volume determinations. Am J Physiol
(Proc). 113:501935.
|
|
22
|
Belafsy PC, Blumenfeld L, LePage A and
Nahrstedt K: The accuracy of the modified Evan's blue dye test in
predicting aspiration. Laryngoscope. 113:1969–1972. 2003.
View Article : Google Scholar : PubMed/NCBI
|
|
23
|
Kanai M, Sakurai T, Yoshinaga K, Aoyagi K,
Hitsumoto T, Yoshinuma M, Uchi T, Noike H, Ohsawa H, Kawamura K, et
al: Percutaneous dye image cardioscopy for detection of endocardial
lesions. Diagn Ther Endosc. 7:29–33. 2000. View Article : Google Scholar : PubMed/NCBI
|
|
24
|
Hewitt KJ, Agarwal R and Morin PJ: The
claudin gene family: Expression in normal and neoplastic tissues.
BMC Cancer. 6:1862006. View Article : Google Scholar : PubMed/NCBI
|
|
25
|
Jeanes A, Gottardi CJ and Yap AS:
Cadherins and cancer: How does cadherin dysfunction promote tumor
progression? Oncogene. 27:6920–6929. 2008. View Article : Google Scholar : PubMed/NCBI
|
|
26
|
Bryan RT and Tselepis C: Cadherin
switching and bladder cancer. J Urol. 184:423–431. 2010. View Article : Google Scholar : PubMed/NCBI
|
|
27
|
Bryan RT, Atherfold PA, Yeo Y, Jones LI,
Harrison FR, Wallace DM and Jankowski JA: Cadherin switching
dictates the biology of transitional cell carcinoma of the bladder:
Ex vivo and in vitro studies. J Pathol. 215:184–194. 2008.
View Article : Google Scholar : PubMed/NCBI
|