Introduction
With the advent of diagnostic and therapeutic
innovations, recent patients with gastric cancer in Japan have a
better chance of being diagnosed in the early stages and living out
their lives. The Cancer Statistics in Japan indicated that 64% of
gastric cancer patients have Stage I disease, whose 5-year relative
survival rate after diagnosis was estimated to be 96.0% (1). Thus, mortality and patients'
views-related to their quality of life (QOL) following diagnosis
and treatment for gastric cancer-have become immensely important
(2,3). Observational studies identified
several factors associated with a decline of QOL in patients with
gastric cancer, including poor nutritional status and body
configurations (3-9).
For example, Climent et al reported that a loss of body
weight of ≥10% was associated with a deterioration of the
functional aspects of QOL among gastric cancer survivors (6). Likewise, skeletal muscle mass is one
of the critical determinants of sarcopenia and is closely related
to muscle strength and physical performance. Huang et al
found that patients with acute muscle wasting of over 10% had a
poorer QOL in terms of fatigue and physical functioning (7). However, the effect of its long-term
loss remains to be determined. Although computed tomography (CT)
equipment is necessary to measure skeletal muscle mass, it is often
readily available for postoperative surveillance of disease
recurrence in clinical practice. Therefore, we hypothesized that a
change in skeletal muscle mass at any time measured using CT images
could be associated with impaired QOL in postoperative patients
with gastric cancer. We conducted a cross-sectional study to
examine the association between a percentage decline from baseline
in skeletal muscle mass and postoperative QOL, both generic and
disease-specific, among gastric cancer survivors.
Materials and methods
Patients
The study comprised patients who underwent
gastrectomy for gastric cancer between April 2008 and September
2015 at the Department of Surgery II of Tokyo Women's Medical
University and had agreed to participate in the survey. Patients
who met at least one of the following conditions were not eligible
for the study: Followed-up less than 18 months after surgery, with
distant metastases at initial diagnosis, with recurrent disease,
and undergoing chemotherapy for other malignancies. In addition,
patients whose attending physicians deemed them not suitable as
participants were also ineligible.
Measurements and data collection
We recognized that the terms of health (or
functional) status, health-related QOL, and QOL are often used
interchangeably to refer to the same aspect of health (10-12).
For the present study, we put two components into the construct of
QOL: Disease-related aspects of daily life and overall perception
of one's health. The Postgastrectomy Syndrome Assessment Scale-45
(PGSAS-45) questionnaire is a disease-specific and generic QOL
questionnaire developed by the Japan Postgastrectomy Syndrome
Working Party for the measurement of QOL in patients with gastric
cancer (13). It consists of 45
items covering the following 4 domains: Gastrointestinal symptoms
(25 items), living status (9 items), dissatisfaction in everyday
life (3 items), and generic QOL (8 items). The generic QOL subscale
is the standard form-8 (SF-8) questionnaire, and scores of the
responses can be aggregated into two summary measures: the physical
component summary (PCS) and mental component summary (MCS).
Specifically, the items of the SF-8 are used to elicit respondents'
general functional status, except for one item which asks,
‘Overall, how would you rate your health during the past 4 weeks?’,
for which responses can range from very poor=1 to excellent=6 on a
Likert-type scale (14). The
gastrointestinal symptoms component consists of 15 items from the
Gastrointestinal Symptom Rating Scale (GSRS) (15) and 10 original items specific to
gastroesophageal reflux symptoms and dumping syndrome, which can
occur after gastrectomy.
Skeletal muscle mass was measured on axial abdominal
CT images that had been obtained both preoperatively and
postoperatively to rule out metastasis or the recurrence of cancer.
We measured total psoas major muscles area (TPA) between the third
and fourth lumbar vertebrae (L3-L4) using an image viewer system
(ShadeQuest/View C version 1; Yokogawa Medical Solutions, Tokyo,
Japan). We then calculated the skeletal muscle mass index (SMI,
mm2/m2) as (right TPA + left
TPA)/(height)2 because it has been shown to correlate
significantly with total skeletal muscle mass (16,17).
Patient characteristics retrieved from medical
records included age, body height, body weight, SMI, gender, stage
of disease, surgical procedures, and use of adjuvant
chemotherapy.
The percentage decline in the SMI (ΔSMI) from the
preoperative value to the postoperative value was calculated as
(SMI before surgery-SMI at the survey)/SMI before surgery x100.
Also, the percentage decline in body mass index (ΔBMI) was defined
as (BMI before surgery-BMI at the survey)/BMI before surgery x100.
We used ΔSMI to categorize participants into two groups with a
cut-off value of 10%: patients whose ΔSMI was <10% and those
with ΔSMI ≥10%. The cut-off value was based on a demarcation noted
in the literature (6,7).
Statistical analyses
Study data are shown as the number and percentage of
patients, mean (standard deviation; ± SD), median, or as median
(range) values. For numerical data, the assumption of Gaussian
distribution was examined using the Shapiro-Wilk test, and the
Box-Cox transformation was used where it was appropriate. We used
an unpaired t-test or the Wilcoxon rank-sum test to examine
the statistical significance of differences in numerical data
between patients with a DSMI <10% vs. ≥10%, and for categorical
data we used chi-squared test. We also calculated the effect size
(Cohen's d) for each difference to determine clinical significance.
An effect size of 0.2 is generally considered small, 0.5 is
moderate, and 0.8 is large with clinical importance (18). To explore the relationships between
the numerical data, we employed correlation analyses using
Pearson's r or Spearman's rho, depending on the distributions.
We calculated the gender-adjusted Z scores for PCS
and MCS of each patient based on national norm data of the
SF-8(14). The QOL of patients
with Z scores <-1.0 were deemed moderately or severely impaired.
Multiple linear regression analyses were used to explore the
association between PCS and DSMI controlling for other potential
confounders as follows: Age at survey, gender, disease stage,
surgical procedure, and use of chemotherapy. We examined
interactions between DSMI and other variables by comparing the
models with and without interaction terms using the
multiple-partial F test (19,20).
The proportion of variance in the dependent variable explained by
the explanatory variables was estimated using adjusted
R2, which accounted for the number of predictors. We
used JMP 13 (SAS Institute, Cary, NC, USA) and jamovi version
1.6.23(21) for the statistical
analyses and considered a two-sided P<0.05 to be statistically
significant.
Ethical considerations
Written informed consent was obtained from all
individual participants included in the study. The study was
conducted under approval of the Tokyo Women's Medical University
review board (approval no. 4056).
Results
Patients' characteristics
The median follow-up time from gastrectomy to the
survey was 48.5 months (range: 18-130). The clinical
characteristics of the 74 patients who participated in the study
are summarized in Table I. The
male/female ratio was 48/26, and the median age at the time of the
survey was 68.5 years (range: 41-89). Stage I, II, and III clinical
disease was observed in 54 (73%), 13 (17.5%), and 7 (9.5%)
patients, respectively. Thirty-eight (51.4%) patients underwent
distal gastrectomy, and 17 (23.0%) received total gastrectomy.
Adjuvant chemotherapy was administered to 14 (18.9%) patients. Mean
values for preoperative body weight, BMI, and SMI were 59.3 kg
(±11.6), 22.3 kg/m2 (±3.31), and 605
mm2/m2 (±161), respectively, and at the
postoperative survey they were 52.8 kg (±10.6), 19.8
kg/m2 (±3.15), and 552 mm2/m2
(±158), respectively.
 | Table IPatient characteristics. |
Table I
Patient characteristics.
| Characteristic | Value |
|---|
| Male/female, n | 48/26 |
| Median age, years
(min, max) | |
|
Time of
surgery | 65 (38, 87) |
|
Time of
survey | 68.5 (41, 89) |
| Disease stage, n
(%) | |
|
I | 54(73) |
|
II | 13 (17.5) |
|
III | 7 (9.5) |
| Gastrectomy, n
(%) | |
|
Distal
gastrectomy | 38 (51.4) |
|
Total
gastrectomy | 17 (23.0) |
|
Proximal
gastrectomy | 9 (12.2) |
|
Pylorus
preserving gastrectomy | 6 (8.1) |
|
Segmental
gastrectomy | 4 (5.4) |
| Reconstruction
method, n (%) | |
|
Billroth
I | 32 (43.2) |
|
Roux-en-Y | 23 (31.1) |
|
Esophageal
gastric anastomosis | 6 (8.1) |
|
Double
tract | 3 (4.1) |
|
Other | 10 (13.5) |
| Adjuvant
chemotherapy, n (%) | |
|
Not
reported | 60 (81.1) |
|
Reported | 14 (18.9) |
| Mean body weight,
kg (SD) | |
|
Preoperative | 59.3 (11.6) |
|
Time of
survey | 52.8 (10.6) |
| Mean BMI,
kg/m2 (SD) | |
|
Preoperative | 22.3 (3.31) |
|
Time of
survey | 19.8 (3.15) |
| Mean SMI,
mm2/m2 (SD) | |
|
Preoperative | 605(161) |
|
Time of
survey | 552(157) |
ΔSMI and its relationship with ΔBMI
and other variables
The mean values for ΔSMI and ΔBMI were 8.64% (±10.6)
and 10.5% (±9.4), respectively. Ten (13.5%) patients showed an
increase in ΔSMI and a decrease in ΔBMI, while four (5.4%) patients
experienced a decrease in ΔSMI and an increase in ΔBMI (Table II). There was no significant
correlation between ΔSMI and years from surgery to the survey
[Pearson's r=0.026, P=0.829 (data not shown)].
| Table IINumber of patients according to ΔSMI
and ΔBMI. |
Table II
Number of patients according to ΔSMI
and ΔBMI.
| | ΔBMI |
|---|
| ΔSMI | Decrease | No change | Increase |
|---|
| Decrease | 56 | 1 | 4 |
| No change | 0 | 0 | 0 |
| Increase | 10 | 1 | 2 |
We compared patients whose ΔSMI was ≥10% and those
with <10% in terms of gender, age at the time of the survey,
pathological stage, use of adjuvant chemotherapy, and the extent of
gastrectomy. Patients with ΔSMI <10% were more likely to have
stage I disease (60.6% vs. 82.9%, P=0.04) and were less likely to
have had a total gastrectomy (9.8% vs. 39.3%, P<0.01). There
were no statistically significant differences observed in the other
variables assessed (Table
III).
| Table IIIPatient characteristics. |
Table III
Patient characteristics.
| Characteristic | ΔSMI ≥10%
(n=33) | ΔSMI <10%
(n=41) | P-value |
|---|
| Male/female, n | 23/10 | 25/16 | 0.47b |
| Mean age at survey,
years (SD) | 69.1 (11.5) | 69.0 (8.9) | 0.99a |
| Median time from
surgery to survey, months (IQR) | 48 (33.5, 76) | 52 (33, 64.5) | 0.94 |
| Pathological stage
I disease, n (%) | 20 (60.6) | 34 (82.9) | 0.04b |
| Adjuvant
chemotherapy, n (%) | 8 (24.2) | 6 (14.6) | 0.38b |
| Total gastrectomy,
n (%) | 13 (39.3) | 4 (9.8) |
<0.01b |
Gastrointestinal symptoms and living
status
Patients with a ΔSMI ≥10% scored significantly
higher than those with a ΔSMI <10% in the subscale of abdominal
pain and total symptom score (Table
IV). Corresponding effect sizes were 0.61 [95% confidence
interval (CI): 0.13, 1.09] and 0.50 [95% CI: 0.02, 0.97],
respectively (data not shown). Observed differences in other
subscales and the four domains of living status did not reach
statistical significance.
| Table IVGastrointestinal symptoms and living
status. |
Table IV
Gastrointestinal symptoms and living
status.
| Variable | ΔSMI ≥10% | ΔSMI <10% | P-value |
|---|
| Gastrointestinal
symptomsa | | | |
|
Esophageal
reflux subscale | 1.9 (0.9) | 1.6 (0.9) | 0.20 |
|
Abdominal
pain subscale | 1.7 (0.9) | 1.3 (0.5) | 0.01 |
|
Meal-related
distress subscale | 2.4 (1.1) | 2.1 (1.0) | 0.25 |
|
Indigestion
subscale | 2.2 (1.0) | 1.9 (0.8) | 0.15 |
|
Diarrhea
subscale | 2.4 (1.2) | 1.9 (0.8) | 0.06 |
|
Constipation
subscale | 2.4 (1.1) | 2.1 (1.1) | 0.16 |
|
Dumping
subscale | 1.8 (0.9) | 1.5 (0.7) | 0.14 |
|
Total
symptom score | 2.1 (0.8) | 1.8 (0.6) | 0.04 |
| Living status | | | |
|
Food
ingested per meal | 6.1 (2.1) | 6.9 (1.9) | 0.09 |
|
Necessity
for additional mealsb | 2.1 (1.0) | 1.9 (0.7) | 0.26 |
|
Quality of
ingestion subscalec | 3.8 (1.1) | 4.0 (0.9) | 0.26 |
|
Ability to
workd | 1.9 (0.9) | 1.8 (0.7) | 0.35 |
Generic and disease-specific QOL
For the 74 patients overall, responses to the first
question in the SF-8, ‘Overall, how would you rate your health
during the past 4 weeks?’, were distributed as follows: very
poor=0; poor=2 (3%), fair=5 (7%); good=44 (59%); very good=23
(31%); and excellent=0. The mean PCS was 50.6 (±5.7), which was
significantly higher than that of the general population (Cohen's
d=0.28, 95% CI: 0.04, 0.51; P=0.0018). The mean MCS was 50.4
(±5.5), and it was not higher than the average of the general
population (Cohen's d=0.15, 95% CI: -0.08, 0.38; P=0.06). The
duration of follow-up was significantly associated with MCS
(Spearman's rho=0.243, P=0.037) but not with PCS (Spearman's
rho=0.040, P=0.738). Z scores were <-1.0 for PCS in 5 (6.8%)
patients and for MCS in 6 (8.1%) patients. Patients with a ΔSMI
≥10% had significantly lower scores than those with a ΔSMI <10%
in the domain of general health and PCS (Table V). Corresponding effect sizes were
-0.51 (95% CI: -0.98, -0.03) and -0.52 (95% CI: -0.99 to -0.05),
respectively. Observed differences in other domains and MCS did not
reach statistical significance (data not shown).
| Table VGeneric and disease-specific QOL. |
Table V
Generic and disease-specific QOL.
| QOL factors | ΔSMI ≥10% | ΔSMI <10% | P-value |
|---|
| SF-8 | | | |
|
General
health | 50.2 (6.3) | 53.0 (5.0) | 0.03 |
|
Physical
functioning | 48.4 (7.9) | 50.6 (4.5) | 0.14 |
|
Role
physical | 49.1 (7.0) | 50.7 (5.0) | 0.26 |
|
Bodily
pain | 56.5 (7.0) | 57.1 (5.2) | 0.67 |
|
Vitality | 50.4 (6.2) | 52.2 (4.1) | 0.13 |
|
Social
functioning | 49.6 (7.0) | 51.3 (6.0) | 0.25 |
|
Mental
health | 53.1 (4.6) | 51.6 (6.3) | 0.25 |
|
Role
emotional | 50.9 (3.7) | 51.3 (4.9) | 0.70 |
| Physical component
summary | 49.0 (6.8) | 51.9 (4.2) | 0.03 |
| Mental component
summary | 50.9 (4.9) | 50.1 (5.9) | 0.55 |
| Disease-specific
QOL | | | |
|
Dissatisfaction
with symptoms | 1.9 (0.8) | 1.5 (0.7) | 0.06 |
|
Dissatisfaction
at meals | 2.4 (1.2) | 2.2 (1.0) | 0.57 |
|
Dissatisfaction
at working | 1.8 (0.9) | 1.5 (0.8) | 0.14 |
|
Dissatisfaction
with daily life subscalea | 2.0 (0.9) | 1.8 (0.7) | 0.14 |
Associations between ΔSMI and summary
scores for the SF-8
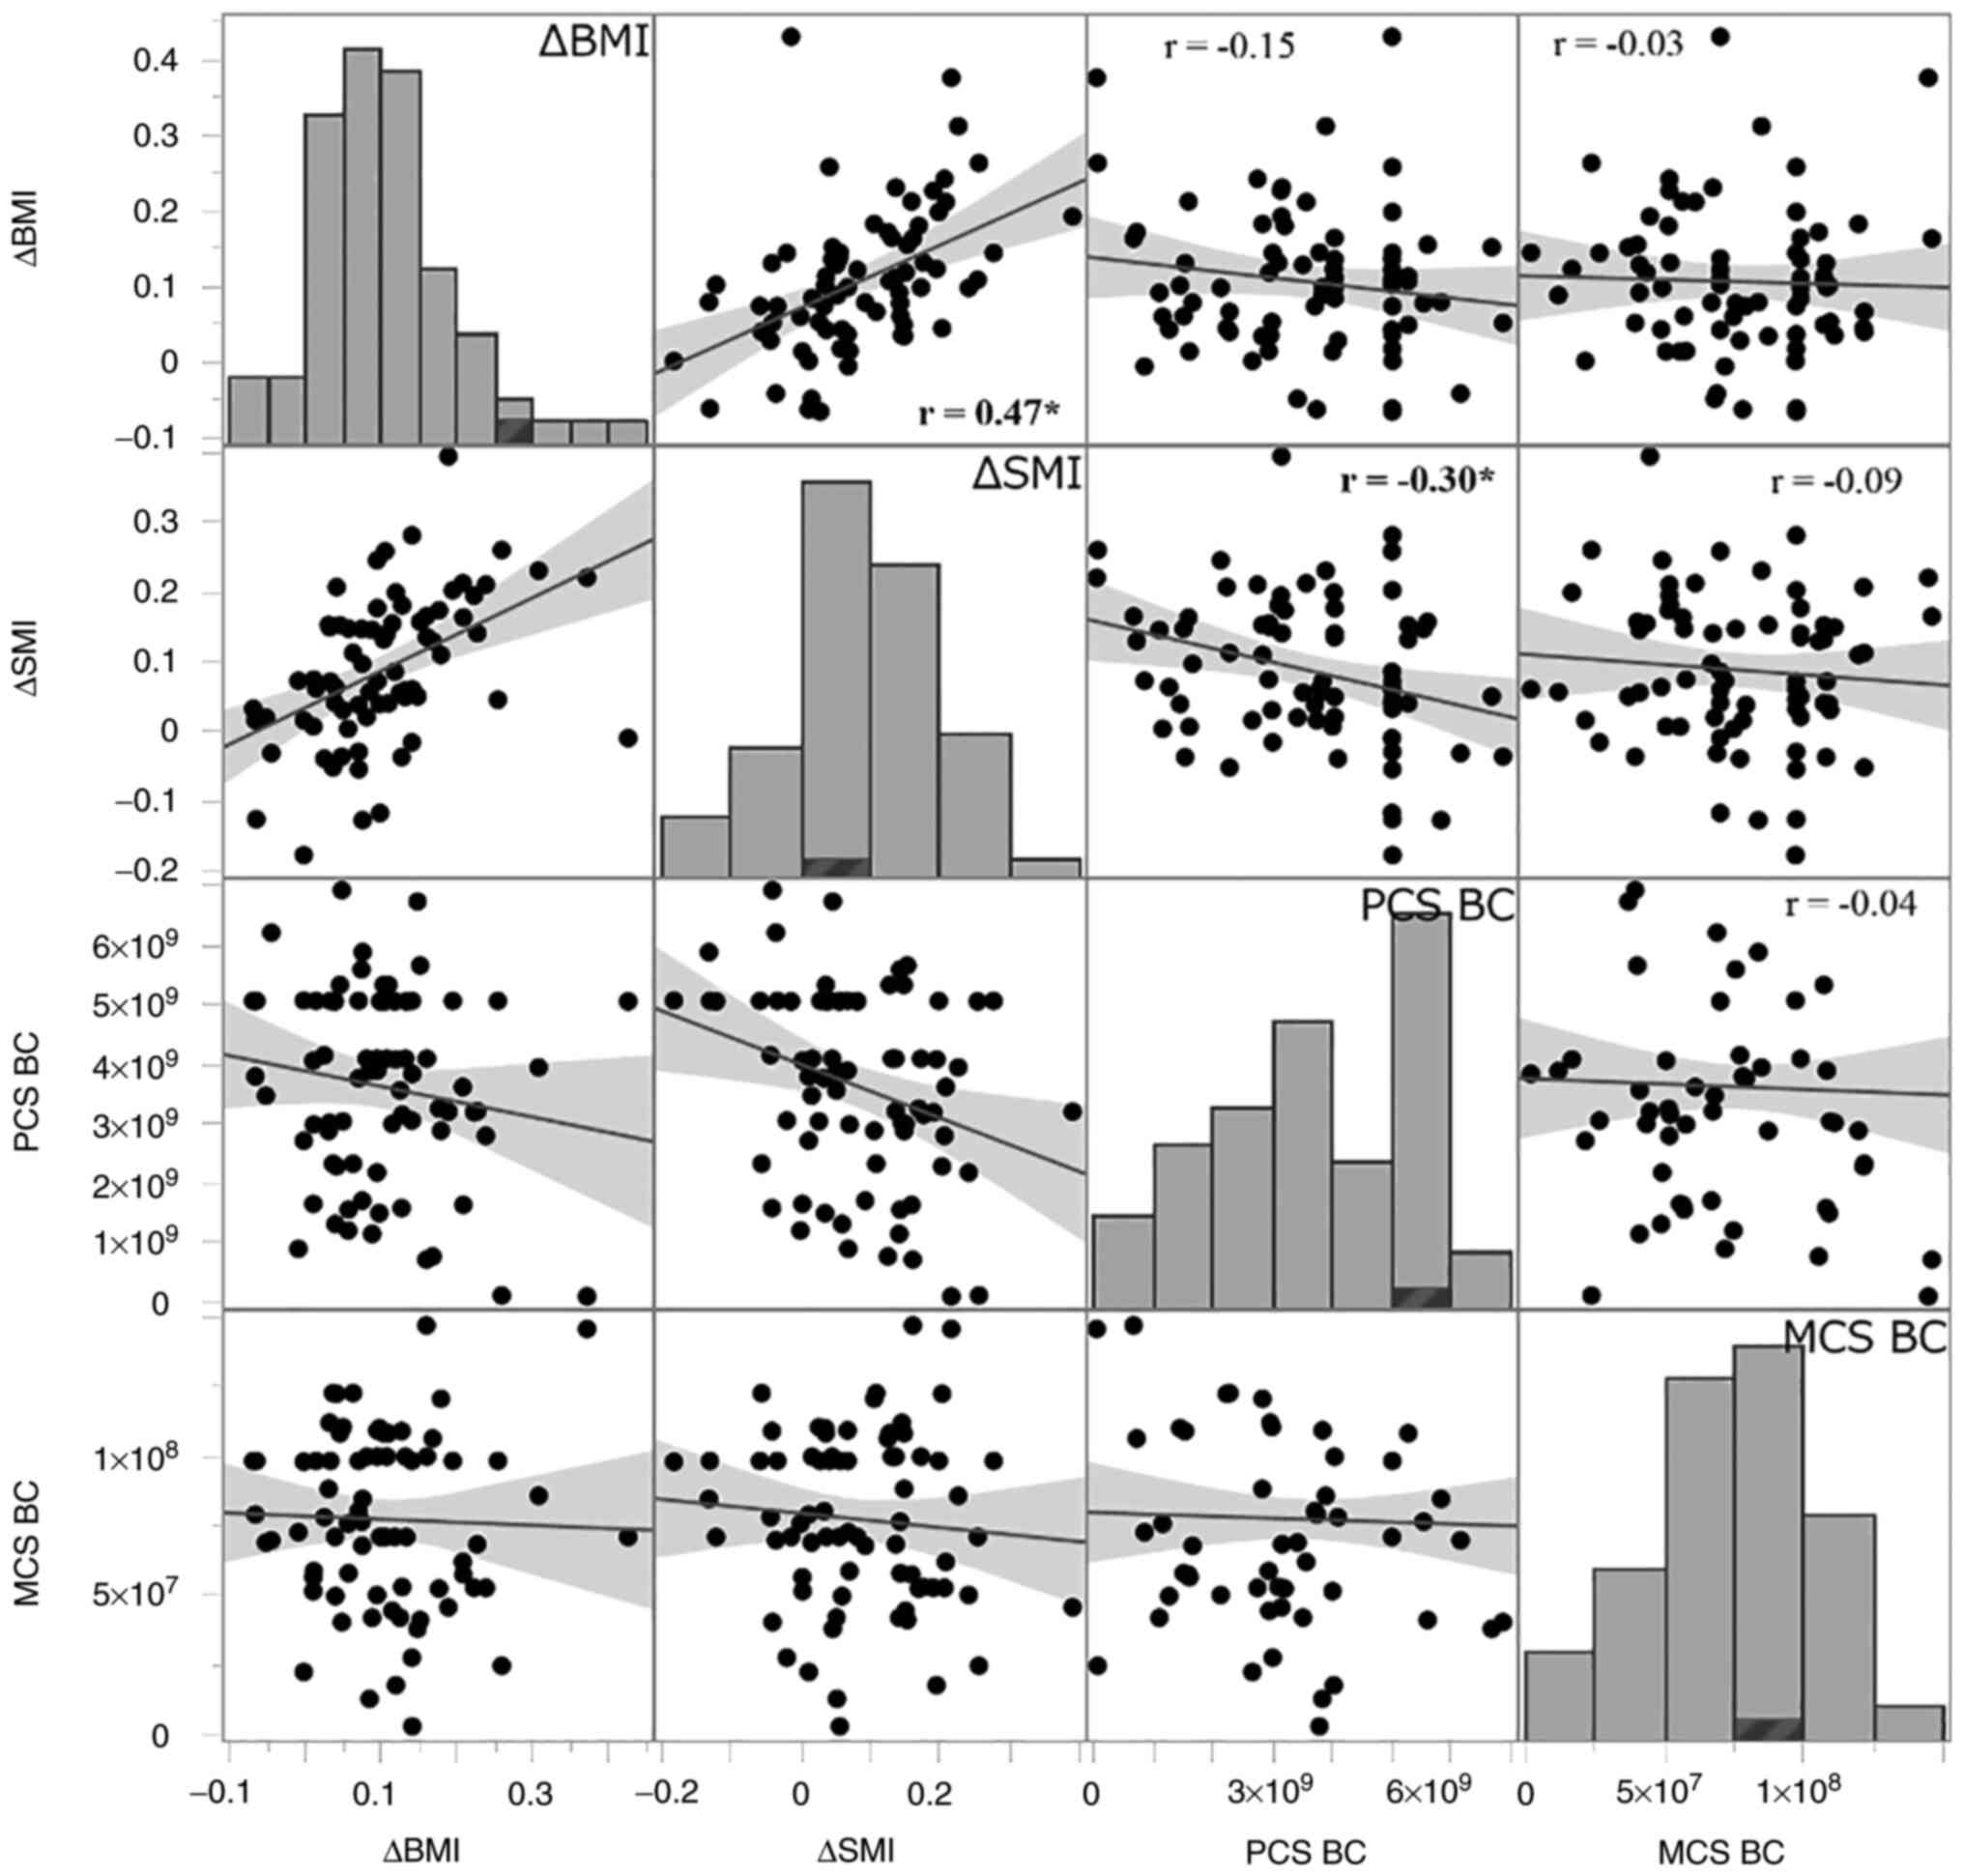
There was a positive correlation between ΔSMI and
ΔBMI, and Pearson's correlation coefficient was 0.47 (95% CI: 0.27,
0.63). ΔSMI was significantly associated with PCS (r=-0.30, 95% CI:
-0.52, -0.07) but not with MCS (r=-0.09, 95% CI: -0.32, 0.15). ΔBMI
had no significant correlations with either PCS (r=-0.15, 95% CI:
-0.38, 0.08) or MCS (r=-0.03, 95% CI: -0.27, 0.20) (Fig. 1). After controlling for potential
confounders, the multiple regression analysis showed that ΔSMI was
significantly associated with PCS decline, and its standardized
regression coefficient was -0.447 (95% CI: -0.209, -0.685)
(Table VI).
| Table VIMultiple regression analysis with PCS
as a dependent variablea. |
Table VI
Multiple regression analysis with PCS
as a dependent variablea.
| Variable | Standardized
regression coefficient (95% CI) | t-value | P-value |
|---|
| ΔSMI | -0.447 (-0.685,
-0.209) | -3.75 | <0.01 |
| Age at survey | -0.126 (-0.343,
0.090) | -1.16 | 0.25 |
| Time from surgery
to survey | 0.088 (-1.322,
0.308) | 0.80 | 0.43 |
| Female | 0.493 (-0.017,
0.896) | 1.92 | 0.06 |
| Stage I
disease | 0.686 (-0.232,
1.604) | 1.49 | 0.14 |
| Adjuvant
chemotherapy | -0.685 (-1.606,
0.235) | -1.49 | 0.14 |
| Total
gastrectomy | -0.605 (-1.339,
0.129) | -1.65 | 0.10 |
Multiple regression analyses with and without
interaction terms indicated that there were no significant
interactions (multiple-partial F test, F6, 60,
0.95=0.45, P>0.05; data not shown). The model without
interaction terms (F7, 66=3.18, P=0.006, adjusted
R2=0.173) showed that ΔSMI was significantly associated
with PCS decline, and its standardized regression coefficient was
-0.447 (95% CI: -0.209, -0.685) (Table VI).
Discussion
Although more than five decades have passed since
Elkinton introduced QOL for medical use in 1966(22), the conceptual and methodological
clarification of QOL has been challenging (23). Researchers have never unanimously
agreed upon what QOL means; the construct has become a kind of
umbrella under which many different indexes are included (24). Gill and Feinstein have argued that
domains of QOL measured by many researchers have been diverse
(11). Since two people with the
same clinical conditions may have quite different views on their
life quality, researchers need to be cautious about what it is that
they measure, health status or QOL (25,26).
In this regard, the PGSAS-45 questionnaire used in the present
study has distinct domains for post-gastrectomy symptoms, living
status, dissatisfaction with daily life, and generic QOL (13).
Clinical and research observations have shown that
surgery for gastric cancer led to nutritional sequelae due to
anatomical and physiological changes in the digestive tract.
Besides, the reduced production of ghrelin, which is mainly
secreted from the stomach and stimulates appetite and food intake,
may play a role in metabolic changes following gastrectomy
(27-30).
Gastrectomy reduces gastric acid secretion, which
reduces calcium absorption in the upper small intestine. Calcium is
an extremely important nutrient for the function of skeletal
muscles. A study on the relationship between calcium intake and
sarcopenia in the elderly showed that those with low calcium intake
have a significantly higher rate of sarcopenia, and it is thought
that nutritional guidance that considers the balance of minerals,
including calcium, plays an important role in suppressing the
decline in skeletal muscle mass (31). It is also important to leave a
large residual stomach to suppress abdominal symptoms, which is one
of the causes of QOL deterioration. Kunisaki et al reported
that patients with upper gastric cancer who underwent cardiac
gastrectomy obtained better scores on many PGSAS items than those
who underwent total gastrectomy (32). In addition to the importance of
selecting less invasive surgery, they also pointed out the
importance of dietary guidance and that close cooperation not only
with surgeons but also with allied medical professionals is
necessary to suppress the deterioration of postoperative QOL.
These alterations may variously manifest as reflux
symptoms, dumping syndrome, and/or chronic pain that may contribute
to both a poor nutritional status and QOL (2-5).
Rupp and Stengel identified 35 factors potentially associated with
QOL, depression, or anxiety in patients with gastric cancer and
classified them into nine categories: genetic condition, treatment
method, blood markers, nutritional status, daily living, state of
health, mental state, supportive care, and alternative treatment
(33). Moreover, they are likely
correlated with each other and affect patient QOL in a complex way
at the level of the individual (34,35).
Nevertheless, it would be helpful to identify clinical
characteristics that can predict nutritional status and QOL
deterioration. BMI can reflect nutritional status, but its change
does not necessarily parallel the change in skeletal muscle mass as
observed in the present study. Body weight, the primary variable in
the calculation of BMI, can be associated with factors other than
muscle volume. Although acute muscle wasting ≥10% within one week
after gastric cancer surgery was associated with a poorer QOL
(7), the relationship beyond 1
week after surgery has never been reported in the literature. We
found that a decrease in SMI (ΔSMI) ≥10% at a median follow-up of 4
years was significantly associated with impaired postoperative
health status and QOL. However, the mean summary scores for generic
QOL measured using the SF-8 was equal (mental) to or even superior
(physical) to the average of the general population. Furthermore,
it is interesting to note that 90% of the respondents indicated
their overall QOL (i.e., general health) was good or very good.
These observations are caveats to the stereotypical belief that
patients with functional or mental difficulties have a lower QOL
than those without them (26,36).
Skeletal muscle mass has become a critically
important concern of clinicians as sarcopenia and frailty have come
into sharper focus in recent years. Its decrease is also associated
with surgical complications (36-39).
The loss of skeletal muscle mass is multifactorial caused by
malnutrition, peri-operative chemotherapy, reduced exercise, aging,
or the disease itself (inflammation or cancer cachexia). Of these,
nutritional status is a particularly strong predictor of QOL in
cancer survivors and modifiable to the extent that appropriate
screening, assessment, and intervention could help patients
recovering from such a burden (40,41).
Besides, exercise therapy could have beneficial effects on
patients' QOL as well as their skeletal muscle mass (42,43).
We acknowledge some concerns that may threaten the
validity of the present study. First, periods from surgery to
survey varied among the survey participants. A few studies observed
that patients' nutritional status and QOL varied depending on
surgery time (3,4,44,45).
Yet acute effects of surgery on the measurements would be
negligible as all patients' time intervals between surgery and the
survey were more than 18 months. In particular, the relationship
between the changes in skeletal muscle mass and the time elapsed
may be non-linear and would not be captured by Pearson's
correlation coefficient. Second, the multiple regression analysis
captured only a part of the causal relationships of our
observations as it showed an adjusted R2 of 0.173, which
was relatively low. For the complex concept of QOL (23,34,35),
mathematical modeling has limitations in exploring the causal
pathway when some crucial variables may be unobserved or related in
complicated ways. In particular, the surgical procedures may be
effect modifiers of the relationship between QoL (PCS) and ΔSMI.
Subgroup or stratified analyses would be one choice to examine the
effect modification. However, such analyses may lead to small
stratum-specific sample sizes, resulting in an imprecise estimate
(46). Alternatively, we
constructed another hierarchically well-formulated multivariable
regression model with interaction terms. The multiple-partial F
test for regression coefficients of the interaction terms was not
statistically significant, indicating no interaction. Third, the
SF-8 questionnaire measures health status rather than respondents'
life quality (25). In fact, the
first item purported to measure overall QOL asks those surveyed to
‘rate your health’. This approach does not reflect respondents'
views about their circumstances unrelated to health (25). Fourth, we did not measure muscle
strength that could be associated with patients' QOL. However, as
it is one of the essential components of the definition of
sarcopenia (47), measuring muscle
strength may become an important consideration when evaluating
patients' nutritional status.
In conclusion, determining ΔSMI may help clinicians
to facilitate the objective evaluation of nutritional status and be
aware of the life quality of postoperative patients with gastric
cancer.
Acknowledgements
Not applicable.
Funding
Funding: No funding was received.
Availability of data and materials
The datasets used and/or analyzed during the current
study are available from the corresponding author on reasonable
request.
Authors' contributions
YU and AS made substantial contributions to
conception and design, acquisition of data, and analysis and
interpretation of data. TO made substantial contributions to
conception and design, and analysis and interpretation of date. All
authors confirm the authenticity of all of the raw data. All
authors contributed to the writing of the manuscript, and read and
approved the final manuscript.
Ethics approval and consent to
participate
Written informed consent was obtained from all
individual participants included in the study. The study was
conducted under approval of the Tokyo Women's Medical University
review board (approval no. 4056).
Patient consent for publication
In regard to patient consent for publication, all
identifying information was removed, and we obtained written
permission for publication from all patients who participated in
this study.
Competing interests
The authors declare that they have no competing
interests.
References
|
1
|
Foundation for Promotion of Cancer
Research: Cancer statistics in Japan 2019. https://ganjoho.jp/data/reg_stat/statistics/brochure/2019/cancer_statistics_2019.pdf.
Accessed May 29, 2020 (In Japanese).
|
|
2
|
Thybusch-Bernhardt A, Schmidt C, Küchler
T, Schmid A, Henne-Bruns D and Kremer B: Quality of life following
radical surgical treatment of gastric carcinoma. World J Surg.
23:503–508. 1999.PubMed/NCBI View Article : Google Scholar
|
|
3
|
Kobayashi D, Kodera Y, Fujiwara M, Koike
M, Nakayama G and Nakao A: Assessment of quality of life after
gastrectomy using EORTC QOL-C30 and STO22. World J Surg.
35:357–364. 2011.PubMed/NCBI View Article : Google Scholar
|
|
4
|
Lim HS, Cho GS, Park YH and Kim SK:
Comparison of quality of life and nutritional status in gastric
cancer patients undergoing gastrectomies. Clin Nutr Res. 4:153–159.
2015.PubMed/NCBI View Article : Google Scholar
|
|
5
|
Carey S, Storey D, Biankin AV, Martin D,
Young J and Farinelli MA: Long-term nutritional status and quality
of life following major upper gastrointestinal surgery-a
cross-sectional study. Clin Nutr. 30:774–779. 2011.PubMed/NCBI View Article : Google Scholar
|
|
6
|
Climent M, Munarriz M, Blazeby JM,
Dorcaratto D, Ramon JM, Carrera MJ, Fontane L, Grande L and Pera M:
Weight loss and quality of life in patients surviving 2 years after
gastric cancer resection. Eur J Surg Oncol. 43:1337–1343.
2017.PubMed/NCBI View Article : Google Scholar
|
|
7
|
Huang DD, Ji YB, Zhou DL, Li B, Wang SL,
Chen XL, Yu Z and Zhuang CL: Effect of surgery-induced acute muscle
wasting on postoperative outcomes and quality of life. J Surg Res.
218:58–66. 2017.PubMed/NCBI View Article : Google Scholar
|
|
8
|
Luu C, Arrington AK, Falor A and Kim J,
Lee B, Nelson R, Singh G and Kim J: Impact of gastric cancer
resection on body mass index. Ann Surg. 80:1022–1025.
2014.PubMed/NCBI
|
|
9
|
Yaguchi Y, Kumata Y, Horikawa M, Kiyokawa
T, Iinuma H, Inaba T and Fukushima R: Clinical significance of area
of psoas major muscle on computed tomography after gastrectomy in
gastric cancer patients. Ann Nutr Metab. 71:145–149.
2017.PubMed/NCBI View Article : Google Scholar
|
|
10
|
Guyatt GH, Feeny DH and Patrick DL:
Measuring health-related quality of life. Ann Intern Med.
118:622–629. 1993.PubMed/NCBI View Article : Google Scholar
|
|
11
|
Gill TM and Feinstein AR: A critical
appraisal of the quality of quality-of-life measurements. JAMA.
272:619–626. 1994.PubMed/NCBI
|
|
12
|
Karimi M and Brazier J: Health,
health-related quality of life, and quality of life: What is the
difference? Pharmacoeconomics. 34:645–649. 2016.PubMed/NCBI View Article : Google Scholar
|
|
13
|
Nakada K, Ikeda M, Takahashi M, Kinami S,
Yoshida M, Uenosono Y, Kawashima Y, Oshio A, Suzukamo Y, Terashima
M and Kodera Y: Characteristics and clinical relevance of
postgastrectomy syndrome assessment scale (PGSAS)-45: Newly
developed integrated questionnaires for assessment of living status
and quality of life in postgastrectomy patients. Gastric Cancer.
18:147–158. 2015.PubMed/NCBI View Article : Google Scholar
|
|
14
|
Fukuhara S and Suzukamo Y: Manual of the
SF-8 Japanese version. Institute for Health Outcomes and Process
Evaluation Research, Kyoto, pp13-24, 46-72, 2004 (In Japanese).
|
|
15
|
Svedlund J, Sjödin I and Dotevall G:
GSRS-a clinical rating scale for gastrointestinal symptoms in
patients with irritable bowel syndrome and peptic ulcer disease.
Dig Dis Sci. 33:129–134. 1988.PubMed/NCBI View Article : Google Scholar
|
|
16
|
Saito M, Seshimo A, Miyake K, Yamaguchi R
and Okamoto T: Efficiency of bioelectric impedance analysis as an
evaluation method of skeletal muscle mass after gastrectomy. Int
Surg. 102:422–426. 2017.
|
|
17
|
Hamaguchi Y, Kaido T, Okumura S, Kobayashi
A, Hammad A, Tamai Y, Inagaki N and Uemoto S: Proposal for new
diagnostic criteria for low skeletal muscle mass based on computed
tomography imaging in Asian adults. Nutrition. 32:1200–1205.
2016.PubMed/NCBI View Article : Google Scholar
|
|
18
|
Ellis PD: The essential guide to effect
sizes: Statistical power, meta-analysis, and the interpretation of
research results. Cambridge University Press, Cambridge, pp3-30,
2010.
|
|
19
|
Kleinbaum DG: Logistic Regression: A
Self-Learning Text. Springer-Verlag, New York, NY, pp161-226,
1994.
|
|
20
|
Kleinbaum DG, Kupper LL and Muller KE:
Applied Regression Analysis and Other Multivariable Methods. 2nd
edition. Duxbury Press, Belmont, CA, pp124-143, 1988.
|
|
21
|
The jamovi project, jamovi version 1.6
[Computer Software]. https://www.jamovi.org. Accessed September 26,
2021.
|
|
22
|
Elkinton JR: Medicine and quality of life.
Ann Intern Med. 64:711–714. 1966.PubMed/NCBI View Article : Google Scholar
|
|
23
|
Haraldstad K, Wahl A, Andenaes R, Andersen
JR, Andersen MH, Beisland E, Borge CR, Engebretsen E, Eisemann M,
Halvorsrud L, et al: A systematic review of quality of life
research in medicine and health sciences. Qual Life Res.
28:2641–2650. 2019.PubMed/NCBI View Article : Google Scholar
|
|
24
|
Feinstein AR: Clinimetric perspectives. J
Chronic Dis. 40:635–640. 1987.PubMed/NCBI View Article : Google Scholar
|
|
25
|
Lara-Muñoz C and Feinstein AR: How should
quality of life be measured? J Investig Med. 47:17–24.
1999.PubMed/NCBI
|
|
26
|
Leplège A and Hunt S: The problem of
quality of life in medicine. JAMA. 278:47–50. 1997.PubMed/NCBI View Article : Google Scholar
|
|
27
|
Wu JT and Kral JG: Ghrelin: Integrative
neuroendocrine peptide in health and disease. Ann Surg.
239:464–474. 2004.PubMed/NCBI View Article : Google Scholar
|
|
28
|
De Vriese C and Delporte C: Ghrelin: A new
peptide regulating growth hormone release and food intake. Int J
Biochem Cell Biol. 40:1420–1424. 2008.PubMed/NCBI View Article : Google Scholar
|
|
29
|
Kizaki J, Aoyagi K, Sato T, Kojima M and
Shirouzu K: Production of ghrelin by the stomach of patients with
gastric cancer. Kurume Med J. 60:99–104. 2013.PubMed/NCBI View Article : Google Scholar
|
|
30
|
Tuero C, Valenti V, Rotellar F, Landecho
MF, Cienfuegos JA and Fruhbeck G: Revisiting the ghrelin changes
following bariatric and metabolic surgery. Obes Surg. 30:2763–2780.
2020.PubMed/NCBI View Article : Google Scholar
|
|
31
|
Seo MH, Kim MK, Park SE, Rhee EJ, Park CY,
Lee WY, Baek KH, Song KH, Kang MI and Oh KW: The association
between daily calcium intake and sarcopenia in older, non-obese
Korean adults: The fourth Korea National Health and Nutrition
Examination Survey (KNHANES IV) 2009. Endocr J. 60:679–686.
2013.PubMed/NCBI View Article : Google Scholar
|
|
32
|
Kunisaki C, Yoshida K, Yoshida M,
Matsumoto S, Arigami T, Sugiyama Y, Seto Y, Akiyama Y, Oshio A and
Nakada K: Effects of proximal gastrectomy and various clinical
factors on postoperative quality of life for upper-third gastric
cancer assessed using the Postgastrectomy Syndrome Assessment
Scale-45 (PGSAS-45): A PGSAS NEXT Study. Ann Surg Oncol.
29:3899–3908. 2022.PubMed/NCBI View Article : Google Scholar
|
|
33
|
Rupp SK and Stengel A: Influencing factors
and effects of treatment on quality of life in patients with
gastric cancer-A systematic review. Front Psychiatry.
12(656929)2021.PubMed/NCBI View Article : Google Scholar
|
|
34
|
Pennacchini M, Bertolaso M, Elvira MM and
De Marinis MG: A brief history of the quality of life: Its use in
medicine and in philosophy. Clin Ter. 162:e99–e103. 2011.PubMed/NCBI
|
|
35
|
McClimans L and Browne JP: Quality of life
is a process not an outcome. Theor Med Bioeth. 33:279–292.
2012.PubMed/NCBI View Article : Google Scholar
|
|
36
|
Moons P, Van Deyk K, De Bleser L, Marquet
K, Raes E, De Geest S and Budts W: Quality of life and health
status in adults with congenital heart disease: A direct comparison
with healthy counterparts. Eur J Cardiovasc Prev Rehabil.
13:407–413. 2006.PubMed/NCBI View Article : Google Scholar
|
|
37
|
Wang SL, Zhuang CL, Huang DD, Pang WY, Lou
N, Chen FF, Zhou GJ, Shen X and Yu Z: Sarcopenia adversely impacts
postoperative clinical outcomes following gastrectomy in patients
with gastric cancer: A prospective study. Ann Surg Oncol.
23:556–564. 2016.PubMed/NCBI View Article : Google Scholar
|
|
38
|
Sakurai K, Kubo N, Tamura T, Toyokawa T,
Amano R, Tanaka H, Muguruma K, Yashiro M, Maeda K, Hirakawa K and
Ohira M: Adverse effects of low preoperative skeletal muscle mass
in patients undergoing gastrectomy for gastric cancer. Ann Surg
Oncol. 24:2712–2719. 2017.PubMed/NCBI View Article : Google Scholar
|
|
39
|
Yamaoka Y, Fujitani K, Tsujinaka T,
Yamamoto K, Hirao M and Sekimoto M: Skeletal muscle loss after
total gastrectomy, exacerbated by adjuvant chemotherapy. Gastric
Cancer. 18:382–389. 2015.PubMed/NCBI View Article : Google Scholar
|
|
40
|
Lis CG, Gupta D, Lammersfeld CA, Markman M
and Vashi PG: Role of nutritional status in predicting quality of
life outcomes in cancer: A systematic review of the epidemiological
literature. Nutr J. 11(27)2012.PubMed/NCBI View Article : Google Scholar
|
|
41
|
Gielen E, Beckwee D, Delaere A, De
Breucker S, Vandewoude M and Bautmans I: Sarcopenia Guidelines
Development Group of the Belgian Society of Gerontology and
Geriatrics (BSGG). Nutritional interventions to improve muscle
mass, muscle strength, and physical performance in older people: An
umbrella review of systematic reviews and meta-analyses. Nutr Rev.
79:121–147. 2021.PubMed/NCBI View Article : Google Scholar
|
|
42
|
Singh B, Hayes SC, Spence RR, Steele ML,
Millet GY and Gergele L: Exercise and colorectal cancer: A
systematic review and meta-analysis of exercise safety, feasibility
and effectiveness. Int J Behav Nutr Physic Act.
17(122)2020.PubMed/NCBI View Article : Google Scholar
|
|
43
|
Beckwee D, Delaere A, Aelbrecht S, Baert
V, Beaudart C, Bruyere O, de Saint-Hubert M and Bautmans I:
Exercise interventions for the prevention and treatment of
sarcopenia. A systematic umbrella review. J Nutr Health Aging.
23:494–502. 2019.PubMed/NCBI View Article : Google Scholar
|
|
44
|
Kim AR, Cho J, Hsu YJ, Choi MG, Noh JH,
Sohn TS, Bae JM, Yun YH and Kim S: Changes of quality of life in
gastric cancer patients after curative resection: A longitudinal
cohort study in Korea. Ann Surg. 256:1008–1013. 2012.PubMed/NCBI View Article : Google Scholar
|
|
45
|
Aahlin EK, Tranø G, Johns N, Horn A,
Søreide JA, Fearon KC, Revhaug A and Lassen K: Health-related
quality of life, cachexia and overall survival after major upper
abdominal surgery: A prospective cohort study. Scand J Surg.
106:40–46. 2017.PubMed/NCBI View Article : Google Scholar
|
|
46
|
Kleinbaum DG, Kupper LL and Morgenstern H:
Epidemiologic Research: Principles and Quantitative Methods. Wiley,
New York, NY, pp447-456, 1982.
|
|
47
|
Cruz-Jentoft AJ, Bahat G, Bauer J, Boirie
Y, Bruyere O, Cederholm T, Cooper C, Landi F, Rolland Y, Sayer AA,
et al: Sarcopenia: Revised European consensus on definition and
diagnosis. Age Ageing. 48:16–31. 2019.PubMed/NCBI View Article : Google Scholar
|