Introduction
Machine learning is a subset of artificial
intelligence, aimed at developing ‘intelligent’ algorithms that
harness data to execute tasks with optimal performance (1). Machine learning algorithms can be
broadly split into four categories: Supervised, semi-supervised,
unsupervised and reinforcement-learning (2). In supervised learning, the algorithm is
given a dataset known as ‘training data’, where each training
sample corresponds to one or several inputs and the desired output
(3). Through an iterative process,
the algorithm determines a function which can correctly predict the
desired output from a set of new, previously unknown inputs.
Supervised machine-learning tasks include classification,
regression and forecasting (4).
Unsupervised learning, conversely, is carried out on unlabeled
datasets with the aim of extracting patterns and information
without external supervision (5).
Semi-supervised learning, as indicated by the name, falls somewhere
between supervised and unsupervised techniques, as only a portion
of the training data is labeled (6).
Lastly, during reinforcement learning tasks, an intelligent agent
takes actions in a set environment (7). The actions return a reward, while also
influencing the environment and the state of the agent. The goal of
the agent is to ‘learn’ the policy which maximizes the reward
function, or more generally, maximizes the reinforcement signal
that is generated by the rewards (8).
Machine learning approaches, as a whole, have become
increasingly relevant in the current era of ‘big data’. Data
technologies are rapidly evolving, with data storage sizes entering
petabytes, cloud services enabling high data transfer speed and
computational systems shifting towards high performance cluster
computing (9-11).
This has allowed the implementation of machine learning in a range
of diverse fields, including healthcare. A trove of biomedical data
is generated daily throughout the process of medical practice and
patient care. Examples of such data include imaging results
(ultrasounds, magnetic resonance imaging, computed tomography
scans), laboratory test results (cell cultures, biological material
analyses and sequencing), patient medical history, drug effects and
interactions and patient health outcomes (12). These can be regarded as attractive
targets for the implementation of machine learning algorithms,
wherein the desired objective is tailored to the respective
challenge.
The prediction of disease complications constitutes
a key aspect of patient treatment and management (13). The study published in 2022 by Ghosheh
et al (14) investigated the
use of a predictive system to predict the risk of developing
complications in patients diagnosed with coronavirus disease 2019
(COVID-19), trained on data of >3,000 patients in the United
Arab Emirates. The prediction of disease complications, overall,
can be interpreted as a predictive classification problem, thus
opening the door to the application of supervised machine learning
algorithms. The current status of the patient can be analyzed by
diagnostic classification models, while potential outcomes can be
predicted by prognostic classification models (15). Predictive classification algorithms
have been implemented in the context of various diseases within the
past years. During the peak of the recent severe acute respiratory
syndrome coronavirus 2 (SARS-CoV-2) pandemic, classification models
were designed to tackle various aspects of the disease, such as the
detection of viral infection through X-ray imaging and CT scans or
the prediction of outcomes of patients with COVID-19 using their
recorded characteristics as input (16-18).
This is even more important under the scope of personalized
medicine, as the individual patient profile, which includes
features, such as comorbidities, age, ethnic background etc., may
affect disease progression and clinical manifestations (19). In a number of cases, several
conditions, or labels, may be assigned to a single patient; for
example, an individual may be suffering from COVID-19, while also
exhibiting cardiovascular issues and high cholesterol. In such a
case, the challenge of building predictive models can be regarded
as a multi-label classification problem.
This type of classification task falls under the
supervised machine learning ‘umbrella’ and constitutes a modeling
problem where the class, also known as target or label, is
predicted for a data point, otherwise known as input sample
(20). In single-label
classification, from a collection of discrete L
(L>1) labels, a single label ‘l’ is assigned to
each input sample (21). If the
number of labels L is 2, the task is considered a binary
classification problem, whereas if the number of labels
L>2, it is considered a multiclass classification problem
(22). In the case where each input
sample is associated with a set of non-exclusive class labels, the
task is called multi-label classification (23).
One of the common challenges in classification and
even more so in the case of multi-label, biomedical datasets, is
the presence of imbalanced data (24). In the multi-label setting, imbalance
can be traced to three distinct levels, imbalance within labels,
imbalance between labels and imbalance within label sets (25). In inter-label imbalance, the label
column contains a disproportionate ratio of negative vs. positive
samples, effectively obscuring the signal of the particular label
(26). In intra-label imbalance,
there is difference in frequency between labels, with frequency
most often termed as the number of positive instances (27). Labels with an abundance of positive
samples are considered in majority, while the rest are minority
labels (28). In multi-label
classification, there is a possibility for a sample to
simultaneously contain a label in minority and another label that
is in majority. Labels in majority are termed head labels and
labels in minority tail label (29).
The last source of multi-label imbalance is the existence of label
sets, where some sets may be more frequent in the dataset than
others (30-32).
Myocardial infarction (MI), or more generally known
as a ‘heart attack’, is caused by a decrease or total interruption
in blood flow to part of the myocardium (33). As per the World Health Organization,
more than four out of five cardiovascular disease-related deaths
are due to heart attacks and strokes, while a third of these deaths
concern individuals aged <70 years (34). Thrombosis has been established as the
most prominent driver of acute MI, itself stemming from events of
atherosclerosis and inflammation (35). Atherosclerotic lesions emerge as
thickening of the coronary inner walls of the artery or as fatty
streaks, ultimately leading to thrombus formation (36). During their hospitalization, patients
with acute MI often face severe complications, such as shock,
stroke, atrioventricular block, respiratory failure and
cardiopulmonary arrest (37-39).
Shock and posterior cerebral artery, in particular, constitute
prevalent causes of mortality in patients with acute MI (40). Establishing a robust plan of action
is inextricably linked to the successful management of MI-related
complications in the hospital setting. Therefore, the application
of a classification model to predict potential MI complications may
prove useful in informing the decision-making of medical
professionals.
In the present study, to demonstrate the potential
of leveraging biomedical patient data in the context of predictive
classification, a multi-label classification model was trained on a
recently released, public dataset of MI patient data.
Data and methods
Data collection and preprocessing
Machine-learning tasks require, first and foremost,
a solid data-related foundation, for the implementation and
validation of the framework and its constituent algorithms. To
explore the multi-label classification task, a public dataset
regarding the outcomes of patients with MI was retrieved (41). The original dataset consists of 114
descriptive metrics collected for a total of 1,700 patients with
MI, along with information regarding patient outcomes and
complications, split into 12 candidate categories. Descriptive
analytics of the dataset and information regarding the convention
of column names can be found in Table
SI. The recorded patient metrics are of mixed nature, falling
into one of the following types: Binary, real and ordinal. The
binary data stems from two attribute-handling approaches during the
dataset's original creation. First, categorical variables were
dummy coded into 0 and 1; for example, the column ‘SEX’ where
values ‘female’ and ‘male’ were arbitrarily encoded to 0 and 1,
respectively. Secondly, binary encoding was used to indicate
presence or absence of attributes, such as in the ‘symptomatic
hypertension’ (SIM_GIPERT) column, where presence or absence was
encoded to 1 and 0, respectively. The real, or numerical data,
within the dataset mainly concern patient measurements taken during
assessment by the medical professionals and throughout
hospitalization, such as ‘systolic blood pressure according to
Emergency Cardiology Team’ (S_AD_KBRIG). Lastly, the ordinal
feature data contained values with intrinsic order; for example,
the column ‘presence of essential hypertension’ (GB), which took
values 0, 1, 2 or 3, corresponding to absence, stage 1, stage 2 and
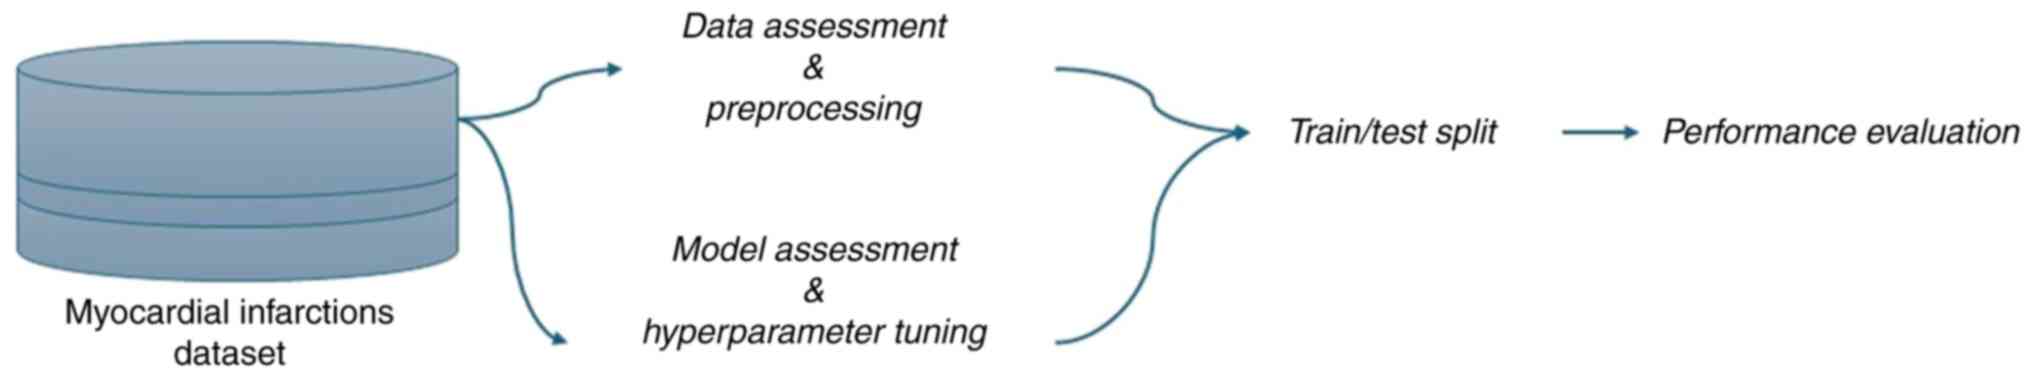
stage 3 essential hypertension. An overview of the steps of the
pipeline is presented in Fig. 1.
As per the dataset's curators, there are four
candidate time settings for the construction of the prediction
challenge: the time of admission to hospital, 24, 48 and 72 h
following hospital admission. The selection of time setting
determines the columns which can be used as input data during model
fitting. The end of the first day (24 h post-hospital admission),
was selected as the time setting for the present implementation of
the classification algorithm, leading to the exclusion of six input
columns, plus the patient ID column which serves no predictive
purpose.
Missing data constitutes a common issue in
biomedical datasets, as the process of data collection is
error-prone, particularly in a hospital setting where such
processes are rarely automated and are most often handled by the
doctors and nurses themselves. Discarding every single
sample/patient record that is missing a portion of the input
features could harm the potential of the classifier, as it would
markedly lessen the amount of information available to train the
classifier on. A common strategy to remedy this problem is data
imputation, where the missing data are imputed by various methods.
In the present pipeline, input columns which contained missing
values above a threshold of 85% of the total number of rows were
removed, and a multivariate imputer was used to estimate the
missing values in the rest of the dataset. Lastly, a baseline for
the type of target data was set. As aforementioned, the output
(target) data span columns 113-124 of the original dataset. All
columns but one contained data in binary form, denoting presence or
absence of a complication/outcome. To maintain the binary type
uniform across the output data, the singular column ‘lethal
outcome’ (LET_IS), which contained non-ordinal, numerical data, was
one-hot encoded. To one-hot encode a variable with n
possible, non-ordinal values, n separate columns are
generated and the presence or absence of the value in a sample is
denoted by 1 and 0, respectively. In the case at hand, numbers 0-7
had been assigned to the outcomes ‘alive’, ‘cardiogenic shock’,
‘pulmonary edema’, ‘myocardial rupture’, ‘progress of congestive
heart failure’, ‘thromboembolism’, ‘asystole’, ‘ventricular
fibrillation’, and were subsequently split into eight separate
binary data columns. The final dataset can be found in Table SII. Additionally, a detailed
description of the original MI database, descriptive statistics and
a list of the column abbreviations can be found via the following
weblink: 10.25392/leicester.data.12045261.v3.
Label relations exploration
In classification tasks, it is useful to explore the
label space and the associations between the labels reported within
the dataset. Graphs are increasingly used in the study of complex
systems, such as protein or traffic networks, enabling the
implementation of embedding algorithms (42). In the multi-label setting, graphs
represent multiple levels of information, as graph edges could
reflect a range of relationships between labels, from simpler to
more complex ones (43).
Furthermore, the study of clustering and interactions between
labels could elucidate more obscure factors underlying the
network's structure (44). For
example, a network of comorbidities represented as a multi-label
graph could provide insight into subtle interplays between
pathological conditions.
To explore the graph space, the Label Cooccurrence
Graph Builder class was imported from the skmultilearn.cluster
module as the graph builder base (45). The NetworkXLabelGraphClusterer class
from the same module was used to study the community and clustering
trends across the label instances by use of the Louvain method
(46), and NetworkX was used to
visualize the graph (47).
Data-driven model selection and
hyperparameter tuning
The selection of a classification algorithm is
entirely dependent on the nature of the multioutput problem
concerned, and there is no established guideline for choosing a
model. Two factors to be considered during the selection process
are performance and efficiency. Efficiency is inherently tied to
model aspects, such as its scalability, the type of label
combinations within the dataset, and so on. A classification
algorithm that exhibits high performance may suffer from low
efficiency; for example, choosing a model that trains a single
classifier per label would be unsuitable or too slow for a task
with a large label space. Performance may be viewed as the model's
generalization capability and there exist several evaluation
metrics that can be employed. Precision measures the model's
reliability in classifying a sample as positive, accuracy measures
how well the model performs across all the classes of the dataset
(48) and recall represents the
ratio of how many of the actual labels were correctly predicted
(49). While the aforementioned
metrics hold up well in cases of multi-class classification, in
multi-label classification, where the model's predictions can range
from fully or partially correct to fully incorrect, the adjustment
of evaluation measures is required to reflect these subtleties
(50). Hamming loss (HL) measures
the hamming distance between the true and the predicted label,
penalizing the incorrectly predicted labels in a predicted label
set individually; therefore, the metric is capable of reflecting
the notion of partially correct model predictions (23). The metric ranges from 0 to 1 and the
lower the HL, the better performance is exhibited by the
multi-label classification model.
To carry out data-driven model selection, a set of
algorithms were trained on the dataset and their performance was
evaluated by the HL metric. Parameters which control the model's
architecture are termed ‘hyperparameters’ and the process of
exploring possible choices towards an optimal model architecture is
termed ‘hyperparameter tuning’ (51). To carry out the step, aa
cross-validated grid search was employed. The method, which is
available through the GridSearchCV class of the scikit-learn
module, entails an exhaustive search over a parameter grid, in
order to yield optimal model parameters (52). Inputting an integer for the ‘cv’
parameter of the class enables a stratified k-fold split, where the
dataset is divided into k partitions and for each split, a search
through a user-set range of the hyperparameter spaces is executed,
fitting and scoring each combination to elect the hyperparameters
which lead to the best model performance (53). The pool of candidate classification
algorithms contained the following: Classifier Chains (CC) with
Random Forest as the base classifier, Classifier Chains with
XGBoost as the base classifier, Binary Relevance k-Nearest
Neighbors (BRkNN) Classifier, Random Forest (RF) Classifier,
Multi-label k-Nearest Neighbors Classifier (MLkNN) and OneVsRest
with XGboost, all of which are available through the scikit-learn
and XGBoost libraries (54,55).
Extreme Gradient Boosting (XGBoost) is an advanced
implementation of the Gradient Boosting decision tree algorithm
(55). Gradient Boosting builds the
first learner, a decision tree, on the training dataset to perform
the prediction of the target samples, then calculates the loss,
which is the difference between the true value (or true label) and
the predicted value that has been generated from the first learner
(56). The residual of the loss
function is calculated using the Gradient Descent Method and is
used as the target variable for the next iteration, where an
improved learner is built (57). In
brief, numerous models are trained sequentially, and the algorithm
aims to boost them into a strong learner which best predicts the
target. XGBoost implements parallel processing, increasing the
algorithm's speed ten-fold, compared to standard Gradient Boosting
(55). Furthermore, the algorithm is
flexible, allowing the user to select custom optimization
objectives and fine-tune booster and task parameters. XGBoost does
not naively support multi-output classification, hence, to
implement extreme gradient boosting in the multi-label
classification problem, the XGBoost model was wrapped inside the
MultiOutputClassifier class from the scikit-learn module (54).
Training and K-fold cross
validation
In traditional machine-learning model development,
the model is trained on a partition of the data, called the
training set, and a set of the data unseen to the model during
training is used as the test set, to evaluate the performance of
the algorithm based on new data (58,59).
K-fold cross validation entails dividing the dataset into k
non-overlapping groups of rows, then training the machine-learning
model on all the groups save for a hold-out fold, which is then
used as the test set (60). The
process is repeated across all folds, until each fold has been used
as the hold-out test set, and model performance is averaged across
the folds (61). To carry out k-fold
cross validation and account for the imbalanced multi-label
dataset, high-order iterative stratification was implemented via
the scikit-learn ‘iterative_stratification’ module (62,63). In
brief, dataset splits are created while maintaining balanced
representation of labels within each fold as much as possible. To
evaluate model performance on the imbalanced dataset, HL was
selected as the evaluation metric. Building, training and testing
the classifiers was carried out in a Jupyter environment, using a
4-core CPU and 2-core GPU-accelerated system.
Results
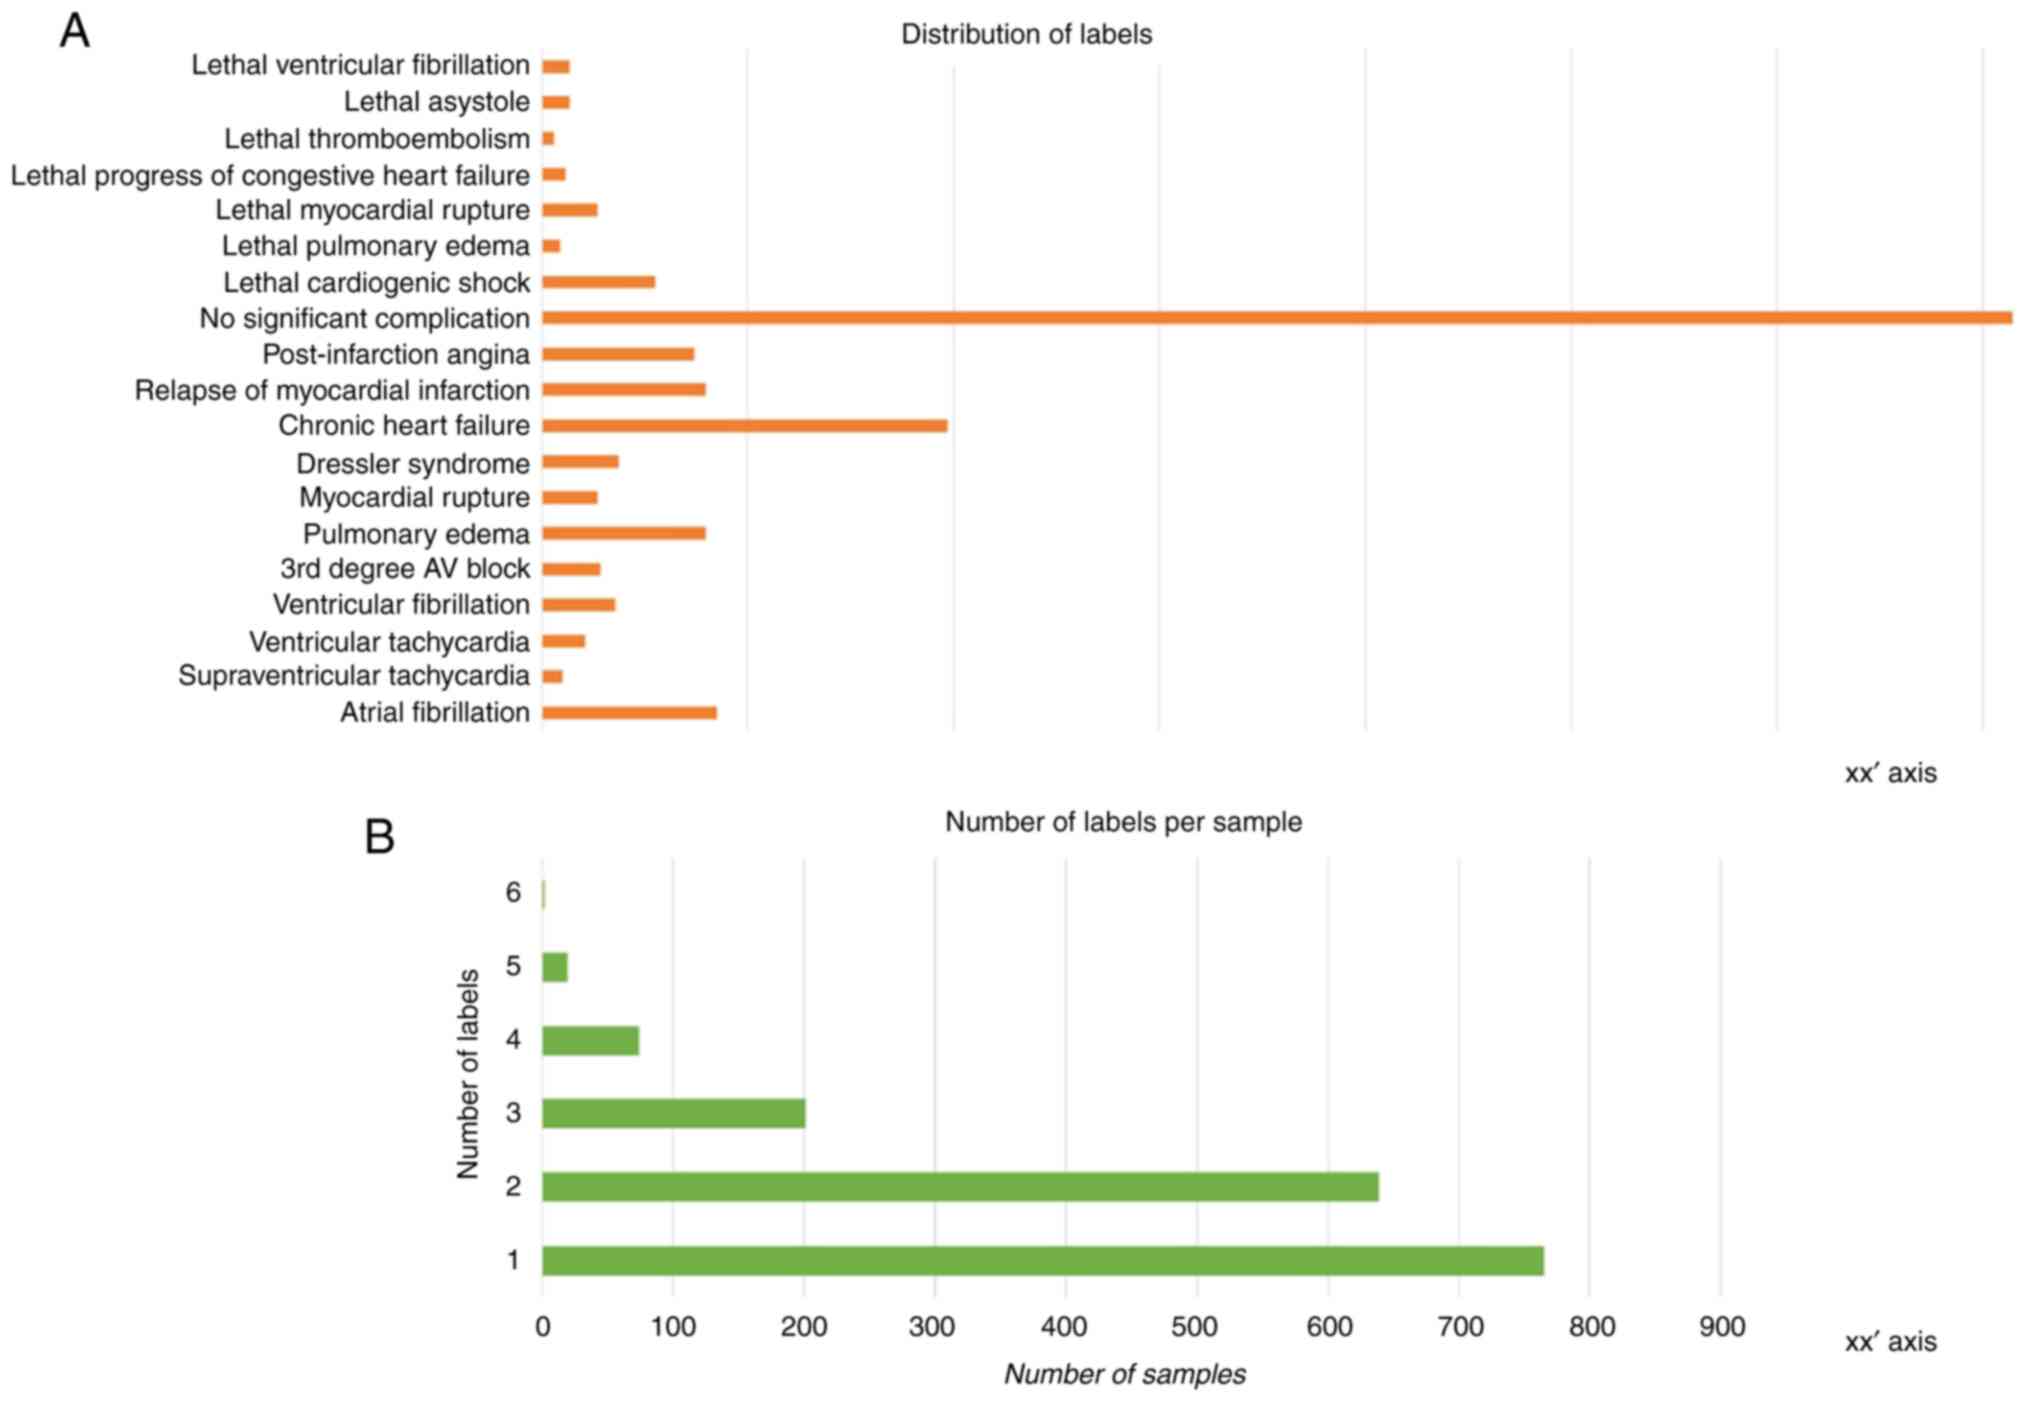
At the end of the data preprocessing steps, the
dataset contained 1,700 rows corresponding to 1,700 patient
samples, 100 columns of patient measurements/features serving as
the input (X) data and 18 columns of patient outcomes, serving as
the target label (y) data. As visible in the histogram plot
illustrated in Fig. 2A, there is
notable imbalance across the instance of labels. The number of
labels per sample is also varied, with most samples assigned one or
two labels and very few samples exhibiting more than three labels
(Fig. 2B). This can be traced back
to the challenge of data collection that was touched upon in the
introduction segment; the limited number of patients affects the
number of labels (outcomes) that happened to be present among them
and were thus recorded.
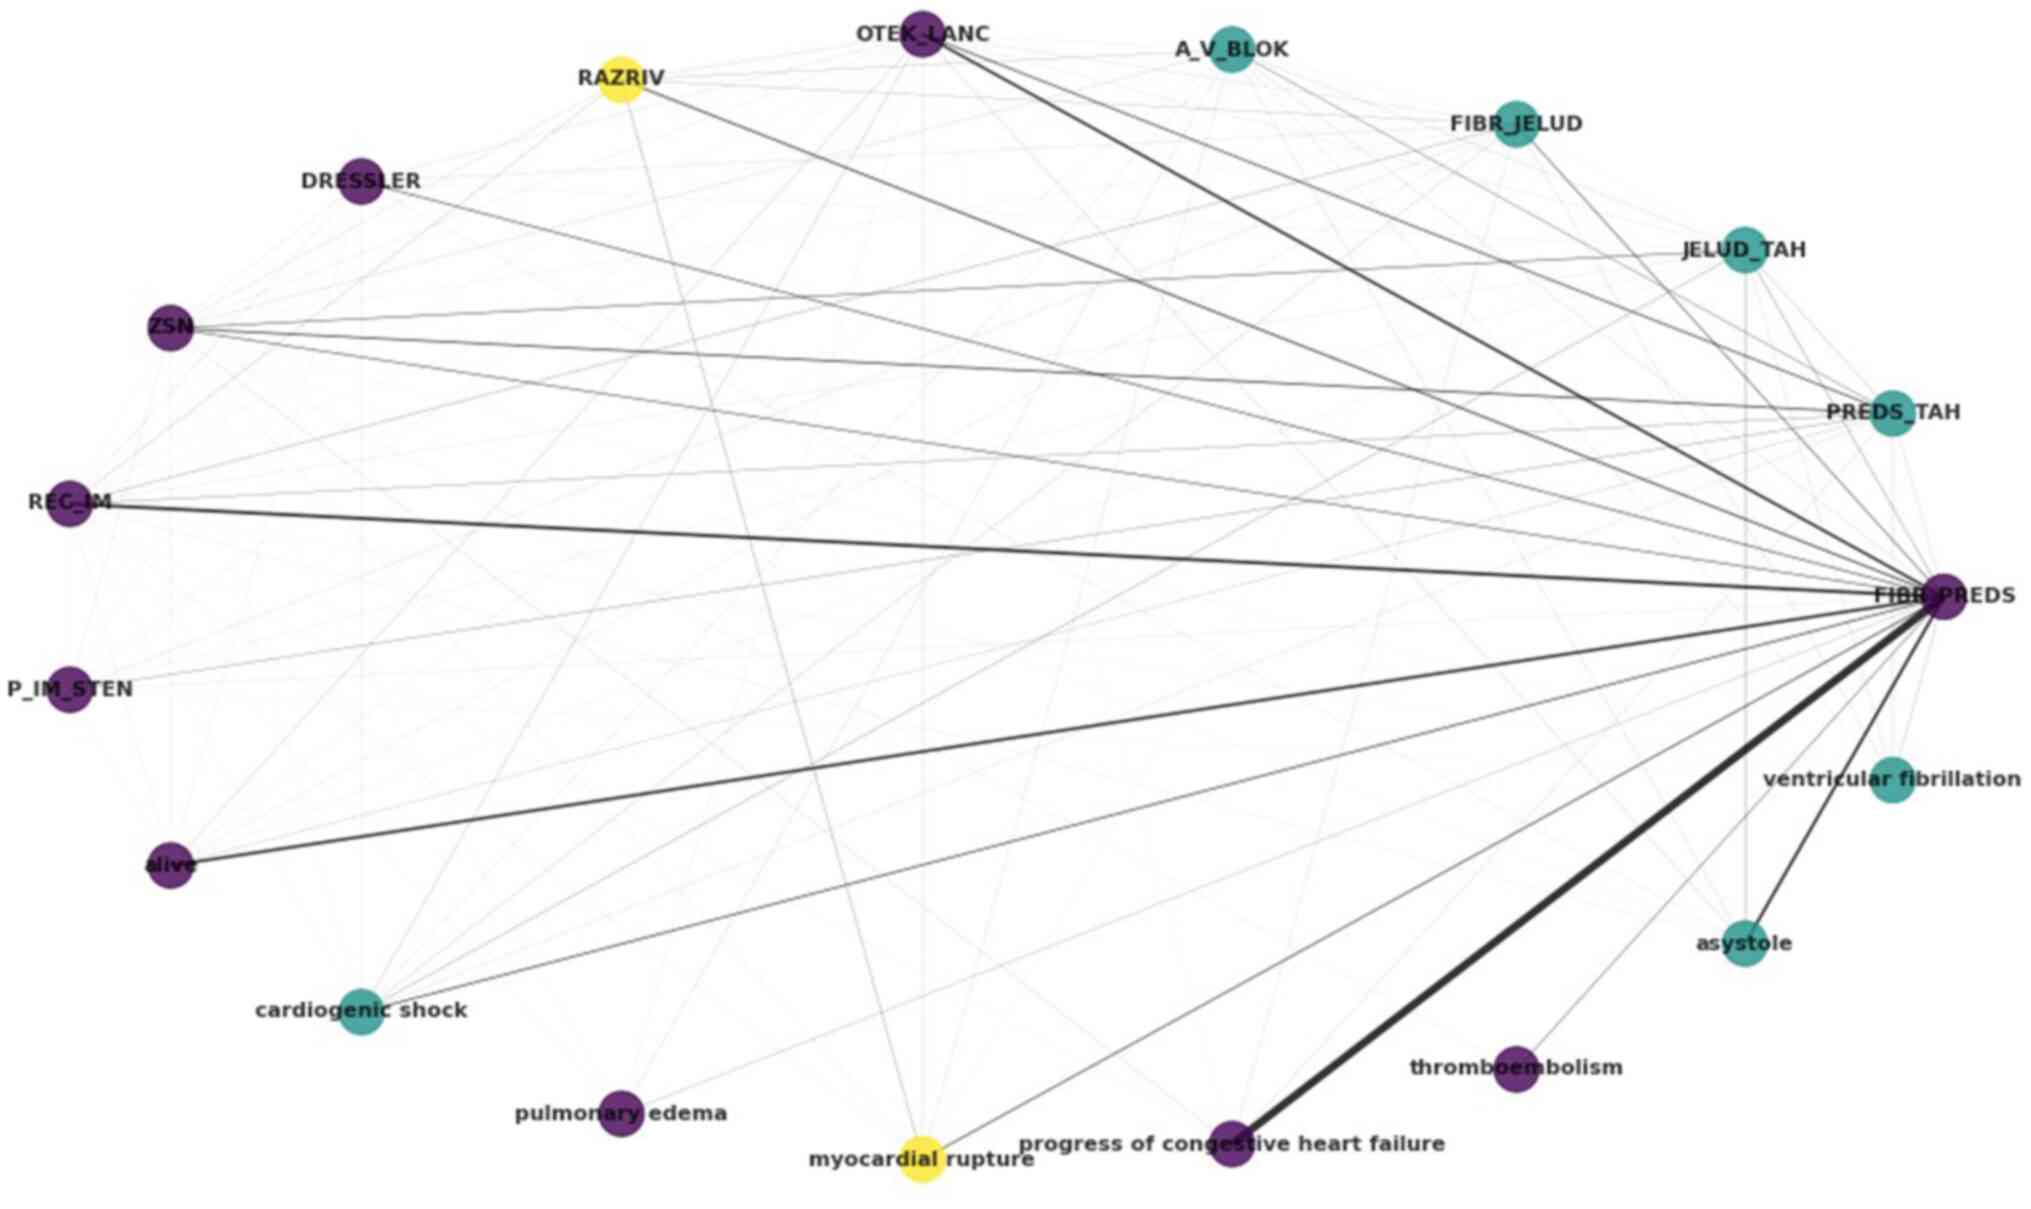
The output label portion of the dataset was used as
input to generate information regarding label interactions and
relationships. In the case at hand, the potential outcomes and
complications of hospitalized patients with MI are regarded as
labels. The results of the exploration of the label space can be
summarized in the circular graph of Fig.
3. Each label, i.e., each complication, is represented as a
node in the graph, with an edge existing when there is
co-occurrence between the labels, weighted by the frequency of
co-occurrence. By using the Louvain algorithm, a popular community
detection method, three clusters are reported, denoted by purple,
yellow and light blue colour.
The atrial fibrillation (FIBR_PREDS)
complication (non-lethal) exhibits strong relations with
progress of congestive heart failure and asystole,
both tagged within the dataset as lethal complications. Notable
relations are also reported between atrial
fibrillation-relapse of the myocardial infarction, and
atrial fibrillation-pulmonary edema (OTEK_LANC). It
is also noteworthy that, as regards lethal outcomes, cardiogenic
shock, asystole and ventricular fibrillation have
been clustered together, as have pulmonary edema,
progress of congestive heart failure and
thromboembolism. The lethal complication of myocardial
rupture, on the other hand, has been clustered with- and
exhibits relations with-the myocardial rupture (RAZRIV)
complication label, potentially indicating that patients with
myocardial rupture were assigned to both labels up to the lethal
outcome.
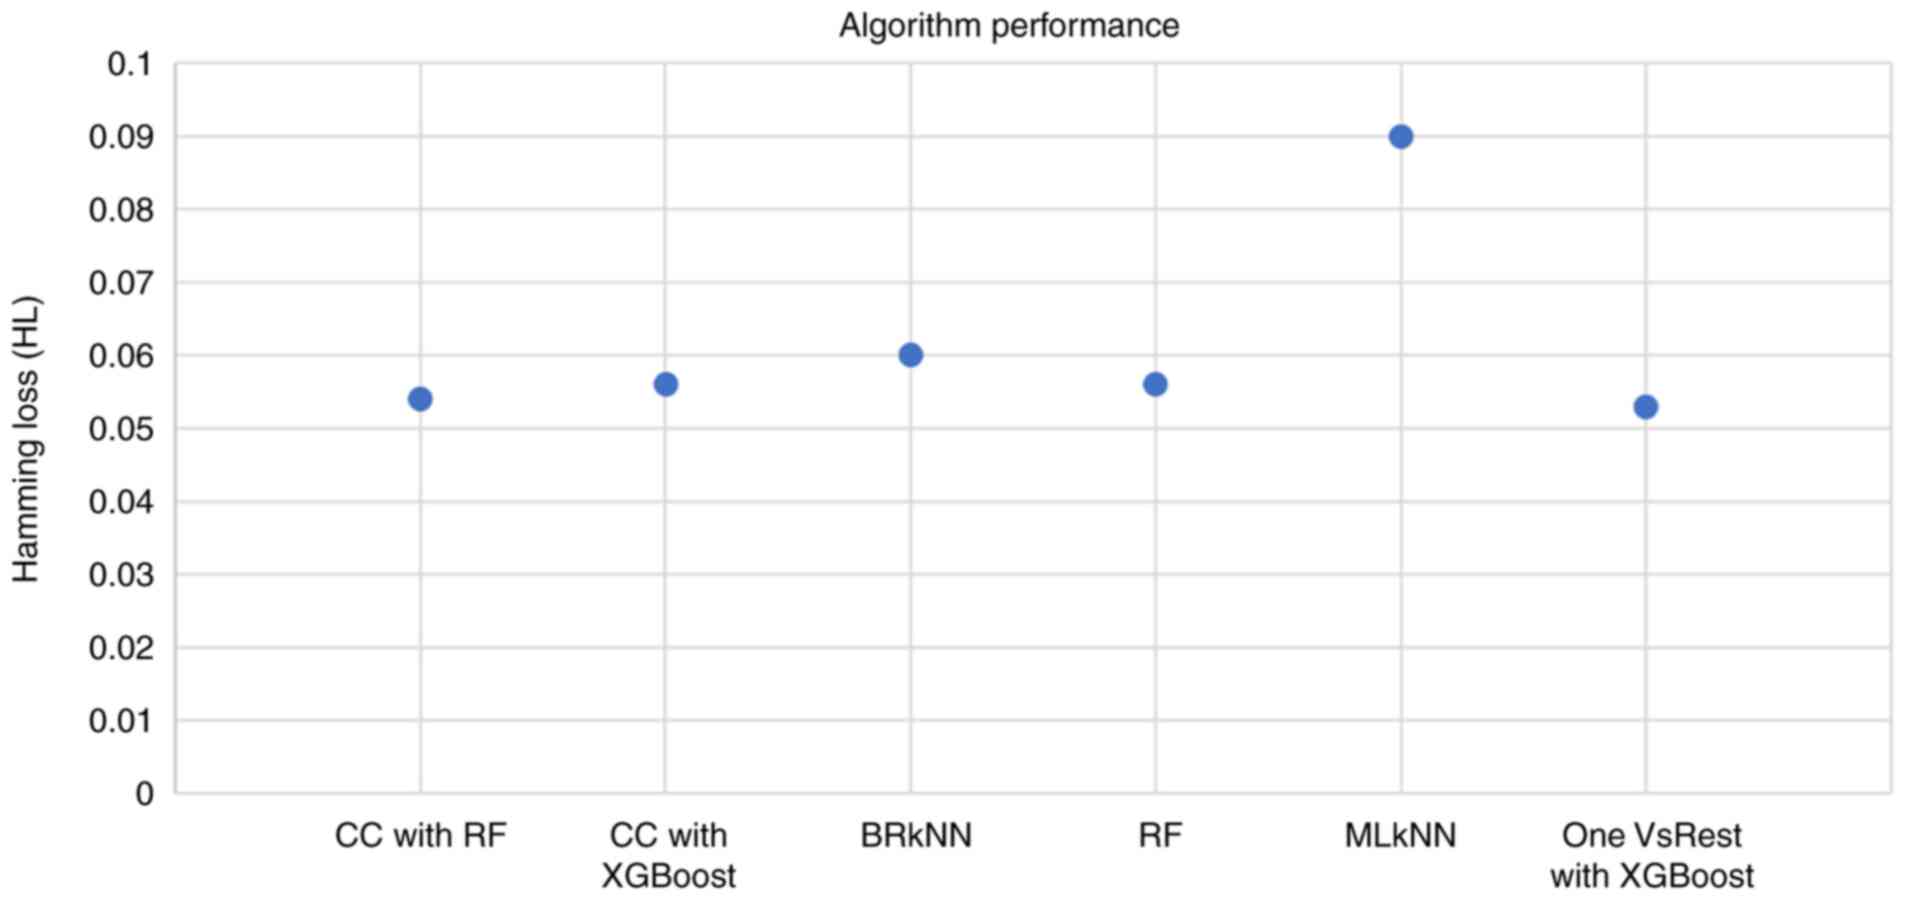
The candidate algorithms were evaluated according to
their performance on the dataset and the results are summarized in
Fig. 4. The highest HL was exhibited
by the Multi-label k-Nearest Neighbor (MLkNN) classifier, whereas
the lowest HL (0.053) was exhibited by the OnevsRest classifier
with XGBoost. This intuitive classifier strategy, also known as the
one-vs.-all, trains a binary classifier independently for each
label, and can be applied to both multi-class and multi-label
problems.
Discussion
Predictive classification algorithms have been
implemented in the context of various diseases over the past years.
During the peak of the recent SARS-CoV-2 pandemic, classification
models were designed to tackle various aspects of the disease, such
as the detection of viral infection through X-ray imaging and CT
scans or the outcome prediction of COVID-19 patients using their
recorded characteristics as input (16-18).
This is even more critical under the scope of personalized
medicine, as the individual patient profile, which includes
features, such as comorbidities, age, ethnic background etc., may
affect disease progression and clinical manifestations (19). In a number of cases, several
conditions, or labels, may be assigned to a single patient; for
example, an individual may be suffering from COVID-19, while also
exhibiting cardiovascular issues and high cholesterol levels. In
such a case, the challenge of building predictive models can be
regarded as a multi-label classification problem, as explored
herein.
The development and testing of classifiers is a
complex task, particularly in the case of multi-label
classification. The comparative evaluation of various algorithms on
the myocardial infarction dataset elected the OneVsRest heuristic
as the best-performing one. Furthermore, the use of XGBoost as the
base classifier enabled the fine-tuning of the model and
accelerated the learning process. XGBoost was identified as the
best performing algorithm in a study published in 2022 for a
similar predictive task. That study aimed to develop and validate a
machine learning-based model to predict regional lymph node
metastasis in osteosarcoma using data from 1,201 patients,
identifying T and M stage, surgery and chemotherapy as significant
risk factors and XGBoost as the best performing predictive
algorithm for that task (64).
The use of disease datasets is also employed by
other frameworks; for example, Tang et al (65) described a Gaussian randomizer-based
system for early fundus screening with privacy preserving and
domain adaptation, employing a multi-disease dataset.
It would be of interest, as an extension of the
proposed framework, to evaluate a set of different base classifiers
in the context of the OneVsRest strategy and observe the effect
that their substitution may have on the classification performance.
The present study focused on a subset of the available algorithms
and strategies; therefore, there exist other potential
machine-learning components and techniques to be evaluated on this
task. In terms of the dataset itself, graph exploration highlighted
shared label instances that potentially contain information
relevant to myocardial infarction pathophysiology. The label
imbalance that marks the dataset constitutes an interesting point
in terms of handling a multi-label classification problem. Methods
to address imbalanced datasets in multi-label classification have
been reviewed elsewhere and include, but are not limited to, random
oversampling and undersampling, heuristic oversampling,
cost-sensitive learning, and ensemble approaches (26,31).
Oversampling is the process of increasing the rate of minority
class instances within an imbalanced dataset to compensate for the
occurrence of common classes (66).
Modern and widely-used techniques, such as the Synthetic Minority
Over-sampling Technique (SMOTE) create synthetic data points by
using the feature space of the minority class and k-nearest
neighbors; however, applying the k-nearest neighbor approach on
binary input data such as the dataset at hand would serve no
purpose (67). Furthermore, the
existence of binary input data excludes the use of SMOTENC, the
SMOTE extension for numerical and categorical features (67). Therefore, if an added oversampling
step were to be applied, a custom oversampling function would need
to be created to increase tail label samples based on the
calculated oversampling ratio of the labels. Lastly, the concept of
errors constitutes an important facet of developing accurate and
reliable biomedical classification models. A classifier is subject
to two main types of errors, false positives, also known as type I
errors, and false negatives, also known as type II errors (59). In the case of false positives, the
classifier predicts a label which is not present in the test set,
while in the case of false negatives, a label that should have been
predicted is missing. Similarly, true positives are results where
the classifier has correctly predicted a label presence and in true
negatives, the classifier has correctly predicted the absence of
label, i.e., the absence of the positive instance. In the case of
disease complication predictions, we are greatly invested in
limiting the rate of false negatives, where the classifier fails to
predict a label (a complication) which in truth exists. One could
argue that in the hospital setting, it would be less damaging to
monitor a patient in anticipation of a complication that turns out
to be a false positive, than failing to catch a complication that
may be lethal. Therefore, the selection of performance metrics and
the penalties enforced on the errors of the model are greatly
affected by the nature of the disease which we wish to interpret as
a classification task.
In conclusion, MI constitutes a highly frequent
phenomenon in the subset of the population suffering from
cardiovascular problems. The development of accurate and scalable
systems to support the decision-making process of the medical
professionals in the hospital can alleviate the weight of patient
management and may potentially increase the odds of survival for
myocardial infarction patients. The use of predictive systems for
disease-related challenges has been garnering attention the past
years with the increase in computational power and novelty of
algorithms.
The data-driven approach presented herein and the
obtained results underline the potential of machine learning
applications in risk predictions, in particular for the challenge
associated with MI. As demonstrated through the evaluation,
high-performance algorithms, such as the Extreme Gradient Boosting
algorithm can be employed as base classifiers in the context of
machine-learning model development, while disciplines such as graph
theory can shed light into the elaborate networks underlying
myocardial infarction progression. Public dataset repositories can
provide the large-scale quantities of biomedical and patient data
that are required to build efficient and reliable predictive
classification models. This data-driven approach can be further
scaled and enhanced; there exists promise in the use of ensemble
models, made up of different classifiers with different aptitude
towards predicting specific labels. Overall, the classifier-based
pipeline holds the potential to support the decision-making process
of healthcare professionals and aid a proactive approach to patient
care.
Supplementary Material
Descriptive analytics of the dataset
and information regarding the convention of column names.
Details of the final dataset.
Acknowledgements
Not applicable.
Funding
Funding: The authors would like to acknowledge funding from the
following: i) AdjustEBOVGP-Dx (RIA2018EF-2081): Biochemical
Adjustments of native EBOV Glycoprotein in Patient Sample to Unmask
target Epitopes for Rapid Diagnostic Testing. A European and
Developing Countries Clinical Trials Partnership (EDCTP2) under the
Horizon 2020 ‘Research and Innovation Actions’ DESCA; and ii)
‘MilkSafe: A novel pipeline to enrich formula milk using omics
technologies’, a research co-financed by the European Regional
Development Fund of the European Union and Greek national funds
through the Operational Program Competitiveness, Entrepreneurship
and Innovation, under the call RESEARCH-CREATE-INNOVATE (project
code: T2EDK-02222).
Availability of data and materials
The code samples and raw data analyzed during the
present study can be found at: https://github.com/IoDiakou/MLC-on-biomedical-data.git
and http://darkdna.gr.
Authors' contributions
All authors (ID, EI, EP, KD, CY, CI, DAS, GPC, EE
and DV) contributed to the conceptualization, design, writing,
drafting, revising, editing and reviewing of the manuscript. All
authors confirm the authenticity of all the raw data. All authors
have read and approved the final manuscript.
Ethics approval and consent to
participate
Not applicable.
Patient consent for publication
Not applicable.
Competing interests
The authors declare that they have no competing
interests.
References
|
1
|
Anderson JR: Machine learning: an
artificial intelligence approach. Elsevier Science, 1983.
|
|
2
|
Russell S and Norvig P: Artificial
intelligence: A modern approach. 3rd edition. Prentice-Hall, Upper
Saddle River, 2010.
|
|
3
|
Somani P and Kaur G: A review on
supervised learning algorithms. Int J Adv Sci Technol.
29:2551–2559. 2020.PubMed/NCBI View Article : Google Scholar
|
|
4
|
Singh P: Supervised machine learning. In:
Learn PySpark: Build Python-based Machine Learning and Deep
Learning Models. Singh P (ed). Apress, Berkeley, CA, pp117-159,
2019.
|
|
5
|
Gentleman R and Carey VJ: Unsupervised
machine learning. In: Bioconductor Case Studies. Hahne F, Huber W,
Gentleman R and Falcon S (eds). Springer New York, New York, NY,
pp137-157, 2008.
|
|
6
|
Hady MFA and Schwenker F: Semi-supervised
Learning. In: Handbook on Neural Information Processing. Bianchini
M, Maggini M and Jain LC (eds). Intelligent Systems Reference
Library. Vol. 49. Springer, Berlin, Heidelberg, pp215-239,
2013.
|
|
7
|
Sutton RS and Barto AG: Reinforcement
learning: An introduction. MIT Press, 2018.
|
|
8
|
Lee D, Seo H and Jung MW: Neural basis of
reinforcement learning and decision making. Annu Rev Neurosci.
35:287–308. 2012.PubMed/NCBI View Article : Google Scholar
|
|
9
|
Czarnul P, Proficz J and Krzywaniak A:
Energy-aware high-performance computing: Survey of state-of-the-art
tools, techniques, and environments. Sci Program.
2019(8348791)2019.
|
|
10
|
Mascetti L, Arsuaga Rios M, Bocchi E,
Vicente JC, Cheong BCK, Castro D, Collet J, Contescu C, Labrador
HG, Iven J, et al: CERN disk storage services: Report from last
data taking, evolution and future outlook towards Exabyte-scale
storage. EPJ Web Conf. 245(04038)2020.
|
|
11
|
Amin R, Vadlamudi S and Rahaman MM:
Opportunities and challenges of data migration in cloud. Eng Int.
9:41–50. 2021.
|
|
12
|
Dash S, Shakyawar SK, Sharma M and Kaushik
S: Big data in healthcare: Management, analysis and future
prospects. J Big Data. 6(54)2019.
|
|
13
|
Wachter RM: Chapter 11. Other
complications of healthcare. In: Understanding Patient Safety, 2e.
The McGraw-Hill Companies, New York, NY, 2012.
|
|
14
|
Ghosheh GO, Alamad B, Yang KW, Syed F,
Hayat N, Iqbal I, Al Kindi F, Al Junaibi S, Al Safi M, Ali R, et
al: Clinical prediction system of complications among patients with
COVID-19: A development and validation retrospective multicentre
study during first wave of the pandemic. Intell Based Med.
6(100065)2022.PubMed/NCBI View Article : Google Scholar
|
|
15
|
van Smeden M, Reitsma JB, Riley RD,
Collins GS and Moons KG: Clinical prediction models: Diagnosis
versus prognosis. J Clin Epidemiol. 132:142–145. 2021.PubMed/NCBI View Article : Google Scholar
|
|
16
|
de Souza FSH, Hojo-Souza NS, dos Santos
EB, da Silva CM and Guidoni DL: Predicting the disease outcome in
COVID-19 positive patients through machine learning: A
retrospective cohort study with Brazilian data. medRxiv:
2020.2006.2026.20140764, 2020.
|
|
17
|
Ezzoddin M, Nasiri H and Dorrigiv M:
Diagnosis of COVID-19 cases from chest X-ray images using deep
neural network and LightGBM. IEEE, 2022.
|
|
18
|
Pathak Y, Shukla PK, Tiwari A, Stalin S
and Singh S: Deep transfer learning-based classification model for
COVID-19 disease. IRBM. 43:87–92. 2022.PubMed/NCBI View Article : Google Scholar
|
|
19
|
Yuan B: Towards a clinical efficacy
evaluation system adapted for personalized medicine. Pharmgenomics
Pers Med. 14:487–496. 2021.PubMed/NCBI View Article : Google Scholar
|
|
20
|
Kotsiantis SB, Zaharakis ID and Pintelas
PE: Machine learning: A review of classification and combining
techniques. Artif Intell Rev. 26:159–190. 2006.
|
|
21
|
Wei Y, Xia W, Huang J, Ni B, dong J, Zhao
Y and Yan S: CNN: Single-label to multi-label. ArXiv:
abs/1406.5726, 2014.
|
|
22
|
Soofi AA and Awan A: Classification
techniques in machine learning: Applications and issues. J Basic
Appl Sci. 13:459–465. 2017.
|
|
23
|
Tsoumakas G and Katakis I: Multi-label
classification: An overview. Int J Data Warehous Min. 3:1–13.
2009.
|
|
24
|
Herrera F, Charte F, Rivera AJ and del
Jesus MJ: Multilabel classification. In: Multilabel Classification:
Problem Analysis, Metrics and Techniques. Herrera F, Charte F,
Rivera AJ and del Jesus MJ (eds). Springer International
Publishing, Cham, pp17-31, 2016.
|
|
25
|
Sun Y, Wong AKC and Kamel MS:
Classification of imbalanced data: A review. Int J Pattern Recognit
Artif Intell. 23:687–719. 2009.
|
|
26
|
Tarekegn AN, Giacobini M and Michalak K: A
review of methods for imbalanced multi-label classification.
Pattern Recognit. 118(107965)2021.
|
|
27
|
Charte F, Rivera AJ, del Jesus MJ and
Herrera F: Dealing with difficult minority labels in imbalanced
mutilabel data sets. Neurocomputing. 326-327:39–53. 2019.
|
|
28
|
Charte F, Rivera A, del Jesus MJ and
Herrera F: A first approach to deal with imbalance in multi-label
datasets. In: Pan JS, Polycarpou MM, Woźniak M, de Carvalho ACPLF,
Quintián H and Corchado E (eds). Hybrid Artificial Intelligent
Systems. HAIS 2013. Lecture Notes in Computer Science. Vol. 8073.
Springer, Berlin, Heidelberg, pp150-160, 2013.
|
|
29
|
Huang Y, Giledereli B, Köksal A, Ozgur A
and Ozkirimli E: Balancing methods for multi-label text
classification with long-tailed class distribution. arXiv:
2109.04712, 2021.
|
|
30
|
Giraldo Forero AF, Jaramillo-Garzón J,
Ruiz-Muñoz J and Castellanos-Dominguez G: Managing Imbalanced Data
Sets in Multi-label Problems: A Case Study with the SMOTE
Algorithm. In: Ruiz-Shulcloper J, Sanniti di Baja G (eds). Progress
in Pattern Recognition, Image Analysis, Computer Vision, and
Applications. CIARP 2013. Lecture Notes in Computer Science. Vol.
8258. Springer, Berlin, Heidelberg, pp334-342, 2013.
|
|
31
|
Tahir MA, Kittler J and Bouridane A:
Multilabel classification using heterogeneous ensemble of
multi-label classifiers. Pattern Recognit Lett. 33:513–523.
2012.
|
|
32
|
Cao P, Liu X, Zhao D and Zaiane O: Cost
sensitive ranking support vector machine for multi-label data
learning. In: Abraham A, Haqiq A, Alimi A, Mezzour G, Rokbani N and
Muda A (eds). Proceedings of the 16th International Conference on
Hybrid Intelligent Systems (HIS 2016). HIS 2016. Advances in
Intelligent Systems and Computing. Vol. 552. Springer, Cham,
pp244-255, 2017.
|
|
33
|
Saleh M and Ambrose JA: Understanding
myocardial infarction. F1000Res. 7(1378)2018.PubMed/NCBI View Article : Google Scholar
|
|
34
|
World Health Organization: Cardiovascular
diseases, 2022.
|
|
35
|
Badimon L and Vilahur G: Thrombosis
formation on atherosclerotic lesions and plaque rupture. J Intern
Med. 276:618–632. 2014.PubMed/NCBI View Article : Google Scholar
|
|
36
|
Asada Y, Yamashita A, Sato Y and
Hatakeyama K: Thrombus formation and propagation in the onset of
cardiovascular events. J Atheroscler Thromb. 25:653–664.
2018.PubMed/NCBI View Article : Google Scholar
|
|
37
|
Shavadia JS, Chen AY, Fanaroff AC, de
Lemos JA, Kontos MC and Wang TY: Intensive care utilization in
stable patients with ST-segment elevation myocardial infarction
treated with rapid reperfusion. JACC Cardiovasc Interv. 12:709–717.
2019.PubMed/NCBI View Article : Google Scholar
|
|
38
|
Abrignani MG, Dominguez LJ, Biondo G, Di
Girolamo A, Novo G, Barbagallo M, Braschi A, Braschi G and Novo S:
In-hospital complications of acute myocardial infarction in
hypertensive subjects. Am J Hypertens. 18:165–170. 2005.PubMed/NCBI View Article : Google Scholar
|
|
39
|
Malla RR and Sayami A: In hospital
complications and mortality of patients of inferior wall myocardial
infarction with right ventricular infarction. JNMA J Nepal Med
Assoc. 46:99–102. 2007.PubMed/NCBI
|
|
40
|
Babaev A, Frederick PD, Pasta DJ, Every N,
Sichrovsky T and Hochman JS: NRMI Investigators. Trends in
management and outcomes of patients with acute myocardial
infarction complicated by cardiogenic shock. JAMA. 294:448–454.
2005.PubMed/NCBI View Article : Google Scholar
|
|
41
|
Golovenkin SE, Gorban A, Mirkes E, Shulman
VA, Rossiev DA, Shesternya PA, Nikulina SY, Orlova YV and Dorrer
MG: Myocardial infarction complications Database. Journal,
2020.
|
|
42
|
Yang J and Leskovec J: Defining and
evaluating network communities based on ground-truth. Knowl Inf
Syst. 42:181–213. 2015.
|
|
43
|
Huang SJ and Zhou ZH: Multi-label learning
by exploiting label correlations locally. Proc AAAI Conf Artif
Intell. 26:949–955. 2021.
|
|
44
|
Chakravarty A, Sarkar T, Ghosh N,
Sethuraman R and Sheet D: Learning decision ensemble using a graph
neural network for comorbidity aware chest radiograph screening.
Annu Int Conf IEEE Eng Med Biol Soc. 2020:1234–1237.
2020.PubMed/NCBI View Article : Google Scholar
|
|
45
|
Szymański P, Kajdanowicz T and Kersting K:
How is a data-driven approach better than random choice in label
space division for multi-label classification? Entropy.
18(282)2016.
|
|
46
|
Blondel VD, Guillaume JL, Lambiotte R and
Lefebvre E: Fast unfolding of communities in large networks. J Stat
Mech. 2008(P10008)2008.
|
|
47
|
Hagberg A, Swart PJ and Chult DA:
Exploring network structure, dynamics, and function using NetworkX,
2008.
|
|
48
|
Goutte C and Gaussier E: A probabilistic
interpretation of precision, recall and F-score, with implication
for evaluation. In: Losada DE, Fernández-Luna JM (eds). Advances in
Information Retrieval. ECIR 2005. Lecture Notes in Computer
Science. Vol. 3408. Springer, Berlin, Heidelberg, pp345-359,
2005.
|
|
49
|
Qin T: Machine learning basics. In: Dual
Learning. Qin T (ed). Springer Singapore, Singapore, pp11-23,
2020.
|
|
50
|
Sorower MS: A literature survey on
algorithms for multi-label learning. Oregon State University,
Corvallis, 2010.
|
|
51
|
Wu J, Chen XY, Zhang H, Xiong LD, Lei H
and Deng SH: Hyperparameter optimization for machine learning
models based on bayesian optimizationb. J Electron Sci Technol.
17:26–40. 2019.
|
|
52
|
Liashchynskyi P and Liashchynskyi P: Grid
search, random search, genetic algorithm: A big comparison for NAS.
arXiv: 1912.06059, 2019.
|
|
53
|
Feurer M and Hutter F: Hyperparameter
optimization. In: Automated Machine Learning: Methods, Systems,
Challenges. Hutter F, Kotthoff L and Vanschoren J (eds). Springer
International Publishing, Cham, pp3-33, 2019.
|
|
54
|
Pedregosa F, Varoquaux G, Gramfort A,
Michel V and Thirion B: Scikit-learn: Machine learning in python. J
Mach Learn Res. 12:2825–2830. 2011.
|
|
55
|
Chen T and Guestrin C: XGBoost: A scalable
tree boosting system. KDD ‘16: Proceedings of the 22nd ACM SIGKDD
International Conference on Knowledge Discovery and Data Mining,
pp785-794, 2016.
|
|
56
|
Mason L, Baxter J, Bartlett P and Frean M:
Boosting algorithms as gradient descent. Adv Neural Inf Process
Syst. 12:1999.
|
|
57
|
Boehmke B and Greenwell B: Hands-on
Machine Learning with R. Chapman and Hall/CRC, New York, NY,
pp221-246, 2019.
|
|
58
|
Medar R, Rajpurohit VS and Rashmi B:
Impact of training and testing data splits on accuracy of time
series forecasting in machine learning. In: 2017 International
Conference on Computing, Communication, Control and Automation
(ICCUBEA). IEEE, pp1-6. 2017.
|
|
59
|
Sarker IH: Machine learning: Algorithms,
real-world applications and research directions. SN Comput Sci.
2(160)2021.PubMed/NCBI View Article : Google Scholar
|
|
60
|
Nti I, Nyarko-Boateng O and Aning J:
Performance of machine learning algorithms with different K values
in K-fold cross-validation. Int J Inf Technol and Comp Sci.
6:61–71. 2021.
|
|
61
|
Refaeilzadeh P, Tang L and Liu H:
Cross-validation. In: Encyclopedia of Database Systems. Liu L and
ÖZsu MT (eds). Springer US, Boston, MA, pp532-538, 2009.
|
|
62
|
Sechidis K, Tsoumakas G and Vlahavas I: On
the Stratification of Multi-label. Data. In: Gunopulos D, Hofmann
T, Malerba D and Vazirgiannis M (eds). Machine Learning and
Knowledge Discovery in Databases. ECML PKDD 2011. Lecture Notes in
Computer Science. Vol. 6913. Springer, Berlin, Heidelberg,
pp145-458, 2011.
|
|
63
|
Szymański P and Kajdanowicz T: A network
perspective on stratification of multi-label data. Proc Mach Learn
Res. 74:22–35. 2017.
|
|
64
|
Li W, Liu Y, Liu W, Tang ZR, Dong S, Li W,
Zhang K, Xu C, Hu Z, Wang H, et al: Machine learning-based
prediction of lymph node metastasis among osteosarcoma patients.
Front Oncol. 12(797103)2022.PubMed/NCBI View Article : Google Scholar
|
|
65
|
Tang Z, Wong HS and Yu Z:
Privacy-preserving federated learning with domain adaptation for
multi-disease ocular disease recognition. IEEE J Biomed Health
Inform. 28:3219–3227. 2024.PubMed/NCBI View Article : Google Scholar
|
|
66
|
Chawla NV: Data mining for imbalanced
datasets: An overview. In: Maimon O, Rokach L (eds). Data Mining
and Knowledge Discovery Handbook. Springer, Boston, MA, pp853-867,
2005.
|
|
67
|
Chawla NV, Bowyer KW, Hall LO and
Kegelmeyer WP: SMOTE: Synthetic minority over-sampling technique. J
Artif Intell Res. 16:321–357. 2002.
|