Introduction
The pancreatic-duodenal homeobox protein 1 (PDX-1)
is 6 kb in length and located on chromosome 5 in mice, 12 in rats
and 13q12.1 in humans (1). During
mouse embryogenesis, PDX-1 is expressed in the pancreas, duodenum
and gastric pyloric glands. These organs are deformed in
PDX1-deficient mice (2). As a
transcription factor, the PDX-1 gene plays a critical role in
embryological pancreas development and insulin expression in adult
pancreatic islets (3,4). PDX-1 deficiency leads to duodenal and
pancreatic ageing (5). The name
PDX-1 is inaccurate, as the transcription factor is not exclusively
expressed in pancreatic and duodenal tissues and is highly
expressed by a large proportion of human tumors, including gastric
and pancreatic cancer.
Over the past decade, there has been a large body of
evidence supporting the aberrant expression of PDX-1 in malignant
tumors, including pancreatic (6),
prostate (7), stomach (8,9),
colon (10) and breast cancers
(11,12). In pancreatic cancer, PDX-1 induces
increased cell proliferation, invasion and colony formation in
vitro. PDX-1 expression has also been correlated with human
embryonic kidney (HEK) 293 and MIA PaCa2 pancreatic cancer cell
xenograft tumor formation in SCID mice. Thus, these data suggest
that PDX-1 has oncogenic properties (13). Another study reported that the
expression level of PDX-1 correlates with lymph node metastasis and
histological grade, where positive PDX-1 was associated with poor
prognosis for breast cancer patients (14,15),
while Ma et al demonstrated a tumor suppressor role of PDX-1
in gastric cancer (16).
However, at present, little is known about the
expression and function of PDX-1 in breast cancer. In this study,
the expression of PDX-1 in breast cancer specimens and adjacent
normal tissues was examined using immunohistochemistry, and
staining was scored against pathological characteristics. Antisense
oligonucleotide (ASO) was employed to downregulate PDX-1 expression
in MCF-7 breast cancer cells and to determine its impact on cell
proliferation and the cell cycle.
Materials and methods
Specimens
In this study, 81 formalin-fixed paraffin-embedded
human breast cancer specimens and 20 adjacent normal specimens were
collected from the Department of Pathology of Shanghai Tenth
People’s Hospital. All samples were confirmed as invasive ductal
breast cancer. The specimens were from patients who had not
received any chemotherapy or radiotherapy prior to surgery.
Immunohistochemistry
Paraffin-embedded breast cancer sections were heated
to 75°C for 60 min, deparaffinized by dimethyl benzene (Guoyao
Corp., Shanghai, China), treated with 3.0%
H2O2 in methanol for 10 min and rehydrated in
graded concentrations of ethanol/water. Antigen retrieval was
accomplished by heating in 10 mmol citrate buffer, pH 6.0, for 30
min in a steamer, followed by cooling for 30 min at room
temperature. Sections were blocked with 5% BSA for 30 min then
incubated with primary antibody against PDX-1, Ki-67 or P53 for 2 h
at 37°C. Indirect immunohistochemical detection was performed
through incubation with 200-fold diluted peroxidase-conjugated
secondary antibodies (Santa Cruz Biotechnology, Inc., Santa Cruz,
CA, USA) for 60 min at room temperature. The peroxidase reaction
was developed using diaminobenzidine (Sigma-Aldrich, Shanghai,
China), followed by counterstaining with Harris’ hematoxylin,
dehydration and mounting.
PDX-1 staining for each tissue core was
semi-quantitatively scored as 0–1 (−), 2 (+), 3–4 (++) and 5–6
(+++), according to the amount of stained cells and the intensity
of staining. High-power magnification fields (five) were randomly
selected: (a) Intensity of staining: no brown-yellow, 0; slightly
yellow, 1; brown-yellow, 2; brown, 3; (b) The percentage of stained
cells: no PDX-1-stained cells or PDX-1 stained cells account for
less than 5%, 0; ≤25%, 1; 26–50%, 2; (c) The final score was
determined by the sum of (a) and (b).
Cell culture
The MCF-7 breast cancer cell line used in this study
was obtained from the Chinese Academy of Sciences and cultured in
DMEM (Gibco, New York, NY, USA) supplemented with 10% fetal bovine
serum (Gibco), 100 U/ml penicillin and 100 μg/ml streptomycin
(Genom, Hangzhou, China). Cells were incubated at 37°C in a
humidified chamber supplemented with 5% CO2.
ASO transfection
For transfections, 2–4×10⁶ cells/well
were seeded into a 6-well plate and cultured in serum- and
antibiotic-free DMEM. As the confluency of MCF-7 breast cancer
cells reached 80–90%, cells were transfected with ASO. Briefly, ASO
plasmid and lipofect transfection reagent were independently
diluted in 250 μl DMEM medium at a ratio of 1:3 ASO:lipofect and
incubated for 5 min at room temperature. Next, the diluted ASO
plasmid and lipofect were gently combined and incubated for a
further 20 min. Following this, 500 μl of the ASO-lipofect complex
was added to each well. DMEM was replaced by DMEM with 10% FBS 4–5
h later. All cells were incubated in a 37°C/5% CO2
incubator for 48 h prior to further testing.
Cell proliferation assay
Cell proliferation was assessed using the CCK-8
assay kit (Sigma, Santa Clara, CA, USA). Cells were plated in
96-well plates at 10,000 cells/well (Corning, Inc., Corning, NY,
USA). Cells were transfected in triplicate with 0.1, 0.2, 0.4, 0.6
or 0.8 μmol/l PDX-1 ASO. Cell proliferation was evaluated at 24, 48
and 72 h, according to the manufacturer’s instructions.
Cell cycle assay
Cells were harvested and centrifuged at 1,200 rpm
for 5 min and washed twice in PBS. To fix cells, 3 ml ice-cold 70%
ethanol was added in a dropwise fashion and incubated with cells
for at least 30 min. A total of 250 μl 0.05 g/l propidium iodide
(PI) staining solution was added to each sample and incubated for
30 min at room temperature. PI staining was then analyzed by flow
cytometry (FACSCanto™ II, BD Biosciences, Piscataway, NJ, USA). The
proliferation index was calculated according to the following
equation: PI=(S+G2/M)/(G0/G1+S+G2/M).
Real-time PCR analyses
Total RNA was isolated using TRIzol (Invitrogen,
Carlsbad, CA, USA) and cDNA was generated by reverse transcription
according to the Prime Script TM RT-PCR kit instructions (Takara,
Shiga, Japan). Quantitative real-time PCR was performed on a 7900
HT fast RT-PCR Instrument (Applied Biosystems, Singapore) using
SYBR-Green as the detection fluorophore. Forward (F) and reverse
(R) primers used were as follows: PDX-1, F:
5′-TTAGTGATACTGGATTGGCGTTGT-3′, R: 3′-TGGCTTTAT GGCAGATTAAGGTAC-5′;
P53, F: 5′-CCACCATCCACT ACAACTACAT-3′, R: 3′-AGGACAGGCACAAACACG-5′;
Ki-67, F: 5′-GGGTTACCTGGTCTTAGTT-3′, R: 3′-ATG GTTGAGGCTGTTCC-5′;
Caspase 3: F: 5′-ATGGAAGCGAATCAATGGACTC-3′, R:3′-CTGTACCAGACCGAGA
TGTCA-5′; Caspase 8, F: 5′-CCTGTCACTGTCTTGTA CCCT-3′,
R:3′-CCCGCAGTATCTTGCCTCC-5′ and β-actin, F:
3′-CTGGAACGGTGAAGGTGACA-5′ R: 5′-AGGGTA CATGGTGGTGCCGCCAGAC-3′. PCR
parameters were as follows: 2 min at 95°C and then 40 cycles of 15
sec at 95°C, 30 sec at 60°C. Each sample was tested in triplicate.
Gene-specific mRNA expression was normalized against the expression
of the internal control, β-actin.
Western blotting
Protein samples were separated on 12%
SDS-polyacrylamide gel (SDS-PAGE) and transferred onto PVDF
membranes (Beyotime, Jiangsu, China). Immune complexes were formed
by incubation of the proteins with primary antibodies against PDX-1
(R&D systems, Minneapolis, MN, USA), P53, Ki-67, Caspase 3 or
Caspase 8 (Santa Cruz Biotechnology) overnight at 4°C. Blots were
washed and incubated for 1 h with DyLight-tagged antibodies
conjugated anti-mouse secondary antibodies (R&D Systems).
Immunoreactive protein bands were detected with an Odyssey Scanning
System (Li-Cor, Lincoln, NE, USA).
Statistical analysis
All data are representative of at least 3 separate
experiments performed in triplicate and are expressed as mean ±
standard deviation. Correlations with tumor characteristics were
calculated using Spearman’s analysis. As all the data were ranked,
the differences were analyzed using a non-parametric two
independent samples test (Mann-Whitney U) or K independent sample
test (Kruskal-Wallis Test). The null hypothesis was rejected at the
0.05 level. For RT-PCR analyses, all the samples were tested in
triplicate, based on the 2-ΔΔCt method described by Livac et
al (17), and
semi-quantitative analysis was used for gene quantification. Paired
t-tests were performed to examine the differences between
transfection groups and controls in MCF-7 breast cancer cells.
Results
PDX-1 is underexpressed in breast cancer
specimens
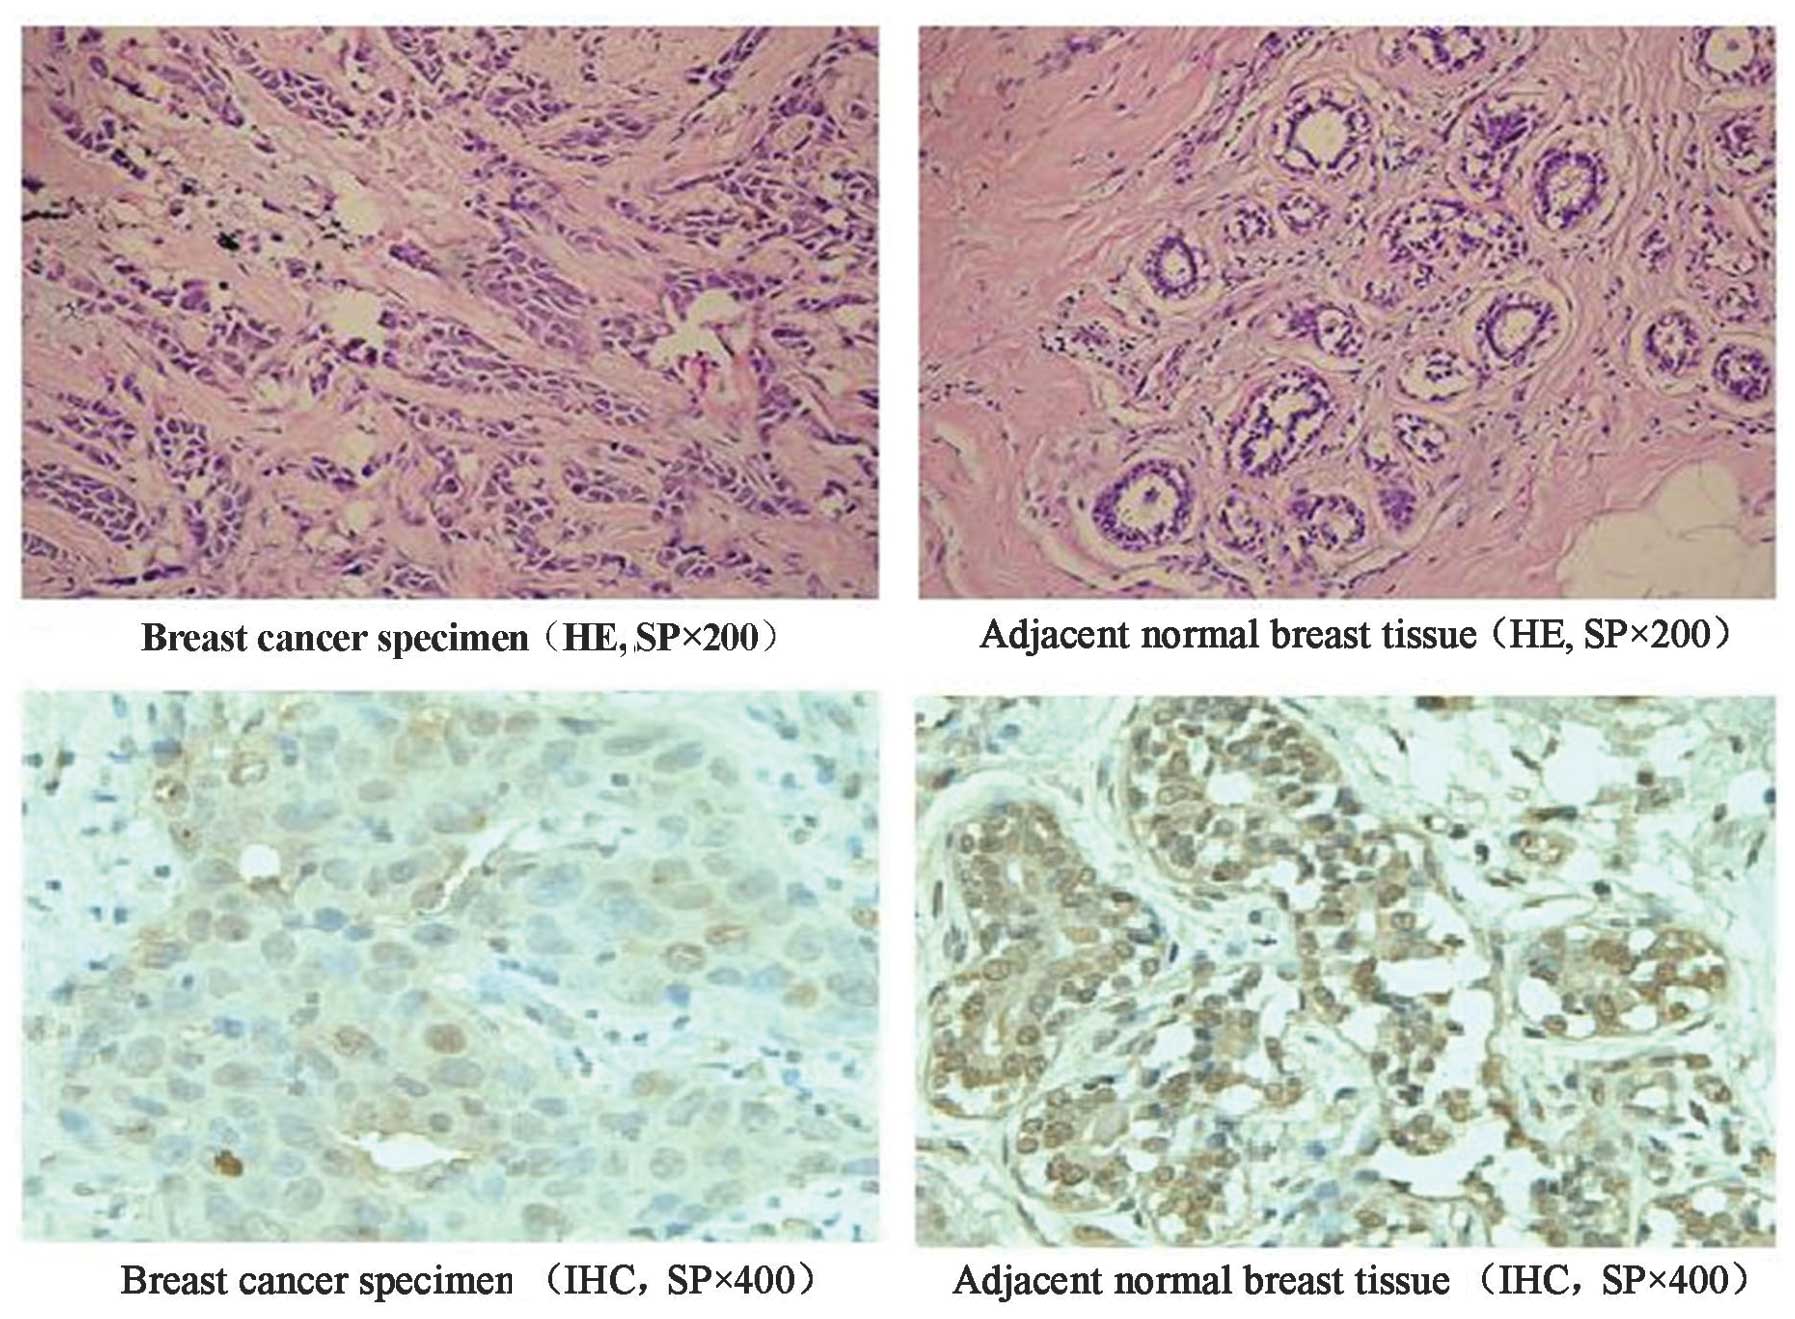
To investigate the correlation between PDX-1 and
breast cancer, the expression of PDX-1 in human breast cancer
specimens and adjacent normal tissues was examined by HE and
immunohistochemical staining. Quantitative analysis revealed that
the positive rate of PDX-1 in breast cancer tissues was 71.6%
(58/81), whereas that in non-cancerous tissues was 100% (20/20).
The expression level of PDX-1 protein in breast cancer specimens
was lower when compared with adjacent normal breast tissues
(P<0.05; Table I). Furthermore,
PDX-1 expression was mainly cytoplasmic in breast cancer specimens.
With cytoplasmic expression, PDX-1 was also present in the nucleus
of adjacent normal breast tissues. Notably, it was particularly
expressed on the nuclear membrane (Fig. 1). Statistical analysis revealed
that the abnormal expression of PDX-1 in breast cancer negatively
correlated with pathological grade (P<0.01), as well as the
protein expression of P53 (P<0.05) and Ki-67 (P<0.01;
Tables II and III).
 | Table IPDX-1 expression in breast cancer
specimens and adjacent normal breast tissues. |
Table I
PDX-1 expression in breast cancer
specimens and adjacent normal breast tissues.
| | PDX-1 positive |
|---|
| |
|
|---|
| Pathological
type | (n) | Negative (−) | Mildly positive
(+) | Moderately positive
(++) | Strongly positive
(+++) |
|---|
| Breast cancer
tissues | 81 | 23 | 19 | 26 | 13 |
| Adjacent normal
breast tissues | 20 | 0 | 2 | 7 | 11 |
| Table IIClinical characteristics and PDX-1
protein expression in breast cancer. |
Table II
Clinical characteristics and PDX-1
protein expression in breast cancer.
| Variable | No. (n) | PDX-1 | P-value |
|---|
|
|---|
| − | + | ++ | +++ |
|---|
| Age (years) |
| ≤50 | 16 | 2 | 5 | 5 | 4 | >0.05 |
| >50 | 65 | 19 | 14 | 23 | 9 | |
| Diameter of tumor
(cm) |
| ≤2 | 38 | 3 | 10 | 16 | 19 | <0.01 |
| >2 and ≤5 | 32 | 11 | 7 | 10 | 4 | |
| >5 | 11 | 7 | 2 | 1 | 1 | |
| Armpit lymph node
metastasis |
| − | 50 | 6 | 11 | 22 | 11 | <0.01 |
| + | 31 | 15 | 8 | 6 | 2 | |
| Histological
grade |
| I | 11 | 0 | 0 | 5 | 6 | <0.01 |
| II | 30 | 3 | 4 | 16 | 7 | |
| II–III | 17 | 7 | 5 | 5 | 0 | |
| III | 23 | 11 | 10 | 2 | 0 | |
| Table IIIP53, Ki-67 and PDX-1 protein
expression in breast cancer biopsies. |
Table III
P53, Ki-67 and PDX-1 protein
expression in breast cancer biopsies.
| Variable/grade | Total specimen number
(n) | PDX-1 | P-value | R |
|---|
|
|---|
| − | + | ++ | +++ |
|---|
| P53 |
| − | 48 | 9 | 10 | 17 | 12 | <0.05 | −0.321 |
| + | 17 | 5 | 4 | 7 | 1 | | |
| ++ | 10 | 4 | 4 | 2 | 0 | | |
| +++ | 6 | 3 | 1 | 2 | 0 | | |
| Ki-67 |
| − | 12 | 1 | 2 | 6 | 3 | <0.01 | −0.388 |
| + | 40 | 7 | 9 | 16 | 8 | | |
| ++ | 22 | 9 | 7 | 5 | 2 | | |
| +++ | 6 | 4 | 1 | 1 | 0 | | |
PDX-1 ASO significantly inhibits PDX-1
expression in MCF-7 breast cancer cells
To investigate the role of PDX-1 in breast cancer,
ASO-mediated knockdown was used. First, the transfection of PDX-1
ASO was optimized and validated. In comparison to lipofect
controls, significantly lower expression of PDX-1 was observed 24 h
after transfection of MCF-7 cells with PDX-1-specific ASO at
concentrations of 0.1, 0.2, 0.4, 0.6 and 0.8 μmol/l. Of these
doses, the strongest inhibitory effect on PDX-1 mRNA expression was
obtained with a PDX-1 ASO concentration of 0.4 μmol/l (data not
shown). The relative PDX-1 gene expression compared to the
lipofect-only control measured by real-time PCR was 0.495±0.023,
0.321±0.023, 0.045±0.006, 0.096±0.011, 0.147±0.006 for 0.1, 0.2,
0.4, 0.6, 0.8 μmol/l of PDX-1 ASO, respectively (P<0.05, n=3).
In accordance with RT-PCR results, similar suppression of PDX-1
protein by PDX-1 ASO was observed with a transfection concentration
of 0.4 μmol/l (data not shown).
PDX-1 inhibits growth of MCF-7 breast
cancer cells
To characterize the impact of PDX-1 on the MCF-7
breast cancer cell line, we used PDX-1 ASO to downregulate PDX-1
and evaluate the growth rate of MCF-7 breast cancer cells at 24, 48
and 72 h after transfection using the CCK-8 assay. The relative
proliferation of PDX-1 ASO-transfected cells was higher than those
of controls (P<0.05). PDX-1 ASO most effectively promoted the
growth of MCF-7 breast cancer cells at 48 h and at a concentration
of 0.4 μmol/l (Fig. 2). These data
suggest that PDX-1 negatively regulates MCF-7 breast cancer cell
proliferation.
PDX-1 modulates the cell cycle in MCF-7
breast cancer cells
To test whether PDX-1 modulates the cell cycle of
breast cancer cells, PDX-1 ASO (0.4 μmol/l) was used to transfect
MCF-7 breast cancer cells and 48 h later cell cycle analysis was
performed using flow cytometry. In comparison to lipofect-only
treated groups and negative controls, the percentage of G0/G1 phase
cells (48.25±0.87%; P<0.05) markedly decreased in PDX-1 ASO
transfected cells, while the proportion of S phase cells
(39.63±0.90%; P<0.05) increased. The percentage of G2/M phase
cells was not significantly altered between the treatment and
control groups. Furthermore, the cellular proliferation index rose
to 55.59±0.77% (P<0.05). This suggests that PDX-1 initiates
G0/G1 phase arrest. The downregulation of PDX-1 expression with ASO
led to an increased number of Sphase cells and higher proliferation
index (Fig. 3A and B).
PDX-1 significantly downregulates P53 and
Ki-67 expression in MCF-7 breast cancer cells
Real-time PCR was employed to test the expression
levels of several genes involved in the cell cycle and apoptosis
pathways. Remarkably, the expression of P53 and Ki-67 increased
markedly following downregulation of PDX-1 when compared with
controls, (the relative expression was 9.36±2.116 for P53 and
7.985±0.939 for Ki-67; P<0.05 n=3). No significant alteration of
Caspase 3 or Caspase 8 expression was observed (relative expression
was 1.213±0.489 for Caspase 3 and 1.113±0.247 for Caspase 8,
P>0.05, n=3; Fig. 4A).
Consistent with RT-PCR findings, protein translation of P53 and
Ki-67 was elevated following ASO-mediated knockdown of PDX-1, while
the expression of Caspase 3 and 8 was not significantly altered.
Together, these data demonstrate that silencing of PDX-1 with ASO
induces the upregulation of P53 and Ki-67 (Fig. 4B).
Discussion
Breast cancer is the leading cause of cancer-related
mortality in women worldwide (18). To date, tumorigenesis and
progression of breast cancer remains unclear. However, genetic
abnormalities have been shown to play a pivotal role.
Notably, we identified that the expression of PDX-1
in breast cancer tissues was not as strong as that in adjacent
normal tissues. Moreover, PDX-1 was expressed in the nucleus of
adjacent normal breast tissues, particularly on the nuclear
membrane, suggesting that PDX-1 may function at the nuclear
membrane. As to the fate of PDX-1 in breast cancer, Spearman’s
analysis indicated that PDX-1 negatively correlates with
pathological stage and histological grade, as well as expression of
P53 and Ki-67. Thus, underexpression of PDX-1 may represent a lower
pathological stage, histological grade and improved prognosis.
Therefore, these data suggest that PDX-1 may be valuable as a new
prognostic biomarker for breast cancer.
In further studies, ASO-mediated downregulation of
PDX-1 expression facilitated the proliferation of MCF-7 breast
cancer cells. In cell cycle assays, it was observed that lowering
the level of PDX-1 markedly increased the number of S phase cells,
suggesting that PDX-1 is a negative regulator of cell
proliferation. Given the relatively low expression of PDX-1 in
breast cancer tissues and its inhibitory impact on the growth of
MCF-7 breast cancer cells, it is reasonable to assert that PDX-1
serves as a tumor suppressor gene in the tumorigenesis and
maintenance of breast cancer. Similar to this study, Ma et
al revealed that PDX-1 functions as a tumor suppressor in
gastric cancer (16).
In summary, the current study shows that PDX-1 is
ubiquitously expressed in non-cancerous breast tissues and that its
expression profile is different to that of breast cancer tissues,
where loss of its expression might act as an early biomarker for
breast cancer. We propose that PDX-1 functions as a tumor
suppressor in breast cancer as evidenced by its ability to inhibit
cancer cell proliferation and disrupt the cell cycle. In the
future, PDX-1 may serve as a potential diagnostic and therapeutic
target for breast cancer treatment.
References
|
1
|
Schwitzgebel VM, Mamin A, Brun T, et al:
Agenesis of human pancreas due to decreased half-life of insulin
promoter factor 1. J Clin Endocrinol Metab. 88:4398–4406. 2003.
View Article : Google Scholar : PubMed/NCBI
|
|
2
|
Fukuda A, Kawaguchi Y, Furuyama K, et al:
Loss of the major duodenal papilla results in brown pigment biliary
stone formation in pdx1 null mice. Gastroenterology. 130:855–867.
2006. View Article : Google Scholar : PubMed/NCBI
|
|
3
|
Gannon M, Tweedie Ables E, Crawford L, et
al: Pdx-1 function is specifically required in embryonic β cells to
generate appropriate numbers of endocrine cell types and maintain
glucose homeostasis. Dev Biol. 314:406–417. 2008.
|
|
4
|
Ashizawa S, Brunicardi FC and Wang XP:
PDX-1 and the pancreas. Pancreas. 28:109–120. 2004. View Article : Google Scholar
|
|
5
|
Offield MF, Jetton TL, Labosky PA, et al:
PDX-1 is required for pancreatic outgrowth and differentiation of
the rostral duodenum. Development. 122:983–995. 1996.PubMed/NCBI
|
|
6
|
Liu T, Gou SM, Wang CY, et al: Pancreas
duodenal homeobox-1 expression and significance in pancreatic
cancer. World J Gastroenterol. 13:2615–2618. 2007. View Article : Google Scholar : PubMed/NCBI
|
|
7
|
Jonmarker S, Glaessgen A, Culp WD, et al:
Expression of PDX-1 in prostate cancer, prostatic intraepithelial
neoplasia and benign prostatic tissue. APMIS. 116:491–498. 2008.
View Article : Google Scholar : PubMed/NCBI
|
|
8
|
Leys CM, Nomura S, Rudzinski E, et al:
Expression of PDX-1 in human gastric metaplasia and gastric
adenocacinoma. Hum Pathol. 37:1162–1168. 2006. View Article : Google Scholar : PubMed/NCBI
|
|
9
|
Sakai H, Eishi Y, Li XL, et al: PDX1
homeobox protein expression in pseudopyloric glands and gastric
carcinomas. Gut. 53:323–330. 2004. View Article : Google Scholar : PubMed/NCBI
|
|
10
|
Ballian N, Liu SH and Brunicardi FC:
Transcription factor PDX-1 in human colorectal adenocarcinoma: A
potential tumor maker. World J Gastroenterol. 14:5823–5826. 2008.
View Article : Google Scholar : PubMed/NCBI
|
|
11
|
Wang XP, Li ZJ, Magnusson J, et al: Tissue
microarray of pancreatic duodenal homeo-box-1 in human cancers.
World J Surg. 29:334–338. 2005. View Article : Google Scholar
|
|
12
|
Tirone TA, Wang XP, Templeton NS, et al:
Cell-specific cytotoxicity of human pancreatic adenocarcinoma cells
using rat insulin promoter thymidine kinase directed gene therapy.
WJ Surg. 28:826–833. 2004. View Article : Google Scholar
|
|
13
|
Liu SH, Patel S, Gingras MC, et al: PDX-1:
demonstration of oncogenic properties in pancreatic cancer. Cancer.
117:723–733. 2011. View Article : Google Scholar : PubMed/NCBI
|
|
14
|
Koizumi M, Doi R, Toyoda E, et al:
Increased PDX-1 expression is associated with outcome in patients
with pancreatic cancer. Surgery. 134:260–266. 2003. View Article : Google Scholar : PubMed/NCBI
|
|
15
|
Quint K, Stintzing S, Alinger B, et al:
The expression pattern of PDX-1, SHH, Patched and Gli-1 is
associated with pathological and clinical features in human
pancreatic cancer. Pancreatology. 9:116–126. 2009. View Article : Google Scholar : PubMed/NCBI
|
|
16
|
Ma J, Chen M, Wang J, et al: Pancreatic
duodenal homeobox-1 (PDX1) functions as a tumor suppressor in
gastric cancer. Carcinogenesis. 29:1327–1333. 2008. View Article : Google Scholar : PubMed/NCBI
|
|
17
|
Livak KJ and Schmittgen TD: Analysis of
relative gene expression data using real-time quantitative PCR and
the 2-ΔΔCt method. Methods. 25:402–408. 2001.
|
|
18
|
World Health Organization. Cancer fact
sheet No. 297. Geneva: 2006
|