Introduction
Reactive oxygen species (ROS) are a group of oxygen
derivative molecules which include hydrogen peroxide
(H2O2), the superoxide anion radical
(O2•−) and hydroxyl radical (•OH).
Compared with other ROS, H2O2 freely diffuses
through biological membranes to a distance of multiple cell
diameters prior to reacting with specific molecular targets. This
is due to its solubility in lipid and aqueous environments and its
relatively low reactivity. Conventional hypotheses regard ROS to be
deleterious or harmful to cells. However, it has become clear that
ROS is crucial for the regulation of a number of cellular events,
including gene expression, differentiation and cell proliferation
(1,2). ROS also function as second
messengers, targeting discrete signal transduction pathways in a
variety of systems, including the pulmonary system (3,4). ROS
are usually generated as by-products of mitochondrial respiration
or are specifically produced by oxidases, including nicotinamide
adenine dinucleotide phosphate (NADPH) oxidase and xanthine oxidase
(5). The main metabolic pathways
utilize superoxide dismutases (SODs), which metabolize
O2•− to H2O2(6). Further metabolism by catalase or
glutathione (GSH) peroxidase, yields O2 and
H2O (7). Oxidative
stress is likely to be the consequence of overproduction of ROS or
downregulation of antioxidants, which are associated with cell
death (8–10).
The adult human lung is a structurally complex organ
system. The epithelial-lined airways and endothelial-lined
vasculature are incorporated into an interconnected reticulum of
mesenchyme and extracellular matrix (ECM). In particular,
fibroblast cells largely derived from primitive mesenchyme,
synthesize the ECM and collagen to maintain the structural and
functional integrity of connective tissues in the pulmonary system.
The lung is vulnerable to various forms of injuries, both airborne
and bloodborne, that may result in lung fibrosis and cancer in
which fibroblast cells, including myofibroblasts and
tumor-associated fibroblasts, are involved (11). For the duration of inflammation,
tissue concentrations of H2O2 are estimated
to reach almost millimolar levels, whereas minute levels of
H2O2 generated by NADPH oxidase are
hypothesized to act only in the microenvironments of the plasma
membrane (12,13). However, in both cases
H2O2 may modulate the essential cellular
events of proliferation, differentiation and cell death (apoptosis
or necrosis) in fibroblast cells. Exogenous
H2O2 is commonly considered to be the
representative ROS for modeling oxidative stress. However, the
precise molecular mechanisms underlying these important effects in
pulmonary fibroblast cells remain obscure. The
H2O2-induced cytotoxicity in normal
fibroblast cells in vitro may be of toxicological interest
due to the toxic potential of exogenous H2O2
in human pulmonary fibroblasts (HPFs).
In the present study, the effects of exogenous
H2O2 on cell growth and death were evaluated
in normal HPF cells with respect to ROS and GSH levels.
Materials and methods
Cell culture
HPF cells from PromoCell GmbH (Heidelberg, Germany)
were maintained in a humidified incubator containing 5%
CO2 at 37°C. The HPF cells were cultured in RPMI-1640
medium supplemented with 10% (v/v) fetal bovine serum and 1% (v/v)
penicillin-streptomycin (Gibco-BRL, Grand Island, NY, USA). The
cells were grown in 100-mm plastic tissue culture dishes (Nunc A/S,
Roskilde, Denmark) containing 10 ml media and harvested with a
solution of trypsin-EDTA while in a logarithmic phase of growth.
The HPF cells were used between passages 4 and 8.
Cell growth and cell number assays
Cell growth changes in HPF cells treated with
H2O2 were indirectly determined by measuring
the 3-(4,5-dimethylthiazol-2-yl)-2,5-diphenyltetrazolium bromide
(MTT, Sigma-Aldrich, St. Louis, MO, USA) dye absorbance. Changes in
viable and dead cell counts were determined by trypan blue cell
counting. In brief, 5×10³ cells/well were seeded in
96-well microtiter plates (Nunc A/S) for MTT assays and
2×10⁵ cells/well were seeded in 24-well plates (Nunc
A/S) for cell counting. Following exposure to the indicated amounts
of H2O2 (Sigma-Aldrich) for 24 h, the cells
in the 96-well plates were used for MTT assays and the cells in the
24-well plates were collected by trypsin digestion for trypan blue
cell counting. MTT solution [20 μl; 2 mg/ml in phosphate-buffered
saline (PBS)] was added to each well of the 96-well plates. The
plates were incubated for 4 h at 37°C. Medium was withdrawn from
the plates by pipetting and 200 μl DMSO was added to each well to
solubilize the formazan crystals. Optical density was measured at
570 nm using a microplate reader (Synergy™ 2, BioTek
Instruments, Inc., Winooski, VT, USA).
Cell cycle and sub-G1 cell analysis
Cell cycle and sub-G1 cell analysis were determined
by propidium iodide (PI, Ex/Em=488/617 nm; Sigma-Aldrich) staining.
In brief, 1×10⁶ cells/60-mm culture dish (Nunc A/S) were
incubated with the indicated concentrations of
H2O2 for 24 h. Total cells, including
floating cells, were then washed with PBS and fixed in 70% (v/v)
ethanol. Cells were washed again with PBS, then incubated with PI
(10 μg/ml) with simultaneous RNase treatment at 37°C for 30 min.
Cellular DNA content was measured using a FACStar flow cytometer
(Becton Dickinson, Franklin Lakes, NJ, USA) and analyzed by Lysis
II and Cellfit software (Becton-Dickinson).
Annexin V-fluorescein isothiocyanate
(FITC) staining for cell death detection
Apoptosis was determined by staining the HPF cells
with annexin V-FITC (Invitrogen Life Technologies, Camarillo, CA,
USA; Ex/Em=488/519 nm). In brief, 1×10⁶ cells/60-mm
culture dish were incubated with the indicated concentrations of
H2O2 for 24 h. Cells were washed twice with
cold PBS and then resuspended in 500 μl binding buffer [10 mM
HEPES/NaOH (pH 7.4), 140 mM NaCl and 2.5 mM CaCl2] at a
concentration of 1×10⁶ cells/ml. Annexin V-FITC (5 μl)
was then added and the cells analyzed with a FACStar flow
cytometer.
Western blot analysis
Caspase-3 protein expression in
H2O2-treated cells was determined by western
blot analysis. In brief, 1×10⁶ cells/60-mm culture dish
were incubated with 50 μM H2O2 for 24 h.
Cells were then washed with PBS and suspended in five volumes of
lysis buffer [20 mM HEPES. (pH 7.9), 20% (v/v) glycerol, 200 mM
KCl, 0.5 mM EDTA, 0.5% (v/v) NP40, 0.5 mM DTT and 1% (v/v) protease
inhibitor cocktail]. Supernatant protein concentrations were
determined using the Bradford method. Samples containing 10 μg
total protein were resolved by 12.5% SDS-PAGE gels, transferred to
Immobilon-P PVDF membranes (Millipore, Billerica, MA, USA) by
electroblotting and then probed with anti-caspase-3 and
anti-β-actin antibodies (Santa Cruz Biotechnology, Santa Cruz, CA,
USA). The membranes were incubated with horseradish
peroxidase-conjugated secondary antibodies and blots were developed
using an ECL kit (Amersham, Arlington Heights, IL, USA).
Measurement of mitochondrial membrane
potential [MMP (Δψm)]
The MMP (Δψm) levels were measured using
a rhodamine 123 fluorescent dye (Sigma-Aldrich; Ex/Em=485/535 nm).
In brief, 1×10⁶ cells/60-mm culture dish were incubated
with the indicated concentrations of H2O2 for
24 h. Cells were washed twice with PBS and incubated with rhodamine
123 (0.1 μg/ml) at 37°C for 30 min. Rhodamine 123 staining
intensity was determined using a FACStar flow cytometer. The cells
that were rhodamine 123-negative were indicated to have lost MMP
(Δψm).
Detection of intracellular ROS
levels
Intracellular ROS were detected using a fluorescent
probe dye, 2′,7′-dichlorodihydrofluorescein diacetate
(H2DCFDA, Ex/Em=495/529 nm; Invitrogen Life
Technologies) at the indicated times. H2DCFDA is poorly
selective for O2•−. By contrast,
dihydroethidium (DHE, Ex/Em=518/605 nm; Invitrogen Life
Technologies) is a fluorogenic probe that is highly selective for
O2•− among ROS. In brief, 1×10⁶
cells/ml in a FACS tube (Becton-Dickinson) were treated with the
indicated concentrations of H2O2 in the
presence of 20 μM H2DCFDA or DHE. Levels of DCF and DHE
fluorescence were evaluated using a FACStar flow cytometer at the
indicated times. DCF (ROS) and DHE (O2•−)
levels were expressed as mean fluorescence intensity (MFI), which
was calculated using CellQuest software (Becton-Dickinson). In
addition, 1×10⁶ cells/60-mm culture dish were incubated
with the indicated concentrations of H2O2 for
24 h. The cells were then incubated with 20 μM H2DCFDA
or DHE at 37°C for 30 min. H2DCFDA or DHE fluorescence
was assessed using a FACStar flow cytometer.
Measurement of cellular SOD and catalase
activities
SOD enzyme activity was measured using the SOD Assay
kit-WST (Fluka Chemical Corp., Milwaukee, WI, USA) and catalase
enzyme activity was measured using the Catalase assay kit from
Sigma-Aldrich. In brief, 1×10⁶ cells were incubated with
50 μM H2O2 for 24 h. Cells were then washed
with PBS and suspended in 5 volumes of lysis buffer [20 mM HEPES
(pH 7.9), 20% glycerol, 200 mM KCl, 0.5 mM EDTA, 0.5% NP40, 0.5 mM
DTT and 1% protease inhibitor cocktail (Sigma-Aldrich)]. The
supernatant protein concentration was determined by the Bradford
method. Supernatant samples containing 100 μg total protein were
used for determination of SOD and catalase enzyme activities. The
samples were added to each well in 96-well microtiter plates with
the appropriate working solutions (according to the manufacturer’s
instructions) at 25°C for 30 min. Color changes were measured at
450 or 520 nm using a microplate reader (Spectra MAX 340, Molecular
Devices, LLC, Sunnyvale, CA, USA). The value for the experimental
group was converted to a percentage of that of the control
group.
Detection of intracellular GSH
Cellular GSH levels were analyzed using a
5-chloromethylfluorescein diacetate dye (CMFDA, Ex/Em=522/595 nm;
Invitrogen Life Technologies) at the indicated times or 24 h. In
brief, 1×10⁶ cells/ml in a FACS tube (Becton-Dickinson)
were treated with the indicated concentrations of
H2O2 in the presence of 5 μM CMFDA. The level
of CMF fluorescence was evaluated using a FACStar flow cytometer at
the indicated early times. CMF (GSH) levels were expressed as the
MFI, which was calculated using CellQuest software
(Becton-Dickinson). In addition, 1×10⁶ cells in a 60-mm
culture dish were incubated with the indicated amounts of
H2O2 for 24 h. Cells were incubated with 5 μM
CMFDA at 37°C for 30 min. CMF fluorescence was assessed using a
FACStar flow cytometer. Negative CMF staining (GSH depletion) of
cells is expressed as the percentage of (−) CMF cells.
Statistical analysis
Results represent the mean of at least two
independent experiments (mean ± SD). Data were analyzed using
Instat software (GraphPad Prism4, San Diego, CA, USA). The
Student’s t-test or one-way analysis of variance with post hoc
analysis using Tukey’s multiple comparison test was used for
parametric data. P<0.05 was considered to indicate a
statistically significant difference.
Results
Effect of H2O2 on
HPF cell growth
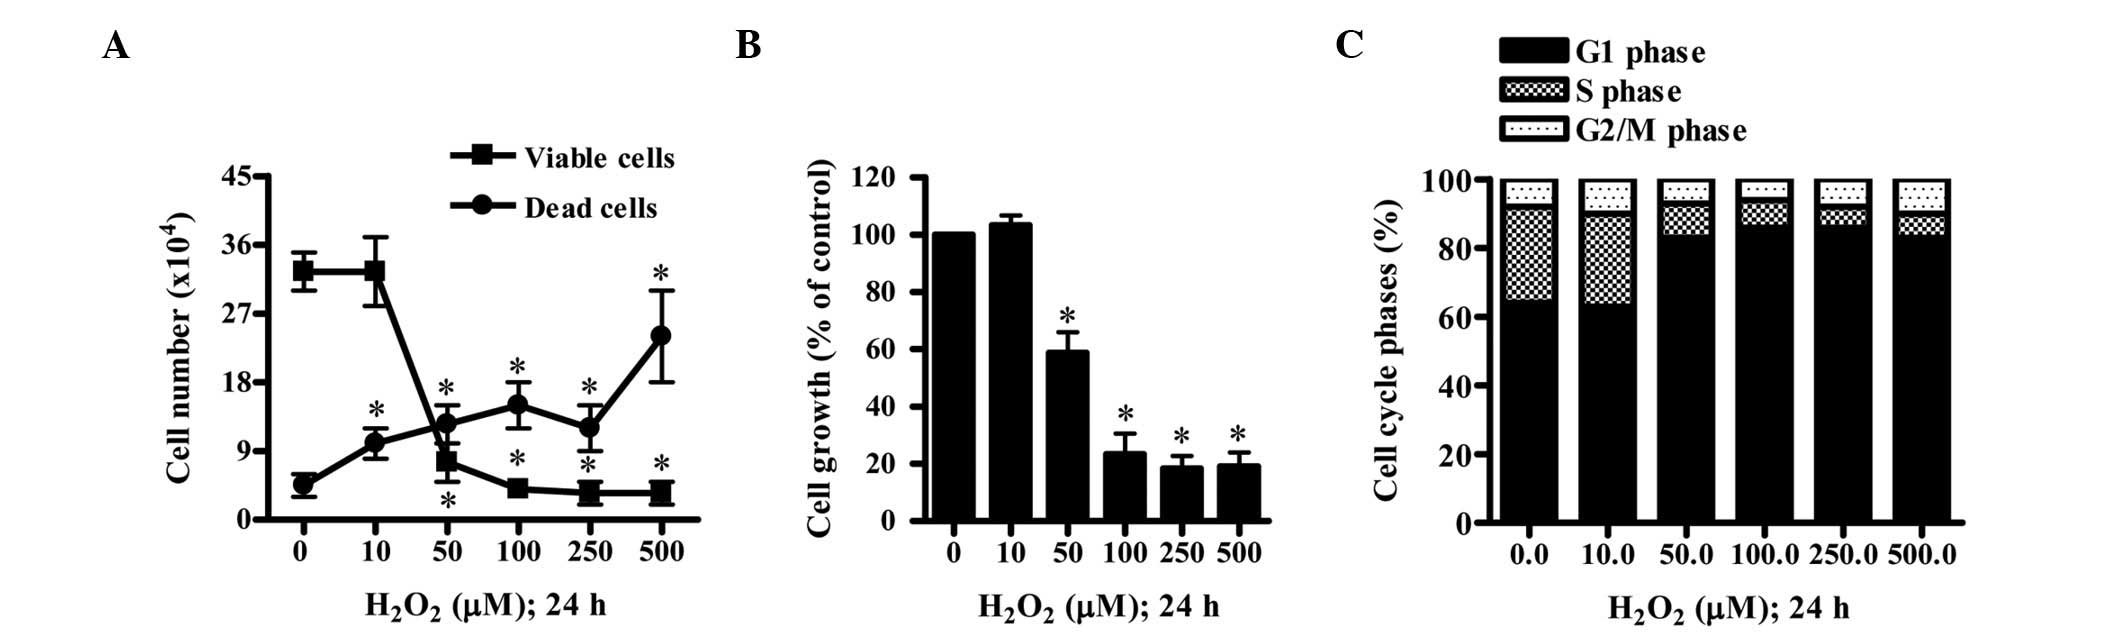
The effect of H2O2 on the
growth of HPF cells was examined at 24 h. While 10 μM
H2O2 did not alter the viable (trypan
blue-negative) cell number of the HPF cells, 50–500 μM
H2O2 significantly decreased the population
of viable HPF cells in a concentration-dependent manner (Fig. 1A). In addition,
H2O2 increased the number of dead (trypan
blue-positive) cells in a concentration-dependent manner (Fig. 1A). The ratio of dead cells to
viable cells was increased by H2O2 treatment.
Based on MTT assays, 10 μM H2O2 did not
inhibit HPF cell growth whereas 50–500 μM
H2O2 was observed to significantly inhibit
the growth of HPF cells with an IC50 (the half maximal
inhibitory concentration) of ~50 μM (Fig. 1B). When the cell cycle
distributions of the H2O2-treated HPF cells
were examined, 50–500 μM H2O2 was identified
to significantly induce G1 phase arrest compared with that of
control cells (Fig. 1C).
Effect of H2O2 on
cell death and MMP (Δψm) in HPF cells
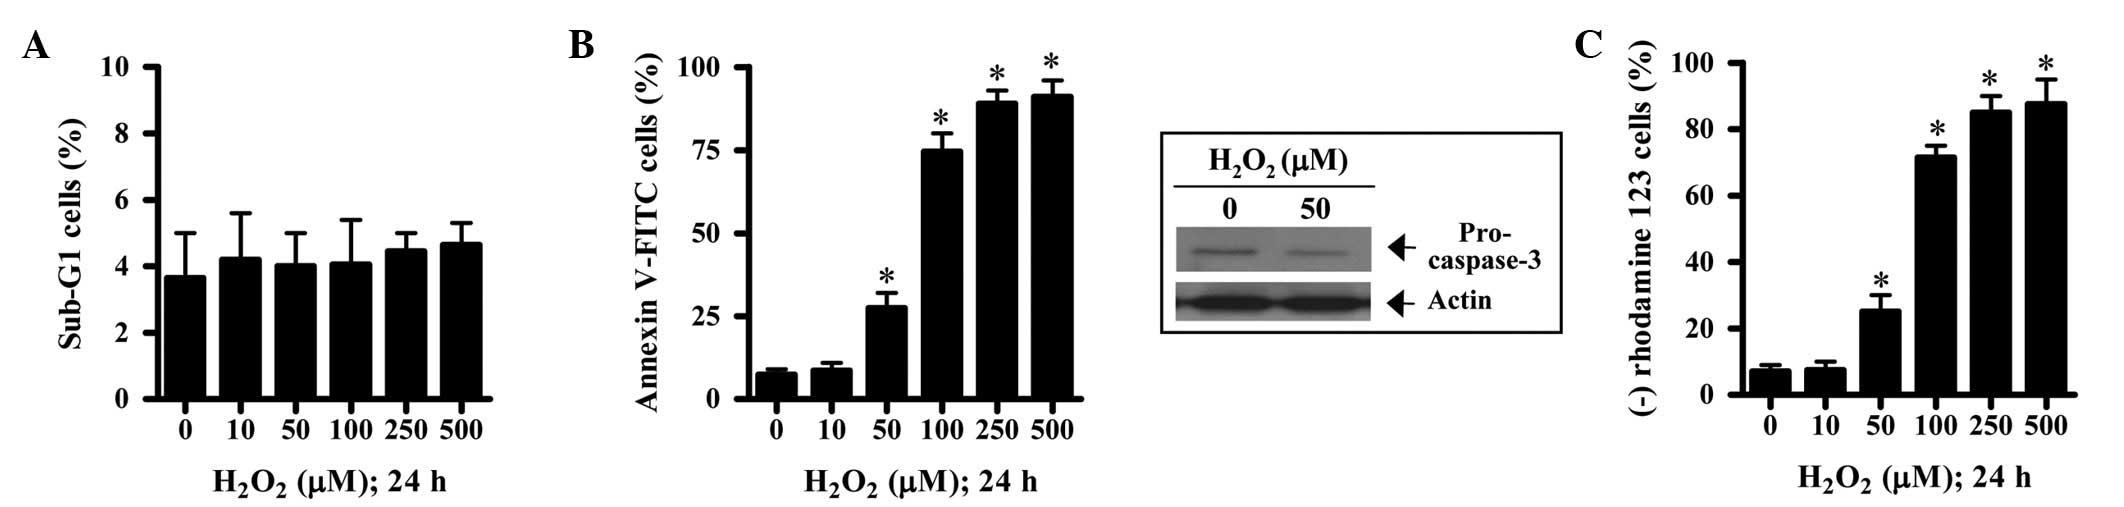
Next, we determined whether
H2O2 induced cell death via apoptosis in HPF
cells. The tested concentrations of H2O2 did
not increase the percentage of sub-G1 HPF cells, which implied that
dead cells in H2O2-treated HPF cells were not
converted into sub-G1 cells (Fig.
2A). Treatment with 50–500 μM H2O2
increased the percentage of annexin V-FITC-positive HPF cells in a
concentration-dependent manner (Fig.
2B). H2O2 decreased procaspase-3 in HPF
cells, which indirectly demonstrated that
H2O2 activated caspase-3 in these cells
(Fig. 2B). Since apoptosis is
closely associated with the collapse of MMP (Δψm)
(14), the effect of
H2O2 on MMP (Δψm) was assessed in
HPF cells using rhodamine 123. Treatment with 50–500 μM
H2O2 was identified to significantly induce
the loss of MMP (Δψm) in HPF cells (Fig 2C).
Effect of H2O2 on
intracellular ROS levels in HPF cells
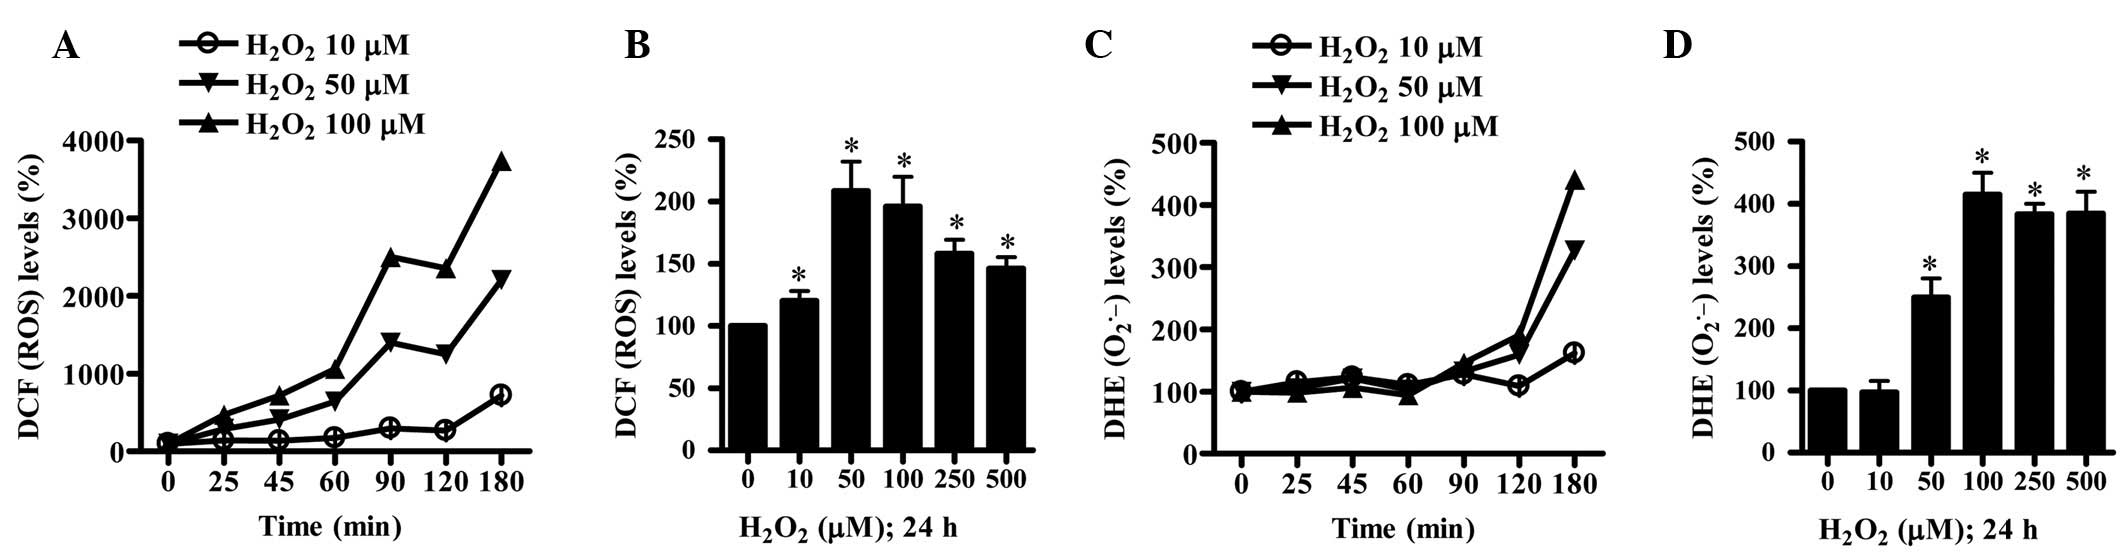
To assess the intracellular ROS levels in
H2O2-treated HPF cells, H2DCFDA
and DHE dyes were utilized. Treatment with 50 or 100 μM
H2O2 increased ROS (DCF) levels from 25 min
and 10 μM H2O2 also increased levels from 90
min (Fig. 3A). A gradual increase
in ROS (DCF) levels was observed up to 180 min, however, there was
a transient decrease in ROS levels at 120 min (Fig. 3A). In addition, all tested
concentrations of H2O2 increased ROS (DCF)
levels in HPF cells at 24 h and the level in the 50 μM
H2O2-treated HPF cells was the highest
(Fig. 3B). The level of DHE
fluorescent dye, which specifically reflects
O2•− accumulation in cells, was also
increased in 50 or 100 μM H2O2-treated HPF
cells from 120 min (Fig. 3C).
Treatment with 10 μM H2O2 increased
O2•− levels at 180 min (Fig. 3C). Treatment with 50–500 μM
H2O2 significantly increased
O2•− levels at 24 h whereas 10 μM
H2O2 did not alter these levels (Fig. 3D). Furthermore, the activities of
SOD and catalase were measured in
H2O2-treated HPF cells. As demonstrated in
Fig. 4, 50 μM
H2O2 increased the activity of SOD but did
not alter the activity of catalase.
Effect of H2O2 on
GSH levels in HPF cells
The measurement of intracellular GSH levels in
H2O2-treated HPF cells using a CMFDA dye
revealed that 50 or 100 μM H2O2 decreased GSH
(CMF) levels by ~30% compared with the control at 25 min (Fig. 5A). The levels gradually recovered
up to 120 min and then markedly decreased again at 180 min
(Fig. 5A). Treatment with 10 μM
H2O2 also decreased GSH (CMF) levels at 60 or
180 min but transiently increased levels at 120 min (Fig. 5A). Furthermore, 50–500 μM
H2O2 significantly increased GSH depleted
cell numbers in HPF cells at 24 h (Fig. 5B).
Discussion
Cultured normal human cells are invaluable
biological models for mechanistic studies of genotoxic or cytotoxic
chemicals and drugs. The present study focused on elucidating the
cytotoxic effect of exogenous H2O2 on cell
growth and death in normal HPF cells with respect to changes in ROS
and GSH levels. Exposure to H2O2 for 24 h
inhibited the growth of HPF cells with an IC50 of ~50
μM. According to our unpublished data, H2O2
reduced the growth of human pulmonary artery smooth muscle (HPASM)
cells with an IC50 of ~250–500 μM at 24 h. These results
indicate that the susceptibility of HPF cells to
H2O2 is high compared with that of HPASM
cells. Thus, the cytotoxic effects of H2O2
differ among various normal lung cells depending on their origins.
In addition, H2O2 inhibited the growth of
Calu-6 and A549 lung cancer cells with IC50 values of
~75 and 10 μM at 24 h, respectively (unpublished data). HPF cells
appear to be extremely vulnerable to oxidative stress compared with
other lung cells, including cancer cells. It is hypothesized that
HPF cells, among other lung-related cells, may be primarily and
frequently involved in lung inflammation and fibrosis.
H2O2 increased the percentage
of annexin V-FITC-positive cells in the HPF cell population,
indicating that H2O2-induced HPF cell death
occurred via apoptosis. H2O2 also activated
caspase-3 in the cells. Notably, none of the tested concentrations
of H2O2 significantly increased the number of
sub-G1 cells, implying that H2O2 fixed HPF
cells in a similar manner to ethanol or methanol. Therefore,
H2O2 appeared to provoke HPF cell death via
apoptosis as well as necrosis. In addition,
H2O2 induced MMP (Δψm) loss in a
concentration-dependent manner in HPF cells. The levels of MMP
(Δψm) loss were comparable with the levels of annexin
V-stained cells, indicating that H2O2-induced
cell death is associated with the collapse of MMP (Δψm).
Furthermore, DNA flow cytometric analysis indicated that 50–500 μM
H2O2 significantly induced a G1 phase arrest
of the cell cycle in HPF cells. Thus, G1 phase arrest in
H2O2-treated HPF cells was an underlying
mechanism suppressing the growth of HPF cells along with cell
death.
The main ROS involved in cell signaling pathways
are H2O2 and O2•−. ROS
toxicity is usually mediated by •OH (4). The current results indicate that ROS
levels, including those of O2•−, were
significantly increased in the HPFs treated with
H2O2. However, the ROS types and
concentrations varied depending on the incubation times and
concentrations of H2O2. Treatment with 50 or
100 μM H2O2 increased ROS (DCF) levels from
25 min whereas 10 μM H2O2 increased levels
from 90 min. Although there was a transient decrease in ROS levels
at 120 min during this gradual increase, the increased levels
exceeded baseline. DHE (O2•−) levels in 50
and 100 μM H2O2-treated HPF cells were
increased from 120 min and from 180 min in 10 μM
H2O2-treated HPF cells.
H2O2 was observed to damage the mitochondria,
particularly the mitochondrial respiratory transport chain, from 25
min. This damage led to induction of electron leakage from the
chain and increased DHE (O2•−) levels at 120
min. It is possible that H2O2 also activated
oxidases, including NADPH oxidase and xanthine oxidase, in HPF
cells to generate O2•− and increased the
activity of SOD. Thus, H2O2 appeared to
increase the DHE (O2•−) level via ROS
generation rather than scavenging. All concentrations of
H2O2 were identified to increase ROS (DCF)
levels in HPF cells at 24 h and 50 μM H2O2
was observed to be the most potent. However, 10 μM
H2O2 did not increase DHE
(O2•−) levels at 24 h and 100–500 μM
H2O2 markedly increased levels of DHE
(O2•−) compared with ROS (DCF). Since
H2O2 concentrations >50 μM induced cell
death and MMP (Δψm) loss in HPF cells, it is possible
that exogenous H2O2 markedly generates
O2•− by mitochondrial damage and
H2O2 and O2•− are
efficiently converted into toxic •OH via the Fenton
reaction to kill HPF cells.
Apoptotic effects are inversely correlated with GSH
content (15). Similarly,
H2O2 increased the number of GSH-depleted
cells in HPF at 24 h, which correlated with annexin V-FITC results
from the HPF cells treated with H2O2. These
results support the hypothesis that intracellular GSH content has a
decisive effect on cell death (15). Treatment with 50 and 100 μM
H2O2 decreased GSH levels at 25 min and the
levels were partially recovered until 120 min. Following this, GSH
levels were markedly reduced at 180 min. Since
H2O2 markedly increased ROS (DCF) levels at
25 min, GSH levels were expected to decrease in order to reduce ROS
(DCF) levels. In addition, as DHE (O2•−)
levels in the H2O2-treated HPF cells
increased from 120 min, GSH levels were observed to markedly
decrease at 180 min due to increased ROS levels, including
O2•−. Thus, GSH levels correlate with ROS
levels in H2O2-treated HPF cells and are also
differently affected by various species of ROS.
In conclusion, H2O2 inhibited
HPF cells growth via apoptosis and/or necrosis as well as G1 phase
arrest, which was accompanied by increased intracellular ROS levels
and GSH depletion. HPF cells appear to be extremely vulnerable to
exogenous H2O2 compared with other lung
cells, including cancer cells. The present studies provides an
important insight into the toxicological effect of exogenous
H2O2 on normal HPF cells.
Acknowledgements
This study was supported by a grant from the
Ministry of Science and Technology/Korea Science and Engineering
Foundation through the Diabetes Research Center at Chonbuk National
University (2012-0009323).
Abbreviations:
|
HPF
|
human pulmonary fibroblast
|
|
ROS
|
reactive oxygen species
|
|
SOD
|
superoxide dismutase
|
|
MMP (Δψm)
|
mitochondrial membrane potential
|
|
MTT
|
3-(4,5-dimethylthiazol-2-yl)-2,5-diphenyltetrazolium bromide
|
|
FITC
|
fluorescein isothiocyanate
|
|
PI
|
propidium iodide
|
|
H2DCFDA
|
2′,7′-dichlorodihydrofluorescein
diacetate
|
|
DHE
|
dihydroethidium
|
|
GSH
|
glutathione
|
|
CMFDA
|
5-chloromethylfluorescein
diacetate
|
References
|
1
|
Gonzalez C, Sanz-Alfayate G, Agapito MT,
Gomez-Nino A, Rocher A and Obeso A: Significance of ROS in oxygen
sensing in cell systems with sensitivity to physiological hypoxia.
Respir Physiol Neurobiol. 132:17–41. 2002. View Article : Google Scholar : PubMed/NCBI
|
|
2
|
Baran CP, Zeigler MM, Tridandapani S and
Marsh CB: The role of ROS and RNS in regulating life and death of
blood monocytes. Curr Pharm Des. 10:855–866. 2004. View Article : Google Scholar : PubMed/NCBI
|
|
3
|
Irani K: Oxidant signaling in vascular
cell growth, death and survival: a review of the roles of reactive
oxygen species in smooth muscle and endothelial cell mitogenic and
apoptotic signaling. Circ Res. 87:179–183. 2000. View Article : Google Scholar : PubMed/NCBI
|
|
4
|
Perez-Vizcaino F, Cogolludo A and Moreno
L: Reactive oxygen species signaling in pulmonary vascular smooth
muscle. Respir Physiol Neurobiol. 174:212–220. 2010. View Article : Google Scholar : PubMed/NCBI
|
|
5
|
Zorov DB, Juhaszova M and Sollott SJ:
Mitochondrial ROS-induced ROS release: An update and review.
Biochim Biophys Acta. 1757:509–517. 2006. View Article : Google Scholar : PubMed/NCBI
|
|
6
|
Zelko IN, Mariani TJ and Folz RJ:
Superoxide dismutase multigene family: a comparison of the CuZn-SOD
(SOD1), Mn-SOD (SOD2) and EC-SOD (SOD3) gene structures, evolution
and expression. Free Radic Biol Med. 33:337–349. 2002. View Article : Google Scholar : PubMed/NCBI
|
|
7
|
Wilcox CS: Reactive oxygen species: roles
in blood pressure and kidney function. Curr Hypertens Rep.
4:160–166. 2002. View Article : Google Scholar : PubMed/NCBI
|
|
8
|
Chen TJ, Jeng JY, Lin CW, Wu CY and Chen
YC: Quercetin inhibition of ROS-dependent and -independent
apoptosis in rat glioma C6 cells. Toxicology. 223:113–126. 2006.
View Article : Google Scholar : PubMed/NCBI
|
|
9
|
Dasmahapatra G, Rahmani M, Dent P and
Grant S: The tyrphostin adaphostin interacts synergistically with
proteasome inhibitors to induce apoptosis in human leukemia cells
through a reactive oxygen species (ROS)-dependent mechanism. Blood.
107:232–240. 2006. View Article : Google Scholar
|
|
10
|
Wallach-Dayan SB, Izbicki G, Cohen PY,
Gerstl-Golan R, Fine A and Breuer R: Bleomycin initiates apoptosis
of lung epithelial cells by ROS but not by Fas/FasL pathway. Am J
Physiol Lung Cell Mol Physiol. 290:L790–L796. 2006. View Article : Google Scholar : PubMed/NCBI
|
|
11
|
Hinz B, Phan SH, Thannickal VJ, Prunotto
M, Desmouliere A, Varga J, De Wever O, Mareel M and Gabbiani G:
Recent developments in myofibroblast biology: paradigms for
connective tissue remodeling. Am J Pathol. 180:1340–1355. 2012.
View Article : Google Scholar : PubMed/NCBI
|
|
12
|
Rhee SG, Kang SW, Jeong W, Chang TS, Yang
KS and Woo HA: Intracellular messenger function of hydrogen
peroxide and its regulation by peroxiredoxins. Curr Opin Cell Biol.
17:183–189. 2005. View Article : Google Scholar : PubMed/NCBI
|
|
13
|
Vilhardt F and van Deurs B: The phagocyte
NADPH oxidase depends on cholesterol-enriched membrane microdomains
for assembly. EMBO J. 23:739–748. 2004. View Article : Google Scholar : PubMed/NCBI
|
|
14
|
Yang J, Liu X, Bhalla K, Kim CN, Ibrado
AM, Cai J, Peng TI, Jones DP and Wang X: Prevention of apoptosis by
Bcl-2: release of cytochrome c from mitochondria blocked. Science.
275:1129–1132. 1997. View Article : Google Scholar : PubMed/NCBI
|
|
15
|
Estrela JM, Ortega A and Obrador E:
Glutathione in cancer biology and therapy. Crit Rev Clin Lab Sci.
43:143–181. 2006. View Article : Google Scholar
|