Introduction
Ultrasonic tissue characterization (UTC) is a method
for exploring the association between the acoustic properties and
ultrasonic manifestations of tissues (1). UTC utilizes tissue status-reflecting
parameters that may be isolated from ultrasound signals in order to
distinguish different tissues and to identify the nature of lesions
(2). Conventional two-dimensional
(2D) ultrasound imaging reflects the anatomical structure of
cross-sections in grayscale, and the shade depends on the echo
amplitude. However, the echo amplitude is the external envelope of
the original signals, and tissue imaging based on signal envelope
extraction is unable to reveal the detailed characteristics of
tissues (3).
Radiofrequency ultrasound local estimators (RULES)
is a newly developed tissue characterization method (4–7).
When ultrasonic energy passes through soft tissue, its mechanical
energy interacts with local tissues, and energy absorption, wave
reflection and dispersion occur simultaneously. The energy that is
reflected back to the ultrasonic transducer constitutes the
ultrasonic echo signals (8). The
ultrasonic signals received on the surface of the transducer are
formed by the overlapping of waves with different amplitudes, and
their duration and overlap are related to their ultrasound
bandwidth and center frequency. Signals received in this form are
the original signals (3,7).
Original signals contain a large amount of
information with regard to the tissue characteristics, and the
RULES algorithm is based on interactive radiofrequency (RF) signal
processing. RULES echographic signals are processed by fast
echographic multiparameter multi-image novel apparatus (FEMMINA), a
newly developed hardware/software platform that extracts the
characteristic parameters of local tissues using the wavelet
analysis method for texture characterization, and shares the image
processing between the hardware and software. The original signals
are converted into different colors that represent different tissue
structural information after being analyzed and processed by
RULES.
The RULES method, although still in its infancy, has
been shown to have a potential clinical application for the
diagnosis of prostate (9,10) and breast cancer (8), and the differentiation of carotid
plaque tissue (11). However,
similar to conventional ultrasonographic tissue characterization,
images obtained using the RULES method may be affected by
variables, including transducer frequency, instrument gain and
scanning depth. Limited research has been carried out on the
potential effects of differences in these imaging parameters on
RULES images. Thus, the aim of the present study was to investigate
the effects of probe frequency, gain and scanning depth on the
characteristics of RULES images, using a phantom gallbladder model.
This model was selected in order to eliminate the effects of
clinical variables on the images.
Materials and methods
Model
The experiment was performed using the gallbladder
model in the Abdominal Intraoperative and Laparoscopic Ultrasound
Phantom (Kyoto Kagaku Co., Kyoto, Japan; http://www.kyotokagaku.com/products/detail03/us-3.html).
The study was approved by the Ethics Committee of The First
Hospital of Shanxi Medical University, Taiyuan, P.R. China.
Instruments and methods
An Esaote Technos MPX Color Doppler Ultrasound
Machine (Esaote, Genova, Italy) was used; this was connected to a
rapid analysis multi-image multi-parameter parallel processor
through an optical fiber. The transducer used was an LA523
broadband transducer (Esaote) with a frequency of 4–13 MHz. One
experienced ultrasonographer performed all of the examinations in
this study.
Image acquisition
Firstly, conventional 2D ultrasound was used to scan
the simulated gallbladder in the model, and the position and size
of the simulated gallbladder were observed. The device was then
switched to the RULES functional status, and the mechanical index
(MI) was fixed at 0.7. The time gain compensation (TGC) was kept
constant at the near and far fields, and the focus was located at
the center of the image. The settings were saved to ensure
consistent test conditions.
The total gain was fixed at 110, the depth was fixed
at 62 mm and images output by the FEMMINA platform were obtained
with transducer frequencies of 5.5, 8.0, 10.0 and 12.5 MHz. The
transducer frequency was then set at 12.5 MHz and the depth was
fixed at 62 mm; images were captured with the total gain set at 90,
95, 100, 105, 110, 115, 120, 125 and 130. Thereafter, the total
gain was fixed at 110, the transducer frequency was set at 12.5 MHz
and images were captured for depths of 62, 72, 83 and 103 mm. In
all instances, the position of the transducer remained unchanged
during the image acquisition process. A total of 20 images were
obtained for each set of parameters. In order to ensure
objectivity, in each case, 4 images were captured and the system
was exited. This image acquisition process was repeated 5 times to
obtain a total of 20 images for each unique combination of machine
settings.
A frequency of 12.5 MHz was selected, since the
images exhibited the greatest number of colors at this frequency. A
depth of 62 mm was selected based on the penetration force of the
ultrasound and the display range; a depth of <62 mm decreased
the display range to a degree that the complete gallbladder was not
included. A depth of >62 mm resulted in insufficient penetration
of the ultrasound, and the gallbladder was not clearly displayed.
The gain was set at 110 as the filling rate of the images was
efficient at this gain, as determined by visual estimation, and it
was the median of the range of gains studied.
Image measurement and analysis
The Image-Pro Plus analysis software (Media
Cybernetics, Bethesda, MD, USA) was used to analyze the captured
images. The area of interest (AOI) was drawn along the inner edge
of the simulated gallbladder, and the software automatically
calculated the percentages of various colored areas in the AOI.
After selecting the color to be analyzed, the software
automatically calculated the percentage of that color in the AOI of
the simulated gallbladder, which was defined as the color filling
rate.
Statistical analysis
Results for color filling rate are presented as the
mean ± standard deviation (SD). Comparisons between groups were
evaluated using ANOVA with Tukey’s adjustment. Data analyses were
performed using the SAS version 9.0 statistical software (SAS
Institute Inc., Cary, NC, USA). P<0.05 was considered to
indicate a statistically significant difference.
Results
Images
Images of the simulated gallbladder output by
FEMMINA manifested as a superposition of conventional 2D images and
color images after being processed using the RULES method. The
colors were blue, red (or red-orange) and green (or green-yellow).
Blue was predominant in the lumen of the model gallbladder, while
red and green were primarily located near the inner edge of the
lumen (Fig. 1).
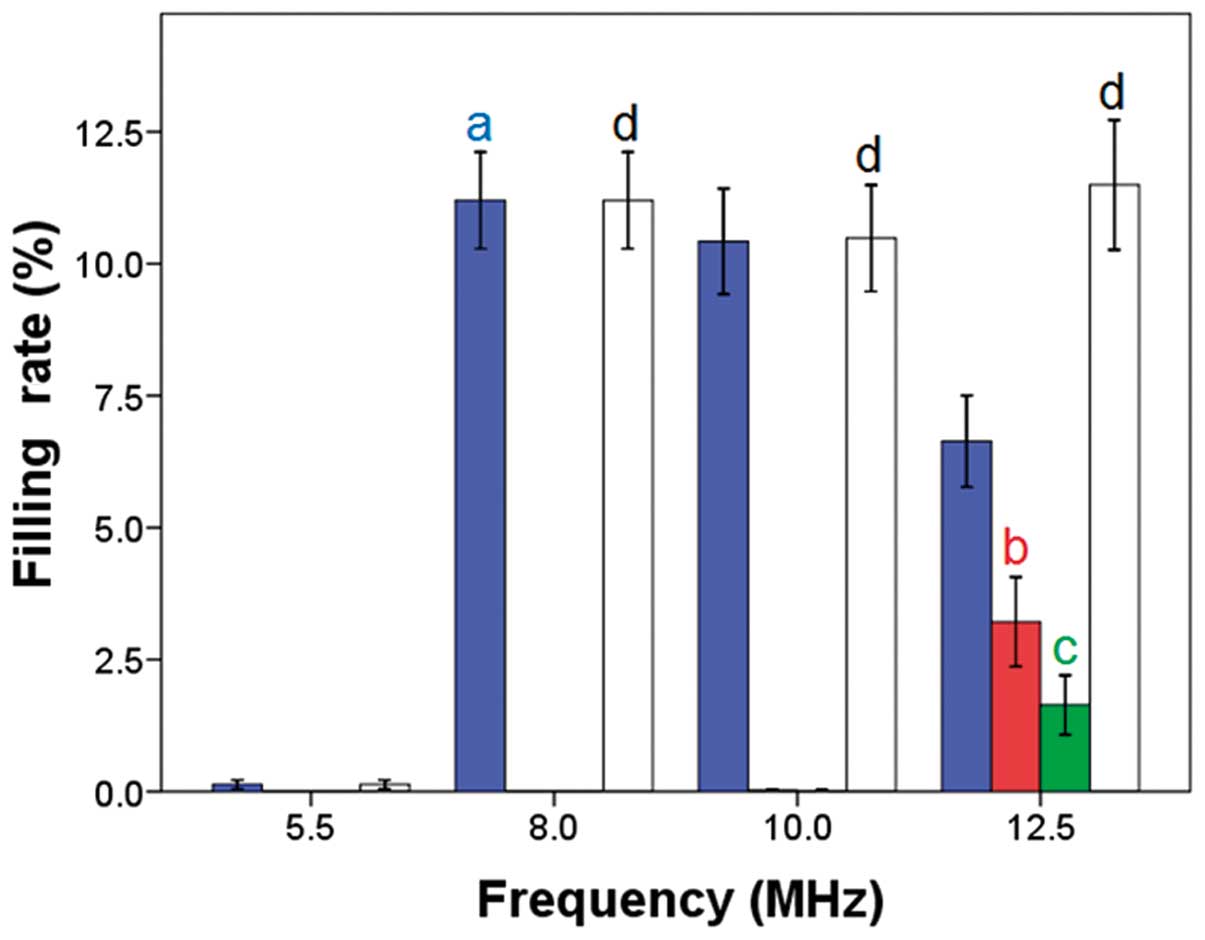
Effects of transducer frequency on the
color filling rate
When the depth was set at 62 mm and the gain at 105,
the total color filling rate in the simulated gallbladder was
similar at transducer frequencies of 8.0, 10.0 and 12.5 MHz; no
statistically significant differences were observed (P=0.0936,
P=1.00 and P=0.069, compared with 5.5 MHz, respectively; Figs. 1 and 2). The blue color filling rate was
greatest with a transducer frequency of 8.0 MHz, while the red and
green color filling rates were greatest with a frequency of 12.5
MHz. Additionally, the color variety was greatest when the
transducer frequency was 12.5 MHz.
Effects of gain on the color filling
rate
Color filling rate data with a fixed depth and
transducer frequency are shown in Fig.
3. When the transducer frequency was 12.5 MHz and the depth was
62 mm, the blue color filling rate was greatest at gains of 105 and
110; no significant differences were identified between the values
(P=0.51). When the gain was <105 or >110, the blue color
filling rate was decreased (all P<0.0001). The red color filling
rate was greatest at gains of 95 and 100; no significant difference
was identified (P=1.00). When the gain was <95 or >100, the
red color filling rate was decreased (all P<0.0001). The green
color filling rate was greatest when the gain was 100, and was
significantly greater than that at gains of 95 and 105 (both
P<0.0001). When the gain was <95 or >105, the green color
filling rate was decreased (all P<0.0001). The total color
filling rate was greatest at gains of 100 and 105, and was
significantly greater compared with that at gains of 95 and 110
(both P<0.0001). When the gain was <95 or >110, the total
color filling rate was decreased (all P<0.0001).
Effects of scan depth on the color
filling rate
When the gain was 110 and the transducer frequency
was 10 MHz, the color filling rates of scan depths ranging from
62–103 mm were not significantly different (Fig. 4).
Discussion
The basic process of the UTC method may be described
by the following steps: i) Radiofrequency signal acquisition and
local spectrum processing; ii) statistical analysis of local
characterization parameters and construction of the corresponding
database; iii) comparison of the local characterization parameters
and the database, and determination of the pathological
characteristics of the tissues; and iv) display of the
characteristic as a superposition of 2D and color images (8).
RULES produces a final image in which different
structural organizations of the tissue being scanned are
represented by different colors superimposed on a conventional
B-mode image. RULES efficiently reflects the structural
characteristics of tissues (7);
therefore, it is considered to have a potential for broad clinical
applications. However, although the actual images obtained through
RULES are associated with tissue structures, they may be affected
by instrument factors, including transducer frequency, scan depth
and total gain. To the best of our knowledge, no previous studies
on the RULES method have provided data regarding the potential
effects of these parameters on the images obtained. In the present
study, we found that images obtained using RULES may be affected by
instrument gain, and, to a certain extent, by transducer
frequency.
Although in its infancy, preliminary studies have
demonstrated the potential clinical application of RULES and the
FEMMINA platform. Bertaccini et al(10) performed a double-blind prospective
study using 105 patients with clinical or biochemical findings
indicating the presence of prostate cancer. All the patients
underwent transrectal biopsy with ultrasonography using the FEMMINA
platform that processes signals by a RULES algorithm. Of the 32
patients with histologically diagnosed cancer, 26 were found to be
positive using the RULES method. RULES exhibited an improved
positive and negative predictive value, sensitivity, specificity
and accuracy compared with B-mode ultrasound. In an in vivo
experiment by Masotti et al(8), it was reported that RULES was able to
accurately distinguish breast carcinoma, fibroademona and cysts.
Masotti et al(11) also
investigated the use of RULES for the differentiation of carotid
plaque tissues, and found that it was possible to accurately
distinguish between calcifications, blood and lipids, and
necrosis.
The implementation of RULES relies on support from
the FEMMINA hardware and software platform (11). The software used in this study was
based on the tissue characterization database and the captured
images reflected the RF signals of local tissues, which were
affected by the transducer frequency and, to a certain extent, by
the total gain.
The results of the present study showed that the
color filling rates of RULES images are affected by the total gain
and, to a certain extent, by the transducer frequency. The greatest
numbers of colors were displayed at a frequency of 12.5 MHz, which
is likely to be due to the higher frequency (i.e., a higher
frequency contains an increased amount of information and thus
better resolution). No obvious color filling of the images was
observed at 5.5 MHz, which may be associated with insufficient
resolution, even though the penetrating force was adequate. When
the frequency was 8.0 and 10.0 MHz, the blue color filling rate of
the images was high, the color variety was limited and the color
filling rates of other colors were low. There were no significant
differences in the total color filling rates at 8.0, 10.0 and 12.5
MHz.
In the present study, RULES images were also found
to be affected by the total instrument gain. Gain represents the
amplification of the signals received by the transducer; the
greater the gain, the greater the brightness of the images.
However, greater gain results in increased signal noise. When the
total gain was between 95 and 110, the color filling rate of the
images was relatively higher and constant. When the gain was
excessively high, the color filling rates of all the colors were
low. This finding is likely to be associated with the increase of
noise with higher gains. When the gain was low, a decreased signal
resulted in a lower color filling rate.
The results of the present study also indicated that
the color filling rates of images did not change significantly when
the scan depth was altered. Changes in the depth altered the
magnification of the images that appeared on the monitor, but did
not alter the actual scanning parameters; thus there was no effect
on the color filling rate.
A model phantom was used in the present study, which
eliminated the effects of respiratory motion and individual
differences that may be present in clinical studies. The model
provided an effective tool for investigating the effects of
different conditions on the image quality obtained with RULES. The
position of the simulated gallbladder was superficial to allow its
corresponding structure to be clearly shown using the linear array
transducer. However, additional factors or multiple composite
factors were not investigated in this study, which is a limitation
that requires consideration when interpreting the obtained results.
Furthermore, the preliminary results of this study require
re-examination in vivo.
In conclusion, images obtained using RULES may be
affected by instrument gain, and to a certain extent, by transducer
frequency. Appropriate ranges of frequency and gain should be
selected for RULES in clinical practice in order to obtain an
optimal image and objective tissue characterization. The results of
this study may be gallbladder specific, and require confirmation
in vivo.
Acknowledgements
This study was supported by the International
Cooperation Project of Shanxi Province (project no.
2008081040).
References
|
1
|
Halliwell M and Wells P: Acoustical
Imaging. Kluwer Academic/Plenum Publishers; New York, NY: 2000
|
|
2
|
Ukimura O and Gill IS: Contemporary
Interventional Ultrasonography in Urology. Springer-Verlag; London:
2009, View Article : Google Scholar
|
|
3
|
Donohue KD, Huang L, Burks T, Forsberg F
and Piccoli CW: Tissue classification with generalized spectrum
parameters. Ultrasound Med Biol. 27:1505–1514. 2001. View Article : Google Scholar : PubMed/NCBI
|
|
4
|
Masotti L, Biagi E, Breschi L, Granchi S,
Di Lorenzo F and Magrini E: Tissue differentiation based on
radiofrequency echographic signal local spectral content. Proc IEEE
Ultrason Symp. 1:1030–1033. 2003.
|
|
5
|
Ponchietti R, Martorana G, Di Loro F,
Bertaccini A, Nesi G, Grigioni WF, et al: A novel spectral
ultrasonic differentiation method for marking regions of interest
in biological tissue: in vitro results for prostate. Arch Ital Urol
Androl. 76:147–153. 2004.PubMed/NCBI
|
|
6
|
Scabia M, Biagi E and Masotti L: Hardware
and software platform for real-time processing and visualization of
echographic radiofrequency signals. IEEE Trans Ultrason Ferroelectr
Freq Control. 49:1444–1452. 2002. View Article : Google Scholar : PubMed/NCBI
|
|
7
|
Schmitz G, Ermert H and Senge T:
Tissue-characterization of the prostate using radio frequency
ultrasonic signals. IEEE Trans Ultrason Ferroelectr Freq Control.
46:126–138. 1999. View Article : Google Scholar : PubMed/NCBI
|
|
8
|
Masotti L, Biagi E, Granchi S, Breschi L,
Magrini E and Di Lorenzo F: Clinical test of Rules. IEEE Trans
Ultrason Ferroelectr Freq Control. 3:2173–2176. 2004.
|
|
9
|
Bertaccini A, Franceschelli A, Schiavina
R, Manferrari F, Brunocilla E, Marchiori D, et al: A novel spectral
ultrasonic differentiation method for marking regions of interest
in biological tissues. In vivo preliminary results. Arch Ital Urol
Androl. 79:108–110. 2007.
|
|
10
|
Bertaccini A, Franceschelli A, Schiavina
R, Marchiori D, Baccos A, Pernetti R, et al: Accuracy of a new
echographic method (RULES, radiofrequency ultrasonic local
estimators) in prostate cancer diagnosis. Anticancer Res.
28:1883–1886. 2008.PubMed/NCBI
|
|
11
|
Masotti L, Biagi E, Granchi S, Luddi A,
Breschi L and Facchini R: Carotid plaque tissue differentiation
based on radiofrequency echographic signal local spectral content
(RULES: Radiofrequency Ultrasonic Local Estimators). In: Biomedical
Imaging: From Nano to Macro. ISBI 2008. 5th IEEE International
Symposium on; pp. 1051–1054. 2008
|