Introduction
The precise determination of prostate cancer (PCa)
aggressiveness facilitates the application of more personalized
treatment regimens and improves the prediction of the prognosis for
patients. The Gleason grade may be used to indicate the
pathological characteristics of PCa. The Gleason score (GS) is a
fundamental biological manifestation of the aggressiveness and
prognosis of PCa (1,2). The 12-core extended systematic
transrectal ultrasound (TRUS)-guided biopsy (TRUS-Gb) is currently
an accepted standard method to detect tumors and identify the
tumors’ Gleason grades. This contributed to the detection of
low-volume, low-risk tumors, but the TRUS-Gb-determined GS is often
increased in numerous patients receiving radical prostatectomy (RP)
(3,4).
Multi-parametric magnetic resonance imaging (MRI)
methods, including T2-weighted imaging (T2WI), diffusion-weighted
imaging (DWI), MR spectroscopy (MRS) and dynamic contrast-enhanced
(DCE) imaging, are important in the accurate detection of PCa
(5,6). MRI-targeted biopsy is a potential
alternative to improve the detection of PCa (7–10).
DWI evaluates the random Brownian motion properties of water
molecules in tissues, which are sensitive to water diffusion
restriction. MRS is a non-invasive imaging modality to obtain
metabolic information about tumors. DWI and MRS have demonstrated
promising results in assessing PCa aggressiveness (11–13).
The purpose of the present study was to investigate
whether TRUS-guided MRI-directed biopsies (TRUS-MR-Dbs), including
DWI-directed biopsies (DWI-Dbs) and MRS-directed biopsies
(MRS-Dbs), may improve the prediction of PCa aggressiveness in
patients when compared with the 12-core TRUS-Gbs.
Materials and methods
Ethics statement
The Ethical Committee of the Provincial Hospital
Affiliated to Shandong University (Shandong, China)approved this
prospective study and written informed consent was obtained from
all of the participants.
Patients
The general practice of urologists in China and
preference of the majority of patients is to undergo MRI
examination prior to biopsy rather than following biopsy. As a
routine examination, patients with clinically suspicious PCa (total
prostate specific antigen (tPSA), >4.0 ng/ml; free PSA
(fPSA)/tPSA, <0.16; positive findings from digital rectal
examination) usually underwent a pre-biopsy MRI in the Radiology
Department of Provincial Hospital (Shandong University, Shandong,
China). From January 2010 to August 2013, 518 patients with
clinically suspicious PCa were referred to undergo MRI examination
by TRUS-Gbs. Patients with pretreatment, including hormone,
radiation and surgery, had been excluded.
MRI
All MRI examinations were performed on a 3.0-T
system (Magnetom verio; SIEMENS, Munich, Bavaria, Germany) with
integrated eight-channel pelvic phased-array surface coils and
spine coils for signal reception. All patients were imaged in a
supine, head first position.
MR imaging sequences included T2WI, DWI, DCE imaging
and MRS, among others. The parameters of sequences are summarized
in Table I. In Table I, the sequences with a small field
of view (FOV; 20×20 cm2) were used to observe PCa and
the invasion of adjacent structures, including organ-confined
tumors, extracapsular extension and seminal vesicle invasion. The
sequences with large FOVs were used to observe nodal metastases and
distant spread. Coronal and/or sagittal enhanced T1-weighted
imaging as well as volume interpolated body examination with large
FOVs were optional and are not listed in Table I. T2WI was performed with a turbo
spin-echo sequence. In order to facilitate positioning, the center
of slice groups, slice thickness and FOV used for DWI and DCE
imaging were consistent with those of the axial T2WI with small
FOVs. MRS data were overlaid on the corresponding axial T2W images.
The MRS followed axial, coronal and sagittal T2WI to avoid the
non-correspondence between the spectra and the corresponding voxel
due to organ movement. DWI was performed using a single-shot
echo-planar imaging technique. Apparent diffusion coefficient (ADC)
maps were automatically generated from the DWI by the scanner. The
MRS was performed using 3D chemical shifting imaging techniques
based on a point-resolved spectroscopic sequence with sufficient
lipid and water suppression. Eight saturation bands were used to
minimize the contamination from adjacent structures of the
prostate. Prior to approval for evaluation, a spectroscopist
validated the spectra by examining them with regard to the correct
positions, signal-to-noise ratio (SNR) >5:1, full width at half
maximum (FWHM) ≤15 Hz, a relatively steady baseline and the absence
of lipid signals.
 | Table IMRI procedures and the corresponding
parameters. |
Table I
MRI procedures and the corresponding
parameters.
| Sequences | TR (ms) | TE (ms) | ST (mm) | Average | FOV
(cm2) | Matrix |
|---|
| Axial T2WI (TSE) | 3110.00 | 101.00 | 3 | 2 | 20.0×20.0 | 320×256 |
| Coronal T2WI
(TSE) | 2950.00 | 96.00 | 3 | 2 | 20.0×20.0 | 320×256 |
| Sagittal T2WI
(TSE) | 3410.00 | 102.00 | 3 | 2 | 20.0×20.0 | 320×256 |
| MRSa (CSI-PRESS) | 750.00 | 145.00 | - | 6 | - | - |
| DWIb (EPI) | 6200.00 | 93.00 | 3 | 6 | 20.0×20.0 | 160×120 |
| Axial T1WI (TSE) | 467.00–645.00 | 9.80 | 4 | 1 | 20.0×20.0 | 512×384 |
| Axial T2WI (TSE) | 4070.00 | 93.00 | 5 | 1 | 38.0×28.5 | 320×168 |
| Axial T1WI
(VIBE)c | 3.90 | 1.40 | 3 | 1 | 38.0×30.8 | 320×182 |
| Axial T1WI-DCE
(VIBE) | 5.21 | 1.80 | 3 | 1 | 20.0×20.0 | 224×160 |
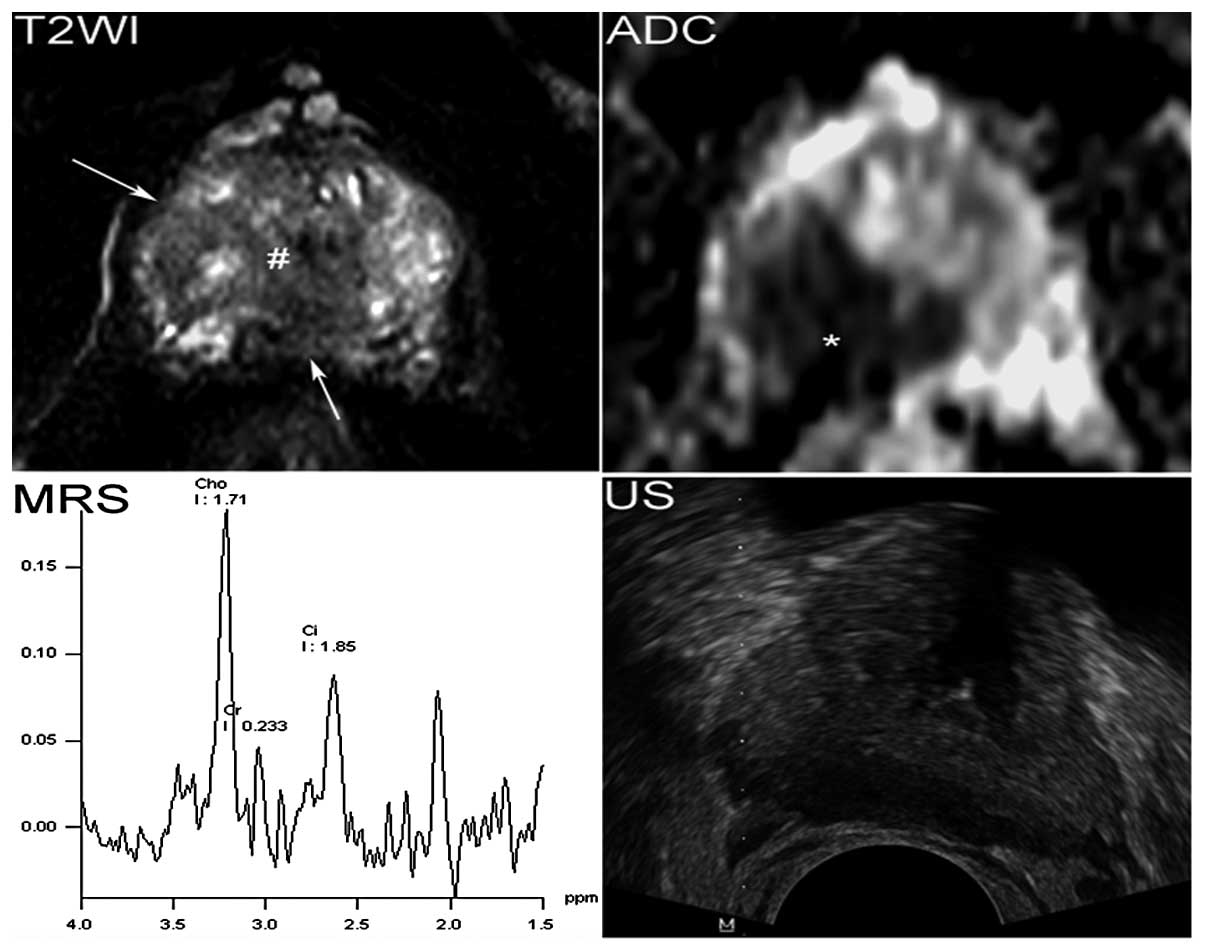
Two senior radiologists determined the PCa
suspicious regions in consensus using the combined information of
multi-parametric MRI. A lesion fulfilling two or more of the
following criteria was regarded as a PCa suspicious region: i) An
area with homogeneous low-signal-intensity and mass effect in the
T2W images; ii) focal hyperintensity in diffusion-weighted images
and corresponding hypointensity in ADC maps; iii) a normal choline
(Cho) + creatine (Cr)/citrate (Cit) ratio (CC/C) = 0.22±0.12 in the
peripheral zone (PZ) and (CC/C) = 0.34±0.14 in the transition zone
(TZ) (14) and CC/C >0.34 [the
mean ± standard deviation] in PZ and CC/C >0.48 in TZ and iv) a
lesion that enhances rapidly and is washout of contrast agent in
delay phase.
Biopsy and histopathological
analysis
The median interval time from MRI examination to
biopsy was three days (range, 1–12 days). Considering the areas
with the minimum ADC or with the maximum CC/C within suspicious
regions may represent the most abnormal part with the highest
cellularity or metabolism (15,16).
These areas were used to target the biopsies to represent the
highest grade of the tumor (Figs.
1 and 2). The patients with
suspected PCa on MR images underwent TRUS-MR-Dbs besides TRUS-Gbs
(12-core) using an ultrasound device (DC-7; Mindray Medical
International Limited, Shenzhen, China). The biopsy was performed
by an urologist and a radiologist. The radiologist was also
involved in the interpretation of the MR images. The steps of
biopsy were as follows: In step 1, the 12-core systematic TRUS-Gbs
were performed on all patients. In step 2, the area with minimum
ADC in the suspicious regions was visually matched with the
corresponding location identified by TRUS. One- to two-core biopsy
was performed in this area while monitoring by TRUS. This step is
known as DWI-Db. In step 3, the area with the maximum CC/C in the
suspicious regions was visually matched with the corresponding
location identified using TRUS. One- to two-core biopsy was
performed in this area while monitoring by TRUS. This step is known
as MRS-Db. In step 4, one- to four-core biopsy was performed under
the TRUS in the suspicious regions in MR images in addition to the
biopsies performed in steps 2 and 3.
If there were no suspicious regions of PCa on MRI,
only step 1 was performed. If the minimum ADC and the maximum CC/C
appeared in the same site, steps 2 or 3 were omitted. The
combination of steps 2–4 is referred to as TRUS-MR-Db in the
present study. The highest Gleason grade (HGG) for TRUS-MR-Db was
obtained from step 2 and/or step 3. The Gleason score (GS) for
TRUS-MR-Db was obtained from step 2, step 3 and step 4. The HGG and
GS for TRUS-Gb were obtained from step 1.
TRUS was able to provide dynamic anatomy images of
arbitrary sections. The majority of PCa cases were present as
hypoechoic masses. However, the sonographic findings of PCa were
non-specific. Numerous tumors were iso-echoic on TRUS. To achieve a
good spatial consistency between ultrasound scans and MRI sections
in performing TRUS-MR-Dbs (step 2, 3 and 4), certain criteria were
required to be met for the biopsy: The gland morphology determined
using ultrasound axial and sagittal scans being similar to that
obtained with the axial and sagittal T2W images, in regard to
specific anatomic structures (i.e. seminal vesicles, veromontanum,
urethra and a number of hyperplasia-nodules) as landmarks. The
biopsy cores were labeled to specify the location of the biopsy and
marked on the T2W images at the corresponding sites.
Collectively, 12–18 cores were obtained from each
patient. A median of four cores (range, two-six), which contained a
median of two cores (range, one-three) in the most abnormal parts,
were obtained from the suspicious regions for PCa in each
patient.
The sites of suspicious PCa and their number were
recorded on MRI for each patient. TRUS-MR-Dbs cores corresponding
to each suspicious tumor on MRI were also recorded. The sites of 12
cores of TRUS-Gbs were relatively fixed. In the present study, only
the patients who underwent RP were included to predict the
aggressiveness of the PCa. The number of tumors was confirmed by RP
pathology. For the patients who underwent RP, the urologist, the
pathologist and the radiologist confirmed in consensus which cores
of TRUS-Gbs and which cores of TRUS-MR-Dbs corresponded with each
tumor using the biopsy records, the biopsy/RP pathology and the MR
images as references. The biopsy cores corresponding to each tumor
in a patient were then confirmed by the two biopsy methods. Only
the tumors visible on MR images were included.
The median interval time from biopsy to RP was nine
days (2–33 days). Pathological sections of prostate from RP were
matched with MR sections based on the level sextant locations by a
pathologist and a radiologist. For cancerous biopsy cores and RP
specimens, the GS of each tumor were determined by a pathologist
with 15 years of experience, by the sum of the primary and
secondary Gleason grades. The corresponding HGG of the specimens
from the most aberrant regions was identified. The tumor volume was
calculated by using the ellipsoid formula (0.52 × length × width ×
height).
Statistical analysis
Cross-tabulation analysis was used to describe the
biopsy and RP findings (including HGG and GS). For both TRUS-Gbs
and TRUS-MR-Dbs, the concordance rates (CRs) with RP were
determined for HGG and GS. McNemar tests or χ2 analyses
with Fisher’s exact tests were performed to determine the
differences for CRs with RP between TRUS-MR-Dbs and TRUS-Gbs as
well as between DWI-Dbs and MRS-Dbs. The independent samples t-test
was used to determine the difference between the volumes of tumors
with accurate GS and of tumors with lower GS for TRUS-MR-Dbs. The
correlation between tumor volume and HGG was evaluated using
Pearson’s correlation. For all statistical analyses, P<0.05 was
considered to indicate a statistically significant difference.
Statistical analysis was performed with SPSS for Windows, version
17.0 (SPSS, Inc., Chicago, IL, USA).
Results
Detection of cancer by TRUS-Gb
MRI results were positive in 254 (49.0%) of the 518
patients. TRUS-MR-Db alone detected 165/254 (65.0%) of cancer
cases. TRUS-Gb alone detected 190/518 (36.7%) of cancer cases. The
overall number of patients with cancer was 196. The median age of
the 196 patients was 73 years (range, 51–87 years). The 165 cancer
cases detected by TRUS-MR-Db included 159 of the 190 cancer cases,
which were detected by TRUS-Gb, and six that were not able to be
detected by TRUS-Gb. These six cancer cases had a HGG ≥3. There
were 31 cancer cases that were not detectable by TRUS-MR-Db, but by
TRUS-Gb. Among these 31 cancer cases, 24 had a HGG of ≤3 and 26
were <0.5 cm in length.
RP findings
Out of the 165 patients, only 40 patients underwent
RP and the quality of MR images and MRS of these patients matched
the criteria. The clinical results of 40 patients with 48 tumors (8
patients, 2 tumors/patient; 32 patients, 1 tumor/patient) are
presented in Table II. Tables III and IV summarize the biopsy and RP findings
of these patients. TRUS-MR-Db demonstrated a higher CR with RP for
overall HGG, 89.6% (43/48). For TRUS-Gb, it was 72.9% (35/48)
(P=0.008). The CRs with RP for TRUS-MR-Dbs vs. those for TRUS-Gbs
were 100% (14/14) vs. 85.7% (12/14; P=0.5) for tumors with HGG of 3
(HGG3); 87.5% (28/32) vs. 68.8% (22/32; P=0.031) for tumors with
HGG4 and 50% (1/2) vs. 50% (1/2; P=1) for tumors with HGG5
(Fig. 3A). For biopsies with low
grade (HGG3), the positive predictive value (PPV) for TRUS-MR-Dbs
representing a true low grade was 77.8% (14/18), whereas for
TRUS-Gbs it was 54.5% (12/22; P=0.125). Undergrading of tumors
compared with RP was present at 10.4% (5/48) for TRUS-MR-Dbs and
27.1% (13/48) for TRUS-Gb (P=0.008). Undergrading of tumors to
HGG<4, which had been graded as HGG4 or HGG5 by RP, occurred at
29.4% (10/34) for TRUS-Gbs and 11.8% (4/34) for TRUS-MR-Dbs
(P=0.031). No overgrading was observed for the biopsies.
| Table IIClinical results of patients and
tumors. |
Table II
Clinical results of patients and
tumors.
| Parameters | Values |
|---|
| Patients, n | 40 |
| Median age, years
(range) | 66 (55–78) |
| Mean tPSA, ng/ml
(range) | 17.63
(2.14–100) |
| Mean fPSA/tPSA
×100% (range) | 13.63%
(2.03–33.02%) |
| Stage |
| T2 | 21 |
| T3 | 19 |
| Gleason score |
| Peripheral
zone |
| 3+2 | 1 |
| 3+3 | 5 |
| 3+4 | 11 |
| 4+3 | 14 |
| 4+4 | 2 |
| 4+5 | 2 |
| Transition
zone |
| 2+3 | 1 |
| 3+2 | 4 |
| 3+3 | 3 |
| 3+4 | 2 |
| 4+3 | 2 |
| 4+4 | 1 |
| Table IIICross tabulation for biopsies and
radical prostatectomy results based on HGG grouping. |
Table III
Cross tabulation for biopsies and
radical prostatectomy results based on HGG grouping.
| | Radical
prostatectomy result | |
|---|
| |
| |
|---|
| Biopsy type | Biopsy result | HGG3 | HGG4 | HGG5 | PPV (%) |
|---|
| TRUS-Gb | HGG0a | 2 | 0 | 0 | 0.0 (0/2) |
| HGG3 | 12 | 10 | 0 | 54.5 (12/22) |
| HGG4 | 0 | 22 | 1 | 95.7 (22/23) |
| HGG5 | 0 | 0 | 1 | 100.0 (1/1) |
| CR, % (n) | 85.7 (12/14) | 68.8 (22/32) | 50.0 (1/2) | 72.9 (35/48) |
| TRUS-MR-Db | HGG3 | 14 | 4 | 0 | 77.8 (14/18) |
| HGG4 | 0 | 28 | 1 | 96.6 (28/29) |
| HGG5 | 0 | 0 | 1 | 100.0 (1/1) |
| CR, % (n) | 100.0 (14/14) | 87.5 (28/32) | 50.0 (1/2) | 89.6 (43/48) |
| Table IVComparation of concordance rates with
radical prostatectomy between biopsies (n=48). |
Table IV
Comparation of concordance rates with
radical prostatectomy between biopsies (n=48).
| For overall
HGG | Percentage, %
(n) | P-value |
|---|
| TRUS-MR-Db vs.
TRUS-Gb | 89.6 (43) vs. 72.9
(35) | 0.008 |
| DWI-Db vs.
TRUS-Gb | 77.1 (37) vs. 72.9
(35) | 0.727 |
| MRS-Db vs.
TRUS-Gb | 50 (24) vs. 72.9
(35) | 0.013 |
| DWI -Db vs.
MRS-Db | 77.1 (37) vs. 50
(24) | 0.015 |
The HGG CRs with RP determined by DWI-Dbs vs.
MRS-Dbs were 77.1% (37/48) vs. 50.0% (24/48; P=0.015) for overall
tumors; 80.0% (28/35) vs. 40.0% (14/35; P=0.003) for PZ tumors and
69.2% (9/13) vs. 76.9% (10/13; P=1) for TZ tumors. For DWI, the
difference of HGG CRs with RP between PZ and TZ tumors was not
significant (P=0.43). For MRS, the difference between PZ and TZ
tumors was significant (P=0.023).
GS findings
A total of 37 (77.1%) and 25 (52.1%; P=0.004) tumors
were assigned the same GS as with RP by TRUS-MR-Dbs and TRUS-Gbs,
respectively (Fig. 3B). By
TRUS-MR-Dbs and TRUS-Gbs, 9 (18.8%) and 23 (47.9%; P<0.001)
tumors were assigned a lower GS than that assigned by RP,
respectively. Two (4.5%) tumors were assigned a higher GS than that
assigned by RP for TRUS-MR-Dbs. The GSs determined by biopsies and
RP are presented in Table V. The
volume of tumors assigned the same GS as RP for TRUS-MR-Dbs
(5.3±4.0 cm3) was significantly smaller than that of the
tumors assigned lower GS (9.1±5.3 cm3; P=0.02). The
tumor volume demonstrated a positive correlation with the HGG
(r=0.396; P=0.005).
| Table VCross tabulation for biopsies and
radical prostatectomy results based on GS grouping. |
Table V
Cross tabulation for biopsies and
radical prostatectomy results based on GS grouping.
| | Radical
prostatectomy result | |
|---|
| |
| |
|---|
| Biopsy type | Biopsy result | 2+3 | 3+2 | 3+3 | 3+4 | 4+3 | 4+4 | 4+5 | PPV, % (n) |
|---|
| TRUS-Gb | GS0 | 0 | 1 | 1 | 0 | 0 | 0 | 0 | 0.0(0/2) |
| 2+3 | 1 | 1 | 0 | 0 | 0 | 0 | 0 | 50.0(1/2) |
| 3+2 | 0 | 3 | 2 | 0 | 0 | 0 | 0 | 60.0(3/5) |
| 3+3 | 0 | 0 | 5 | 6 | 4 | 0 | 0 | 33.3(5/15) |
| 3+4 | 0 | 0 | 0 | 7 | 6 | 0 | 0 | 53.8(7/13) |
| 4+3 | 0 | 0 | 0 | 0 | 6 | 1 | 0 | 85.7(6/7) |
| 4+4 | 0 | 0 | 0 | 0 | 0 | 2 | 1 | 66.7(2/3) |
| 4+5 | 0 | 0 | 0 | 0 | 0 | 0 | 1 | 100.0(1/1) |
| CR, % (n) | 100(1/1) | 60(3/5) | 62.5(5/8) | 53.8(7/13) | 37.5(6/16) | 66.7(2/3) | 50(1/2) | 52.1(25/48) |
| TRUS-MR-Db | 2+3 | 1 | 1 | 0 | 0 | 0 | 0 | 0 | 50.0(1/2) |
| 3+2 | 0 | 4 | 1 | 0 | 0 | 0 | 0 | 80.0(4/5) |
| 3+3 | 0 | 0 | 7 | 2 | 2 | 0 | 0 | 63.6(7/11) |
| 3+4 | 0 | 0 | 0 | 10 | 2 | 0 | 0 | 83.3(10/12) |
| 4+3 | 0 | 0 | 0 | 1 | 11 | 0 | 0 | 91.7(11/12) |
| 4+4 | 0 | 0 | 0 | 0 | 1 | 3 | 1 | 60.0(3/5) |
| 4+5 | 0 | 0 | 0 | 0 | 0 | 0 | 1 | 100.0(1/1) |
| CR, % (n) | 100(1/1) | 80(4/5) | 87.5(7/8) | 76.9(10/13) | 68.8(11/16) | 100(3/3) | 50(1/2) | 77.1(37/48) |
Discussion
In the present prospective study, both TRUS-MR-Dbs
and TRUS-Gbs were performed on the same patient, and assessed in
terms of how clinical factors for different patients (i.e, age,
PSA, prostate weight) affect the biopsy Gleason grade CRs with RP
(17). The most abnormal ADC or
CC/C areas for PCa following multi-parametric imaging were used to
target the biopsies. These areas were expected to have
corresponding tumors with the highest grading (12,18).
Therefore, HGG CRs for biopsies with RP were mainly investigated in
the present study. To the best of our knowledge, this may be the
first prospective report on the use of the combination of DWI and
MRS to direct TRUS-guided biopsy to obtain PCa specimens that may
be more representative of the true RP Gleason grade.
Although TRUS-Gb increased the number of detected
cancer cases, the majority or those that were not detected by
TRUS-MR-Db exhibited an HGG ≤3 or a length <0.5 cm. TRUS-MR-Db
used fewer biopsy cores (a median value of four cores) in a fewer
number of patients (49% of patients) and identified a lower number
of low grade or microfocal tumors. These results were consistent
with the findings of previous studies and reviews (8,19,20),
where it was considered that TRUS-MR-Db may avoid the unnecessary
diagnosis of insignificant PCa.
The Gleason grades as determined by TRUS-MR-Dbs
demonstrated a higher CR with RP compared with TRUS-Gbs. Biopsy
tends to underestimate tumor grades, which may result in the
undertreatment of patients. For example, patients with high grades
(HGG4 and HGG5) may be incorrectly receiving a treatment that is
also used for patients with low grades (HGG<4). The rate of
underestimation compared with RP for TRUS-MR-Db was significantly
lower than that for TRUS-Gb (P=0.031). These results were
consistent with results of previous retrospective studies on the
ability of DWI and MRS to assess tumor aggressiveness and serve as
biomarkers to improve pretreatment prediction of HGG (12,13,21).
However, TRUS-MR-Gbs only improved the prediction
rates for tumors with HGG4 but not for tumors with HGG3 and 5. For
tumors with HGG3, the GS of tumors visible on MR images was 3+3,
followed by 3+2 in the present study, which demonstrated that the
structure/grade of low-grade tumors was relatively homogeneous or
mainly of grade 3. Furthermore, the results of the present study
revealed that a small tumor volume was associated with a low grade.
Therefore, as long as the tumor was detected by 12-core TRUS-Gbs,
the probability of detection of a component with grade 3 may be
greater. San Francisco et al (22) have reported that tumors with low
Gleason grade detected by extended biopsies (≥10 cores) had
significantly higher concordance (88%) with the prostatectomy
Gleason grade. In addition, the 12-core biopsy was performed under
ultrasound guidance in the present study. The intensity of the
relatively small low-grade tumors visible on MR images was
relatively homogeneous, which may correspond to a homogeneous
structure/grade in the low-grade tumors in the present study. For
HGG5, the number of tumors was markedly low (2), which may be not sufficient for a
reliable analysis. In addition, the intensity of high grade tumors
was often heterogeneous, which may be associated with tumor
necrosis. In addition, high grade tumors were often large, which
increased the difficulty of the spatial consistency between MR
images and ultrasound scans. Therefore, TRUS-MR-Dbs did not improve
the prediction rate for HGG5.
DWI-Dbs performance was significantly superior
compared with MRS-Dbs in assessing the HGG of PCa (P=0.015).
TRUS-guided DWI-Dbs and MRS-Dbs improved the accuracy in the
detection of PCa (19,23,24).
However, DWI-Db and TRUS-Gb CRs with RP for HGGs were not
significantly different (P=0.727). CRs with RP for MRS-Dbs were
lower than for TRUS-Gb (P=0.013; Table IV). The negative correlation
between ADC and Gleason grade and the positive correlation between
CC/C and Gleason grade have been reported in previous studies
(13,18,25).
Despite this, it is possible that the minimum ADC or maximum CC/C
of a tumor may not fully represent the highest grade of a tumor,
particularly for CC/C. For only 50% of tumors, the HGGs were
accurately predicted with the maximum CC/C. However, TRUS-MR-Dbs
(the combination of DWI-Dbs and MRS-Dbs) may improve the CRs with
RP compared with TRUS-Gbs. A previous prospective study reported
that DWI targeted MR-guided biopsy significantly improved the
pretreatment assessment of PCa aggressiveness compared with 10-core
TRUS-guided biopsy (26). The
possible reasons for the different results are as follows: (i) The
location accuracy for TRUS-MR-Db is lower than that for MR-guided
biopsy and (ii) the 12-core biopsy further improves the CRs with RP
compared with 10-core biopsy (22). Despite this, the combination of
DWI- and MRS-Dbs had an improved performance as compared with
TRUS-Gb. DWI-Db has a superior performance to MRS-Db in predicting
HGG for PZ tumors (P=0.003), but was equal to MRS-Db for TZ tumors
(P=1). It may be associated with relatively strict requirements for
MRS, including uniformity of a static magnetic field and stability
of radiofrequency. Although eight saturation bands were used to
minimize the contamination from adjacent structures of the
prostate, a number of artifacts may have remained. The PZ adjacent
to the rectum and pelvic fat is more susceptible to rectum gas,
rectum peristalsis and lipid contamination. Voxels with poor
quality MRS or artifacts were excluded. The majority of the
excluded voxels were in PZ tumors. A number of the excluded voxels
may have had the highest grade and certain included voxels may have
contained hidden artifacts. Although DWI may also be affected by
these artifacts, the impact on DWI was far less than that on MRS. A
number of the artifacts of DWI may have been corrected or
compensated in a better way. A retrospective study by Kobus et
al (11) also reported that
DWI assesses the PCa aggressiveness better in PZ.
The GS of PCa has a dominant role in the evaluation
of tumor aggressiveness. The GS CRs with RP determined by
TRUS-MR-Dbs and TRUS-Gbs were also compared. The GS determined by
TRUS-MR-Dbs demonstrated a higher CR (P=0.004) and a lower
underestimated rate (P<0.001) with RP than that determined by
TRUS-Gbs; however, TRUS-MR-Dbs overestimated two tumors. The mean
volume of tumors assigned accurate GS was smaller than that of
underestimated tumors.
There were several limitations in the present study,
including the relatively low number of tumors examined,
particularly the number of tumors with HGG5 (only two), which may
reduce the validity of the results. In China, the incidence of PCa
is lower than in Western countries. Although the incidence of PCa
has significantly increased in recent years, the PSA screening is
not commonly applied and the majority of patients are identified as
having high grade PCa when diagnosed (27) and have lost the opportunity for RP.
In China, patients with PCa are relatively old (median age >70
years) and therefore, patients tend to select a therapy associated
with reduced injury, such as endocrine therapy instead of RP.
Almost all patients with HGG5 had lost the opportunity of RP in the
Provincial Hospital (Shandong, China), which may be the reason for
the low number of HGG5 tumors. The CRs with RP of each GS group of
biopsies were calculated, but statistical comparisons for the
corresponding GS groups between TRUS-MR-Dbs and TRUS-Gbs were not
performed due to the low number of each GS group tumors.
A second limitation was the spatial consistency
between ultrasound scans and MRI sections. Although measures were
taken to solve this problem, it was not easy to achieve the exact
spatial consistency. An MRI/ultrasound fusion platform may improve
the detection of tumors due to its relatively accurate spatial
consistency (19,28,29).
To the best of our knowledge, this platform has not been used to
predict tumor aggressiveness thus far. MRI-guided biopsy may locate
the tumor more accurately and has been used to improve the
prediction of PCa aggressiveness (26). However performing target biopsy
under MRI-guidance is expensive, time-consuming and not widely
available. TRUS-guided biopsies with the visual facilitations of
MRI (DWI or MRS in the present study) have been prospectively
demonstrated to contribute to the detection of PCa (7,24),
and is currently the most widely used diagnostic strategy. The
present study used the same biopsy method (TRUS-MR-Db) to detect
the most abnormal part of PCa. Although the spatial consistency
with TRUS-MR-Db between the ultrasound scans and MRI sections may
be poorer than with the MRI/ultrasound fusion platform, TRUS-MR-Db
was satisfactory to a certain extent. Therefore, TRUS-MR-Dbs
(combination of DWI- and MRS-Dbs) demonstrated higher HGG and GS
CRs for overall tumors with RP compared with TRUS-Gbs.
In conclusion, DWI- and MRS-directed biopsies at the
most abnormal (lowest ADC or highest CC/C) sites may be necessary
in the pretreatment and prediction of tumor aggressiveness in PCa.
DWI-Dbs are more effective than MRS-Dbs, particularly for tumors in
the PZ.
Acknowledgements
The present study was supported by the Shandong
Province Science and Technology Development Plan (nos. 2012GSF11820
and 2012YD18053). The authors are grateful to the language services
agent, Beijing chunfenglv, for grammatical support.
References
|
1
|
Gleason DF and Mellinger GT: Prediction of
prognosis for prostatic adenocarcinoma by combined histological
grading and clinical staging. J Urol. 111:58–64. 1974.
|
|
2
|
Egevad L, Granfors T, Karlberg L, Bergh A
and Stattin P: Prognostic value of the Gleason score in prostate
cancer. BJU Int. 89:538–542. 2002. View Article : Google Scholar : PubMed/NCBI
|
|
3
|
Yang CW, Lin TP, Huang YH, et al: Does
extended prostate needle biopsy improve the concordance of Gleason
scores between biopsy and prostatectomy in the Taiwanese
population? J Chin Med Assoc. 75:97–101. 2012. View Article : Google Scholar : PubMed/NCBI
|
|
4
|
Divrik RT, Eroglu A, Sahin A, Zorlu F and
Ozen H: Increasing the number of biopsies increases the concordance
of Gleason scores of needle biopsies and prostatectomy specimens.
Urol Oncol. 25:376–382. 2007. View Article : Google Scholar : PubMed/NCBI
|
|
5
|
Delongchamps NB, Rouanne M, Flam T, et al:
Multiparametric magnetic resonance imaging for the detection and
localization of prostate cancer: combination of T2-weighted,
dynamic contrast-enhanced and diffusion-weighted imaging. BJU Int.
107:1411–1418. 2011. View Article : Google Scholar
|
|
6
|
Mazaheri Y, Shukla-Dave A, Hricak H, et
al: Prostate cancer: identification with combined
diffusion-weighted MR imaging and 3D 1H MR spectroscopic
imaging - correlation with pathologic findings. Radiology.
246:480–488. 2008. View Article : Google Scholar : PubMed/NCBI
|
|
7
|
Park BK, Park JW, Park SY, et al:
Prospective evaluation of 3-T MRI performed before initial
transrectal ultrasound-guided prostate biopsy in patients with high
prostate-specific antigen and no previous biopsy. AJR Am J
Roentgenol. 197:W876–W881. 2011. View Article : Google Scholar
|
|
8
|
Haffner J, Lemaitre L, Puech P, et al:
Role of magnetic resonance imaging before initial biopsy:
comparison of magnetic resonance imaging-targeted and systematic
biopsy for significant prostate cancer detection. BJU Int.
108:E171–E178. 2011. View Article : Google Scholar
|
|
9
|
Pinto PA, Chung PH, Rastinehad AR, et al:
Magnetic resonance imaging/ultrasound fusion guided prostate biopsy
improves cancer detection following transrectal ultrasound biopsy
and correlates with multiparametric magnetic resonance imaging. J
Urol. 186:1281–1285. 2011. View Article : Google Scholar
|
|
10
|
Vourganti S, Rastinehad A, Yerram NK, et
al: Multiparametric magnetic resonance imaging and ultrasound
fusion biopsy detect prostate cancer in patients with prior
negative transrectal ultrasound biopsies. J Urol. 188:2152–2157.
2012. View Article : Google Scholar
|
|
11
|
Kobus T, Vos PC, Hambrock T, et al:
Prostate cancer aggressiveness: in vivo assessment of MR
spectroscopy and diffusion-weighted imaging at 3 T. Radiology.
265:457–467. 2012. View Article : Google Scholar : PubMed/NCBI
|
|
12
|
Hambrock T, Somford DM, Huisman HJ, et al:
Relationship between apparent diffusion coefficients at 3.0-T MR
imaging and Gleason grade in peripheral zone prostate cancer.
Radiology. 259:453–461. 2011. View Article : Google Scholar
|
|
13
|
Kobus T, Hambrock T, Hulsbergen-van de Kaa
CA, et al: In vivo assessment of prostate cancer aggressiveness
using magnetic resonance spectroscopic imaging at 3 T with an
endorectal coil. Eur Urol. 60:1074–1080. 2011. View Article : Google Scholar : PubMed/NCBI
|
|
14
|
Scheenen TW, Heijmink SW, Roell SA, et al:
Three-dimensional proton MR spectroscopy of human prostate at 3 T
without endorectal coil: feasibility. Radiology. 245:507–516. 2007.
View Article : Google Scholar : PubMed/NCBI
|
|
15
|
Wang XZ, Wang B, Gao ZQ, et al:
Diffusion-weighted imaging of prostate cancer: correlation between
apparent diffusion coefficient values and tumor proliferation. J
Magn Reson Imaging. 29:1360–1366. 2009. View Article : Google Scholar : PubMed/NCBI
|
|
16
|
Wang XZ, Wang B, Gao ZQ, et al:
1H-MRSI of prostate cancer: the relationship between
metabolite ratio and tumor proliferation. Eur J Radiol. 73:345–351.
2010. View Article : Google Scholar
|
|
17
|
Stackhouse DA, Sun L, Schroeck FR, et al:
Factors predicting prostatic biopsy Gleason sum under grading. J
Urol. 182:118–124. 2009. View Article : Google Scholar
|
|
18
|
Zakian KL, Sircar K, Hricak H, et al:
Correlation of proton MR spectroscopic imaging with gleason score
based on step-section pathologic analysis after radical
prostatectomy. Radiology. 234:804–814. 2005. View Article : Google Scholar : PubMed/NCBI
|
|
19
|
Delongchamps NB, Peyromaure M, Schull A,
et al: Prebiopsy magnetic resonance imaging and prostate cancer
detection: comparison of random and targeted biopsies. J Urol.
189:493–499. 2013. View Article : Google Scholar : PubMed/NCBI
|
|
20
|
Moore CM, Robertson NL, Arsanious N, et
al: Image-guided prostate biopsy using magnetic resonance
imaging-derived targets: a systematic review. Eur Urol. 63:125–140.
2013. View Article : Google Scholar : PubMed/NCBI
|
|
21
|
Verma S, Rajesh A, Morales H, et al:
Assessment of aggressiveness of prostate cancer: correlation of
apparent diffusion coefficient with histologic grade after radical
prostatectomy. AJR Am J Roentgenol. 196:374–381. 2011. View Article : Google Scholar : PubMed/NCBI
|
|
22
|
San Francisco IF, DeWolf WC, Rosen S,
Upton M and Olumi AF: Extended prostate needle biopsy improves
concordance of Gleason grading between prostate needle biopsy and
radical prostatectomy. J Urol. 169:136–140. 2003.PubMed/NCBI
|
|
23
|
Park BK, Lee HM, Kim CK, Choi HY and Park
JW: Lesion localization in patients with a previous negative
transrectal ultrasound biopsy and persistently elevated prostate
specific antigen level using diffusion-weighted imaging at three
Tesla before rebiopsy. Invest Radiol. 43:789–793. 2008. View Article : Google Scholar
|
|
24
|
Prando A, Kurhanewicz J, Borges AP,
Oliveira EM Jr and Figueiredo E: Prostatic biopsy directed with
endorectal MR spectroscopic imaging findings in patients with
elevated prostate specific antigen levels and prior negative biopsy
findings: early experience. Radiology. 236:903–910. 2005.
View Article : Google Scholar
|
|
25
|
Tamada T, Sone T, Jo Y, et al: Apparent
diffusion coefficient values in peripheral and transition zones of
the prostate: comparison between normal and malignant prostatic
tissues and correlation with histologic grade. J Magn Reson
Imaging. 28:720–726. 2008. View Article : Google Scholar
|
|
26
|
Hambrock T, Hoeks C, Hulsbergen-van de Kaa
C, et al: Prospective assessment of prostate cancer aggressiveness
using 3-T diffusion-weighted magnetic resonance imaging-guided
biopsies versus a systematic 10-core transrectal ultrasound
prostate biopsy cohort. Eur Urol. 61:177–184. 2012. View Article : Google Scholar
|
|
27
|
Na R, Jiang H, Kim ST, et al: Outcomes and
treands of prostate biopsy for prostate cancer in Chinese men from
2003 to 2011. PLoS One. 7:e499142012. View Article : Google Scholar : PubMed/NCBI
|
|
28
|
Miyagawa T, Ishikawa S, Kimura T, et al:
Real-time Virtual Sonography for navigation during targeted
prostate biopsy using magnetic resonance imaging data. Int J Urol.
17:855–860. 2010. View Article : Google Scholar : PubMed/NCBI
|
|
29
|
Rastinehad AR, Baccala AA Jr, Chung PH, et
al: D’Amico risk stratification correlates with degree of suspicion
of prostate cancer on multiparametric magnetic resonance imaging. J
Urol. 185:815–820. 2011.
|