Introduction
Hepatocellular carcinoma (HCC) has one of the
highest incidence rates of malignant tumors, ranking fifth in the
world, with one-third occurring in China, where each year more than
a half of newly suffering HCC patients are Chinese.
The occurrence of HCC is associated with numerous
factors. Tumor incidence, development and metastasis are not only
the result of the effect of certain tumor cells, but also the
result of multiple systems and multiple factor effects due to the
internal tumor environment. Several studies have demonstrated that
the urokinase plasminogen activator receptor (uPAR) is a
multifunctional receptor. It has been verified that uPAR affects
cell proliferation, migration and adhesion, and its expression is
associated with the malignant degree of a tumor (1). The interaction of uPAR with integrin
α5β1, a fibronectin receptor, is able to activate FAK and ERK. In
the process of microfiber formation, uPAR induces integrin α5β1 to
combine with fibronectin and form insoluble aggregates. The uPAR
signal conduction pathway mediated by integrin α5β1 can promote
tumor cell proliferation and participate in the regulation of cell
proliferation and differentiation (2). Current evidence also suggests that
the MAPK signaling pathway is a major way of activating the
receptor. uPAR is a highly glycosylated single-chain glycoprotein,
which has three homologous domains, D1, D2 and D3. uPA can
dissociate three types of isoform, including uPAR (D1), uPAR
(D2D3), uPAR (D1D2)and uPAR (D3) (3). It has been verified that D1D2 is able
to bind ligands, however, its ligand affinity is lower than full
suPAR. D3 has an important role in managing the receptor with high
affinity (4). However, the
analysis of biomolecular interactions demonstrates that the lack of
affinity is due to the increase in the dissociation rate of the
D1D2 ligand complex (5). uPAR may
affect multiple biological functions, including migration,
adhesion, tumorigenicity and differentiation. The combination of
uPAR with extracellular proteins and its interaction with certain
membrane receptors, including the integrin and epidermal growth
factor receptor, is a new focus of study (6).
At present, the number of different types of splice
variants of uPAR that exist and their underlying mechanisms in the
development of tumorigenesis remains to be elucidated. Therefore,
in the present study, following the comparison of the organization
block adherent method, the liver cell grinding method and the
pancreatic enzyme digestion method, one in vitro cultivation
method which was the most suitable and the most similar to the body
cell growth environment was selected. Then, the uPAR splice
variants exon D1D2 was determined by RT-PCR and its expression
level in liver cancer development was discussed. The present study
aimed to determine the uPAR splice variants exon D1D2 and examine
the role of uPAR exons D1D2 in the process of liver cancer. This
may provide the theoretical basis for clinical diagnosis, prognosis
and treatment.
Materials and methods
Experimental materials
The study was approved by the Medical Ethics
Committee of the First Affiliated Hospital of Guangxi Medical
University (Nanning, China). Written informed consent was obtained
from the patient or the families of the patients. Following signing
of the informed ethical consent forms, the surgically resected
normal liver tissue, tissue adjacent to liver cancer and liver
cancer tissue were collected from five cases of patients with
hepatic hemangioma and 30 cases of HCC at the Department of
Hepatobiliary Surgery of The First Affiliated Hospital of Guangxi
Medical University. The separated tissues were immediately
preserved in DMEM medium at 4°C and the following experiments were
completed rapidly.
The selected liver cell culture method was used to
collect normal liver cells, para-carcinoma cells and liver cancer
cells of a high density, high purity, high activity and to examine
the uPAR (D1D2) level.
Instruments and reagents
DMEM medium, calf serum (Hyclone, Logan, UT, USA),
trypan blue (Sigma, St. Louis, MO, USA), mycoplasma fetal bovine
serum, 0.25% pancreatic enzyme (Hangzhou Sijiqing Biological
Engineering Materials Co., Ltd., Hangzhou, Zhejiang, China), a
CO2 incubator (Thermo Fisher Scientific, Rockford, IL,
USA), an inverted microscope (Nikon, Tokyo, Japan), 4°C
refrigerator (Haier Group, Qingdao, Shandong, China) and a tissue
culture plate (Corning Inc., Corning, NY, USA) were used in the
present study.
Main instruments and reagents
An ultraviolet spectrophotometer (NanoDrop 2000;
Nanodrop Corporation, Wilmington, DE, USA), ultra-low temperature
freezer (Thermo Fisher Scientific), Gel Doc XP + Gel imaging system
(Bio-Rad, Hercules, CA, USA), voltage steady flow electrophoresis
apparatus (DYY-8B; Beijing Liuyi Instrument Plant, Beijing, China),
thermal cycling machine (ABI Veriti; Applied Biosystems, Foster,
CA, USA), TRIzol, RNA PCR kit and nucleic acid dye (Qianjiang Green
Sea Treasure Biological Technology Co., Ltd., Qianjing, Hubei,
China), PCR kit and agarose (Thermo Fisher Scientific) were used in
the present study. The primer was designed by Shanghai
Biotechnology Co. (Shanghai, China) and synthesized by Invitrogen
Trading Co. Ltd., (Shanghai, China; Table I)
 | Table IRT-PCR primers. |
Table I
RT-PCR primers.
| Gene | Length | Primer | Sequence |
|---|
| uPAR (D1D2) | 367 bp | Forward |
5′-GACCTCTGCAGGACCACGAT-3′ |
| | Reverse |
5′-GGTGGCGGTCATCCTTTG-3′ |
| GAPDH | 292 bp | Forward |
5′-GGTGCTGAGTATGTCGTGGAG-3′ |
| | Reverse |
5′-CAGTCTTCTGAGTGGCAGTGAT-3′ |
Liver cell culture method
The pancreatic enzyme digestion method was as
follows. Fresh liver tissue was collected from hepatic hemangioma
patients by surgical resection and removing the capsule and the
blood vessels. The liver tissue was cut into ~1.0 cm3
pieces in aseptic conditions and washed two to three times with PBS
solution. The tissue was then cut using ophthalmic scissors and
washed again with PBS solution until it turned white. Next, it was
centrifuged (560 × g; 5 min) and the supernatant was decanted and
discarded. Trypsin (0.25%), which was 10–15 times tissue, was mixed
with tissue in a tube and then placed in 37°C water for 8–10 min.
The tube was agitated every few minutes to ensure the tissue was in
full contact with the digestive enzymes. Following agitation, the
supernatant was discarded and 10 ml of DMEM medium containing 10%
calf serum was added into the tube to terminate digestion and the
solution was gently pipetted to disperse the tissue. Following
centrifugation (560 × g; 5 min), the supernatant was discarded
using a 200-hole stainless steel mesh filter. DMEM (1.0 ml) was
added into the tube again and gently blown in order to make the
cell suspension. Trypan blue was added and the cells were counted.
The proportion of live cells was ~90%. The cell suspension was
placed equally into three tubes (0.1 ml/tube) and the appropriate
amount of DMEM containing (10, 15 or 20%) calf serum (mycillin:
medium=1:100) was added. It was then blended well, setting the cell
concentration to 1×10⁶/ml. The cell suspension was
plated at a density of 2×10⁵/cm2 and then the
cell culture plate was placed in an incubator of 5% CO2
at 37°C.
Liver cell grinding method
Fresh liver tissue was collected from the hepatic
hemangioma patients by surgical resection and removing the capsule
and the blood vessels. The liver tissue was cut into ~1.0
cm3 pieces in aseptic conditions and was washed two to
three times with PBS solution. The tissue was then cut using
ophthalmic scissors and washed again with PBS solution until the
color turned white. Then the tissue which had been cut up was
transferred into a 200-hole stainless steel mesh filter and the
tissue was gently ground repeatedly using a 10 ml glass syringe.
DMEM medium was added constantly in order to prevent the loss of
tissue moisture in the process. The filtrated cell suspension was
centrifuged (560 ×g; 5 min) and the supernatant was discarded. DMEM
(1.0 ml) was added and the cell suspension was gently blown. The
trypan blue was added and the cells were counted. The proportion of
live cells was ~90%. The cell suspension was equally placed into
three tubes (0.1ml/tube) and the appropriate amount of DMEM
containing (10, 15 or 20%) calf serum (mycillin: medium=1:100) was
added. It was then blended well, setting the cell concentration to
1×10⁶/ml. The cell suspension was plated at a density of
2×10⁵/cm2 and then the cell culture plate was
placed in an incubator of 5% CO2 at 37°C.
Tissue block adherent method
Fresh liver tissue was collected from hepatic
hemangioma patients by surgical resection and removing the capsule
and the blood vessels. The liver tissue was cut into ~1.0
cm3 pieces in aseptic conditions and washed two to three
times with PBS solution. The tissue was then cut using ophthalmic
scissors and washed again with PBS solution until the color turned
white. Following centrifugation (560 × g; 5 min) the supernatant
was decanted and discarded. Trypsin (0.25%) was added to the test
tube and mixed, and then the tube was placed in 37°C water for 8–10
min. The tube was agitated every few minutes to ensure that the
tissue was in full contact with the digestive enzymes. Following
agitation, the supernatant was discarded and 10 ml of DMEM medium
containing 10% calf serum was added into the tube to terminate
digestion, and the solution was gently pipetted to disperse the
tissue. Following centrifugation (560 × g; 5 min), the supernatant
was discarded using a 200-hole stainless steel mesh filter. DMEM
(1.0 ml) was added into the tube again and gently blown in order to
make the cell suspension. Trypan blue was added and the cells were
counted. The proportion of live cells was ~90%. The cell suspension
was equally placed into three tubes (0.1 ml/tube) and the
appropriate amount of DMEM containing (10, 15 or 20%) calf serum
(mycillin: medium=1:100) was added and blended well. Tissue blocks
were distributed evenly in the cell culture plate and it was
ensured that the tissue would not float on the cell culture plate.
The tissues were then cultured in an incubator of 5% CO2
at 37°C. It was forbidden to agitate the cell culture plate for 72
h from the beginning of the cell culture otherwise the tissue block
was unable to adhere to the wall of the cell culture plate, which
affects cell proliferation.
Observation of cell morphology, and
testing of the cell survival rate, purity and the albumin level of
the culture supernatant
Cell morphological changes were observed using an
inverted microscope in the culture process. Liver cells were dyed
with the routine method of PAS staining as the liver cells contain
plenty of glycogen granules which can be dyed red and the nucleus
is vacuolated. The cell purity and survival rate of the three types
of cells with the three methods were calculated under the inverted
microscope. Culture supernatants were collected and the albumin
level was tested prior to replacement of the cell culture fluid
each time.
Comparing the three methods of
cultivation and selecting the most suitable normal liver tissue
culture method as a reference standard
Specimen carcinoma tissues and adjacent tissues of
30 cases of the HCC patients who survived liver cancer surgery were
collected. The diagnostic criteria of liver cancer was set
according to the criteria which was revised at the 8th National
Academic Conference of Liver Cancer in September 2001. Among the
thirty HCC patients, 28 were male and two were female, aged between
25–65 years old with an average age of 49 years old. The cell
culture method referred to the one which was the most suitable for
normal liver cell culture.
RNA extraction
TRIzol (1 ml) was added into the cell culture bottle
and the bottle was placed on ice for 5–10 min. The cell lysates in
the bottle were suctioned into the 1.5 ml EP tubes and 0.2 ml of
chloroform was added to every tube. The tubes were turned upside
down, blended and kept at room temperature for 5 min. Then, the
tubes were centrifuged for 15 min (80,486 × g at 4°C. The sublayer
contained DNA, the white middle layer contained protein and the
upper layer contained RNA. The RNA in the upper layer, which was
colorless liquid, was moved into another EP tube and isopycnic
dimethyl carbinol was added. The tube was blended, kept at room
temperature for 10 min and then centrifuged for 15 min (80,486 × g)
at 4°C. For the precipitation of RNA, the supernatant was poured
out and the white sediment was kept. Then, it was added to 1 ml of
75% absolute ethyl alcohol, beaten gently, centrifuged at 55,890 ×
g at 4°C for 10 min, and then the alcohol was carefully discarded.
The tube of RNA was centrifuged at 55,890 × g at 4°C for 10 min
again, the alcohol was carefully discarded, dried in the air for 10
min and added to the appropriate amount of DEPC (D100T) to dissolve
the RNA. An ultraviolet spectrophotometer was used to measure the
RNA concentration and the OD numerical value. The RNA purity was
good if the OD260/280 numerical value was between 1.8 and 2.0.
Reverse transcription was performed according to the manufacturer’s
instructions.
Statistical analysis
The cell survival rate, cell purity and the ratio of
albumin to grey scale of cell culture supernatant are expressed as
the means ± standard deviation (SD) and were compared between the
two groups. Student’s t-test was used to compare the difference
between the patients’ characteristics. SPSS software version 17.0
(SPSS, Inc., Chicago, IL, USA) was used. P<0.05 was considered
to indicate a statistically significant difference.
Results
Liver cell morphology
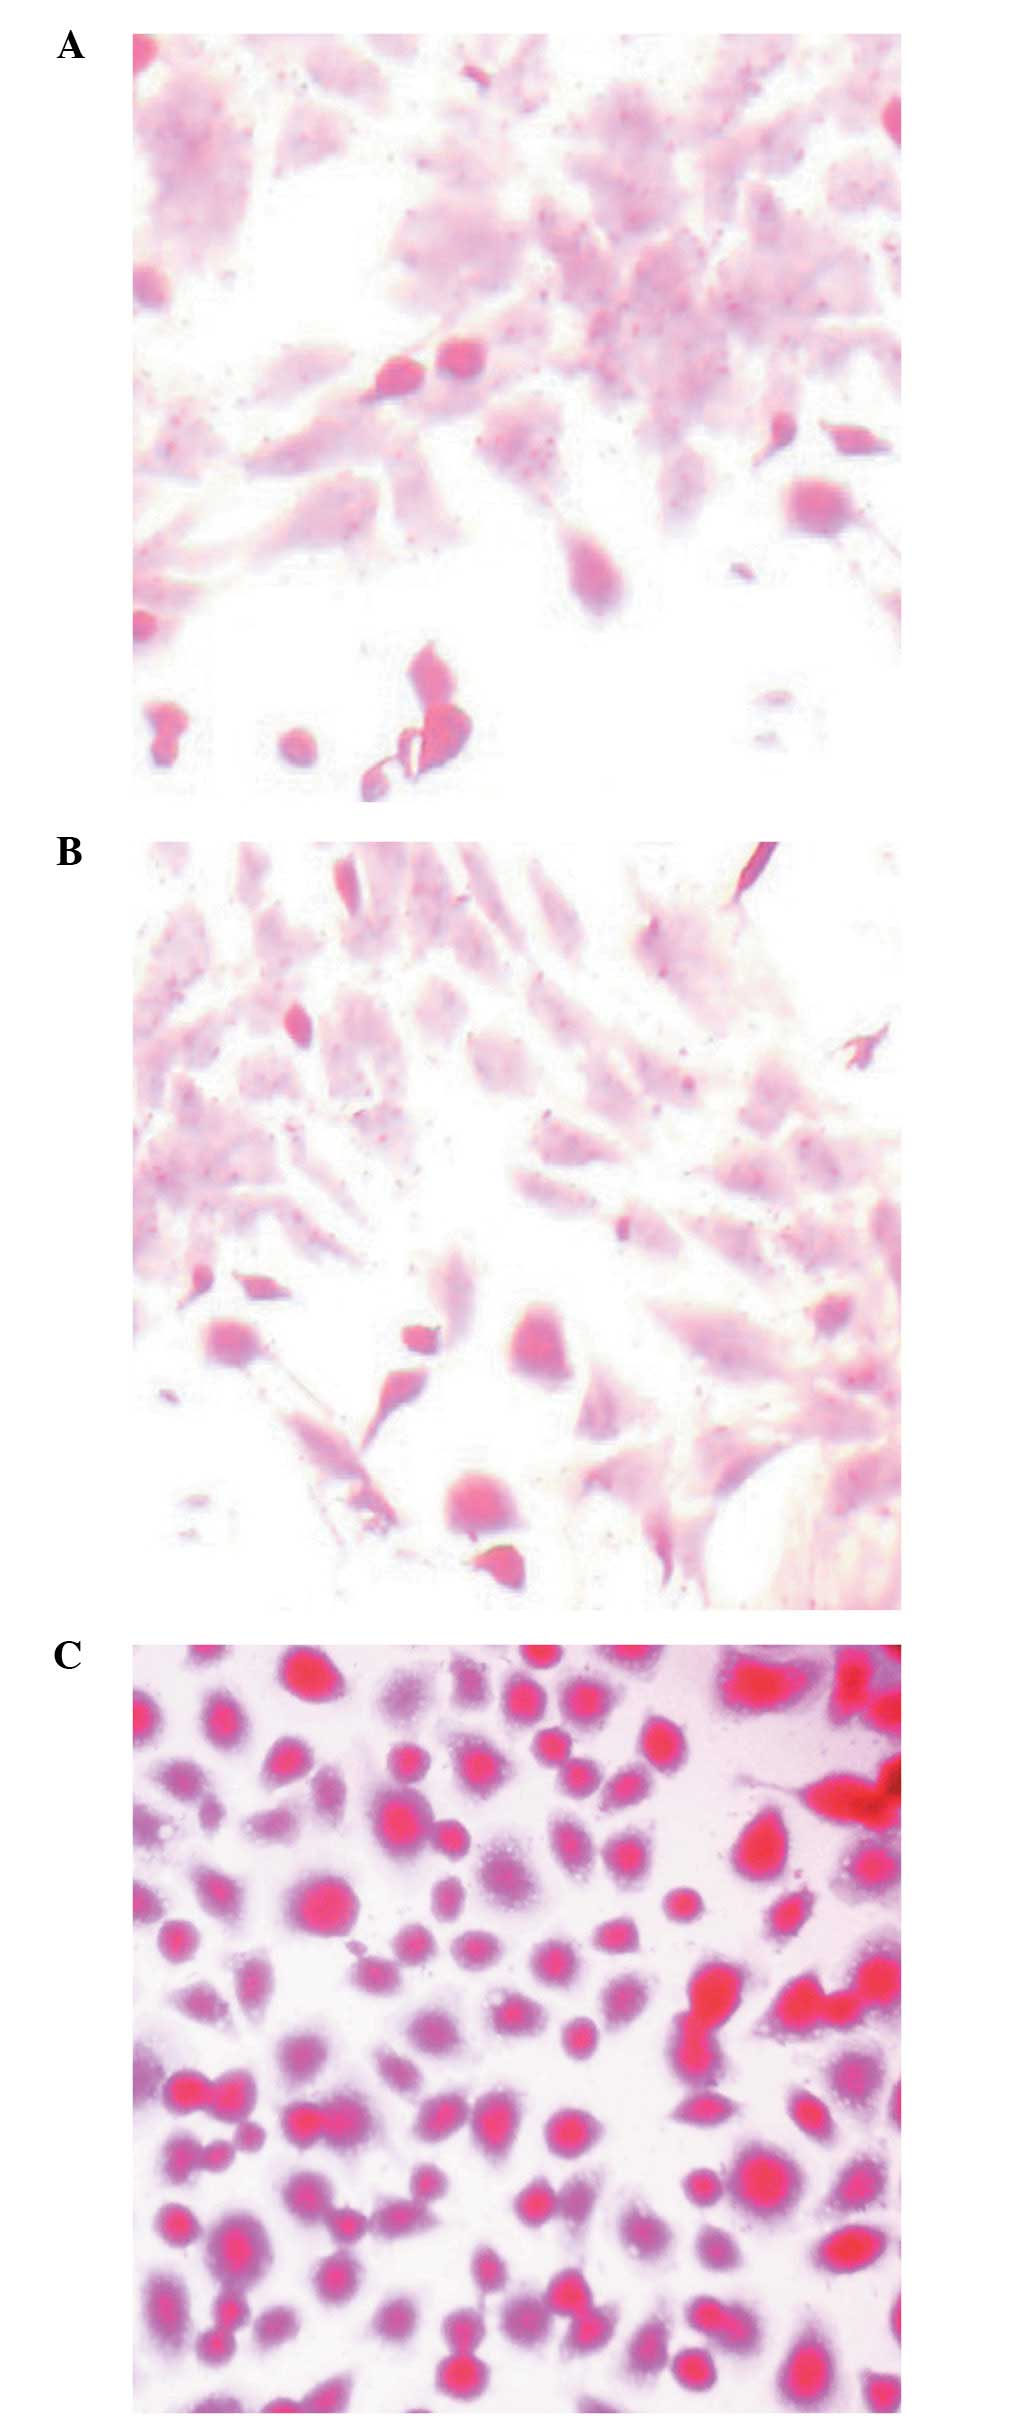
The liver cell morphology was observed using an
inverted microscope when the liver cells were colored by the
conventional PAS staining method (Fig.
1). The cell purity and survival rate was observed using an
inverted microscope and the albumin level of cell supernatant is
listed in Table II.
| Table IIComparision of cell purity, survival
rates and supernatant albumin levels of normal liver tissue in
three cultivation methods with differing serum concentrations. |
Table II
Comparision of cell purity, survival
rates and supernatant albumin levels of normal liver tissue in
three cultivation methods with differing serum concentrations.
| Culture methods | Cell parameters of
different culture methods | Serum
concentrations |
|---|
|
|---|
| 10% | 15% | 20% |
|---|
| Pancreatic enzyme
digestion | Survival rates
(%) | 47.75±0.67 | 56.80±1.63a,b | 46.42±1.40 |
| Cell purity (%) | 58.08±0.94 | 58.96±0.75 | 58.48±0.61 |
| Supernatant albumin
levels (g/l) | 0.95±0.07 | 3.1±0.13a,b | 2.4±0.08 |
| Liver cell
grinding | Survival rates
(%) | 64.68±1.05 | 71.82±0.77a,b | 66.62±0.72 |
| Cell purity (%) | 79.20±0.35 | 80.20±0.60 | 80.16±1.27 |
| Supernatant albumin
levels (g/l) | 1.35±0.05 | 3.86±0.08a,b | 2.8±0.08 |
| Tissue block
adherent | Survival rates
(%) | 79.66±0.74 | 90.16±0.88a,b | 83.08±0.65 |
| Cell purity (%) | 86.34±0.78 | 86.68±0.73 | 87.50±0.46 |
| Supernatant albumin
levels (g/l) | 2.20±0.06 | 4.21±0.04a,b | 3.86±0.08 |
Pancreatic enzyme digestion method
There were a small amount of cells, which adhered to
the wall of the tube the next day and the majority of the adherent
cells were epithelial cells. The growth conditions of the cells
were better in the medium with a serum concentration of 15% than
different serum concentrations. However, there were small amounts
of liver cells and a large number of fibroblasts and mesenchymal
cells in the culture plate, and the number of cells failed to meet
the requirement of the experiment (Fig. 2A1–A3).
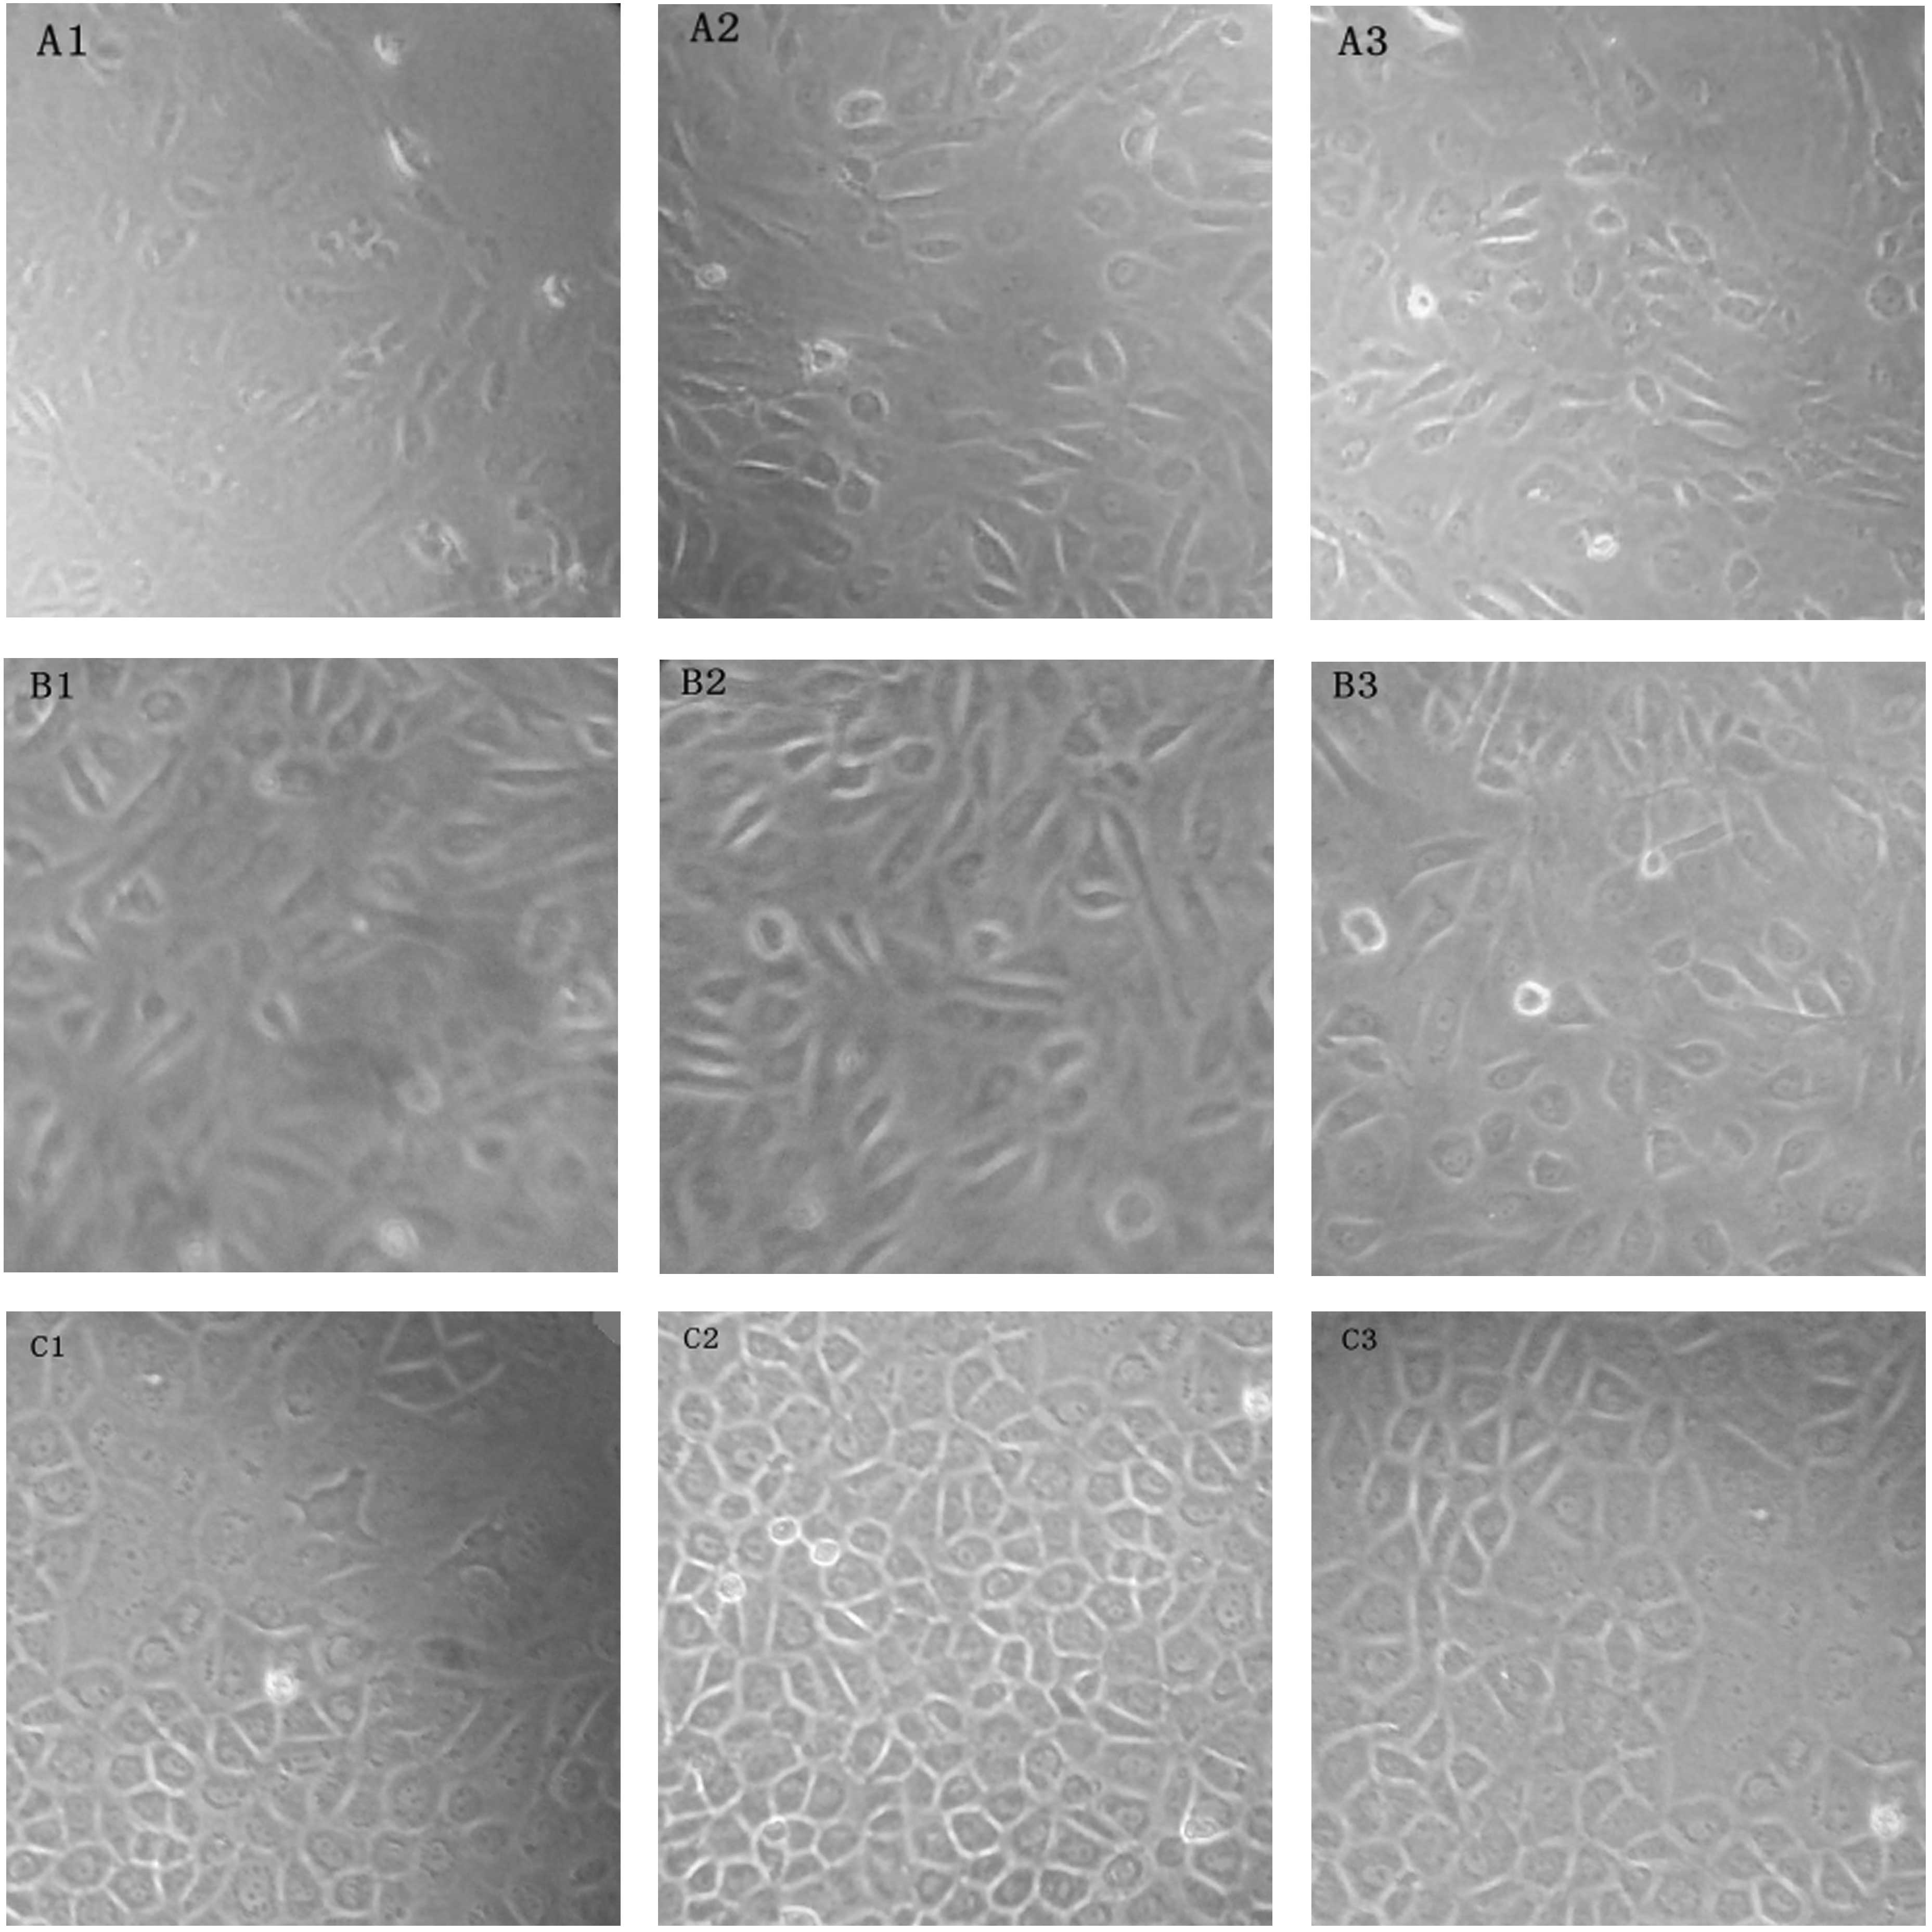 | Figure 2Observed groups of normal liver tissue
cell culture cell morphology. (A1–A3) Pancreatic enzyme digestion
method, serum concentrations of (A1) 10, (A2) 15 and (A3) 20% of
cells (magnification, ×100), respectively. (B1–B3) Liver cell
grinding method, serum concentrations of (B1) 10, (B2) 15 and (B3)
20% of cells (magnification, ×100), respectively. (C1–C3)
Organization block adherent method, serum concentrations of (C1)
10, (C2) 15 and (C3) 20% of cells (magnification, ×100),
respectively. |
Liver cell grinding method
Following cell culture, numerous cell fractions were
identified in the culture plate and there were more adherent cells.
There was a small amount of cells which had adhered to the wall the
next day, however, the majority of them were epithelial cells. The
growth conditions of the cells were better in the medium with a
serum concentration of 15% compared with the other serum
concentrations. However, the cells grew slowly and the total number
of cells failed to meet the requirements of the experiment
(Fig. 2B1–B3).
Tissue block adherent method
Following 3 days, there was outgrowth which
surrounded the tissue block. Cell growth gradually spread from the
tissue block to the surrounding area. Under the light microscope,
the liver cell shape appeared trianglular, round or quasicircular.
The cells were arranged in neat rows and their boundaries were
clear and rich in cytoplasm. The nucleus was clearly visible.
Certain cells were mononuclear and the others were dinuclear, in a
circular or elliptical shape. Following generation, a large
quantity of liver cells with high purity and good activity were
produced (Fig. 2C1–C3).
By comparing the results, it was found that the cell
survival rate and cell purity were the highest when the tissue
block adherent method was used, and the most suitable serum
concentration was 15% (Table
II).
The normal liver tissues from 5 cases of hemangiomas
were separately cultured by use of the three serum concentrations
and the three types of cell culture methods. The albumin level in
the liquid supernatant was determined prior to changing the liquid
supernatant. The results of the albumin levels are listed in
Table II.
The results of a comparison of cell purity, survival
rates and supernatant albumin levels in normal liver tissues of 5
cases of patients with hepatic hemangioma with three different
cultivation methods at a serum concentration of 15% are shown in
Table III.
| Table IIIComparison of the cell survival rate,
purity and albumin supernatant fluid in three different cultivation
methods. |
Table III
Comparison of the cell survival rate,
purity and albumin supernatant fluid in three different cultivation
methods.
| Methods | Survival rates
(%) | Cell purity (%) | Supernatant albumin
levels (g/l) |
|---|
| Pancreatic enzyme
digestion | 56.80±1.63 | 58.96±0.75 | 3.1±0.13 |
| Liver cell
grinding | 71.82±0.77 | 80.20±0.60 | 3.86±0.08 |
| Tissue block
adherent | 90.16±0.88a,b | 86.68±0.73 | 4.21±0.04a,b |
By comparison, it was revealed that the tissue
adherent method with a serum concentration of 15% was the optimal
method for liver cell culture. With reference to the optimal
culture method of normal liver tissue (tissue block adherent
method), the present study further determined urokinase receptor
isoform exons D1D2 in liver cancer cells and adjacent cells in 30
cases of HCC by cell culture.
The concentration and purity of RNA extracted from
cells was determined by an ultraviolet spectrophotometer. The
A260/280 results were between 1.8 and 2.0, which suggested that the
RNA had a high purity. Thus, the RNA conformed to the requirements
of the reverse transcription and −80°C preservation.
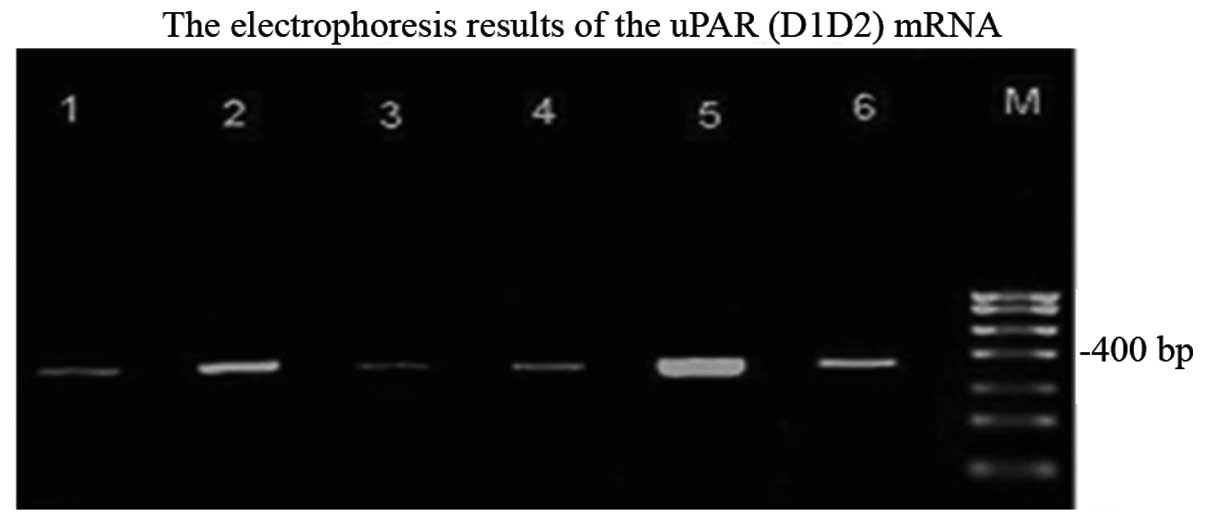
The expression of uPAR (D1D2) mRNA of liver cancer
cells, para-carcinoma cells and normal cells are shown in Fig. 3. From electrophoresis, it was
apparent that uPAR (D1D2) was expressed in cancer cells,
para-carcinoma cells and normal cells due to the appearance of a
well-distributed band of ~400 bp. The brightness of the band from
the normal cells, para-carcinoma cells and cancer cells markedly
increased.
The Image J software was used to analyze each sample
and the corresponding reference grey value respectively, and to
calculate the grey level ratio of each sample (Table IV).
| Table IVExpression of uPAR (D1D2) in three
groups. |
Table IV
Expression of uPAR (D1D2) in three
groups.
| Group | n | Grey value ratio |
|---|
| Cancer cell | 28 | 0.845±0.291a |
| Para-carcinoma
cell | 28 | 0.525±0.244a |
| Control group | 10 | 0.293±0.035a |
Relationship between of the expression of
uPAR (D1D2) in HCC and the clinical pathological features
There was no association between the expression of
uPAR (D1D2) in HCC, α-fetoprotein (AFP), serum ferritin (SF),
pathological grade and tumor size (P>0.05). However, it was
associated with the DNA copy number (P<0.05; Table V)
| Table VRelationship between the expression of
uPAR (D1D2) in HCC and clinical pathological features. |
Table V
Relationship between the expression of
uPAR (D1D2) in HCC and clinical pathological features.
| Pathological
features | n | uPAR (D1D2) grey
value ratio |
|---|
| AFP (μg/ml) |
| >400 | 13 | 0.935±0.305 |
| <400 | 15 | 0.773±0.265 |
| SF (μg/l) |
| >400 | 11 | 0.859±0.385 |
| <400 | 17 | 0.842±0.223 |
| DNA copy
number |
|
<1.0×10³ | 8 | 0.692±0.105 |
|
>1.0×10³ | 20 | 0.911±0.318a |
| Pathological
grading |
| 1 | 6 | 0.705±0.169 |
| 2+3 | 22 | 0.887±0.307 |
| Tumor size
(cm) |
| <5 | 14 | 0.843±0.223 |
| >5 | 14 | 0.854±0.354 |
Discussion
Due to ethical issues, numerous human trials are not
able to be performed. For this reason, as a research method in
vitro, primary cell culture method has been widely used owing
to its characteristic of maintaining human physiological functions
in a certain period of time and obtaining stable metabolic product
in a short period of time. Thus, obtaining cells with a high
purity, high productivity and high activity is particularly
important. At present, although there are several liver cell
primary culture methods, certain experiments are not able to be
performed in certain laboratories. In order to select a highly
efficient, simple and economical liver cell primary culture method
from normal liver tissue, cells were cultivated by the pancreatic
enzyme digestion method, liver cell grinding method and
organization block adherent method, respectively. The advantages
and disadvantages of these three methods were evaluated by
comparing the cell survival rate, purity and albumin supernatant
fluid. Following evaluation, the tissue block adherent method with
a 15% serum concentration was found to be the best liver cell
culture method. This method is simple, efficient and economical. In
addition, it obtains a high purity and high activity of liver
parenchyma cells and provides sufficient stable samples for the
follow-up study.
As an important component of the urokinase system,
uPAR is able to combine with uPA on the surface of the cell,
mediate signal transduction in cells and activate the intracellular
protein kinase, and is important in the process of tumor growth and
metastasis (7). mRNA splicing
variants are one of the common features of malignant disease.
However, it is not clear what causes tumor cell malignant
transformation, by-products of cell transformation due to the tumor
cells dysfunction or the increase of splicing variants themselves
(8,9). However, more and more evidence
suggests that the mRNA associated with tumorigenesis may lead to
cancer cells producing proteins with special functions, which is
closely associated with the occurrence of cancer development.
Splicing mutations may lead to the absence of certain regions of
proteins, which in turn leads to a loss of function or a gain of
function (10). A previous study
demonstrated that more than half of human splicing variants of G
protein coupled receptors code for functional proteins and the loss
or increase of extracellular regions may be involved in protein
interactions (11). A previous
study reported that uPAR has numerous splice variants including
uPAR del4/5, which lack exons 4 and 5 and mediates tumor-relevant
biological processes in vivo and in vitro (12). In our previous experiments
(13), following determining the
serum content of uPA and uPAR in healthy individuals and liver
cirrhosis and liver cancer patients by ELISA, we found that the
expression levels of uPAR are closely associated with liver cancer
development. uPAR splicing variant products were not determined in
the experiments. The present study demonstrated that the expression
of uPAR (D1D2) in hepatocellular carcinoma patients is
significantly higher than in the control group, and is also higher
in cancer tissue compared with para-carcinoma tissue. These results
are consistent with the theory that the splicing variants of uPAR
are increasingly expressed in other tumors. This suggests that D1D2
of uPAR is increasingly expressed during the development of liver
cancer. There was no association between the expression D1D2 of
uPAR in HCC and AFP, SF, pathological grading and tumor size
(P>0.05), however, there was an association with the copy number
of HBV DNA. The copy number of HBV DNA is used to distinguish the
patients HBV replication level (14). In addition, chronic persistent
infection of the virus increases the probability of integration of
HBV DNA into liver cells. The continuous replication of HBV may
activate certain proto-oncogenes and inactivate or mutate
tumor-suppressor genes at the same time, promoting the occurrence
of cancer. The integration of virus DNA is able to increase the HBV
X antigen, inducing liver cell malignant transformation (15). By contrast, there are several
splicing variants of uPAR and the conformational change of the uPAR
isoform may lead to abnormal signaling transduction of uPAR (D1D2).
The abnormal signal transduction of integrinα5β1 activates the
activity of a series of downstream enzymes and activates the cell
and the signaling molecules of the cell nucleus inside and outside,
making liver cell differentiation to variation clonal hyperplasia,
eventually leading to liver cancer. Mazzieri and Blasi (16) reported that the urokinase receptor
is a multifunctional receptor, which regulates the dependence and
independence process of proteins. Urokinase receptors, including
integrin and epidermal growth factor receptor combines with
extracellular protease urokinase, joining the lateral interactions
of transmembrane receptors. Start the cascade effect of protein at
the same time on the extracellular matrix components, the activated
receptors of adjusting the important signal transduction are not
only involved in the interaction of the modulation of the
extracellular matrix, but also control extracellular signaling in
order to determine cell proliferation.
In conclusion, although several studies regarding
the association between varous splicing variants of uPAR and
several types of diseases (17,18)
have been reported, studies concerning the association of uPAR
(D1D2) with liver cancer have not yet been reported in the
literature. The present study demonstrated that the expression of
the urokinase receptor isoform exons uPAR (D1D2) increases from
normal liver cells, liver cells to para-carcinoma cells. Therefore,
the present study inferred that the splicing variation of uPAR
(D1D2) is possibly associated with the incidence and development of
liver cancer.
Acknowledgements
We would like to to express our heartfelt thanks to
Professor Yuanjiao Huang of the Experiment Center of Guangxi
Medical University for assistance with our study.
References
|
1
|
Mondino A and Blasi F: uPA and uPAR in
fibrinolysis, immunity and pathology. Trends Immunol. 25:450–455.
2004. View Article : Google Scholar : PubMed/NCBI
|
|
2
|
Blasi F and Carmeliet P: uPAR: a versatile
signalling orchestrator. Nat Rev Mol Cell Biol. 3:932–943. 2002.
View Article : Google Scholar : PubMed/NCBI
|
|
3
|
Piironen T, Laursen B, Pass J, et al:
Specific immunoassays for detection of intact and cleaved forms of
the urokinase receptor. Clin Chem. 50:2059–2068. 2004. View Article : Google Scholar : PubMed/NCBI
|
|
4
|
Behrendt N, Ploug M, Patthy L, et al: The
ligand-binding domain of the cell surface receptor for
urokinase-type plasminogen activator. J Biol Chem. 266:7842–7847.
1991.PubMed/NCBI
|
|
5
|
Behrendt N, Ronne E and Dano K: Domain
interplay in the urokinase receptor. Requirement for the third
domain in high affinity ligand binding and demonstration of ligand
contact sites in distinct receptor domains. J Biol Chem.
271:22885–22894. 1996. View Article : Google Scholar
|
|
6
|
Stewart CE and Sayers I: Characterisation
of urokinase plasminogen activator receptor variants in human
airway and peripheral cells. BMC Mol Biol. 10:752009. View Article : Google Scholar : PubMed/NCBI
|
|
7
|
Andreasen PA, Kjøller L, Christensen L, et
al: The urokinase-type plasminogen activator system in cancer
metastasis: a review. Int J Cancer. 72:1–22. 1997. View Article : Google Scholar : PubMed/NCBI
|
|
8
|
Guo Z, Yang X, Sun F, et al: A novel
androgen receptor splice variant is up-regulated during prostate
cancer progression and promotes androgen depletion-resistant
growth. Cancer Res. 69:2305–2313. 2009. View Article : Google Scholar : PubMed/NCBI
|
|
9
|
Fackenthal JD and Godley LA: Aberrant RNA
splicing and its functional consequences in cancer cells. Dis Model
Mech. 1:37–42. 2008. View Article : Google Scholar : PubMed/NCBI
|
|
10
|
Keren H, Lev-Maor G and Ast G: Alternative
splicing and evolution: diversification, exon definition and
function. Nat Rev Genet. 11:345–355. 2010. View Article : Google Scholar : PubMed/NCBI
|
|
11
|
Bjarnadóttir TK, Geirardsdóttir K,
Ingemansson M, et al: Identification of novel splice variants of
Adhesion G protein-coupled receptors. Gene. 387:38–48.
2007.PubMed/NCBI
|
|
12
|
Sato S, Kopitz C, Grismayer B, et al:
Overexpression of the urokinase receptor mRNA splice variant
uPAR-del4/5 affects tumor-associated processes of breast cancer
cells in vitro and in vivo. Breast Cancer Res Treat. 127:649–657.
2011. View Article : Google Scholar : PubMed/NCBI
|
|
13
|
Zhan L, Lv X, Li S, Jiang H, Zuo J and
Tang J: The correlation of liver cirrhosis plasma, uPA, uPAR level
between liver fibrosis and carcinogenesis. J Clin Lab Sci.
26:144–145. 2008.(In Chinese).
|
|
14
|
Chu CJ, Hussain M and Lok AS: Quantitative
serum HBV DNA levels during different stages of chronic hepatitis B
infection. Hepatology. 36:1408–1415. 2002. View Article : Google Scholar : PubMed/NCBI
|
|
15
|
Su Q, Schröder CH, Hofmann WJ, et al:
Expression of hepatitis B virus X protein in HBV-infected human
livers and hepatocellular carcinomas. Hepatology. 27:1109–1120.
1998. View Article : Google Scholar : PubMed/NCBI
|
|
16
|
Mazzieri R and Blasi F: The urokinase
receptor and the regulation of cell proliferation. Thromb Haemost.
93:641–646. 2005.PubMed/NCBI
|
|
17
|
Luther T, Kotzsch M, Meye A, et al:
Identification of a novel urokinase receptor splice variant and its
prognostic relevance in breast cancer. Thromb Haemost. 89:705–717.
2003.PubMed/NCBI
|
|
18
|
Thurison T, Lomholt AF, Rasch MG, et al: A
new assay for measurement of the liberated domain I of the
urokinase receptor in plasma improves the prediction of survival in
colorectal cancer. Clin Chem. 56:1636–1640. 2010. View Article : Google Scholar : PubMed/NCBI
|