Introduction
Serum albumins are the most prevalent soluble
proteins found in vertebrates, and human serum albumin (HSA) is the
predominant protein found in the plasma (1). HSA binds to a wide variety of
substances, including metals, fatty acids, amino acids and
hormones. The complexes formed between HSA and the ligands are
involved in transport and regulatory processes (2). HSA consists of 585 amino acid
residues and contains a single tryptophan (Trp) residue, Trp-214,
that invariably appears in the hydrophobic cavity of subdomain IIA
(3).
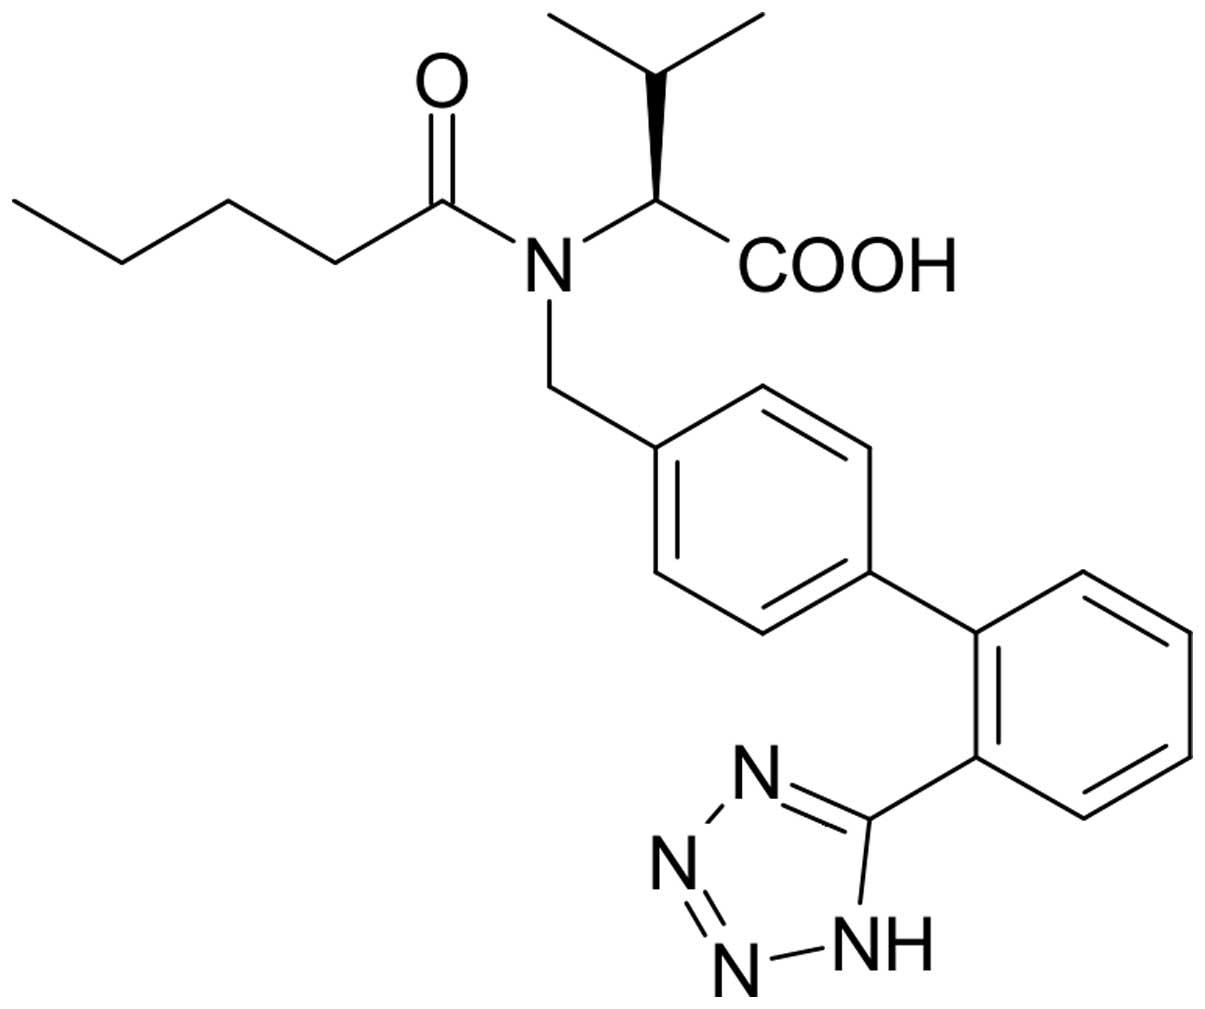
Valsartan, which has the chemical formula
(S)-N-oxopentyl-N-{[2-(1H-5-tetrazolyl)-4-di-phenyl]methyl}-valine,
is an orally potent specific non-peptide angiotensin II-receptor
antagonist (Fig. 1). Valsartan has
been shown to relax vascular smooth muscle, increase salt
excretion, inhibit cell hypertrophy and lower blood pressure
without changing the heart rate (4). As an anti-hypertension drug, the use
of valsartan is effective against mild or moderate primary
hypertension, particularly for kidney damage-induced secondary
hypertension.
The interaction between a drug and plasma protein
residues is capable of influencing the protein structure and
function. Therefore, understanding the pharmacodynamics and
pharmacokinetics of valsartan is of crucial importance.
Investigations of this nature are likely to provide information
about the structural features of valsartan that determine the
therapeutic efficacy of the drug; such investigations may,
therefore, become an important research field in chemistry, life
sciences and clinical medicine. Several previous studies on
fluorescence quenching and the mechanism of interaction between
other drugs or bioactive small molecules and albumin have been
reported (5–7). The knowledge gained from these
studies has also been useful for the design of novel therapeutic
agents (8). In the present study,
the detailed mechanism underlying the interaction of valsartan with
HSA was investigated using different spectroscopic techniques.
Materials and methods
Reagents and apparatus
HSA (fatty acid-free) was obtained from Sigma (St.
Louis, MO, USA). The HSA solutions were prepared in 0.1 mol/l
phosphate buffer (pH 7.4) containing 0.15 mol/l NaCl. HSA solutions
were prepared based on the molecular weight of HSA (66,000 Da).
Valsartan was obtained from Novartis (Copenhagen, Denmark). All
other materials employed were of analytical grade, and Millipore
water (EMD Millipore Corp., Billerica, MA, USA) was used
throughout.
Fluorescence measurements were performed on a
FluoroMax®-4 spectrofluorimeter (Horiba, Les Ulis,
France) equipped with a 150 W xenon lamp and a slit width of 5 nm.
The circular dichroism (CD) measurements were made on a Jasco-J715
spectropolarimeter (Jasco, Tokyo, Japan) using a 0.1-cm cell at
0.2-nm intervals, with three scans for each CD spectrum between 200
and 260 nm. The absorption spectra were recorded on a double-beam
GBC Cintra-10e UV-Visible Spectrophotometer (Varian Medical
Systems, Sydney, Australia) equipped with a 150 W xenon lamp and a
slit width of 5 nm.
Analysis of valsartan-HSA
interaction
On the basis of preliminary experiments,
fluorescence spectra were recorded between 300 and 500 nm, and 280
and 500 nm for HSA, respectively. The concentration of HSA was
maintained at 1.0×10⁻⁶ mol/l and the concentration of
valsartan varied between 1.0 and 10.0×10⁻⁶ mol/l.
Ultraviolet-visible (UV-vis) absorption
studies
The absorption spectra of HSA in the presence and
absence of valsartan were recorded between 200 and 230 nm. The
concentration of HSA was maintained at 1.0×10⁻⁶ mol/l
and the concentration of valsartan varied between 1.0 and
10.0×10⁻⁶ mol/l.
Synchronous fluorescence
measurements
The fluorescence studies were performed on a
FluoroMax®-4 spectrofluorimeter (Horiba). The spectra
were recorded between 280 and 350 nm. The synchronous fluorescence
spectra were recorded with scanning ranges Δλ=15 nm and 60 nm
(Δλ=λem−λex, with λem representing the wavelength of the
fluorescence emission spectra, and λex referring to excitation
wavelength) in the presence and absence of valsartan, to determine
the spectrum characteristics of the protein residues.
Energy transfer between valsartan and
HSA
The absorption spectrum of valsartan
(1.0×10⁻⁶ mol/l) was recorded between 300 and 550 nm and
the emission spectrum of HSA (1.0×10⁻⁶ mol/l) was
recorded between 300 and 500 nm. The overlap of the UV absorption
spectrum of valsartan with the fluorescence emission spectrum of
protein was then used to analyze the energy transfer.
Thermodynamics of valsartan-protein
interactions
The thermodynamic parameters for the binding of
valsartan to HSA were determined using binding studies at two
different temperatures, 303 and 310 K, in the range of 300–500 nm
upon excitation at 296/280 nm using spectrofluorimetry.
Results and Discussion
Fluorescence quenching of HSA in the
presence of valsartan
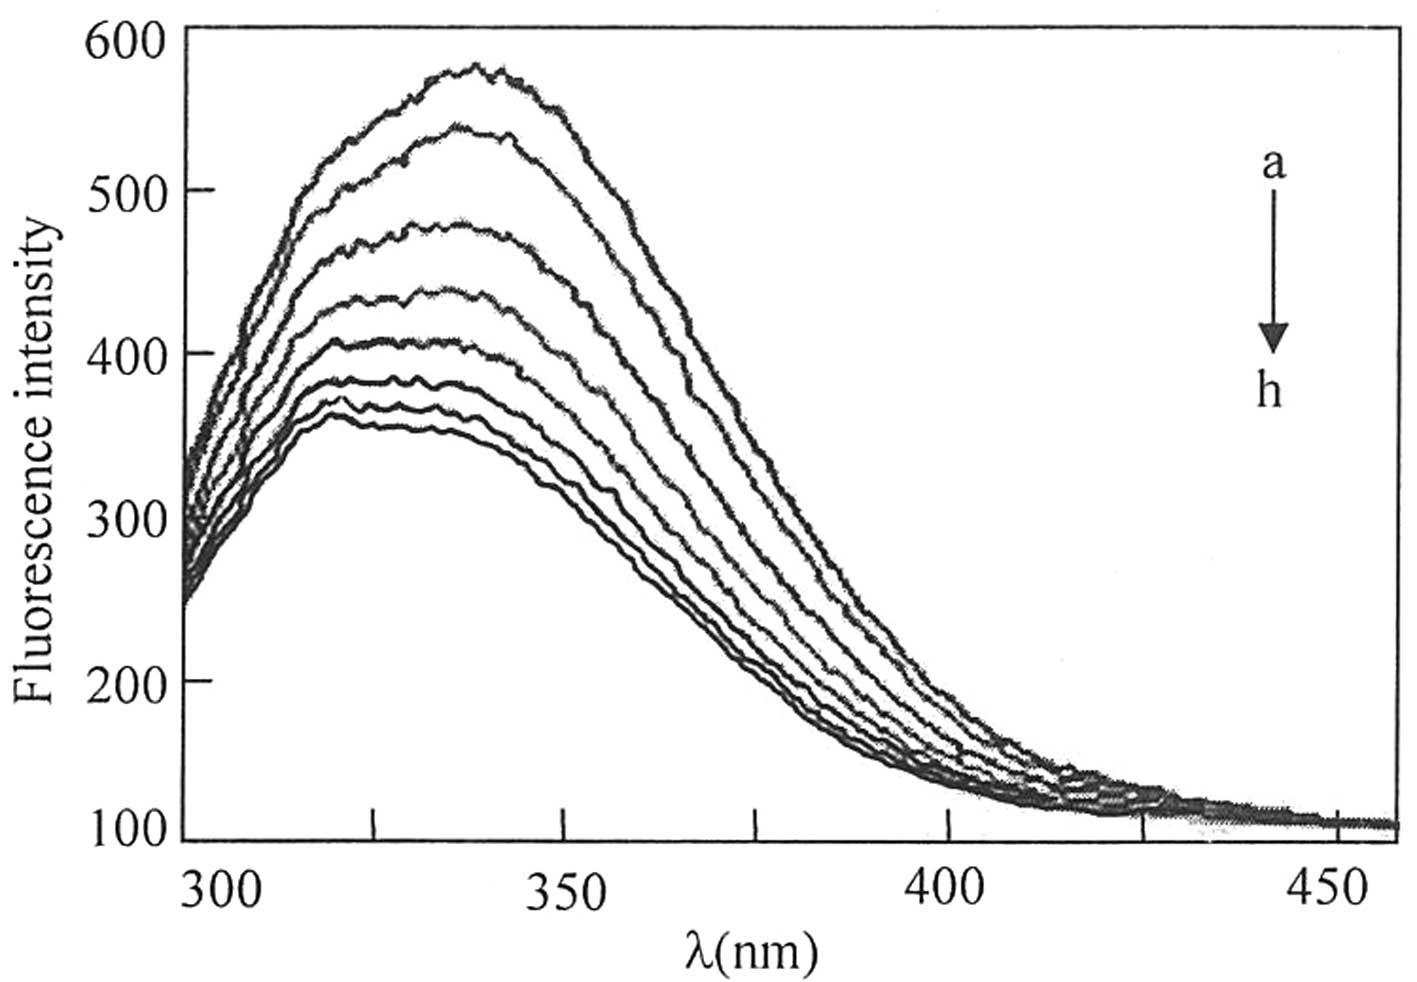
The interaction of valsartan with HSA (pH 7.4) was
analyzed by measuring the change in the intrinsic fluorescence
intensity of HSA following the addition of valsartan (Fig. 2). A total of 10 ml HSA working
solution (2.0 ml buffer solution, 2.0 ml NaCl solution and 1.0 ml
HSA stock solution) was prepared. A total of 2.0 ml working
solution was placed in a 1-cm quartz cell and a micro-injector was
used to add the valsartan solution (1.0×10⁻⁴ mol/l)
gradually. No change in the fluorescence intensity was observed for
the control HSA solution throughout the incubation period; however,
as shown in Fig. 2, the
fluorescence intensity of HSA at 340 nm decreased gradually as the
concentration of valsartan increased. Fluorescence quenching refers
to any process that decreases the fluorescence intensity of a
sample (9) and occurs due to the
interaction between HSA and valsartan. In the present study, a
slight blue shift was observed for the emission wavelength as
valsartan concentration increased. These results indicate that
valsartan interacted with HSA and induce conformational changes in
HSA. Different mechanisms of quenching are usually classified as
either dynamic or static quenching, and they are distinguished by
their differing dependence on temperature and viscosity (10). Dynamic quenching depends upon
diffusion. Since higher temperatures result in larger diffusion
coefficients, the bimolecular quenching constants are expected to
increase with an increase in temperature. By contrast, increased
temperature is likely to result in decreased stability of
complexes, and thus lower values of quenching rate constants are
observed for static quenching (11).
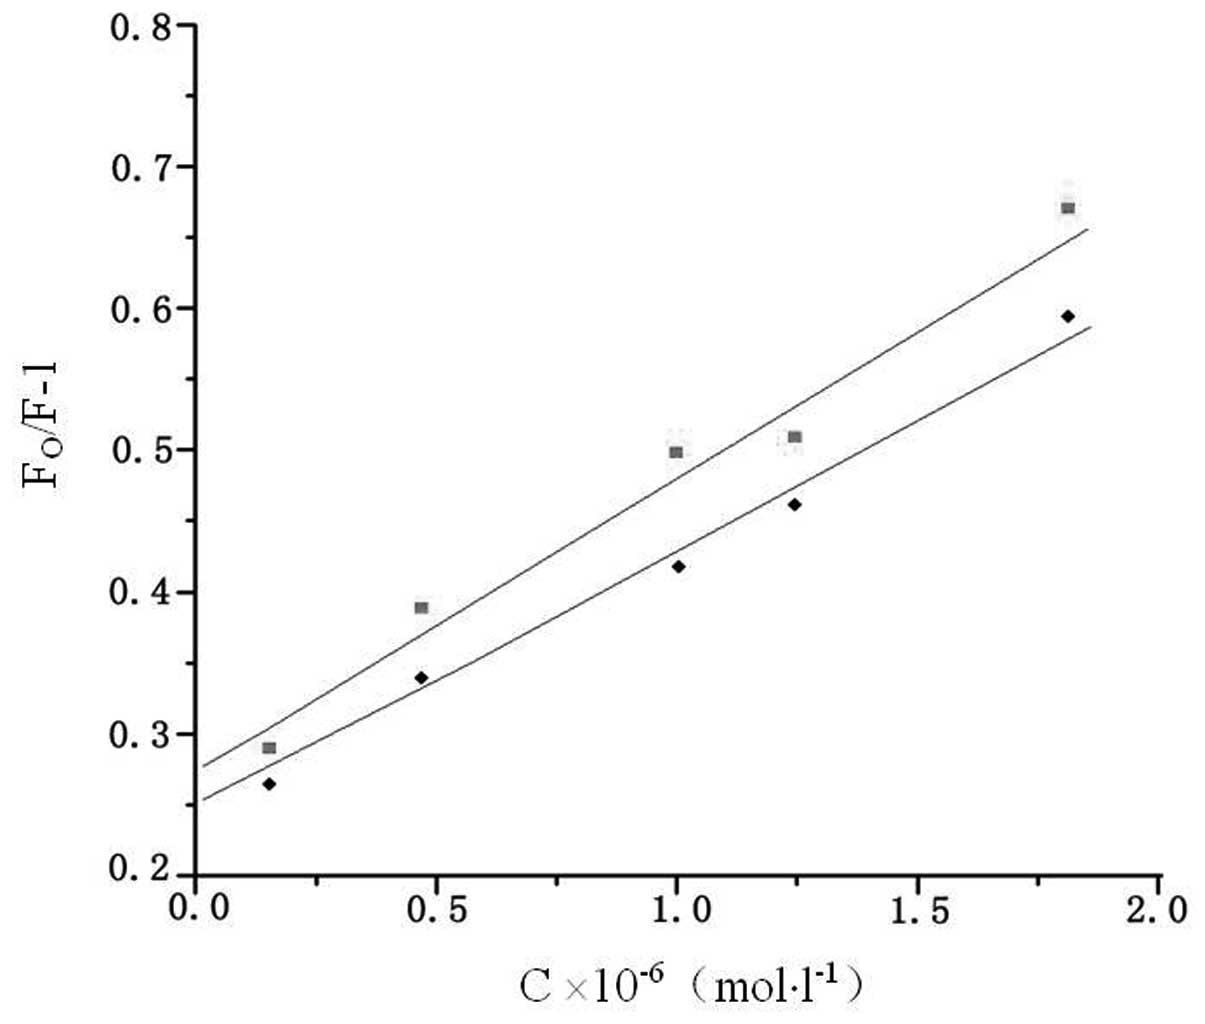
In order to investigate the fluorescence quenching
mechanism, the fluorescence quenching data at different
temperatures (303 and 310 K) were firstly analyzed using the
classical Stern-Volmer equation (12) as follows:
F0/F=1+Ksv[valsartan]=1+kqτ0[valsartan],
where F0 and F denote the fluorescence intensities in
the absence and presence of valsartan, respectively,
Ksv is the Stern-Volmer quenching
constant, kq is the quenching rate
constant of HSA, τ0 is the average
lifetime of the HSA without valsartan (the fluorescence lifetime of
the biopolymer is 10−8 sec) (13), and [valsartan] is the
concentration of valsartan. Fig. 3
shows the Stern-Volmer plots of F0/F versus
[valsartan] at two temperatures, and the calculated
Ksv and kq values
are presented in Table I. The
results demonstrated that the Stern-Volmer quenching constant
Ksv was inversely correlated with the
temperature, and that the values of kq
were considerably larger than the maximum scattering collision
quenching constant (2.0×10¹⁰ l/mol/sec) (14). This indicated that the probable
quenching mechanism of the fluorescence of HSA by valsartan was not
initiated by dynamic collision but by compound formation (15).
 | Table IStern-Volmer quenching constants for
the interaction of valsartan with HSA. |
Table I
Stern-Volmer quenching constants for
the interaction of valsartan with HSA.
| T (K) |
Ksv
(×104 l/mol) |
kq
(×1012 l/mol/sec) | R | SD |
|---|
| 303 | 14 | 14 | 0.9973 | 0.010 |
| 310 | 12 | 12 | 0.9841 | 0.009 |
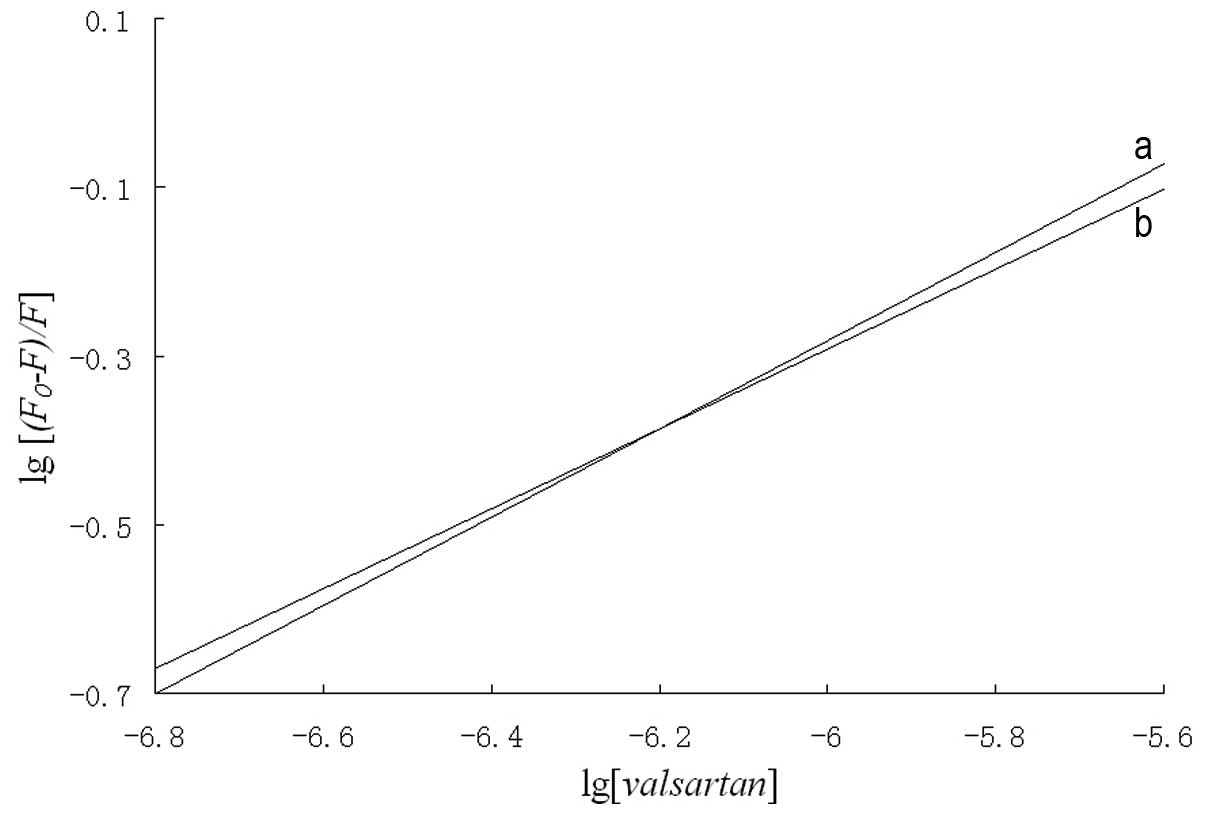
Binding parameters
The binding constant (K) and the number of
binding sites (n) were calculated using the following
equation:
log(F0-F)/F=logK+nlog[valsartan].
A plot of log[(F0-F)/F]
versus log[valsartan] gives a straight line where the
slope is equal to n and the intercept on the y axis is equal
to logK (Fig. 4). The
values of K and n at 303 and 310 K are shown in
Table II. The binding constant
between valsartan and HSA decreased with increasing temperature,
which suggests that an unstable complex exists between valsartan
and HSA due to the static fluorescence quenching mechanism
(16).
| Table IIBinding constants and thermodynamic
parameters of valsartan-human serum albumin interactions. |
Table II
Binding constants and thermodynamic
parameters of valsartan-human serum albumin interactions.
| T (K) | K
(l/mol) | n |
R2 |
ΔH0 (kJ/mol) |
ΔG0 (kJ/mol) |
ΔS0
(J/mol/K) |
|---|
| 303 | 758.9 | 0.52 | 0.9877 | −24.9 | −35.9 | +36.3 |
| 310 | 368.8 | 0.47 | 0.9938 | −24.9 | −36.2 | +36.3 |
UV-Vis absorption
UV-Vis absorption spectra measurement is a simple
method that is used to explore structural changes and complex
formation (17). The absorbance of
HSA increased with the addition of valsartan, whilst the absorption
wavelength remained unchanged. This suggests that the interaction
between valsartan and HSA led to a ground state complex formation
and a change in the microenvironment around HSA.
Determination of the force acting between
valsartan and HSA
Owing to the dependence of the binding constant on
temperature, the thermodynamic parameters dependent on temperature
were analyzed in order to further characterize the acting force in
the valsartan-HSA complex (18).
The acting forces between small molecules and macromolecules
primarily include hydrogen bonds, van der Waals forces, and
electrostatic and hydrophobic interaction forces. The thermodynamic
parameters of enthalpy change (ΔH), entropy change (ΔS) and free
energy change (ΔG) are the main factors used to determine the
binding mode (19). When the
change in temperature is not clear, ΔH is considered a constant. ΔH
and ΔS values were calculated from the van’t Hoff equation and
obtained from a linear van’t Hoff plot, as follows:
lnK=−ΔH/RT+ΔS/R. K is analogous to the
effective quenching constant Ksv and
R is the gas constant. The free energy change (ΔG) was
estimated from the following equation: ΔG= ΔH-TΔS. The results are
shown in Table II. The positive
ΔS arose due to the more random arrangement of water molecules
around HSA and valsartan, which was caused by hydrophobic
interactions between valsartan and HSA. Negative ΔG values revealed
the spontaneity of the binding process. The negative H value (−24.9
kJ/mol) was regarded as very small, almost zero, and so the
interaction was not attributed to electrostatic forces (19). Therefore, from the thermodynamic
characteristics summarized above, the negative ΔH and positive ΔS
values indicate that hydrogen bonds and hydrophobic interaction
have a major role in the valsartan-HSA binding reaction and
contribute to the interaction and stability of the complex. The
structures of serum albumins are particularly complex, so the
interaction forces between valsartan and serum albumins may not be
forces that are frequently observed; however, they may be more
common under certain conditions.
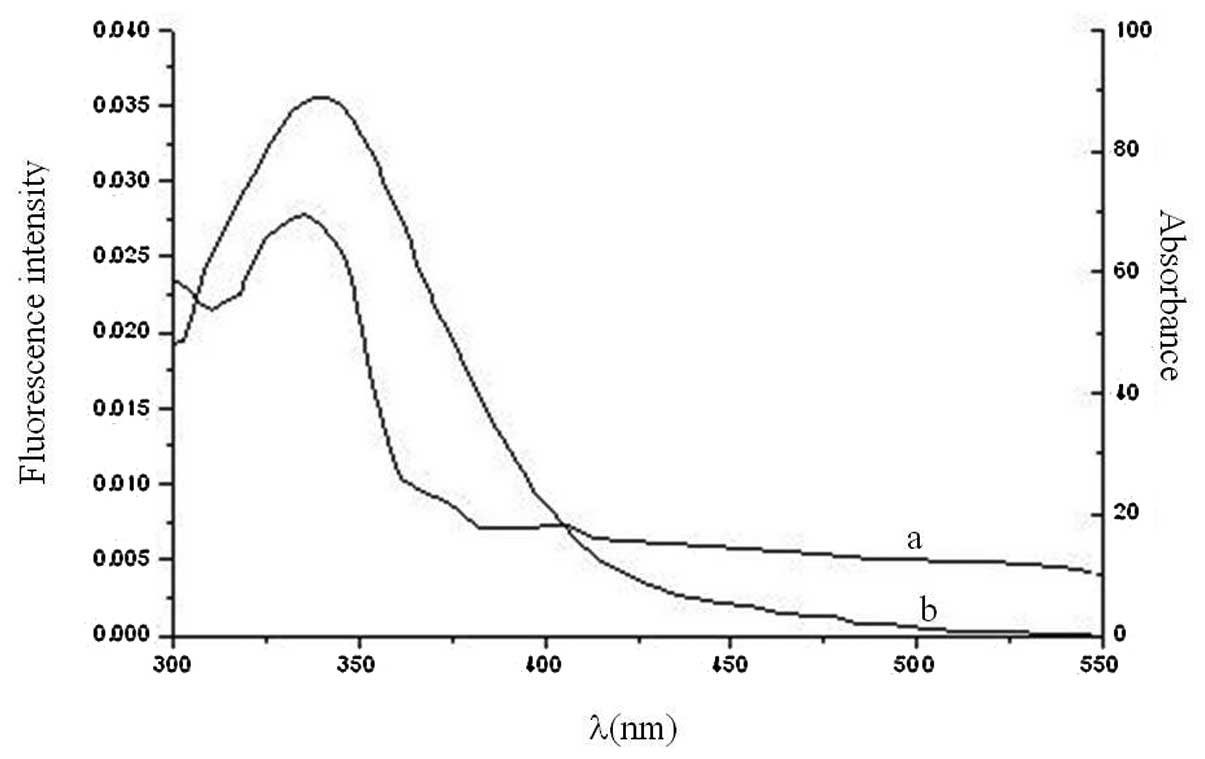
Fluorescence resonance energy transfer
(FRET)
FRET is a nondestructive spectroscopic method that
analyzes the proximity and relative angular orientation of
fluorophores (20). According to
the theory proposed by Förster (21), the efficiency of FRET depends
mainly on the following factors: (i) The extent of overlap between
the donor emission and the acceptor absorption spectrum; (ii) the
orientation of the transition dipole of donor and acceptor and
(iii) the distance between the donor and the acceptor. In the
present study the donor and acceptor were HSA and valsartan,
respectively. The overlap between the absorption spectrum of
valsartan and the fluorescence emission spectrum of HSA is shown in
Fig. 5.
The efficiency of energy transfer between the donor
and acceptor, E, was calculated using the following
equation:
E=1−F/F0=R06/(R06+r6),
where r is the binding distance between donor and acceptor
and R0 is the critical distance at 50%
transfer efficiency. In addition,
R06 may be calculated as
follows:
R06=8.8×10⁻²⁵K2N−4ϕJ,
where K2 is the orientation factor between
the emission dipole of the donor and the absorption dipole of the
acceptor, N is the average refractive index of the medium in
the wavelength range where the spectral overlap is significant,
ϕ is the fluorescence quantum yield of the donor and
J is the overlap integral of the fluorescence emission
spectrum of the donor and the absorption spectrum of the acceptor.
Therefore,
J=∑F(λ)ɛ(λ)λ4Δλ/∑F(λ)Δλ,
where F(λ) is the fluorescence intensity of the donor in the
wavelength range λ to λ+Δλ, and ɛ(λ) is
the extinction coefficient of the acceptor at λ. In present
study, K2=2/3, N=1.336 and
ϕ=0.12 for HAS (22). From
the equations, the values found were J=2.02×10⁻¹⁴
cm3/l/mol, R0=1.792 nm,
E=0.3410 and r=1.994 nm. The donor-to-acceptor
distance, r, was<7 nm (23) and
0.5R0<r<1.5R0
(24), which is in accordance with
Förster’s theory and suggests, with high probability, that
nonradiative energy transfer from HSA to valsartan occurred
(25). These results also indicate
that valsartan strongly quenched the intrinsic fluorescence of HSA
by the static quenching mechanism (26)
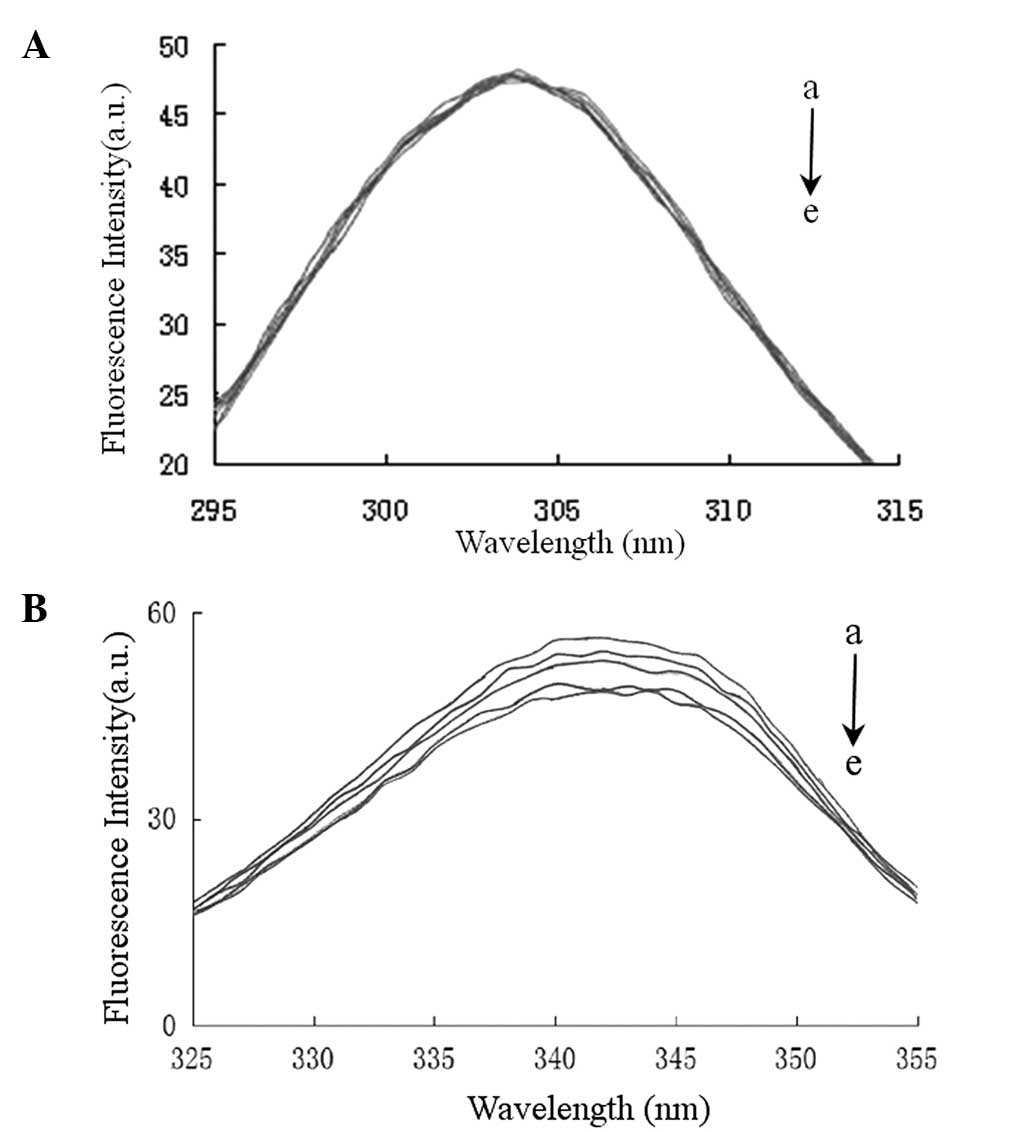
Conformational investigations by the
synchronous fluorescence method
The synchronous fluorescence of HSA was investigated
to evaluate the change in the microenvironments of tyrosine (Tyr)
and Trp residues as a result of valsartan binding. The excitation
and emission monochromators were synchronously scanned, separated
by a constant wavelength interval Δλ(Δλ=λem−λex). When Δλ=15 nm,
the spectrum characteristic of the protein Tyr residues was
observed, and when Δλ=60 nm the spectrum characteristic of protein
Trp residues was observed (27).
The fluorescence emission peaks for aromatic Tyr and Trp residues
are sensitive to the polarity of their environment. Fig. 6 demonstrates the effect of the
addition of valsartan on the synchronous fluorescence spectra of
HSA when Δλ=15 or 60 nm. Fig. 6
shows that the maximum emission wavelength of Tyr and Trp residues
did not change significantly; however, the fluorescence intensity
of Trp decreased, whereas that of Tyr remained almost unchanged.
The results suggested that the binding between valsartan and the
protein did not lead to a change in the polarity of the
microenvironment of the Trp and Tyr residues; however, the internal
packing of the protein changed (28). Furthermore, the results suggested
that valsartan predominantly binds to Trp residues, but this
binding does not appear to induce large structural changes in the
microenvironment around the Trp residues.
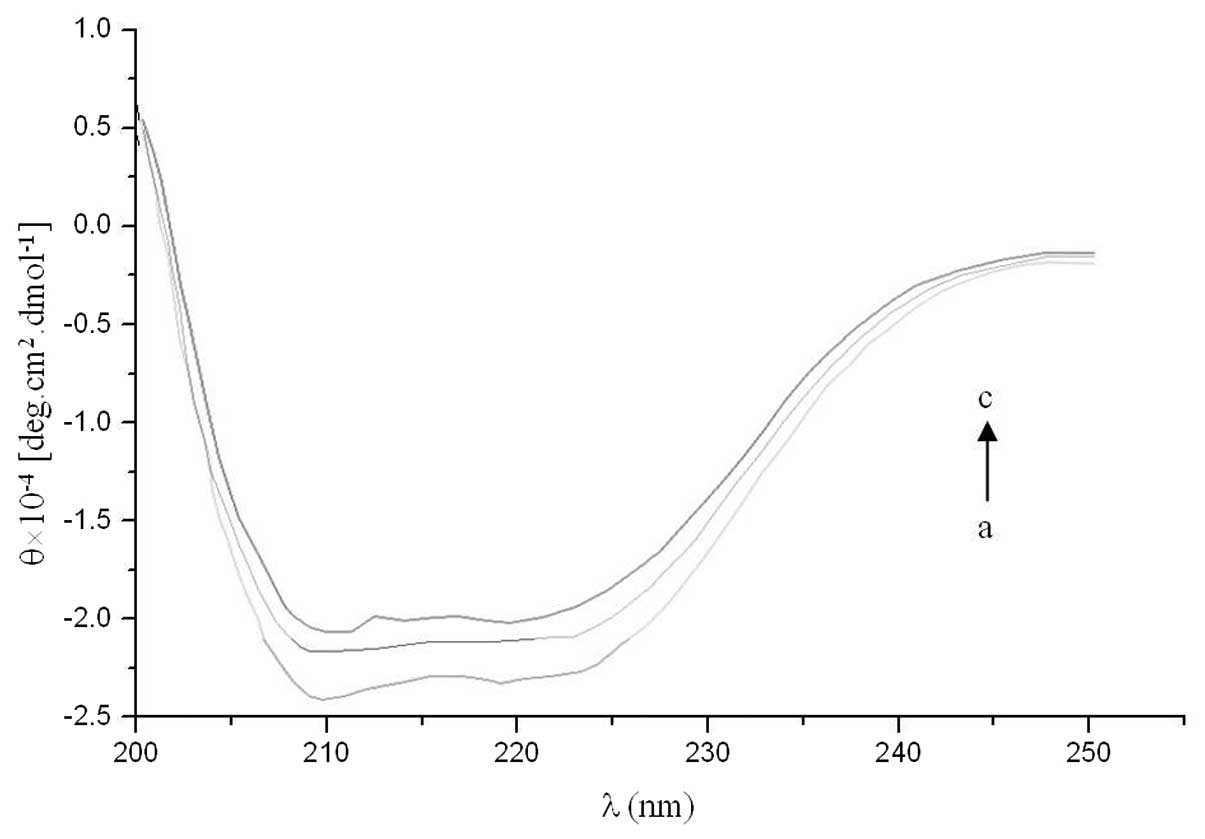
CD spectroscopy studies
The albumin structure is predominantly α-helical.
Approximately 60.78% of HSA is helical and the number of helices in
the structure is 28 (29). CD
spectra were used to analyze the interaction between valsartan and
albumin. The results from the stepwise CD titration of albumin with
increasing amounts of valsartan are shown in Fig. 7. The CD spectra of HSA exhibited
two negative bands in the UV region at 209 and 222 nm,
characteristic of an α-helical protein structure. The binding of
valsartan to HSA distinctly decreased these bands. This indicated
that considerable changes in the protein secondary structure had
occurred, i.e. the decrease in the α-helical content of the
protein, which may have been the result of the formation of a
complex between the protein and valsartan.
In conclusion, HSA is the main constituent of plasma
proteins and is responsible for the binding and transport of
numerous molecules, including valsartan. Drug binding to HSA is a
major problem in pharmaceutical research since the binding to
albumin influences the effective valsartan concentration that can
obtained at the target site. In the present study the interaction
of valsartan with HSA was investigated in vitro using
fluorescence emission, UV-Vis, CD and synchronous fluorescence
spectroscopy. The results from the fluorescence experiments
revealed that the intrinsic fluorescence of HSA was quenched by a
static quenching process. The changes in enthalpy (ΔH) and entropy
(ΔS) for the reaction were found to be −24.9 kJ/mol and 36.3
J/mol/K, suggesting that hydrophobic interactions and hydrogen
bonds were the dominant inter-molecular forces stabilizing the
complex. The distance between valsartan and HSA was sufficiently
close (r=1.994 nm) to induce nonradiative energy transfer
from HSA to valsartan. The results of the synchronous fluorescence
and CD spectra suggest that the protein secondary structure was
altered and the physiological state of HSA was affected by
valsartan. This binding study of valsartan with HSA is of
biological importance and has particular significance for
pharmacology and clinical medicine, as well as methodology.
Acknowledgements
This study was supported by the Fundamental Research
Program of China Universities, Beijing Normal University
(SD2010.1.1). The authors would like to thank Professor J.X. Si, of
the Academy of Medical Sciences, for her assistance during the CD
measurement experiments.
References
|
1
|
Xiao J, Shi J, Cao H, Wu S, Ren F and Xu
M: Analysis of binding interaction between puerarin and bovine
serum albumin by multi-spectroscopic method. J Pharm Biomed Anal.
45:609–615. 2007. View Article : Google Scholar : PubMed/NCBI
|
|
2
|
He W, Li Y, Xue C, Hu Z, Chen X and Sheng
F: Effect of Chinese medicine alpinetin on the structure of human
serum albumin. Bioorg Med Chem. 13:1837–1845. 2005. View Article : Google Scholar : PubMed/NCBI
|
|
3
|
Sułkowska A, Maciazek M, Równicka J, Bojko
B, Pentak D and Sułkowski WW: Effect of temperature on the
methotrexate-BSA interaction: Spectroscopic study. J Mol Struct.
834–836:162–169. 2007.
|
|
4
|
Barakat K, Clark R and Davis M: Valsartan:
Hypertension and Cardiovascular Disease. CSF Medical Communications
Ltd; Witney: 2004
|
|
5
|
Mote US, Bhattar SL, Patil SR and Kolekar
GB: Interaction between felodipine and bovine serum albumin:
fluorescence quenching study. Luminescence. 25:1–8. 2010.PubMed/NCBI
|
|
6
|
Varlan A and Hillebrand M: Bovine and
human serum balbumin interactions with 3-carboxyphenoxathiin
studied by fluorescence and circular dichroism spectroscopy.
Molecules. 15:3905–3919. 2010. View Article : Google Scholar : PubMed/NCBI
|
|
7
|
Neelam S, Gokara M, Sudhamalla B, Amooru
DG and Subramanym RJ: Interaction studies of coumaroyltyramine with
human serum albumin and its biological importance. J Phys Chem B.
114:3005–3012. 2010. View Article : Google Scholar : PubMed/NCBI
|
|
8
|
He WY, Chen HJ, Sheng FL and Yao XJ:
Molecular modeling and spectroscopic studies on binding of
2,6-bis[4-(4-amino-2trifluoromethylphenoxy)benzoyl] pyridine to
human serum albumin. Spectrochim Acta A Mol Biomol Spectrosc.
74:427–433. 2009.PubMed/NCBI
|
|
9
|
Silva D, Cortez CM, Cunha-Bastos J and
Louro SR: Methyl parathion interaction with human and bovine serum
albumin. Toxicol Lett. 147:53–61. 2004. View Article : Google Scholar : PubMed/NCBI
|
|
10
|
Yue Y, Chen X, Qin J and Yao X:
Spectroscopic investigation on the binding of antineoplastic drug
oxaliplatin to human serum albumin and molecular modeling. Colloids
Surf Biointerfaces. 69:51–57. 2009. View Article : Google Scholar : PubMed/NCBI
|
|
11
|
Lemma T and Pawliszyn J: Human serum
albumin interaction with oxaliplatin studied by capillary
isoelectric focusing with the whole column imaging detection and
spectroscopic method. J Pharm Biomed Anal. 50:570–575. 2009.
View Article : Google Scholar
|
|
12
|
Lakowicz JR: Principles of Fluorescence
Spectroscopy. 2nd edition. Kluwer Academic/Plenum; New York, NY:
1999, View Article : Google Scholar
|
|
13
|
Lakowicz JR and Weber G: Quenching of
fluorescence by oxygen. A probe for structural fluctuations in
macromolecules. Biochemistry. 12:4161–4170. 1973. View Article : Google Scholar : PubMed/NCBI
|
|
14
|
Ware WR: Oxygen quenching of fluorescence
in solution: An experimental study of the diffusion process. J Phys
Chem. 66:455–458. 1962. View Article : Google Scholar
|
|
15
|
He Y, Wang Y, Tang L, Liu H, Chen W, Zheng
Z and Zou G: Binding of puerarin to human serum albumin: a
spectroscopic analysis and molecular docking. J Fluoresc.
18:433–442. 2008. View Article : Google Scholar : PubMed/NCBI
|
|
16
|
Sarkar D, Mahata A, Das P, Girigoswami A,
Ghosh D and Chattopadhyay N: Deciphering the perturbation of serum
albumins by a ketocyanine dye: a spectroscopic approach. J
Photochem Photobiol B. 96:136–143. 2009. View Article : Google Scholar : PubMed/NCBI
|
|
17
|
Wang YQ, Tang BP, Zhang HM, Zhou QH and
Zhang GC: Studies on the interaction between imidacloprid and human
serum albumin: spectroscopic approach. J Photochem Photobiol B.
94:183–190. 2009. View Article : Google Scholar : PubMed/NCBI
|
|
18
|
Daneshgar P, Moosavi-Movahedi AA, Norouzi
P, Ganjali MR, Madadkar-Sobhani A and Saboury AA: Molecular
interaction of human serum albumin with paracetamol: spectroscopic
and molecular modeling studies. Int J Biol Macromol. 45:129–134.
2009. View Article : Google Scholar : PubMed/NCBI
|
|
19
|
Ross PD and Subramanian S: Thermodynamics
of protein association reactions: forces contributing to stability.
Biochemistry. 20:3096–3102. 1981. View Article : Google Scholar : PubMed/NCBI
|
|
20
|
Stryer L and Haugland RP: Energy transfer:
a spectroscopic ruler. Proc Natl Acad Sci USA. 58:719–726. 1967.
View Article : Google Scholar : PubMed/NCBI
|
|
21
|
Förster T: Intermolecular energy migration
and fluorescence. Ann Phys. 437:55–75. 1948.(In German).
|
|
22
|
Cyril L, Earl JK and Sperry WM:
Biochemists handbook. E & FN Epon Led Press; London: 1961
|
|
23
|
Valeur B and Brochon JC: New Trends in
Influorescence Spectroscopy. 6th edition. Springer Press; Berlin:
1999
|
|
24
|
Valeur B: Molecular Fluorescence:
Principles and Applications. Wiley Press; New York, NY: 2001,
View Article : Google Scholar
|
|
25
|
Sun Y and Zhang H, Sun Y, Zhang Y, Liu H,
Cheng J, Bi S and Zhang H: Study of interaction between protein and
main active components in Citrus aurantium L. by optical
spectroscopy. J Lumin. 130:270–279. 2010. View Article : Google Scholar
|
|
26
|
Abou-Zied OK and Alshihi OI:
Characterization of subdomain IIA binding site of humanserum
albumin in its native, unfolded, and refolded states using small
molecular probes. J Am Chem Soc. 130:10793–10801. 2008. View Article : Google Scholar : PubMed/NCBI
|
|
27
|
Mandal P and Ganguly T: Fluorescence
spectroscopic characterization of the interaction of human adult
hemoglobin and two isatins, 1-methylisatin and 1-phenylisatin: a
comparative study. J Phys Chem B. 113:14904–14913. 2009. View Article : Google Scholar
|
|
28
|
Grigoryan KR, Aznauryan MG, Bagramyan NA,
Gevorkyan LG and Markaryan SA: Spectroscopic determination of
binding between human serum albumin and a platinum(II)
demethylsulfoxide complex. J Appl Spectrosc. 75:593–596. 2008.
View Article : Google Scholar
|
|
29
|
Carter DC and Ho JX: Structure of serum
albumin. Adv Protein Chem. 45:153–203. 1994. View Article : Google Scholar : PubMed/NCBI
|