Introduction
Radiotherapy is frequently used for the clinical
treatment of lung cancer; however, its effectiveness is often
impaired by radiation resistance (1). Combining gene therapy with
radiotherapy, known as gene-radiotherapy, is a novel method for
cancer treatment, and has attracted particular interest (2,3). At
present, gene-radiotherapy focuses on the radiation-inducible early
growth response 1 (Egr1) promoter. This promoter contains six serum
response elements, CC(A+T-rich)6GG motifs, which are sensitive to
ionizing radiation (4,5). Numerous studies have demonstrated
that, under irradiation, the Egr1 promoter is capable of regulating
the overexpression of downstream genes, including TNF-α, IFN-γ,
endostatin and TRAIL (6–8).
Solid tumor hypoxia occurs when the growth rate of
the tumor cells exceeds that of the tumor blood vessels, resulting
in insufficient tumor blood supply. Hypoxic tumor cells account for
between 10 and 50% of the cells in a solid tumor and cause radio-
and chemotherapy resistance, leading to local tumor recurrence and
distant metastasis (9). Hypoxic
tumor cells have unique biological features that confer
radioresistance and make tumor cells more aggressive. Under
hypoxia, certain protective stress proteins are upregulated in
tumor cells, including hypoxia-inducible factor-1, which
specifically binds to hypoxia response elements (HREs), inducing
the expression of downstream genes. HRE is a hypoxic enhancer with
a core sequence of 5′-(A/G) COT (G/C) (G/C)-3′. Previous studies
have shown that placing the HRE sequence upstream of the AFP, KDR,
CMV and SV40 promoters, to constitute the chimeric promoters,
markedly increases their transcriptional activities under hypoxia
(10–12). Furthermore, placing the HRE
sequence upstream of the Egr1 promoter has been found to enhance
the radiation-induced overexpression of therapeutic genes in
hypoxic tumor cells (13).
Ionizing radiation is capable of inducing tumor cell
apoptosis and cell cycle arrest. Following cell cycle arrest,
ionizing radiation-induced DNA damage is repaired, with cells
undergoing apoptosis if repair cannot be completed (14). Pro-apoptotic genes can be used as
targets in gene-radiotherapy. Therefore, hypoxia/radiation
dual-sensitive HRE/Egr-1 promoter-mediated gene-radiotherapy may
enhance hypoxic tumor cell apoptosis, increasing cell death.
The second mitochondria-derived activator of
caspases (Smac) is located in the mitochondria and is released into
the cytosol to exert its pro-apoptotic activity. Smac specifically
binds to anti-apoptotic proteins, abolishing the suppression of the
pro-apoptotic proteins caspase-9 and -3, which have a key role in
cell apoptosis. Furthermore, Smac is capable of exerting direct
pro-apoptotic effects by binding to apoptotic protease activating
factor-1, cytochrome c (Cyt c) and casapse-9
(15,16). The overexpression of Smac has also
been utilized for cancer treatment (17,18).
The aim of the present study was to investigate the
molecular mechanisms underlying radiation-induced A549 cell death
upon the induction of hypoxia and the overexpression of Smac. A
human Smac expression vector, pcDNA3.1-HRE/Egr-1-Smac (pH/E-Smac),
containing the double-sensitive HRE/Egr1 promoter, was constructed.
The effect of Smac overexpression on the inhibition of cell
proliferation and the promotion of cell cycle arrest and apoptosis
was then assessed in A549 human lung adenocarcinoma cells subjected
to hypoxia and 2 Gy X-ray irradiation.
Materials and methods
Cell line
A549 human lung adenocarcinoma cells were purchased
from Peking Union Medical College Cell Bank (Beijing, China) and
were cultured in high-glucose Dulbecco’s Modified Eagle’s Medium
(Sigma-Aldrich, St. Louis, MO, USA) containing 10% fetal bovine
serum (FBS; Gibco-BRL, Grand Island, NY, USA) and 100 U/ml
penicillin and streptomycin (Gibco-BRL) at 37°C in 5%
CO2. A549 cells were grown to 80% confluence in six-,
24- or 96-well culture plates prior to treatment.
Plasmids
The plasmids pcDNA3.1-Egr1-TRAIL and
pcDNA3.1-HRE-Egr1-TRAIL were obtained from Dr Yanming Yang (Jilin
University, Changchun, China). The pcDNA3.1-CMV-Smac plasmid was
constructed as described previously (19) and obtained from Dr Caixia Guo
(Jilin University). Plasmids were digested using HindIII and
BamHI, and the vector backbones and Smac fragments
were subsequently recycled and ligated using the T4 DNA ligase to
obtain the recombinant pcDNA3.1-Egr1-Smac (pE-Smac) and pH/E-Smac
plasmids. Plasmids were identified using sequencing and restriction
digestion.
Cell transfection, hypoxia simulation and
X-ray irradiation
A549 cells were transfected using the Lipofectamine
2000 reagent (Invitrogen Life Technologies, Carlsbad, CA, USA)
according to the manufacturer’s instructions. Cells were cultured
at 37°C in 5% CO2 for a further 6 h with fresh medium
containing 10% FBS. Twenty-four hours after transfection,
CoCl2 (Sigma-Aldrich) was added at a final concentration
of 150 μmol/l to simulate hypoxia, as described previously
(20). X-ray irradiation was then
performed 24 h subsequent to the addition of CoCl2,
using the Philips Deep Therapy machine at 200 kV and 10 mA, using
0.5-mm Cu and 1-mm Al plates at 50 cm skin distance. A dose of 2 Gy
was delivered at a rate of 0.287 Gy/min. The dose and dose rate
were selected using the 1986 report from the United Nation
Scientific Committee on the Effects of Atomic Radiation (8,21,22).
MTT assay to detect cell
proliferation
A549 cells were divided into six groups: Control,
pE-Smac, pH/E-Smac, 2 Gy, pE-Smac+2 Gy and pH/E-Smac+2 Gy. Briefly,
A549 cells were seeded on 96-well plates at 2×10⁴
cells/well, with six replicates for each treatment. After 12 h,
transfection was performed. Twenty-four hours after transfection,
cells were cultured in normoxic and hypoxic conditions simulated by
the addition of CoCl2. After 24 h, 0 or 2 Gy X-ray
radiation was administered. A total of 10 μl MTT (Sigma-Aldrich)
was added 0, 4, 12, 24 and 48 h after irradiation, to form a final
concentration of 5 mg/ml. Following 4 h of incubation, the
supernatant was discarded and 100 μl dimethylsulfoxide
(Sigma-Aldrich) was added to dissolve the crystals. The absorbance
(A) value was measured at 570 nm using a microplate reader (Bio
Rad, Hercules, CA, USA) (8). The
experiment was repeated three times.
Flow cytometry (FCM) for the analysis of
the cell cycle and apoptosis
FCM (Becton Dickinson Co., Franklin Lakes, NJ, USA)
was performed to detect cell cycle arrest and apoptosis using
propidium iodide (PI; Sigma-Aldrich) and the Annexin V-fluorescein
isothiocyanate (FITC) double-staining kit (Nanjing KGI Biological
Technology Development Co., Ltd., Nanjing, China). Briefly, A549
cells were seeded on 24-well plates at 3×10⁵ cells/well
and subjected to transfection, hypoxia simulation and irradiation
according to the aforementioned methods. Twenty-four hours after
irradiation, cells were collected in glass centrifuge tubes and
washed twice with phosphate-buffered saline (PBS). The supernatant
was discarded. To detect cell cycle phase, 50 μl RNase A and 200 μl
PI were added and mixed in the dark at room temperature for 20 min.
To detect the cell apoptosis, cells were resuspended in 500 μl PBS,
and 5 μl Annexin V-FITC and 5 μl PI were added and mixed in the
dark at room temperature for 15 min. The cell samples were then
assessed using FCM. The BD CellQuest™ (Becton Dickinson Co.)
software was used to acquire and analyze the data.
Quantitative polymerase chain reaction
(qPCR) analysis of mRNA expression
A549 cells were seeded on six-well plates at
5×10⁵ cells/well, prior to transfection, hypoxia
simulation and irradiation as described above. Cells were collected
24 h after irradiation and total RNA was extracted using
TRIzol® Reagent (Invitrogen Life Technologies) according
to the manufacturer’s instructions. The extracted RNA was
quantified by detection of the A260/A280
ratio. cDNA was synthesized using a reverse transcription kit (MBI
Fermentas Inc., Burlington, ON, Canada) according to the
manufacturer’s instructions (200 ng RNA, 20 μl reaction system).
The reaction conditions were 42°C for 60 min, followed by 70°C for
2 min. The PrimeScript® RT-PCR kit (Takara Bio, Inc.,
Dalian, China) and an Mx3000P™ Real-Time PCR System (Stratagene, La
Jolla, CA, USA) were used for the qPCR and the subsequent analysis
of results. Primer3 software (23)
was used to design the GAPDH, Smac, Cyt c, caspase-9 and -3
primers, which were synthesized by Takara Bio, Inc. and are shown
in Table I. The reaction
conditions were as follows: 95°C for 30 sec, one cycle; 95°C for 20
sec and 60°C for 20 sec, 40 cycles; 95°C for 1 min, one cycle; 55°C
for 30 sec and 95°C for 30 sec. Relative mRNA expression was
calculated as the ratio of the gene of interest mRNA/GAPDH
mRNA.
 | Table IPrimer sequences. |
Table I
Primer sequences.
| Gene | Sequence |
|---|
| GAPDH |
| Sense |
5′-ACCACAGTCCATGCCATCAC-3′ |
| Antisense |
5′-TCCACCACCCTGTTGCTGTA-3′ |
| Smac |
| Sense |
5′-CTGTCGCGCAGCGTAACTTC-3′ |
| Antisense |
5′-GGTTACTCCAAAGCCAATCGTCA-3′ |
| Cyt c |
| Sense |
5′-GGGCGAGAGCTATGTAATGCAAG-3′ |
| Antisense |
5′-TACAGCCAAAGCAGCAGCTCA-3′ |
| Caspase-9 |
| Sense |
5′-GGACATCCAGCGGGCAGG-3′ |
| Antisense |
5′-TCTAAGCAGGAGATGAACAAAGG-3′ |
| Caspase-3 |
| Sense |
5′-TTCAGGCCTGCCGTGGTACA-3′ |
| Antisense |
5′-CCAAGAATAATAACCAGGTGCT-3′ |
Western blot analysis to detect protein
expression
A549 cells were seeded on six-well plates at
1×10⁶ cells/well, and subjected to transfection, hypoxia
simulation and irradiation according to the aforementioned methods.
Cells were collected 24 h after irradiation, and lysis buffer (10
mmol/l Tris-HCl, pH 7.4; 1 mmol/l EDTA, pH 8.0; 0.1 mol/l NaCl; 1
μg/ml aprotinin; 100 μg/ml phenylmethanesulfonyl fluoride) was used
to extract the total protein. The Coomassie Brilliant Blue protein
quantification kit (Nanjing Jiancheng Bioengineering Institute,
Nanjing, China) was used to quantify the total protein. Proteins
were separated using 12% SDS-PAGE with a sample loading of 50
μg/lane. Proteins were then transferred to a nitrocellulose
membrane. The membrane was blocked using 5% non-fat, dry milk for 1
h, prior to incubation with primary antibodies against β-actin,
Smac, Cyt c, caspase-9 and -3, respectively, overnight at 4°C.
Membranes were then washed twice using Tris-buffered saline
containing 0.05% Tween 20, prior to incubation with horseradish
peroxidase-conjugated secondary antibodies at 37°C for 1 h (Pierce
Biotechnology, Inc., Rockford, IL, USA). The enhanced chemical
luminescence light system method (Santa Cruz Biotechnology Inc.,
Santa Cruz, CA, USA) was used to visualize the immunoreactive
bands. Images were captured for analysis.
Statistical analysis
Experimental data are presented as the mean ±
standard deviation. Results were analyzed using one-way analysis of
variance with the SPSS 12.0 statistical software (SPSS, Inc.,
Chicago, IL, USA). A value of P<0.05 was considered to indicate
a statistically significant difference.
Results
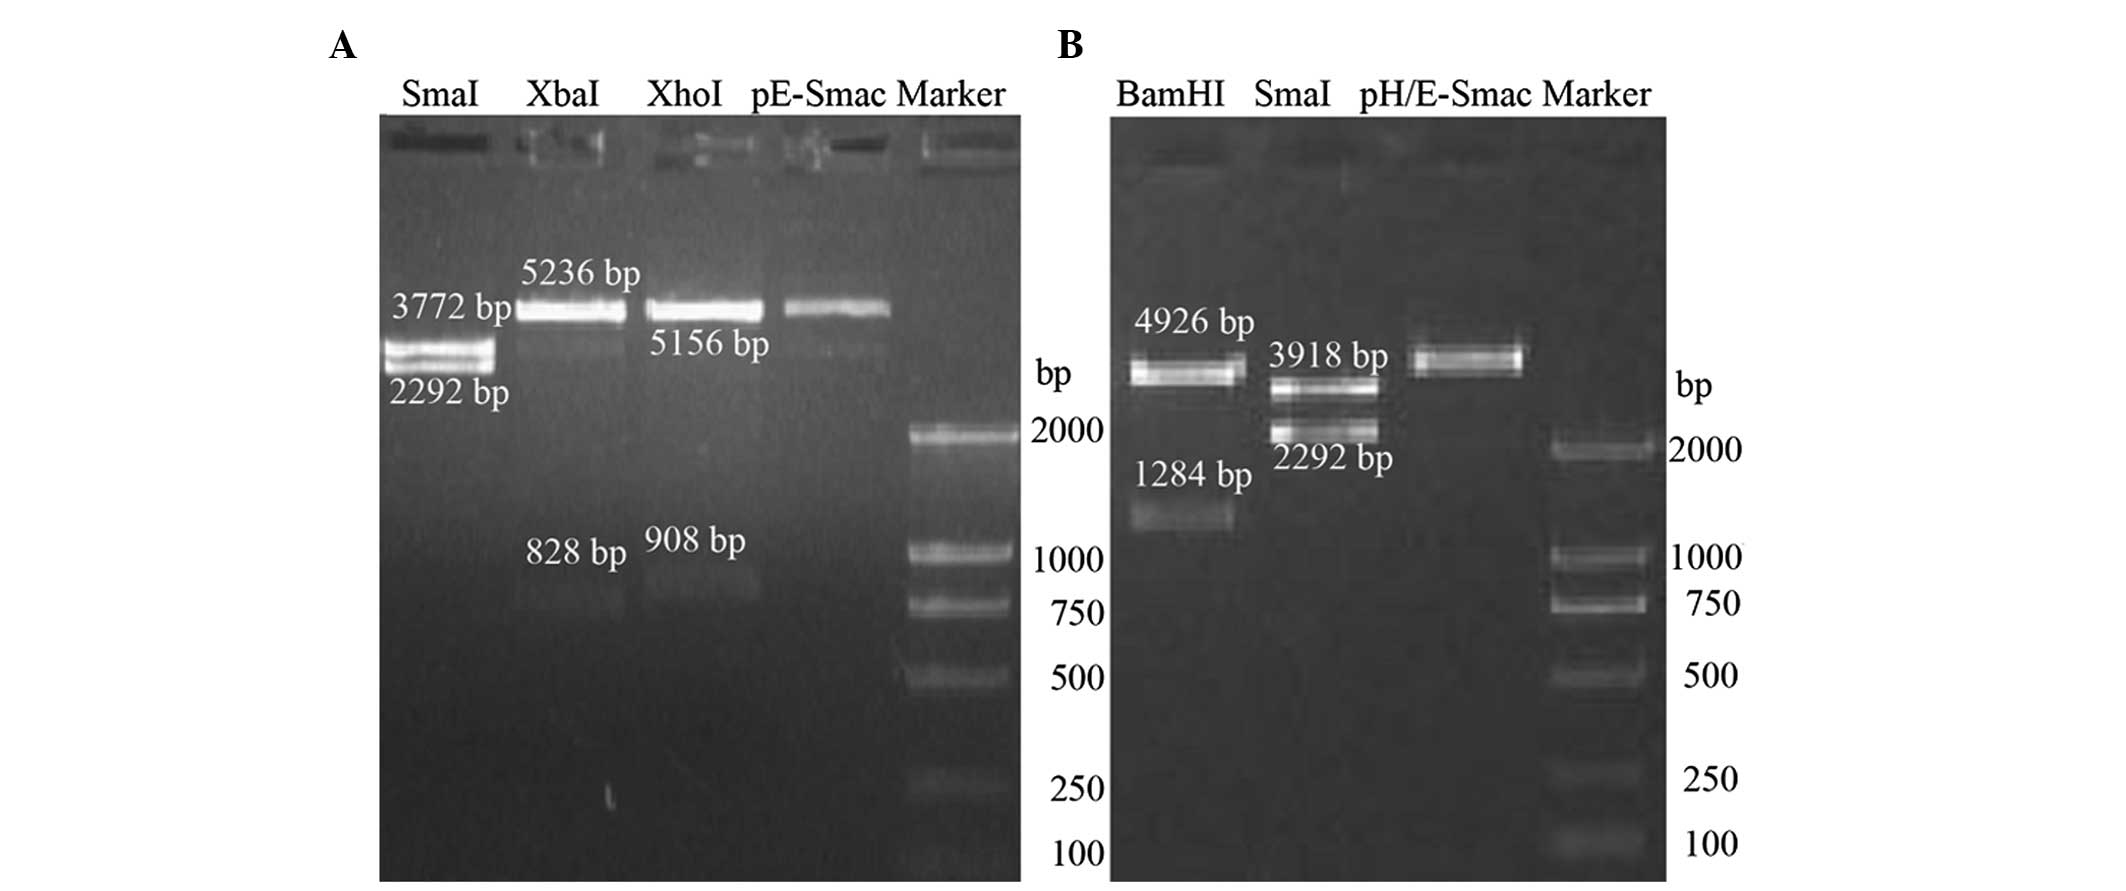
Sequencing and restriction digestion of
pE-Smac and pH/E-Smac
The pE-Smac plasmid was digested by SmaI,
XbaI and XhoI enzymes. The fragments generated were
2,292 and 3,772 bp (SmaI); 828 and 5,236 bp (XbaI)
and 908 and 5,156 bp (XhoI) (Fig. 1A). The pH/E-Smac plasmid was
digested using BamHI and SmaI enzymes. The digested
fragments were 1,284 and 4,926 bp (BamHI) and 2,292 and
3,918 bp (SmaI) (Fig. 1B).
All fragments were as expected, and sequencing revealed that
fragment sequences were consistent with those expected (data not
shown).
A549 cell proliferation
The results of the MTT assay used to assess A549
cell proliferation are shown in Table
II. Under normoxic conditions, no significant differences were
observed in A549 cell proliferation among the control, pE-Smac and
pH/E-Smac groups (P>0.05). However, a significant decrease in
A549 cell proliferation was observed in the 2 Gy (P<0.05),
pE-Smac+2 Gy and pH/E-Smac+2 Gy groups (both P<0.001), compared
with the control group at each time-point. Compared with normoxia,
hypoxic treatment was found to significantly reduce A549 cell
proliferation (P<0.05 or P<0.001), particularly in the
pH/E-Smac+2 Gy group (P<0.001).
| Table IIAbsorbance value of A549 cells under
normoxia and hypoxia. |
Table II
Absorbance value of A549 cells under
normoxia and hypoxia.
| Time (h) |
|---|
|
|
|---|
| Groups | 0 | 4 | 12 | 24 | 48 |
|---|
| Normoxia |
| Control | 0.416±0.002 | 0.423±0.008 | 0.489±0.023 | 0.665±0.058 | 0.787±0.035 |
| pE-Smac | 0.424±0.008 | 0.415±0.011 | 0.490±0.021 | 0.663±0.017 | 0.758±0.060 |
| pH/E-Smac | 0.414±0.016 | 0.414±0.005 | 0.452±0.027 | 0.628±0.056 | 0.775±0.037 |
| 2 Gy | 0.432±0.010a | 0.410±0.003a | 0.421±0.003a | 0.431±0.004a | 0.469±0.009b |
| pE-Smac+2 Gy | 0.435±0.011a | 0.385±0.006b | 0.361±0.012b | 0.367±0.008a | 0.381±0.005b |
| pH/E-Smac+2
Gy | 0.442±0.013a | 0.381±0.009b | 0.361±0.009b | 0.368±0.014b | 0.378±0.021b |
| Hypoxia |
| Control | 0.383±0.050 | 0.419±0.018 | 0.387±0.009c | 0.460±0.041c | 0.495±0.034d |
| pE-Smac | 0.402±0.011c | 0.412±0.010 | 0.393±0.005c | 0.485±0.023d | 0.459±0.028c |
| pH/E-Smac | 0.347±0.008d | 0.339±0.006b,d | 0.385±0.007a,c | 0.424±0.008c | 0.422±0.009a,d |
| 2 Gy | 0.408±0.006c | 0.399±0.007 | 0.353±0.015b,c | 0.397±0.010c | 0.410±0.009a,d |
| pE-Smac+2 Gy | 0.413±0.009d | 0.394±0.006b | 0.323±0.013b,c | 0.343±0.006a,c | 0.350±0.008a,c |
| pH/E-Smac+2
Gy | 0.339±0.004c | 0.329±0.020c | 0.290±0.016d | 0.254±0.032b,c | 0.153±0.026b,d |
A549 cell cycle phase
Table III and
Fig. 2 show A549 cell cycle phase
under normoxia and hypoxia, detected using FCM with PI staining.
Under normoxia, in the 2 Gy, pE-Smac +2 Gy and pH/E-Smac+2 Gy
groups, the proportion of cells in S phase was significantly
decreased compared with the control, while the proportion of cells
in G2/M phase was significantly increased compared with
the control (P<0.05). No significant differences were observed
in the other treatment groups under normoxia. Under hypoxia, in the
pH/E-Smac, 2 Gy, pE-Smac+2 Gy and pH/E-Smac+2 Gy groups, the
proportion of cells in the G0/G1 and
G2/M phases was observed to be significantly increased
compared with the control, while the proportion in S phase was
found to be significantly reduced (P<0.05 or P<0.001). With
the exception of the G2/M phase in the control and
pE-Smac groups, the changes in the percentage of cells in
G0/G1, S and G2/M phases under
hypoxia were significantly greater than those under normoxia
(P<0.05 or P<0.001). These findings suggest that 2 Gy X-ray
irradiation can induce G2/M-phase arrest and that
hypoxia induces G0/G1 arrest. The greatest
cell cycle arrest was achieved in the pH/E-Smac+2 Gy group under
hypoxia.
| Table IIIPercentage of A549 cells in each cell
cycle phase under normoxia and hypoxia. |
Table III
Percentage of A549 cells in each cell
cycle phase under normoxia and hypoxia.
| Cell percentage
(%) |
|---|
|
|
|---|
| Groups |
G0/G1 | S |
G2/M |
|---|
| Normoxia |
| Control | 54.17±1.59 | 42.69±4.55 | 3.13±1.18 |
| pE-Smac | 53.78±0.69 | 42.77±0.53 | 3.45±0.49 |
| pH/E-Smac | 54.04±2.34 | 39.44±1.99 | 2.86±0.68 |
| 2 Gy | 61.55±1.42 | 31.92±1.23a | 6.53±0.21a |
| pE-Smac+2 Gy | 61.85±2.33 | 31.95±1.51a | 6.23±0.89a |
| pH/E-Smac+2
Gy | 60.89±2.09 | 32.91±1.86a | 6.20±0.26a |
| Hypoxia |
| Control | 65.47±0.62b | 31.40±0.60b | 3.13±0.21 |
| pE-Smac | 65.55±1.48b | 30.91±1.66c | 3.54±0.92 |
| pH/E-Smac | 70.72±0.86a,b | 11.79±1.33c,d | 17.49±1.21a,c |
| 2 Gy | 71.51±0.89a,b | 10.82±1.26c,d | 17.67±0.53c,d |
| pE-Smac+2 Gy | 71.74±1.20a,b | 6.85±1.29c,d | 21.41±0.62c,d |
| pH/E-Smac+2
Gy | 70.74±0.27a,b | 7.12±1.54c,d | 22.15±1.29a,b |
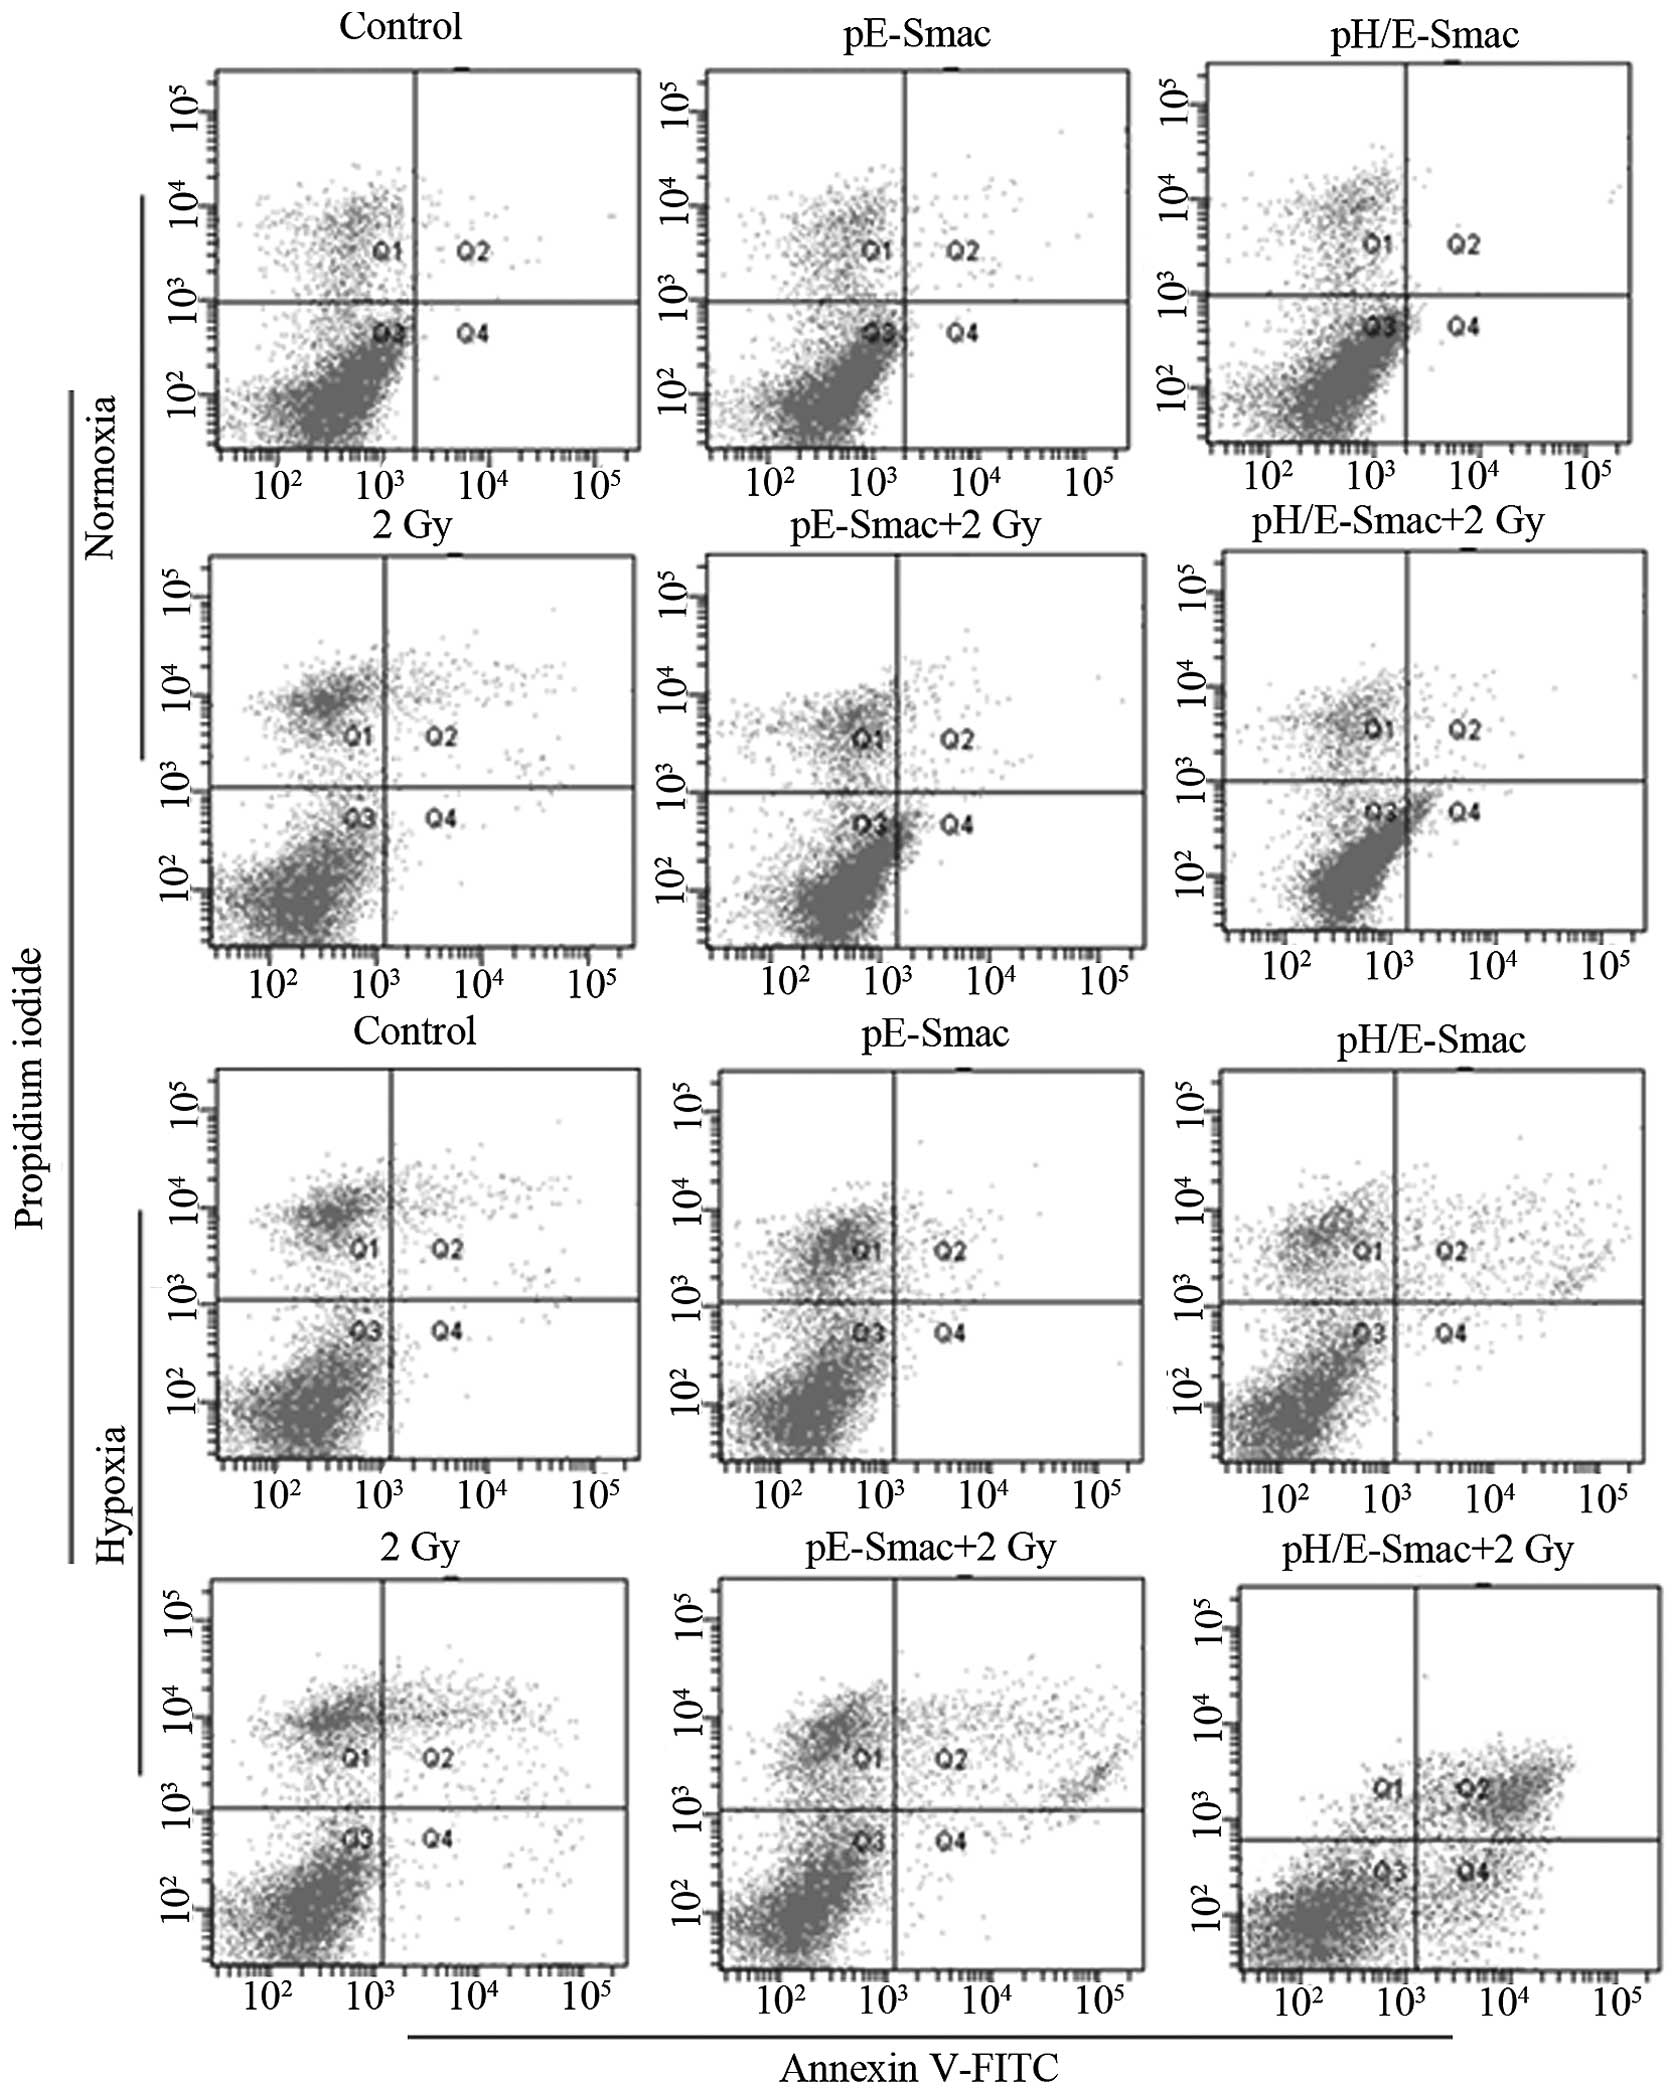
A549 cell apoptosis
Table IV and
Fig. 3 show the results of the FCM
used to detect A549 cell apoptosis under normoxia and hypoxia.
Under normoxia, the percentage of apoptotic A549 cells in the 2 Gy,
pE-Smac+2 Gy and pH/E-Smac+2 Gy groups was observed to be
significantly increased compared with that in the control group
(P<0.05 or P<0.01), particularly in the pE-Smac+2 Gy and
pH/E-Smac+2 Gy groups. No significant difference was observed
between the pE-Smac+2 Gy and pH/E-Smac+2 Gy groups. Under hypoxia,
the percentage of apoptotic A549 cells in the pH/E-Smac, 2 Gy,
pE-Smac+2 Gy and pH/E-Smac+2 Gy groups was increased significantly
compared with that in the control group (P<0.05 or P<0.01),
particularly in the pH/E-Smac+2 Gy group. Furthermore, the
percentage of apoptotic cells in each hypoxic group was found to be
increased significantly compared with each normoxic group
(P<0.05 or P<0.01).
| Table IVPercentage of apoptotic A549 cells
under normoxia and hypoxia. |
Table IV
Percentage of apoptotic A549 cells
under normoxia and hypoxia.
| Apoptotic
percentage (%) |
|---|
|
|
|---|
| Groups | Normoxia | Hypoxia |
|---|
| Control | 0.60±0.10 | 2.90±0.20a |
| pE-Smac | 0.67±0.15 | 2.53±0.47b |
| pH/E-Smac | 0.73±0.06 | 5.07±0.15a,c |
| 2 Gy | 2.87±0.15c | 7.27±0.25a,c |
| pE-Smac+2 Gy | 4.50±0.30d | 8.27±0.15a,c |
| pH/E-Smac+2 Gy | 4.80±0.30d | 17.8±0.83b,c |
Smac, Cyt c and caspase-9 and -3 mRNA
expression in A549 cells
qPCR analysis was performed to detect Smac, Cyt
c, and caspase-9 and -3 mRNA expression. The relative mRNA
levels were calculated as the ratio of experimental/control mRNA
expression, as shown in Table V.
With the exception of Cyt c expression in the 2 Gy group,
under normoxia Smac, Cyt c, and caspase-9 and -3 mRNA levels
in the 2 Gy, pE-Smac+2 Gy and pH/E-Smac+2 Gy groups were
significantly increased compared with those in the control group
(P<0.05 or P<0.01), with no significant difference observed
in the mRNA expression between the pE-Smac+2 Gy and pH/E-Smac+2 Gy
groups. With the exception of Cyt c and caspase-3 in the
pH/E-Smac group, the mRNA levels of Smac, Cyt c, and
caspase-9 and -3 in the pH/E-Smac, 2 Gy, pE-Smac+2 Gy and
pH/E-Smac+2 Gy groups under hypoxia were found to be significantly
increased compared with those in the control group (P<0.05 or
P<0.001), particularly in the pH/E-Smac+2 Gy group. Overall,
with the exception of Cyt c in the control, pE-Smac and
pE-Smac+2 Gy groups, hypoxia was found to significantly increase
Smac, Cyt c, caspase-9 and -3 mRNA levels compared with
normoxia (P<0.05 or P<0.001).
| Table VRelative mRNA expression of Cyt
c, caspase-9 and -3 in A549 cells under normoxia and
hypoxia. |
Table V
Relative mRNA expression of Cyt
c, caspase-9 and -3 in A549 cells under normoxia and
hypoxia.
| Relative mRNA
expression |
|---|
|
|
|---|
| Groups | Smac | Cyt c | Caspase-9 | Caspase-3 |
|---|
| Normoxia |
| Control | 1 | 1 | 1 | 1 |
| pE-Smac | 1.09±0.05 | 1.06±0.05 | 1.03±0.03 | 1.09±0.06 |
| pH/E-Smac | 1.09±0.06 | 1.08±0.06 | 1.06±0.06 | 1.05±0.04 |
| 2 Gy | 4.42±0.51a | 1.73±0.32 | 5.89±0.19a | 5.72±0.29a |
| pE-Smac+2 Gy | 20.51±1.67a | 7.22±0.27a | 5.76±0.10b | 32.03±2.49a |
| pH/E-Smac+2
Gy | 20.23±0.75a | 7.41±0.42a | 6.91±0.28a | 32.08±3.60a |
| Hypoxia |
| Control | 2.82±0.13c | 1.23±0.10 | 2.34±0.06c | 3.06±0.16c |
| pE-Smac | 2.75±0.09d | 1.27±0.15 | 2.56±0.07d | 3.18±0.17c |
| pH/E-Smac | 6.34±0.26b,d | 1.20±0.04c | 6.04±0.13b,d | 3.12±0.04d |
| 2 Gy | 9.75±0.72a,c | 2.83±0.34a,c | 12.73±1.21a,c | 11.14±0.23b,d |
| pE-Smac+2 Gy | 10.66±0.68a,c | 7.64±0.43a | 13.12±1.53a,c | 41.82±1.57b,c |
| pH/E-Smac+2
Gy | 39.71±2.69a,c | 16.8±0.80a,d | 19.56±0.99a,c | 59.09±1.59b,d |
Smac, Cyt c, casapase-9 and -3 protein
expression in A549 cells
As shown in Fig. 4,
western blot analysis was used to detect Smac, Cyt c, and
caspase-9 and -3 protein expression. Under normoxia, the expression
of the housekeeping protein β-actin (molecular weight, 42 kDa) was
consistent in each group. The protein expression of Smac (25 kDa)
and Cyt c (12 kDa) was observed to increase in the 2 Gy, pE-Smac+2
Gy and pH/E-Smac+2 Gy groups, while that of the caspase-9 and -3
precursors (42 kDa and 27 kDa, respectively) were consistent among
all six groups. Expression of the activated caspase-9 protein (35
kDa) was observed to increase in the 2 Gy, pE-Smac+2 Gy and
pH/E-Smac+2 Gy groups, and that of the activated caspase-3 protein
(21 kDa) was found to increase in the pE-Smac+2 Gy and pH/E-Smac+2
Gy groups.
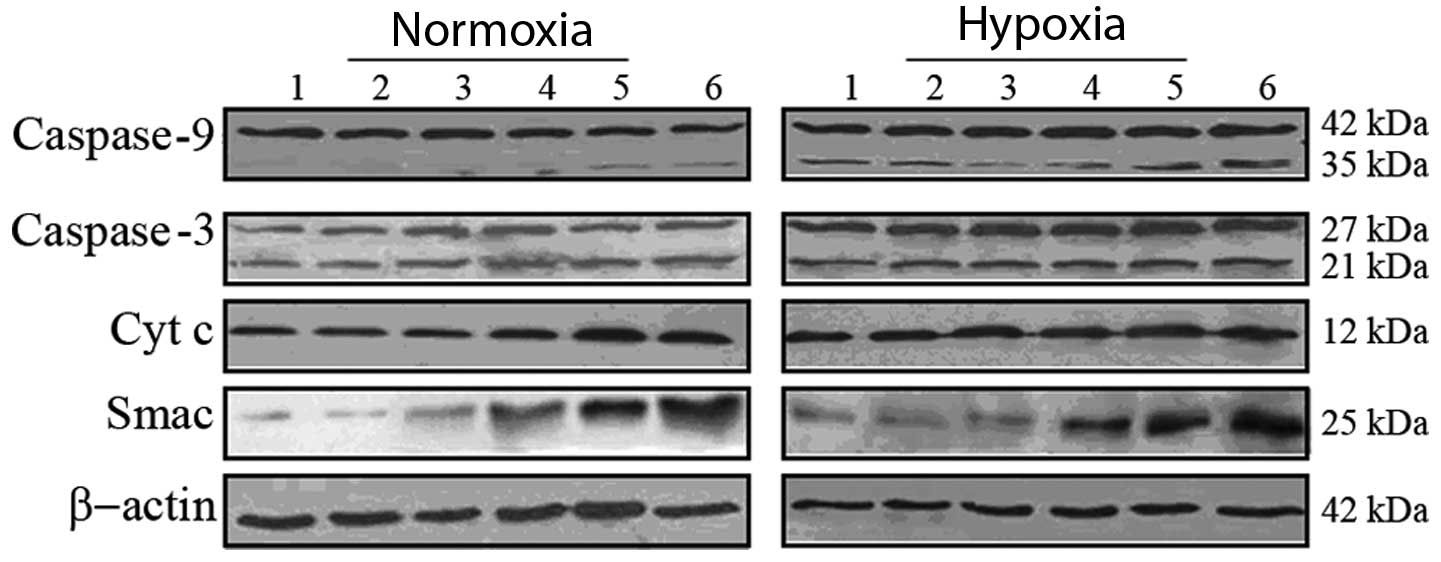 | Figure 4Protein expression of Smac, Cyt c,
caspase-9 and -3 in A549 cells, as determined using western blot
analysis. Lane 1, control; lane 2, pE-Smac; lane 3, pH/E-Smac; lane
4, 2 Gy; lane 5, pE-Smac+2 Gy; lane 6, pH/E-Smac+2 Gy. pE-Smac,
pcDNA3.1-Egr1-Smac; pH/E-Smac, pcDNA3.1-HRE/Egr1-Smac; Cyt
c, cytochrome c; Smac, second mitochondria-derived
activator of caspases. |
Under hypoxia, expression of the housekeeping
protein β-actin was consistent in each group. However, the protein
expression of Smac and Cyt c was observed to increase in the
pH/E-Smac, 2 Gy, pE-Smac+2 Gy and pH/E-Smac+2 Gy groups, with the
highest expression observed in the pH/E-Smac+2 Gy group. The
expression of the precursor and activated caspase-9 proteins was
found to increase under hypoxia, particularly in the pE-Smac+2 Gy
and pH/E-Smac+2 Gy groups. No difference was observed in the
expression of the caspase-3 precursor protein under hypoxia;
however, the expression of the activated protein was found to
increase in the 2 Gy, pE-Smac+2 Gy and pH/E-Smac+2 Gy groups,
particularly in the pH/E-Smac+2 Gy group. When compared with
normoxia, hypoxic treatment was found to increase the expression of
the Smac, Cyt c and caspase-9 and -3 precursor and activated
proteins.
Discussion
Cells in solid tumors cause a hypoxic
microenvironment, which results in radiation resistance (24). Based on the hypoxia-inducible
nature of the HRE promoter (10–12),
the present study aimed to use the HRE promoter in lung cancer gene
therapy to promote the downstream expression of the therapeutic
Smac and increase the tumor cell death. Furthermore, the
radiation-inducible Egr-1 promoter, which is activated and
regulated by ionizing radiation in a temporal and spatial
dose-dependent manner (6,8,25),
was used to enhance the expression of the Smac gene. The
present study combined the HRE and Egr-1 promoters, forming a
dual-sensitive chimeric HRE/Egr-1 promoter to induce the expression
of the pro-apoptotic Smac gene in A549 human lung
adenocarcinoma cells subjected to hypoxia and X-ray irradiation.
The results showed that 2 Gy X-ray radiation alone was capable of
inducing the Egr-1 promoter to enhance the expression of Smac. The
HRE promoter is inactive under normoxia. Under hypoxia, 2 Gy X-ray
radiation was observed to markedly enhance Smac expression in A549
cells. Therefore, the radiation-induced Egr-1 promoter and the
hypoxia-induced HRE promoter may synergize to improve the efficacy
of radiotherapy.
The overexpression of Smac has been reported to
promote tumor cell apoptosis through the mitochondrial pathway and
enhance the sensitivity of tumor cells to radio- and chemotherapy
(26–32). The present study found that the
overexpression of Smac in A549 cells under normoxia enhanced X-ray
radiation-induced G2/M arrest and apoptosis, and
increased the protein and mRNA expression of Cyt c, and
caspase-9 and -3. These findings indicate that Smac overexpression
is capable of inducing A549 cell apoptosis by activating caspase-9
and -3 and increasing Cyt c, suggesting that the Cyt
c/caspase-9/caspase-3 pathway is involved in the regulation
of apoptosis.
In accordance with a study by Zeng et al
(33), CoCl2-simulated
hypoxia in the present study was observed to induce
G0/G1 arrest. G0/G1
arrest renders cells sensitive to radiation, which enhances the
efficacy of radiotherapy (34).
Hypoxia-induced G0/G1 arrest also enhances
radiation-induced apoptosis without radiation resistance. In the
present study, the HRE/Egr-1 promoter was found to mediate the
overexpression of Smac, leading to enhanced G2/M arrest
in A549 cells. G2/M arrest also renders cells sensitive
to radiation. In this study, compared with cells under normoxia,
hypoxic cells were observed to exhibit enhanced apoptosis,
G2/M arrest and expression of Cyt c, as well as
caspase-9 and -3. These findings indicate that the constructed
hypoxia/radiation dual-sensitive chimeric HRE/Egr-1 promoter has a
role in gene therapy under hypoxia.
In conclusion, the hypoxia/radiation dual-sensitive
HRE/Egr-1 promoter-mediated Smac overexpression vector was
successfully constructed in the present study. Following
transfection of A549 human lung adenocarcinoma cells, radiation and
hypoxia were observed to induce the overexpression of Smac, leading
to proliferation inhibition, enhanced apoptosis and
G2/M-phase arrest. Furthermore, cell apoptosis was found
to involve the mitochondrial Cyt c/caspase-9/caspase-3
pathway. HRE/Egr-1 promoter-mediated gene-radiotherapy achieved
enhanced efficacy and synergized radiotherapy and gene therapy,
providing an experimental basis for gene-radiotherapy in lung
cancer.
References
|
1
|
Kwong DL, Sham JS, Leung LH, Cheng AC, Ng
WM, Kwong PW, Lui WM, Yau CC, Wu PM, Wei W and Au G: Preliminary
results of radiation dose escalation for locally advanced
nasopharyngeal carcinoma. Int J Radiat Oncol Biol Phys. 64:374–381.
2006. View Article : Google Scholar : PubMed/NCBI
|
|
2
|
Zheng AQ, Song XR, Yu JM, Wei L and Wang
XW: Liposome transfected to plasmid-encoding endostatin gene
combined with radiotherapy inhibits liver cancer growth in nude
mice. World J Gastroenterol. 11:4439–4442. 2005.PubMed/NCBI
|
|
3
|
Harari PM and Huang SM: Head and neck
cancer as a clinical model for molecular targeting of therapy:
combining EGFR blockade with radiation. Int J Radiat Oncol Biol
Phys. 49:427–433. 2001. View Article : Google Scholar : PubMed/NCBI
|
|
4
|
Weichselbaum RR and Kufe D: Translation of
the radio- and chemo-inducible TNFerade vector to the treatment of
human cancers. Cancer Gene Ther. 16:609–619. 2009. View Article : Google Scholar : PubMed/NCBI
|
|
5
|
Kufe D and Weichselbaum R: Radiation
therapy: activation for gene transcription and the development of
genetic radiotherapy-therapeutic strategies in oncology. Cancer
Biol Ther. 2:326–329. 2003. View Article : Google Scholar : PubMed/NCBI
|
|
6
|
Liu LL, Smith MJ, Sun BS, Wang GJ, Redmond
HP and Wang JH: Combined IFN-gamma-endostatin gene therapy and
radiotherapy attenuates primary breast tumor growth and lung
metastases via enhanced CTL and NK cell activation and attenuated
tumor angiogenesis in a murine model. Ann Surg Oncol. 16:1403–1411.
2009. View Article : Google Scholar
|
|
7
|
Yang W and Li XY: Anti-tumor effect of
pEgr-interferon-gamma-endostatin gene-radiotherapy in mice bearing
Lewis lung carcinoma and its mechanism. Chin Med J (Engl).
118:296–301. 2005.PubMed/NCBI
|
|
8
|
Li Y, Guo C, Wang Z, Gong P, Sun Z and
Gong S: Enhanced effects of TRAIL-endostatin-based
double-gene-radiotherapy on suppressing growth, promoting apoptosis
and inducing cell cycle arrest in vascular endothelial cells. J
Huazhong Univ Sci Technolog Med Sci. 32:167–172. 2012. View Article : Google Scholar
|
|
9
|
Toma-Daşu I, Daşu A and Karlsson M: The
relationship between temporal variation of hypoxia, polarographic
measurements and predictions of tumor response to radiation. Phys
Med Biol. 49:4463–4475. 2004.PubMed/NCBI
|
|
10
|
Lok CN and Ponka P: Identification of a
hypoxia response element in the transferrin receptor gene. J Biol
Chem. 274:24147–24152. 1999. View Article : Google Scholar : PubMed/NCBI
|
|
11
|
Okino ST, Chichester CH and Whitlock JP
Jr: Hypoxia-inducible mammalian gene expression analyzed in vivo at
a TATA-driven promoter and at an initiator-driven promoter. J Biol
Chem. 273:23837–23843. 1998. View Article : Google Scholar : PubMed/NCBI
|
|
12
|
Kwon OJ, Kim PH, Huyn S, Wu L, Kim M and
Yun CO: A hypoxia-and {alpha}-fetoprotein-dependent oncolytic
adenovirus exhibits specific killing of hepatocellular carcinomas.
Clin Cancer Res. 16:6071–6082. 2010. View Article : Google Scholar
|
|
13
|
Leskov KS, Criswell T, Antonio S, Li J,
Yang CR, Kinsella TJ and Boothman DA: When X-ray-inducible proteins
meet DNA double strand break repair. Semin Radiat Oncol.
11:352–372. 2001. View Article : Google Scholar : PubMed/NCBI
|
|
14
|
Wang WD, Chen ZT, Li DZ, Duan YZ, Wang ZX
and Cao ZH: HSV-TK gene therapy of lung adenocarcinoma xenografts
using a hypoxia/radiation dual-sensitive promoter. Ai Zheng.
23:788–793. 2004.(In Chinese).
|
|
15
|
Wu G, Chai J, Suber TL, Wu JW, Du C, Wang
X and Shi Y: Structural basis of IAP recognition by Smac/DIABLO.
Nature. 408:1008–1012. 2000. View
Article : Google Scholar : PubMed/NCBI
|
|
16
|
Mühlethaler-Mottet A, Bourloud KB,
Auderset K, Joseph JM and Gross N: Drug-mediated sensitization to
TRAIL-induced apoptosis in caspase-8-complemented neuroblastoma
cells proceeds via activation of intrinsic and extrinsic pathways
and caspase-dependent cleavage of XIAP, Bcl-xL and RIP. Oncogene.
23:5415–5425. 2004.
|
|
17
|
McNeish IA, Bell S, McKay T, Tenev T,
Marani M and Lemoine NR: Expression of Smac/DABLO in ovarian
carcinoma cells induces apoptosis via a caspase-9 mediated pathway.
Exp Cell Res. 286:186–198. 2008. View Article : Google Scholar : PubMed/NCBI
|
|
18
|
Du N, Yang B, Hu LJ, Zhao Y, Sun X, Guo ZW
and Ren H: Overexpression of Smac gene enhanced chemotherapeutic
sensitivity of esophageal cancer cell line Eca109 to cisplatin. Xi
Bao Yu Fen Zi Mian Yi Xue Za Zhi. 28:344–346. 2012.(In
Chinese).
|
|
19
|
Guo C, Li Y, Zhang H, et al: Enhancement
of antiproliferative and proapoptotic effects of cadmium chloride
combined with hSmac in hepatocellular carcinoma cells.
Chemotherapy. 57:27–34. 2011. View Article : Google Scholar : PubMed/NCBI
|
|
20
|
Dai M, Cui P, Yu M, Han J, Li H and Xiu R:
Melatonin modulates the expression of VEGF and HIF-1 alpha induced
by CoCl2 in cultured cancer cells. J Pineal Res.
44:121–126. 2008. View Article : Google Scholar : PubMed/NCBI
|
|
21
|
Liu G, Gong P, Zhao H, Wang Z, Gong S and
Cai L: Effect of low-level radiation on the death of male germ
cells. Radiat Res. 165:379–389. 2006. View
Article : Google Scholar : PubMed/NCBI
|
|
22
|
United Nations Scientific Committee on the
Effects of Atomic Radiation: 1986 Report to the General Assembly,
with annexes. In: General Assembly Official Records: Forty-first
session, Supplement No. 16 (A/41/16); United Nations; New York, NY:
1986
|
|
23
|
Koressaar T and Remm M: Enhancements and
modifications of primer design program Primer3. Bioinformatics.
23:1289–1291. 2007. View Article : Google Scholar : PubMed/NCBI
|
|
24
|
Harada H: How can we overcome tumor
hypoxia in radiation therapy? J Radiat Res. 52:545–556. 2011.
View Article : Google Scholar : PubMed/NCBI
|
|
25
|
Min FL, Zhang H and Li WJ: Current status
of tumor radiogenic therapy. World J Gastroenterol. 11:3014–3019.
2005. View Article : Google Scholar : PubMed/NCBI
|
|
26
|
Mizutani Y, Nakanishi H, Yamamoto K, Li
YN, Matsubara H, Mikami K, Okihara K, Kawauchi A, Bonavida B and
Miki T: Downregulation of Smac/DIABLO expression in renal cell
carcinoma and its prognostic significance. J Clin Oncol.
23:448–454. 2005. View Article : Google Scholar : PubMed/NCBI
|
|
27
|
Pluta P, Cebula-Obrzut B, Ehemann V, et
al: Correlation of Smac/DIABLO protein expression with the
clinico-pathological features of breast cancer patients. Neoplasma.
58:430–435. 2011. View Article : Google Scholar : PubMed/NCBI
|
|
28
|
Fulda S, Wick W, Weller M and Debatin KM:
Smac agonists sensitize for Apo-2L/TRAIL or anticancer drug-induced
apoptosis and induce regression of malignant glioma in vivo. Nat
Med. 8:808–815. 2002.PubMed/NCBI
|
|
29
|
Fulda S and Vucic D: Targeting IAP
proteins for therapeutic intervention in cancer. Nat Rev Drug
Discov. 11:109–124. 2012. View
Article : Google Scholar : PubMed/NCBI
|
|
30
|
Le Bras M, Rouy I and Brenner C: The
modulation of inter-organelle cross-talk to control apoptosis. Med
Chem. 2:1–12. 2006.PubMed/NCBI
|
|
31
|
Flanagan L, Sebastià J, Tuffy LP, Spring
A, Lichawska A, Devocelle M, Prehn JH and Rehm M: XIAP impairs Smac
release from the mitochondria during apoptosis. Cell Death Dis.
1:e492010. View Article : Google Scholar : PubMed/NCBI
|
|
32
|
Zhou LL, Zhou LY, Luo KQ and Chang DC:
Smac/DIABLO and cytochrome c are released from mitochondria
through a similar mechanism during UV-induced apoptosis. Apoptosis.
10:289–99. 2005.PubMed/NCBI
|
|
33
|
Zeng HL, Zhong Q, Qin YL, Bu QQ, Han XA,
Jia HT and Liu HW: Hypoxia-mimetic agents inhibit proliferation and
alter the morphology of human umbilical cord-derived mesenchymal
stem cells. BMC Cell Biol. 12:322011. View Article : Google Scholar : PubMed/NCBI
|
|
34
|
Huang SM and Harari PM: Modulation of
radiation response after epidermal growth factor receptor blockade
in squamous cell carcinomas: inhibition of damage repair, cell
cycle kinetics, and tumor angiogenesis. Clin Cancer Res.
6:2166–2174. 2000.
|