Introduction
Epithelial hyperproliferation, increased
angiogenesis and inflammation are biological processes associated
with the pathogenesis of corneal disease, and are the primary cause
of bilateral blindness worldwide (1,2). In
addition, a number of other disease conditions may arise as a
result of abnormal epithelial cell proliferation, inflammation and
angiogenesis, such as tumorigenesis and chronic inflammatory
disorders (3,4). As a result, investigating the
molecular mechanisms underlying these conditions is of critical
importance.
Dstncorn1 mice are homozygous for a
spontaneous null actin depolymerizing factor destrin (DSTN) allele,
which results in an increase in serum response factor (Srf)
expression. This increase in Srf production may lead to corneal
abnormalities, including epithelial hyperproliferation,
neovascularization and inflammation in the cornea (5). Based on these characteristics,
Dstncorn1 mice often serve as suitable in vivo
models for the investigation of corneal diseases (6). Verdoni et al (1) demonstrated that conditional
Srf knockout in the corneal epithelium of
Dstncorn1 mice rescues epithelial cell
hyperproliferation, neovascularization and inflammatory phenotypes.
In addition, previous studies have demonstrated that vascular
endothelial growth factor receptor 1 (VEGFR1) was downregulated in
Dstncorn1 mice (7) and
that conditional Srf knockout Dstncorn1 mice
displayed increased levels of VEGFR1 (1). The genome-wide screening of
differentially expressed genes (DEGs) in the corneas of
Dstncorn1 mice has revealed that a large proportion of
upregulated DEGs are targets of Srf (8). Additionally, another study by Verdoni
et al (9) indicated that
the B-cell receptor signaling pathway served an important role in
the phenotype of Dstncorn1 mice. Although a considerable
number of studies have focused on understanding the molecular
mechanisms of the Dstncorn1 phenotype, the development
of various abnormalities remains unclear.
Kawakami-Schulz et al (5) identified the gene networks that were
affected by the increased expression of Srf in
Dstncorn1 mouse corneas. The expression profiling array
GSE49688, which was provided by Kawakami-Schulz et al
(5), was downloaded for analysis
in the present study. The aim of the present study was to identify
DEGs and perform signaling pathway analysis among three types of
mice included in the GSE49688 array using various bioinformatics
tools. The results may provide an important theoretical foundation
for understanding the role of Srf in normal and abnormal corneal
tissue homeostasis.
Materials and methods
Affymetrix microarray data
Data from the expression profiling array GSE49688
(5) were downloaded from the Gene
Expression Omnibus database (http://www.ncbi.nlm.nih.gov/geo/). This dataset is
based on the GPL16570 MoGene-2_0-st Affymetrix Mouse Gene 2.0 ST
Array [transcript (gene) version] platform (Affymetrix, Inc., Santa
Clara, CA, USA). In total, 9 samples are included in the datasets,
with 3 samples each from the following groups: i) Wild-type (WT)
mice; ii) a Dstncorn1 mutant mouse model of corneal
disease; and iii) Dstncorn1 mutant mice following the
conditional ablation of Srf from the corneal epithelium
[namely the rescued (res) group].
Data preprocessing and differential
expression analysis
The expression profiling probes were first annotated
through annotation files. Subsequently, gene symbols were
identified from annotation files, with the use of editing codes.
Next, expression profiling of gene symbols was performed by Z-score
normalization, as previously described (10). The linear models for microarray
data (limma) version 3.28.17 (11)
in R-software package (www.r-project.org) were applied to identify the DEGs
among the three mouse groups. The log2-fold change
(log2FC) and the false discovery rate (FDR) (12) were calculated. Genes with
log2FC>1 and an FDR <0.05 were considered to be
DEGs and were used for subsequent analysis.
Dynamic comparison and hierarchical
cluster analyses of DEGs
In order to verify that the three mouse groups
represented three distinct states and examine their correlation at
a molecular level, dynamic comparisons and unsupervised clustering
analyses of DEGs were performed for the 9 samples in the GSE49688
array. DEGs between two mouse groups were determined at a time,
thus obtaining three DEG groups, namely the corn1 vs. WT, res vs.
corn1 and res vs. WT groups. The common DEGs among the three groups
were then clustered hierarchically (13) and visualized using the TreeView
program (jtreeview.sourceforge.net/) (14), and genes and samples were
normalized using the median center method (15). The similarity matrix used the
correlation-centered metric (16).
Pathway enrichment analysis
The Kyoto Encyclopedia of Genes and Genomes (KEGG;
www.genome.ad.jp/kegg/) (17) knowledge database is a collection of
online databases of genomes, enzymatic pathways and biological
chemicals. In the present study, KEGG pathway enrichment analysis
for the three groups of DEGs was performed. In addition, their
association based on function was determined using the Database for
Annotation, Visualization and Integrated Discovery (DAVID;
http://david.abcc.ncifcrf.gov) gene
classification tool (18).
P<0.05 was established as the threshold for the hypergeometric
test.
Pathway alteration score
Quantitative scoring was performed for the potential
pathways based on genes enriched in the pathway. The Euclidean
distance quantitative method was used to calculate the dynamic
metergasis of pathways in the corn1 and res phenotypes compared
with the WT phenotype (19). The
pathway alteration score was calculated using the following
formula:
A(P)=log10(1N∑i=1N(Xgens–Ygens)2),
where A(P) is the alteration score of the pathway, N
is the number of DEGs, Xgene is the expression value of gene in the
corn1 or res phenotypes and Ygene is the expression value of gene
in the WT phenotype group. The higher the score, the clearer the
alteration degree of pathway from WT phenotype.
Results
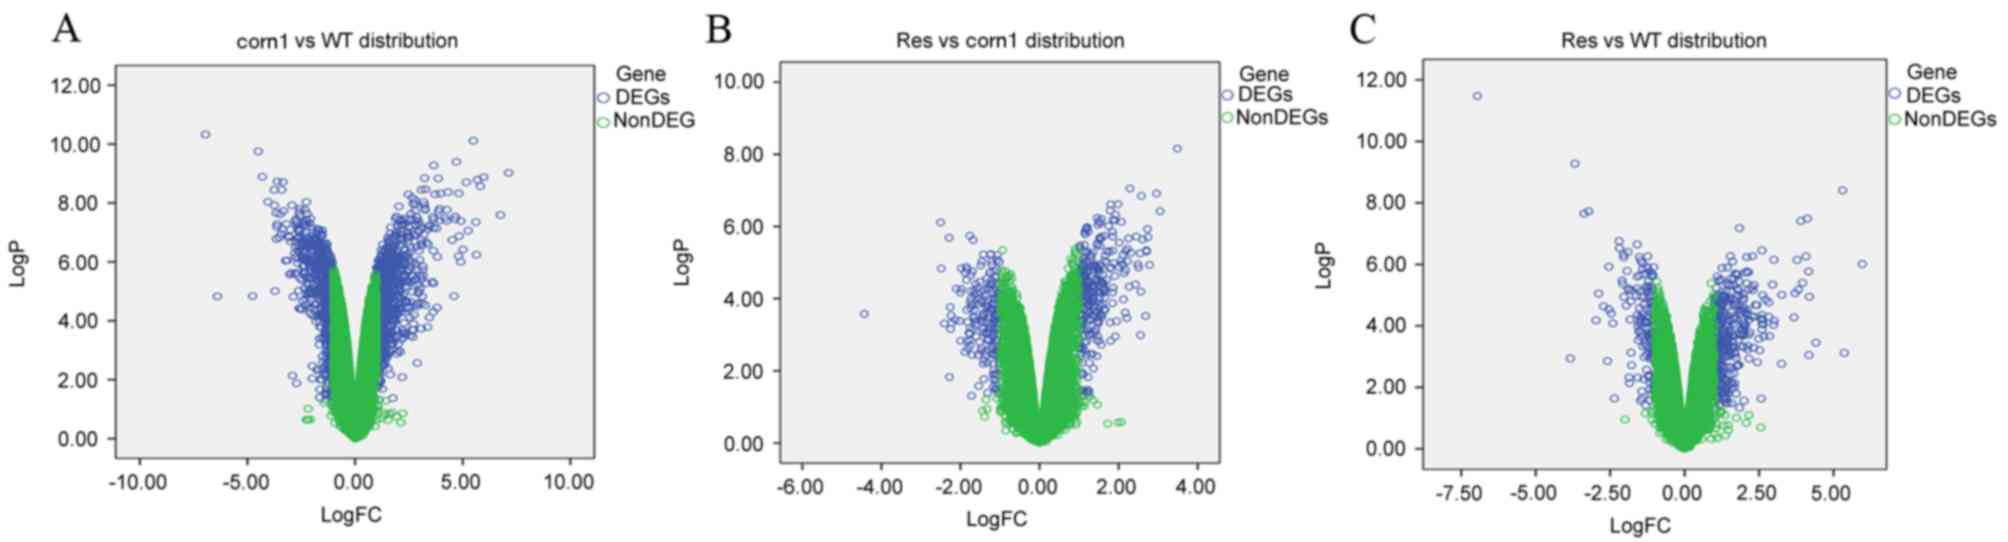
Identification of DEGs
A pairwise comparison of genes from the WT, corn1
and res sample groups was performed in order to identify the DEGs
between groups. As presented in Fig.
1A, a total of 1,365 DEGs were identified between the corn1 and
WT sample groups, including 867 upregulated and 498 downregulated
DEGs. Between the corn1 and res sample groups, 788 DEGs were
identified, including 345 upregulated and 443 downregulated DEGs
(Fig. 1B). A total of 852 DEGs
were identified between the res and WT sample groups, including 593
upregulated and 259 downregulated DEGs (Fig. 1C).
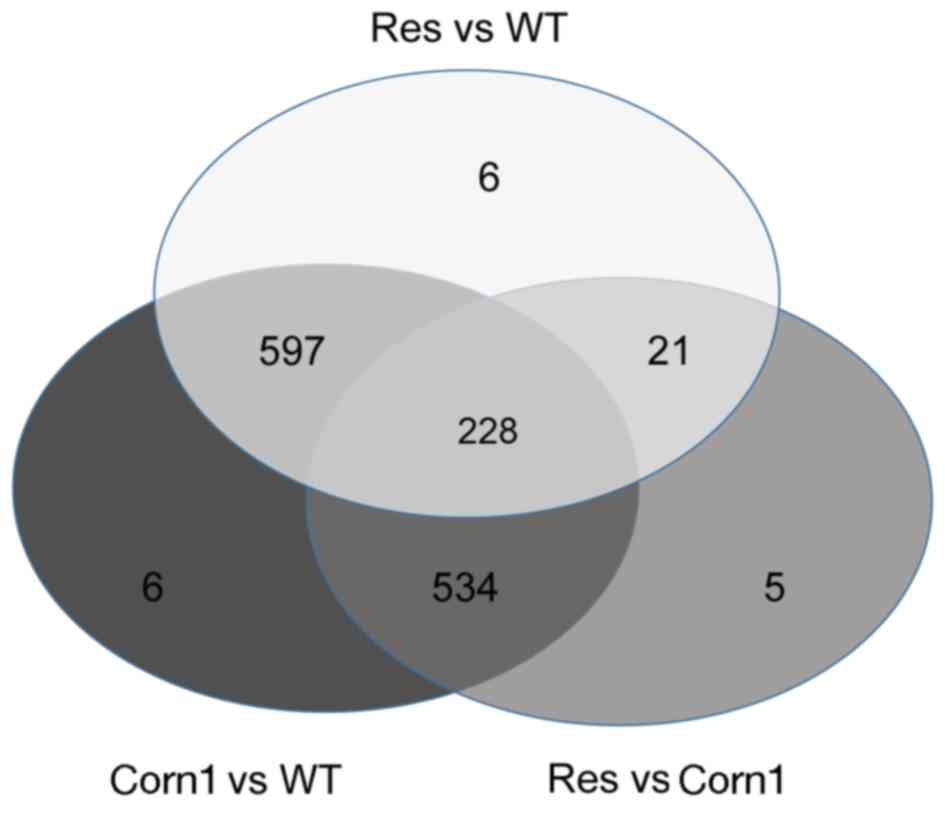
Dynamic comparison and hierarchical
cluster analysis of DEGs
Dynamic comparison analysis of DEGs among sample
groups revealed that the number of DEGs between corn1 and WT was
the greatest (n=1,365). Among these, 826 genes overlapped with DEGs
identified in the res vs. WT group, 763 genes overlapped with DEGs
identified in the res vs. corn1 group, whereas only 6 genes were
specific to the corn1 vs. WT group (Fig. 2). In addition, 228 common genes
were differentially expressed across all three groups (Fig. 2). These results reflected the
differences in expression between the three sample groups, with the
res phenotype representing the transition state between WT and
corn1 groups.
Hierarchical cluster analysis results are shown in
Fig. 3. The cluster analysis
demonstrated that the three groups exhibited distinct gene
expression patterns, and confirmed that the res phenotype
represented a transition state between WT and corn1 groups.
KEGG pathway enrichment analysis
The KEGG signaling pathways enriched by the
upregulated and downregulated DEGs are shown in Table I. In the corn1 vs. WT and the res
vs. WT groups, the upregulated DEGs were mainly enriched in the
cytokine-cytokine receptor interaction and cell adhesion molecule
signaling pathways, while the downregulated DEGs were mainly
enriched in signaling pathways associated with cellular metabolism.
Upregulated DEGs in the res vs. corn1 group were enriched in the
retinol metabolism pathway, while downregulated DEGs were primarily
enriched in the regulation of actin cytoskeleton (cofilin1
(CFL1) and CFL2) and mitogen-activated protein kinase
(MAPK) signaling pathways. In addition, the 228 overlapping DEGs
among the three groups were mainly enriched in the focal adhesion,
MAPK and regulation of actin cytoskeleton signaling pathways.
 | Table I.KEGG pathway enrichment analysis
showing the identified DEGs among the various mouse groups. |
Table I.
KEGG pathway enrichment analysis
showing the identified DEGs among the various mouse groups.
| KEGG term | Counta | P-value |
|---|
|
|---|
| A, Upregulated
DEGs |
|---|
| Corn1 vs. WT |
|
|
|
mmu04060: Cytokine-cytokine
receptor interaction | 47 |
9.47×10⁻¹⁷ |
|
mmu04514: CAMs | 21 |
3.32×10⁻⁵ |
|
mmu04670: Leukocyte
transendothelial migration | 18 |
3.84×10⁻⁵ |
|
mmu04062: Chemokine signaling
pathway | 23 |
4.15×10⁻⁵ |
|
mmu05322: Systemic lupus
erythematosus | 16 |
8.80×10⁻⁵ |
| Res vs. WT |
|
|
|
mmu04060: Cytokine-cytokine
receptor interaction | 41 |
1.17×10⁻¹⁷ |
|
mmu04640: Hematopoietic cell
lineage | 14 |
4.05×10⁻⁶ |
|
mmu04670: Leukocyte
transendothelial migration | 16 |
1.00×10⁻⁵ |
|
mmu04062: Chemokine signaling
pathway | 19 |
3.89×10⁻⁵ |
|
mmu04514: CAMs | 17 |
5.86×10⁻⁵ |
| Res vs. corn1 |
|
|
|
mmu00830: Retinol
metabolism | 4 |
4.62×10⁻² |
|
| B, Downregulated
DEGs |
|
|
|
| Corn1 vs. WT |
|
|
|
mmu00830: Retinol
metabolism | 8 |
1.71×10⁻⁴ |
|
mmu00982: Drug metabolism | 7 |
1.93×10⁻³ |
|
mmu00980: Metabolism of
xenobiotics by cytochrome P450 | 6 |
5.85×10⁻³ |
|
mmu04710: Circadian
rhythm | 3 |
2.11×10⁻² |
|
mmu00071: Fatty acid
metabolism | 4 |
4.41×10⁻² |
| Res vs. WT |
|
|
|
mmu00830: Retinol
metabolism | 5 |
5.03×10⁻³ |
|
mmu00982: Drug metabolism | 5 |
7.12×10⁻³ |
|
mmu04710: Circadian
rhythm | 3 |
7.54×10⁻³ |
|
mmu00980: Metabolism of
xenobiotics by cytochrome P450 | 4 |
2.99×10⁻² |
| Res vs. corn1 |
|
|
|
mmu04810: Regulation of actin
cytoskeleton | 16 |
1.43×10⁻⁴ |
|
mmu04510: Focal adhesion | 13 |
2.14×10⁻³ |
|
mmu04010: MAPK signaling
pathway | 14 |
8.59×10⁻³ |
|
mmu04270: Vascular smooth
muscle contraction | 8 |
2.17×10⁻² |
|
mmu00052: Galactose
metabolism | 4 |
2.42×10⁻² |
|
| C, Overlapping DEGs
(n=228) |
|
|
|
| mmu04510: Focal
adhesion | 8 |
1.64×10⁻² |
| mmu04010: MAPK
signaling pathway | 8 |
2.38×10⁻² |
| mmu04810:
Regulation of actin cytoskeleton | 7 |
3.01×10⁻² |
Pathway alteration score
The pathway alteration scores of the WT, corn1 and
res groups are shown in Fig. 4,
and the 10 most altered pathways among the three groups are shown
in Table II. Distance scores in
Table II indicate the degree of
deviation between corn1 or res groups from the WT group that is the
absolute difference value between the corn and res scores. WT group
served as a reference, and a high score indicated a greater degree
of alteration, whereas a low score indicated that corn1 or res
group mice were closer to the WT state. The pathways associated
with the cardiovascular system, glycometabolism and the
inflammatory response exhibited high pathway alteration scores. Of
these, the dilated cardiomyopathy signaling pathway demonstrated
the greatest score, and was enriched by particular DEGs, including
integrin beta 6 (ITGB6).
| Table II.Pathway alteration scores for the
deviation of corn1 and res groups from the WT group. |
Table II.
Pathway alteration scores for the
deviation of corn1 and res groups from the WT group.
| Pathway | Corn1 | Res |
Distancea |
|---|
| Dilated
cardiomyopathy | −0.1 | −0.53 | 0.43 |
| Vascular smooth
muscle contraction | −0.32 | −0.73 | 0.41 |
| Fructose and
mannose metabolism | 0.05 | −0.31 | 0.36 |
| Galactose
metabolism | 0.05 | −0.31 | 0.36 |
| MAPK signaling
pathway | −0.24 | −0.59 | 0.35 |
| Regulation of actin
cytoskeleton | −0.36 | −0.67 | 0.31 |
| Arachidonic acid
metabolism | 0 | −0.26 | 0.26 |
| Systemic lupus
erythematosus | −0.57 | −0.82 | 0.25 |
| Fatty acid
metabolism | 0.05 | −0.2 | 0.25 |
| Focal adhesion | −0.34 | −0.58 | 0.24 |
Discussion
Srf activation has been reported to be involved in
angiogenesis, the maintenance of cell hyperproliferation,
inflammation and F-actin accumulation in Dstncorn1 mice
(20). Notably, Srf is known to be
involved in the pathogenesis of multiple types of cancer, including
hepatocellular and colorectal cancer, demonstrating its potential
as a disease-causing factor (21,22).
In the present study, 228 common genes were differentially
expressed in the three groups (WT, corn1 and res), and were mainly
enriched in the focal adhesion, MAPK and regulation of actin
cytoskeleton signaling pathways. In addition, pathways associated
with the cardiovascular system, glycometabolism and the
inflammatory response displayed high pathway alteration scores.
These results may improve our understanding of the role of Srf in
normal and abnormal corneal tissue homeostasis.
In the present study, the actin cytoskeleton pathway
was demonstrated to be a significant pathway. In addition,
overlapping DEGs in all three groups were enriched for this
pathway. The actin cytoskeleton is essential for the maintenance of
cell morphology and mechanical support, as well as for the
regulation of diverse processes, including apoptosis, cell
adhesion, cell migration and phagocytosis (23). Furthermore, the actin cytoskeleton
is a critical barrier between the external environment of
surrounding cells and the internal cell signaling pathways, which
ultimately affects gene expression regulation (5). Ikeda et al (24) suggested that the appropriate
regulation of actin dynamics is necessary for the normal
maintenance of the corneal epithelium, and aberrant regulation of
the actin cytoskeleton leads to epithelial cell proliferation.
Notably, Srf is an essential regulator of the actin cytoskeleton,
and Srf target genes are known to be regulated by dynamic changes
in the actin cytoskeleton (8,25).
Thus, mutant Srf-mediated regulation of the actin cytoskeleton
pathway may serve an important role in the development of corneal
disease in Dstncorn1 mutant mice.
Previous studies have demonstrated that proteins
encoded by particular Srf target genes, such as CFL1 and
CFL2, serve key roles in actin treadmilling (26,27).
In the present study, CFL1 was enriched in the actin
cytoskeleton regulatory pathway. CFL1 is a member of the actin
depolymerizing factor/CFL family and is a primary regulator of
actin dynamics (28). It is
ubiquitously expressed and is crucial for efficient actin
depolymerization (29). Notably,
Ikeda et al (24)
demonstrated that CFL1 and DSTN have common functions; however,
compensatory mechanisms following functional loss of one actin
depolymerizing factor are insufficient to restore normal actin
dynamics in the cornea. Therefore, despite observing an
upregulation of CFL1 in the res group compared with the
corn1 group in the present study, CFL1 may have been unable to
completely regulate actin filament dynamics and compensate for the
loss of DSTN.
Cell hyperproliferation, angiogenesis and
inflammation are biological processes involved in the pathogenesis
of corneal disease, as well as in chronic inflammatory disorders
and tumorigenesis (3,4). Therefore, it is possible that
signaling pathways associated with cancer may be involved in the
progression of corneal disease in Dstncorn1 mutant mice.
For instance, the MAPK signaling pathway was significant in the
current study. Signaling to Srf occurs principally through the MAPK
signaling pathway, which stimulates the expression of cell
growth-promoting genes that encode proteins responsible for
directly activating genes involved in cell cycle progression and
growth factors (30,31). Cell cycle regulation is known to be
critical for the normal proliferation and development of
multicellular organisms (32). The
MAPK pathway is frequently activated in human cancer, which can
lead to a malignant phenotype through increased cell proliferation
(33). In the present study, the
MAPK signaling pathway was enriched by particular downregulated
DEGs in the res sample group, which indicates that Srf
knockout may have affected the function of this pathway. In
addition, pathway alteration analysis demonstrated that the dilated
cardiomyopathy signaling pathway exhibited the highest score, and
ITGB6 was revealed to be enriched in this pathway.
Integrins, consisting of α and β subunits, are a
family of cell surface receptors that mediate cell-to-cell adhesion
(34,35). Notably, integrins have been
reported to contribute to cell proliferation, apoptosis and the
regulation of gene expression, and have been suggested to serve
important roles in inflammation and tumorigenesis (34,36).
In the present study, ITGB6 was observed to be downregulated
in the res group compared with the corn1 group, which indicated
that ITGB6 may be targeted by Srf. ITGB6 is expressed
specifically in epithelial cells (34); thus, epithelial hyperproliferation
in the Dstncorn1 mice may be induced by upregulation of
ITGB6. Ultimately, the dilated cardiomyopathy signaling
pathway and ITGB6 may serve important roles in the process
of epithelial hyperproliferation and inflammation in the corneas of
Dstncorn1 mice.
In conclusion, the results of the present study
provide a comprehensive bioinformatics analysis of DEGs and
signaling pathways involved in the dynamic process of
Dstncorn1 mice returning to a WT-like state following
the conditional ablation of Srf from the corneal epithelium.
The actin cytoskeleton, MAPK and dilated cardiomyopathy signaling
pathways, as well as CFL1 and ITGB6 DEGs, may be
regulated by Srf to serve important roles in corneal disease
progression. These results may increase our understanding on the
role of Srf in corneal disease tissues. However, further genetic
and experimental studies with larger sample sizes are required to
confirm the results of the present study, and to identify
therapeutic targets for the treatment of corneal diseases.
Acknowledgements
The present study was supported by the National
Natural Science Foundation of China (grant no. 81200662), the
Zhejiang Provincial Natural Science Foundation of China (grant nos.
LY12H12010 and LY13H120002) and the Project of Zhejiang Provincial
Department of Health (grant no. 2013KYB141).
References
|
1
|
Verdoni AM, Schuster KJ, Cole BS, Ikeda A,
Kao WW and Ikeda S: A pathogenic relationship between a regulator
of the actin cytoskeleton and serum response factor. Genetics.
186:147–157. 2010. View Article : Google Scholar : PubMed/NCBI
|
|
2
|
Li Z, Cui H, Zhang L, Liu P and Bai J:
Prevalence of and associated factors for corneal blindness in a
rural adult population (the southern Harbin eye study). Curr Eye
Res. 34:646–651. 2009. View Article : Google Scholar : PubMed/NCBI
|
|
3
|
Allavena P, Garlanda C, Borrello MG, Sica
A and Mantovani A: Pathways connecting inflammation and cancer.
Curr Opin Genet Dev. 18:3–10. 2008. View Article : Google Scholar : PubMed/NCBI
|
|
4
|
D'Aura Swanson C, Paniagua RT, Lindstrom
TM and Robinson WH: Tyrosine kinases as targets for the treatment
of rheumatoid arthritis. Nat Rev Rheumatol. 5:317–324. 2009.
View Article : Google Scholar : PubMed/NCBI
|
|
5
|
Kawakami-Schulz SV, Verdoni AM, Sattler
SG, Jessen E, Kao WW, Ikeda A and Ikeda S: Serum response factor:
Positive and negative regulation of an epithelial gene expression
network in the destrin mutant cornea. Physiol Genomics. 46:277–289.
2014. View Article : Google Scholar : PubMed/NCBI
|
|
6
|
Zhou Q, Li Y and Chen B: The effect of
destrin mutations pathways on the gene expression profile. African
Journal of Pharmacy and Pharmacology. 6:1746–1752. 2012.
|
|
7
|
Qazi Y, Wong G, Monson B, Stringham J and
Ambati BK: Corneal transparency: Genesis, maintenance and
dysfunction. Brain Res Bull. 81:198–210. 2010. View Article : Google Scholar : PubMed/NCBI
|
|
8
|
Miano JM: SRF'ing the actin cytoskeleton
with no destrin. Physiol Genomics. 34:6–8. 2008. View Article : Google Scholar : PubMed/NCBI
|
|
9
|
Verdoni AM, Aoyama N, Ikeda A and Ikeda S:
Effect of destrin mutations on the gene expression profile in vivo.
Physiol Genomics. 34:9–21. 2008. View Article : Google Scholar : PubMed/NCBI
|
|
10
|
Murie C, Barette C, Lafanechère L and
Nadon R: Control-Plate Regression (CPR) normalization for
high-throughput screens with many active features. J Biomol Screen.
19:661–671. 2014. View Article : Google Scholar : PubMed/NCBI
|
|
11
|
Diboun I, Wernisch L, Orengo CA and
Koltzenburg M: Microarray analysis after RNA amplification can
detect pronounced differences in gene expression using limma. BMC
Genomics. 7:2522006. View Article : Google Scholar : PubMed/NCBI
|
|
12
|
Jahani M, Nematzadeh G, Dolatabadi B,
Hashemi SH and Mohammadi-Nejad G: Identification and validation of
functional markers in a global rice collection by association
mapping. Genome. 57:355–362. 2014. View Article : Google Scholar : PubMed/NCBI
|
|
13
|
Petushkova NA, Pyatnitskiy MA, Rudenko VA,
Larina OV, Trifonova OP, Kisrieva JS, Samenkova NF, Kuznetsova GP,
Karuzina II and Lisitsa AV: Applying of hierarchical clustering to
analysis of protein patterns in the human cancer-associated liver.
PLOs One. 9:e1039502014. View Article : Google Scholar : PubMed/NCBI
|
|
14
|
Zhai Y, Tchieu J and Saier MH Jr: A
web-based tree view (TV) program for the visualization of
phylogenetic trees. J Mol Microbiol Biotechnol. 4:69–70.
2002.PubMed/NCBI
|
|
15
|
Di Pietro C, Di Pietro V, Emmanuele G,
Ferro A, Maugeri T, Modica E, Pigola G, Pulvirenti A, Purrello M,
Ragusa M, et al: Anticlustal: Multiple sequence alignment by
antipole clustering and linear approximate 1-median computation.
Proc IEEE Comput Soc Bioinform Conf. 2:326–336. 2003.PubMed/NCBI
|
|
16
|
Chen X: Curve-based clustering of time
course gene expression data using self-organizing maps. J Bioinform
Comput Biol. 7:645–661. 2009. View Article : Google Scholar : PubMed/NCBI
|
|
17
|
Kanehisa M and Goto S: KEGG: Kyoto
encyclopedia of genes and genomes. Nucleic Acids Res. 28:27–30.
2000. View Article : Google Scholar : PubMed/NCBI
|
|
18
|
Huang DW, Sherman BT, Tan Q, Collins JR,
Alvord WG, Roayaei J, Stephens R, Baseler MW, Lane HC and Lempicki
RA: The DAVID Gene Functional Classification Tool: A novel
biological module-centric algorithm to functionally analyze large
gene lists. Genome Biol. 8:R1832007. View Article : Google Scholar : PubMed/NCBI
|
|
19
|
Eickhoff SB, Schleicher A, Scheperjans F,
Palomero-Gallagher N and Zilles K: Analysis of neurotransmitter
receptor distribution patterns in the cerebral cortex. Neuroimage.
34:1317–1330. 2007. View Article : Google Scholar : PubMed/NCBI
|
|
20
|
Verdoni AM, Schuster KJ, Cole BS, Ikeda A,
Kao WW and Ikeda S: Deletion of serum response factor rescues the
cornea defects caused by the loss of actin depolymerizing factor
(ADF/Destrin) in mouse. Genetics. July 6–2010.(Epub ahead of
print). doi: 0.1534/genetics.110.117309.
|
|
21
|
Bai S, Nasser MW, Wang B, Hsu SH, Datta J,
Kutay H, Yadav A, Nuovo G, Kumar P and Ghoshal K: MicroRNA-122
inhibits tumorigenic properties of hepatocellular carcinoma cells
and sensitizes these cells to sorafenib. J Biol Chem.
284:32015–32027. 2009. View Article : Google Scholar : PubMed/NCBI
|
|
22
|
Choi H, Kim KR, Lee JH, Park HS, Jang KY,
Chung MJ, Hwang SE, Yu HC and Moon WS: Serum response factor
enhances liver metastasis of colorectal carcinoma via alteration of
the E-cadherin/b-catenin complex. Oncol Rep. 21:57–63.
2009.PubMed/NCBI
|
|
23
|
Dos Remedios C, Chhabra D, Kekic M, Dedova
I, Tsubakihara M, Berry D and Nosworthy N: Actin binding proteins:
Regulation of cytoskeletal microfilaments. Physiol Rev. 83:433–473.
2003. View Article : Google Scholar : PubMed/NCBI
|
|
24
|
Ikeda S, Cunningham LA, Boggess D, Hawes
N, Hobson CD, Sundberg JP, Naggert JK, Smith RS and Nishina PM:
Aberrant actin cytoskeleton leads to accelerated proliferation of
corneal epithelial cells in mice deficient for destrin (actin
depolymerizing factor). Hum Mol Genet. 12:1029–1036. 2003.
View Article : Google Scholar : PubMed/NCBI
|
|
25
|
Miano JM, Long X and Fujiwara K: Serum
response factor: Master regulator of the actin cytoskeleton and
contractile apparatus. Am J Physiol Cell Physiol. 292:C70–C81.
2007.PubMed/NCBI
|
|
26
|
Kanellos G, Zhou J, Patel H, Ridgway RA,
Huels D, Gurniak CB, Sandilands E, Carragher NO, Sansom OJ, Witke
W, et al: ADF and Cofilin1 control actin stress fibers, nuclear
integrity, and cell survival. Cell Rep. 13:1949–1964. 2015.
View Article : Google Scholar : PubMed/NCBI
|
|
27
|
Maciver SK and Hussey PJ: The ADF/cofilin
family: Actin-remodeling proteins. Genome Biol.
3:reviews30072002.PubMed/NCBI
|
|
28
|
Carlier MF, Laurent V, Santolini J, Melki
R, Didry D, Xia GX, Hong Y, Chua NH and Pantaloni D: Actin
depolymerizing factor (ADF/cofilin) enhances the rate of filament
turnover: Implication in actin-based motility. J Cell Biol.
136:1307–1322. 1997. View Article : Google Scholar : PubMed/NCBI
|
|
29
|
Ichetovkin I, Grant W and Condeelis J:
Cofilin produces newly polymerized actin filaments that are
preferred for dendritic nucleation by the Arp2/3 complex. Curr
Biol. 12:79–84. 2002. View Article : Google Scholar : PubMed/NCBI
|
|
30
|
Khachigian LM and Collins T: Inducible
expression of Egr-1-dependent genes a paradigm of transcriptional
activation in vascular endothelium. Circ Res. 81:457–461. 1997.
View Article : Google Scholar : PubMed/NCBI
|
|
31
|
Gineitis D and Treisman R: Differential
usage of signal transduction pathways defines two types of serum
response factor target gene. J Biol Chem. 276:24531–24539. 2001.
View Article : Google Scholar : PubMed/NCBI
|
|
32
|
Zhang W and Liu HT: MAPK signal pathways
in the regulation of cell proliferation in mammalian cells. Cell
Res. 12:9–18. 2002. View Article : Google Scholar : PubMed/NCBI
|
|
33
|
Sumimoto H, Imabayashi F, Iwata T and
Kawakami Y: The BRAF-MAPK signaling pathway is essential for
cancer-immune evasion in human melanoma cells. J Exp Med.
203:1651–1656. 2006. View Article : Google Scholar : PubMed/NCBI
|
|
34
|
Breuss JM, Gallo J, DeLisser HM,
Klimanskaya IV, Folkesson HG, Pittet JF, Nishimura SL, Aldape K,
Landers DV, Carpenter W, et al: Expression of the beta 6 integrin
subunit in development, neoplasia and tissue repair suggests a role
in epithelial remodeling. J Cell Sci. 108:2241–2251.
1995.PubMed/NCBI
|
|
35
|
Alam N, Goel HL, Zarif MJ, Butterfield JE,
Perkins HM, Sansoucy BG, Sawyer TK and Languino LR: The
integrin-growth factor receptor duet. J Cell Physiol. 213:649–653.
2007. View Article : Google Scholar : PubMed/NCBI
|
|
36
|
Garlick DS, Li J, Sansoucy B, Wang T,
Griffith L, FitzGerald T, Butterfield J, Charbonneau B, Violette
SM, Weinreb PH, et al: α(V)β(6) integrin expression is induced in
the POET and Pten(pc−/−) mouse models of prostatic inflammation and
prostatic adenocarcinoma. Am J Transl Res. 4:165–174.
2012.PubMed/NCBI
|