Introduction
Dysmenorrhea is a common gynecological disorder,
occurring during adolescence and throughout reproductive maturity
(1). There are two categories;
primary and secondary dysmenorrhea. Primary dysmenorrhea (PD)
accounts for >90% of dysmenorrhea patients and occurs in the
absence of other diseases, while secondary dysmenorrhea is caused
by a disease of the reproductive organs, such as endometriosis
(1). Dysmenorrhea is characterized
by spasmodic pain in the hypogastric and lumbar regions between,
prior to and during menstruation, with severe patients experiencing
fainting (1). According to
previous epidemiological studies using multiple survey methods,
primary dysmenorrhea occurs in 20–90% of women (2,3).
Although primary dysmenorrhea is not life-threatening, the degree
of pain severely affects women's quality of life and ability to
work normally. Therefore, the study of clinical treatments for
primary dysmenorrhea is of great importance. The luteal regression
stage, where the corpus luteum degenerates in the absence of
pregnancy, is an important period during the menstrual cycle, and
hormonal and endocrinal changes during this time affect the
occurrence and development of dysmenorrhea (4).
Metabolomics is a discipline that studies the set of
metabolites present at a point in time in vivo, and how
surroundings, physiology, pathology and genetic mutations influence
the makeup of the metabolome (5).
Metabolites are closely associated with phenotypic changes and are
often the end result of disease-associated endogenous substance
perturbations (6). Urine
metabolomics is a non-invasive analysis method that is normally
used in screening for disease, but has great potential in studies
of metabolomics. Ultra performance liquid chromatography coupled
with quadrupole-time-of-flight mass spectrometry (UPLC-Q/TOF-MS) is
a powerful method of analysis, advantageous due to more faster
analyses, shorter time and increased separation efficiency compared
with other traditional instruments (7,8). Due
to this high throughput, high sensitivity and high accuracy, it is
possible to dynamically analyze urine to identify and resolve
metabolic differences in endogenous substances in vivo. The
results can provide clinical guidance in the study of disease
mechanisms.
Previous studies have primarily been concerned with
researching menstruation biomarkers (9). To the best of our knowledge, the
mechanisms underlying dysmenorrhea during the luteal regression
stage have not yet been reported, making research on the luteal
regression stage mechanisms of PD urgently required. Therefore, the
changes in endogenous substances during the luteal regression stage
were studied, using urine metabolomics combined with receiver
operator characteristic (ROC) curves to verify biomarkers.
Initially, a UPLC-Q/TOF-MS technique was used to generate a
metabolomic profile of urine samples from patients with PD, as well
as healthy controls. Principal component analysis (PCA) and partial
least squares discriminate analysis (PLS-DA) were used to identify
metabolite perturbations. Next, the classification performance
(specificity and sensitivity) was verified using the area under the
curve (AUC) of the ROC curves. The present study aimed to confirm
the endogenous metabolites present at the luteal regression stage
and seek potential PD biomarkers from among them. The results of
this may assist in the clinical treatment of PD.
Materials and methods
Study subjects and design
The present study was reviewed and approved by the
Tianjin University of Traditional Chinese Medicine. The samples
used in the present study originated from the same volunteers used
by Fang et al (9), and so
shared demographic and clinical characteristics. The group included
36 patients with clinically diagnosed PD and 27 healthy controls
from the Affiliated Hospital of Tianjin University of Chinese
Medicine (Tianjin, China) and Tianjin Maternity Hospital (Tianjin,
China). Urine was collected from PD patients and healthy controls
during the luteal regression stage, and informed consent was
obtained from all participants prior to sample collection. Each
volunteer provided written answers detailing age, weight, height,
personal and family history of menstrual cramps, and dysmenorrhea
pain integral. The pain integral was >8 in all patients with PD.
The selection criteria for patients with PD were in accordance with
the diagnostic criteria established by the People's Republic of
China Ministry of Health Pharmaceutical Council (10) and the National Higher School
Teaching Materials Obstetrics and Gynecology, Seventh Edition
(11).
Collection of urine samples
Urine samples were collected as described previously
(9), and collection was consistent
with the clinical inclusion criteria (morning urine collected three
days prior to menstruation, and the volume of each sample
recorded). Following this, each sample was loaded into 10 ml
centrifuge tube, and 1% sodium azide was added. The samples were
subjected to centrifugation at 765 × g at 4°C for 15 min. The
supernatant was stored at −80°C until analysis.
Urine sample preparation
Urine samples and quality control (QC) samples were
prepared as previously described (9). QC samples were mixture of urine from
PD patients and healthy controls. Urine samples were prepared as
follows: Samples were thawed at room temperature and centrifuged at
8,497 × g at 4°C for 10 min. Next, 200 µl liquid supernatant was
added to 200 µl pure water. The liquid was subsequently vortexed
for 1 min and centrifuged at 14,360 × g at 4°C for 15 min. Finally,
all samples were injected into UPLC-Q/TOF mass spectrometer for
analysis. QC samples were prepared as follows: 8 samples were
selected from each group by random sampling. QC samples were
centrifuged at 8,497 × g at 4°C for 10 min. Liquid supernatant (200
µl) was then added to 200 µl pure water, vortexed for 1 min and
centrifuged at 14,360 × g at 4°C for 15 min. QC samples were
analyzed once every 6 h and used to test instrument stability,
ensuring that conditions remained the same throughout the
analysis.
UPLC-Q/TOF-MS analysis
The liquid chromatograph used was the Waters ACQUITY
UPLC system (Waters Corporation, Milford, MA, USA). Supernatant (5
µl) was injected into ACQUITY UPLC BEH C18 columns (2.1 mm × 100
mm; 1.7 µm; Waters Corporation). The column temperature was set at
45°C and the flow rate was 0.3 ml min-1. The gradient system
consisted of mobile phase A (0.1% formic acid in water) and mobile
phase B (0.1% formic acid in acetonitrile) as follows: 0–8.5 min,
1–25% B; 8.5-11 min, 25–50% B; 11–13 min, 50–90% B; 13–15 min,
90–99% B; 15–17 min, 99% B; 17–18.5 min, 99–1% B; 18.5-20 min, 1% B
(9).
Mass spectrometry was performed on a Waters
Micromass QTOF Micro Synapt high definition mass spectrometer
(Waters Corporation). Electrospray ionization (ESI) was used in
positive mode. Ion source parameters were as follows: Capillary
voltage, 3.0 kV; cone voltage, 30 V; nebulizer pressure, 350 psi;
nitrogen gas temperature, 325°C; cone gas flow, 50 l/h; desolvation
gas flow, 600 l/h; source temperature, 120°C; desolvation
temperature, 350°C; 0.1 sec (interval 0.02 sec) collected once
spectrum data and scanned at mass range of m/z 50–1,100.
Data processing and multivariate
analysis
Data was initially exported using MarkerLynx V4.1
(Waters Corporation) with peak discovery, peak alignment and raw
data filtering to determine potential discriminant variables. A
data array that included retention time, m/z values and normalized
peak area was then obtained. The multivariate data matrix was
exported into SIMCA-P 12.0 software (MKS Instruments, Andover, MA,
USA) for PCA and PLS-DA analysis. The PCA model is a statistical
sample of the principal contradiction reaction and can resolve the
main factor multivariate data, as well as reflect the main
features. The data space is compressed, and characteristics of
multivariate data in a low-dimensional space are expressed through
visual effects. The PLS-DA model was fitted following the
adaptation of the data. According to the classification pattern
recognition model, compounds were chosen depending on whether they
have an important contribution. These data further validate the
differences in the compounds between PD patients and healthy
controls through metabolic differences in the luteal regression
stage (12,13). Cross-validation tests were sorted
through for verification. Evaluating urine PLS-DA models requires a
higher R2Y value, and Q2 values for these parameters typically.
R2X, R2Y and Q2 are larger in the present model, and the R2Y and Q2
are closer to 1, demonstrating the accuracy of the model result
(14). Variable-importance plots
(VIP) values >1 were used to screen potential biomarkers.
Unpaired Student's t-tests were used to determine statistically
significant differences between biomarkers in patients with PD and
healthy controls. P<0.05 was considered to indicate a
statistically significant difference.
Resulting candidate biomarkers were selected based
on their molecular weights and use of the formula to predict the
elemental composition of a compound. The database was then used to
retrieve documents and metabolite candidates, and the candidates
were finally confirmed using metabolic standards, references and
tandem mass spectrometry information, such as the Human Metabolome
Database (HMDB; http://www.hmdb.ca/) (15–17)
and MassBank (http://www.massbank.jp/). Related
metabolites were submitted to a correlation analysis of metabolic
pathways associated with metabolic pathway analysis (MetPA)
(18) and the Kyoto Encyclopedia
of Genes and Genomes (KEGG; http://www.genome.jp/kegg/) (19).
Results
Metabolomic profiling analysis
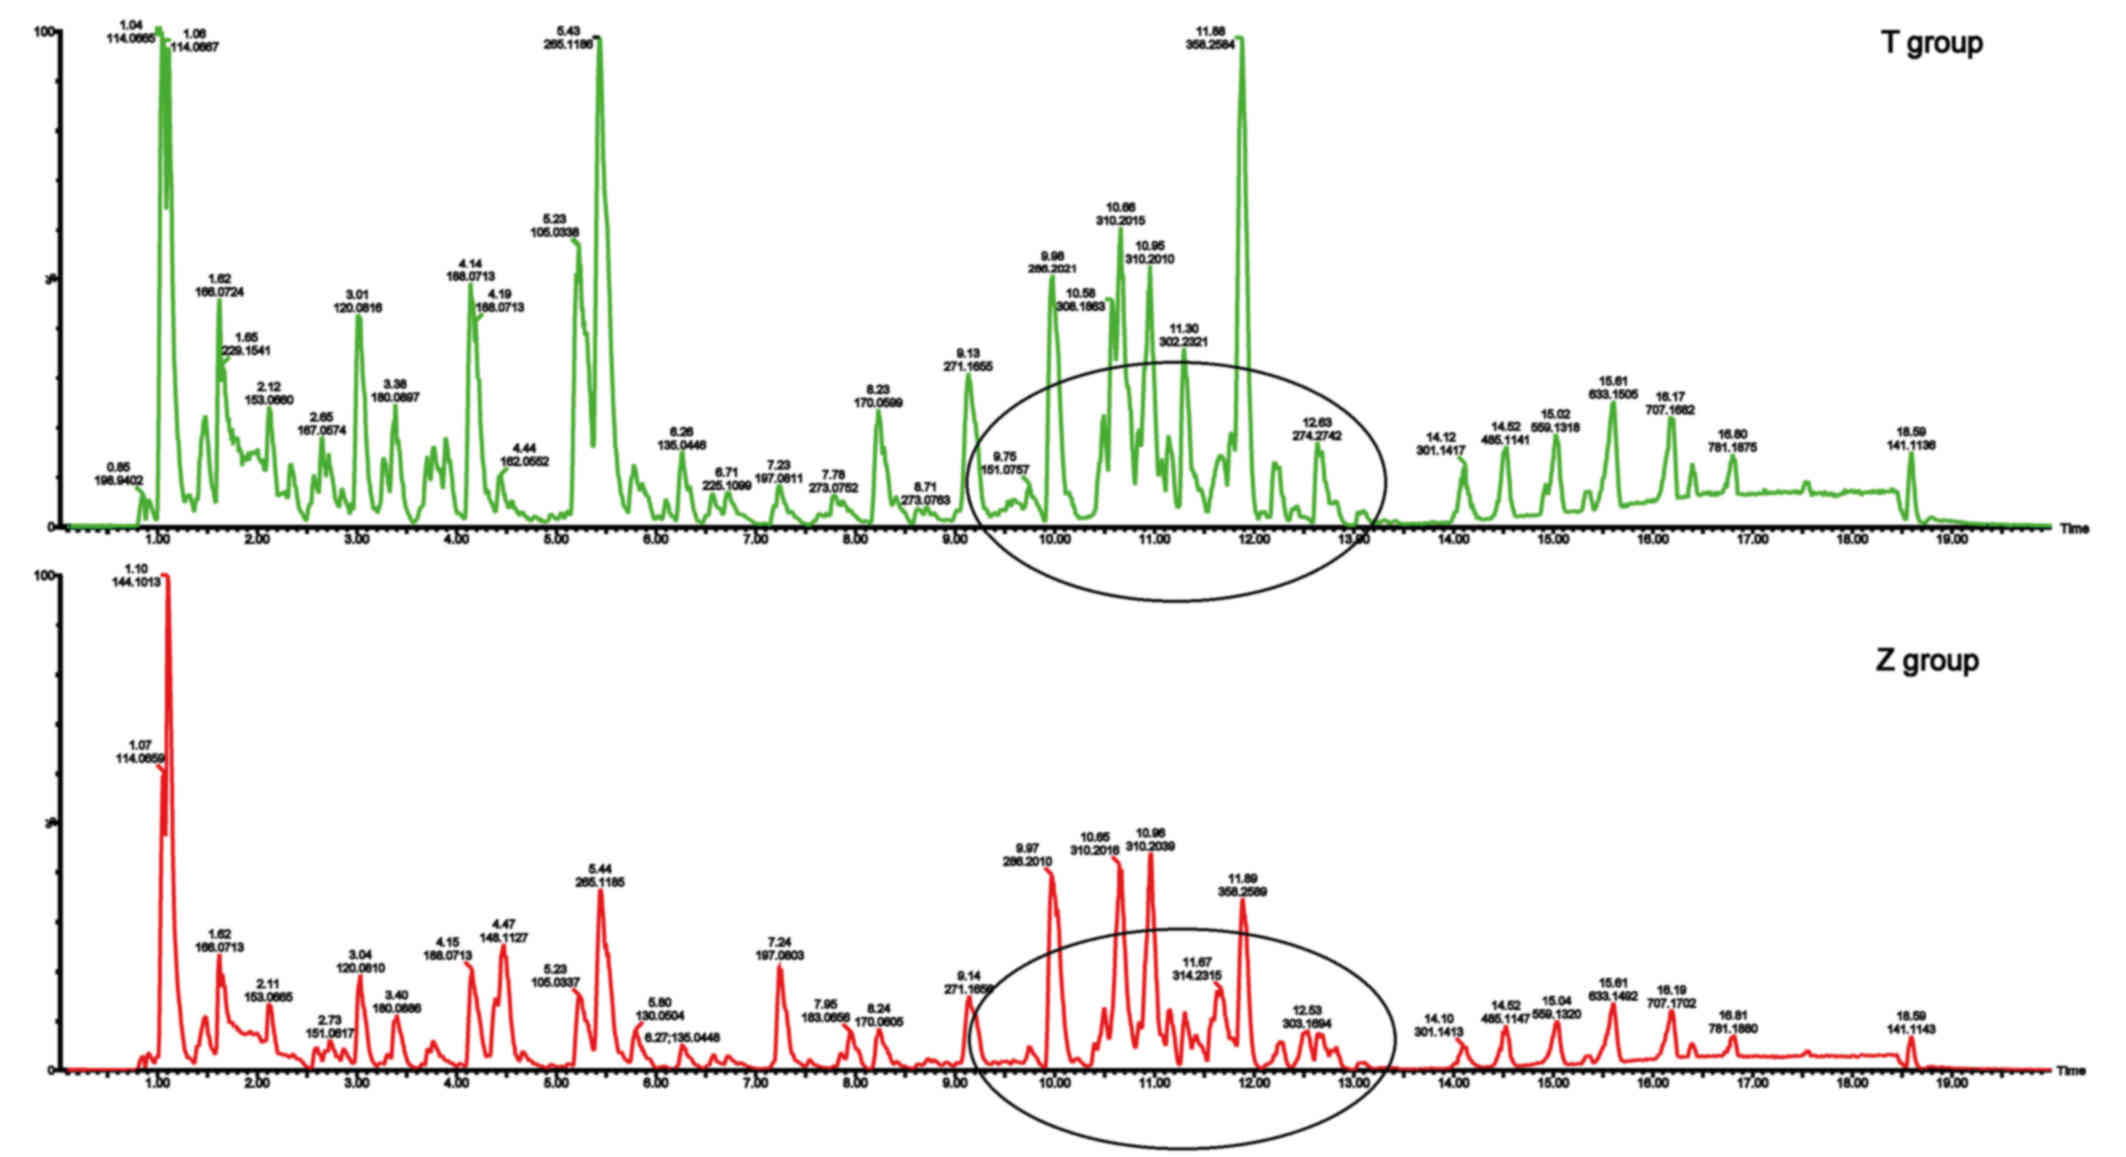
Urinary metabolic fingerprints of patients with
primary dysmenorrhea (T group) and healthy controls (Z group)
during the luteal regression stage are displayed in Fig. 1. Several different peak intensities
were clearly detected from the typical base peak intensity (BPI),
which indicates two sets of data with metabolite differences in
Fig. 1.
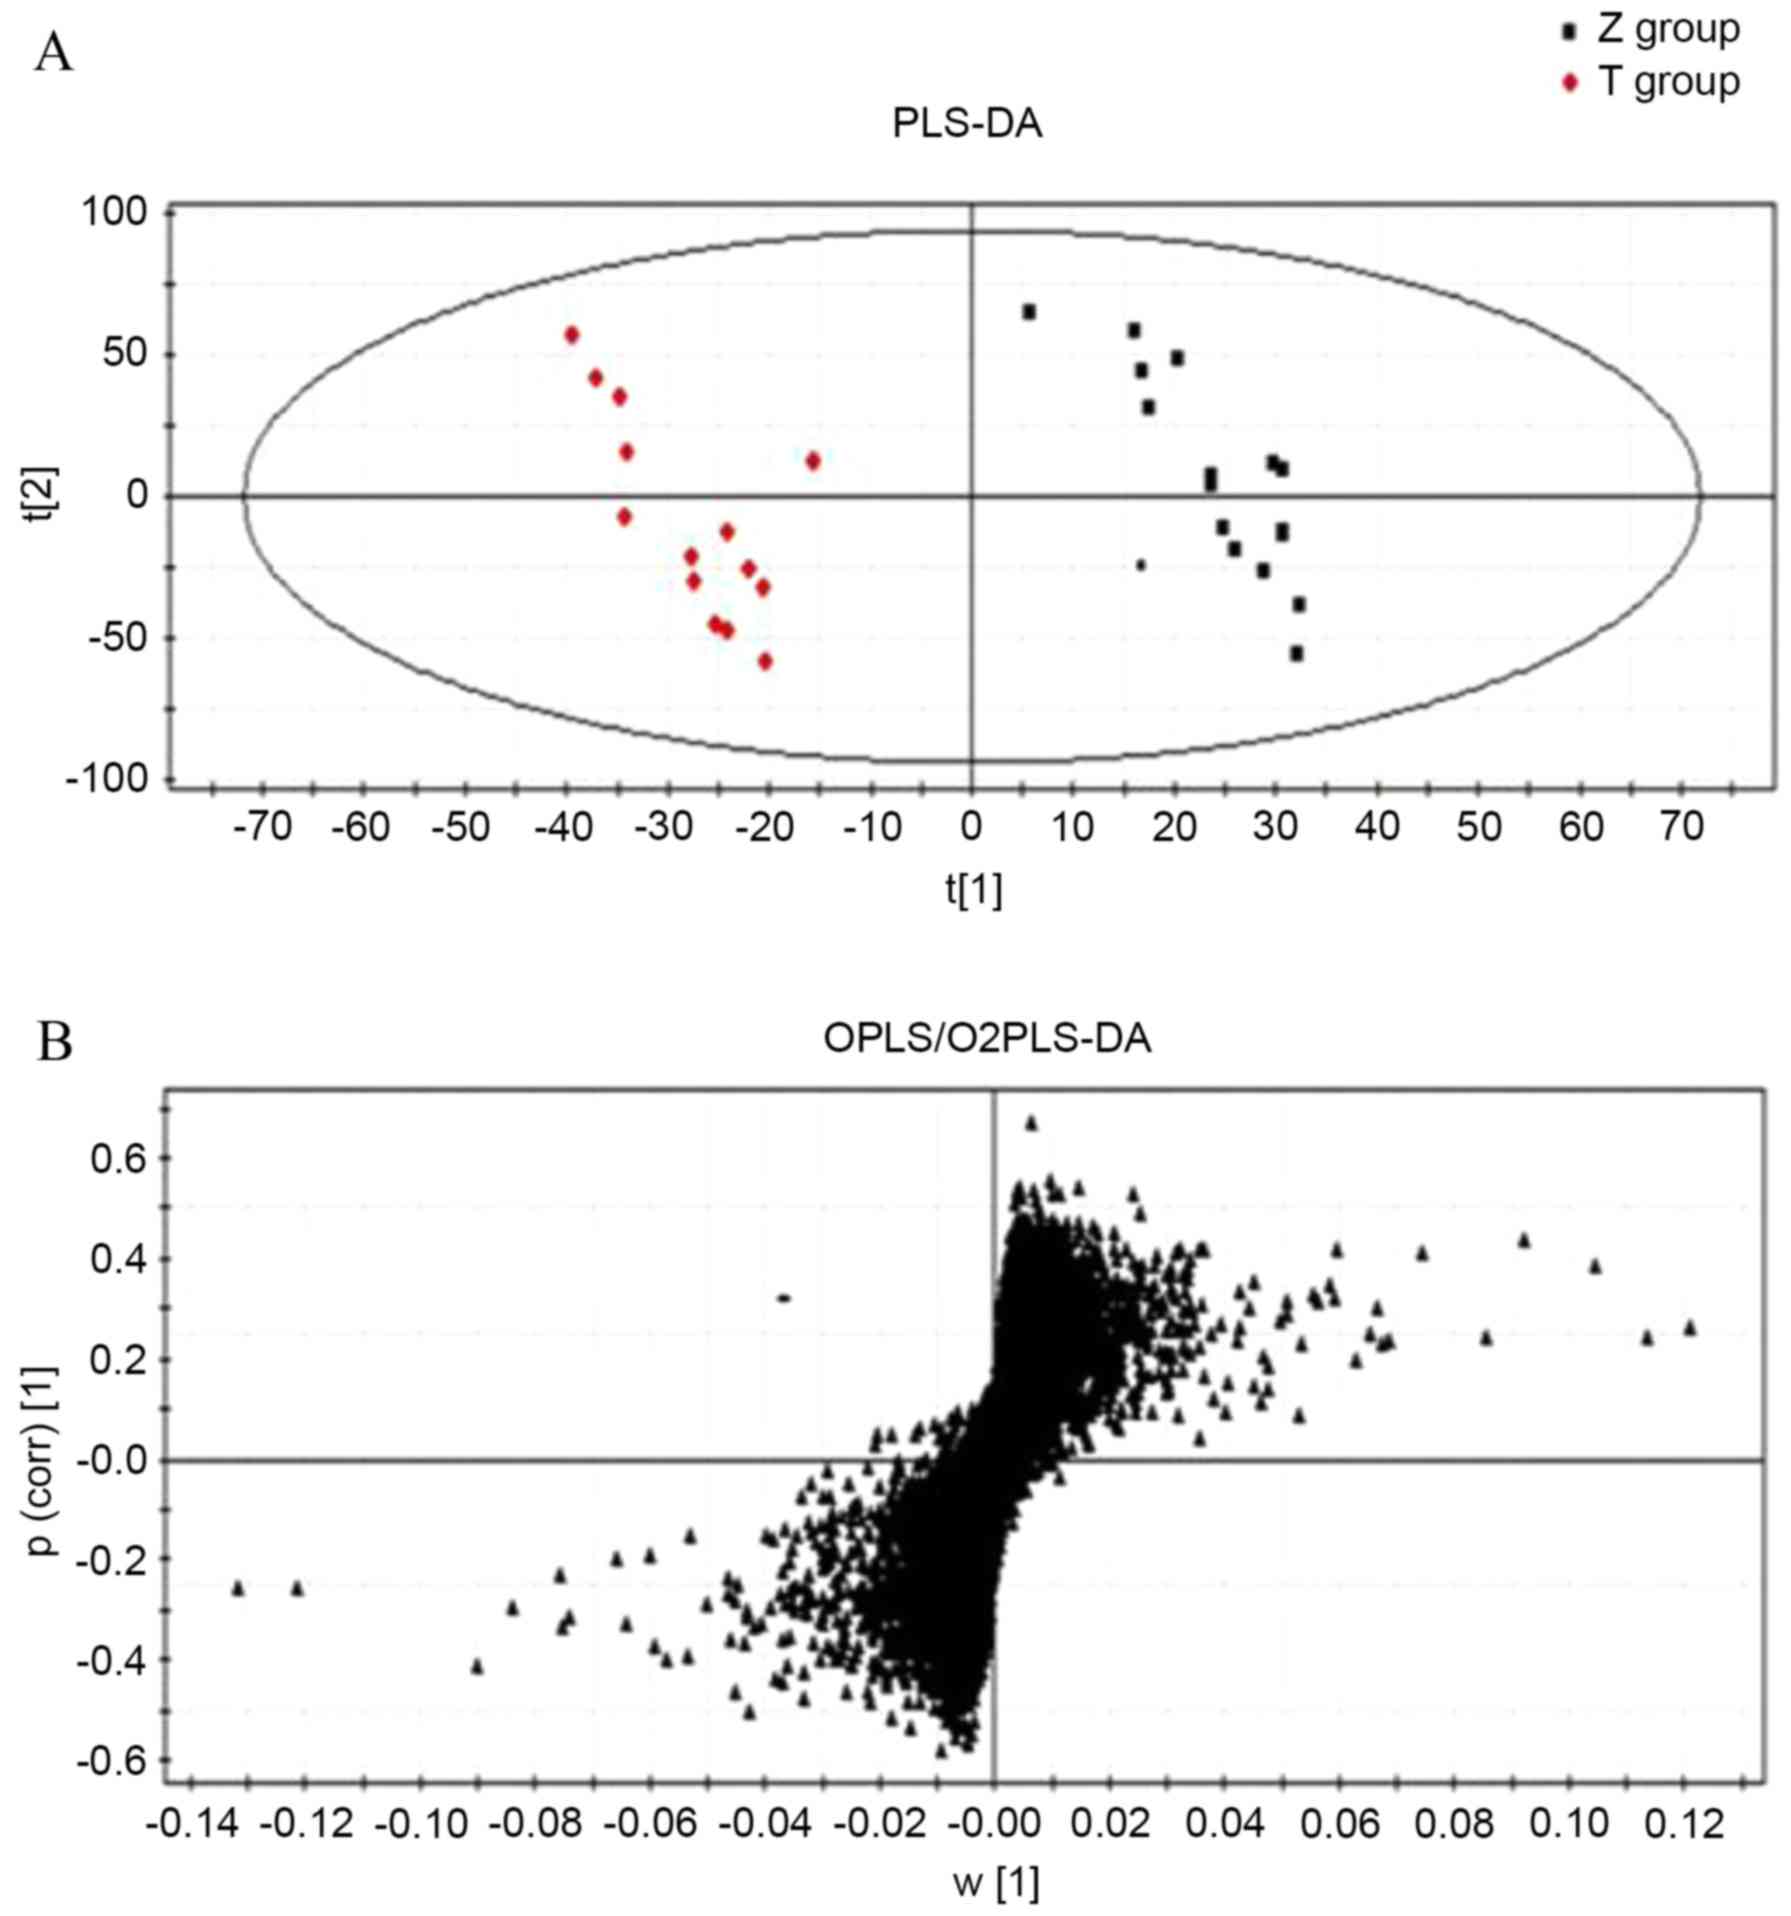
Data were processed using multivariate statistical
analysis methods (Fig. 2). In the
PCA scatter plot, each point represents a volunteer sample, making
it possible to visually discern the differences between the
samples. In addition, anomalous samples can be identified and
removed (20,21) to improve the accuracy of the model.
PLS-DA (Fig. 2A) was used to
identify the metabolites that differentiate patients with PD from
the healthy controls. The R2Y and Q2 of the
PLS-DA model were 0.992 and 0.806, respectively, demonstrating the
accuracy of the model. Finally, a VIP value >1 and unpaired
Student's t-tests were used to identify metabolites with
significant differences as potential biomarkers. Following this, a
score plot (S-plot) of the PLS-DA was used to identify potential
discriminatory metabolites (Fig.
2B). Metabolites that are distal from the origin and close to
the vertical axis of the S-plot are the differentiating
metabolites.
Identification of biomarkers
PLS-DA analysis VIP values with >1 ion were used
to identify candidate biomarkers. Significantly different
endogenous compounds during the luteal regression stage were
considered to be the differentiating compounds between patients
with PD and healthy controls, resulting in the identification of 10
specific biomarkers. Levels of citrulline, ornithine,
androstenedione, progesterone, phytosphingosine, dihydrocortisol
and 17-hydroprogesterone were significantly decreased in patients
with PD compared with healthy controls during the luteal regression
stage (P=0.0426, P=0.0071, P=0.0040, P=0.0359, P=0.0360, P=0.0454
and P=0.0235, respectively; Table
I) and levels of sphinganine, histidine and
15-keto-prostaglandin F2α were significantly increased in patients
with PD compared with healthy controls during the luteal regression
stage (P=0.0136, P=0.0107 and P=0.0001, respectively; Table I).
 | Table I.Identified metabolites for
discrimination between PD patients and healthy controls in urine
samples. |
Table I.
Identified metabolites for
discrimination between PD patients and healthy controls in urine
samples.
|
| tR
(min) | Metabolite | Obsd
[M+H]+ | Calcd
[M+H]+ | Errorc (ppm) | P-value | Formula | Content
changed (T/Z) | Pathway |
|---|
| 1 | 10.19 |
Ornithinea | 133.1017 | 133.1015 |
1.50 | 0.0071 |
C5H12N2O2 | ↓ | Arginine and
proline metabolism |
| 2 |
0.78 |
Histidinea | 156.0781 | 156.0775 |
3.85 | 0.0107 |
C6H9N3O2 | ↑ | Histidine
metabolism |
| 3 | 0.98 |
Citrullinea | 176.1036 | 176.1038 | −1.14 | 0.0426 |
C6H13N3O3 | ↓ | Arginine and
proline metabolism |
| 4 | 10.50 |
Androstenedionea | 287.1995 | 287.1991 |
1.40 | 0.0040 |
C19H26O2 | ↓ | Steroid hormone
biosynthesis |
| 5 | 12.82 |
Sphinganineb | 302.3108 | 302.3110 | −0.66 | 0.0136 |
C18H39NO2 | ↑ | Sphingolipid
metabolism |
| 6 | 10.41 |
Progesteronea | 315.2318 | 315.2314 |
1.27 | 0.0359 |
C21H30O2 | ↓ | Steroid hormone
biosynthesis |
| 7 | 12.30 |
Phytosphingosinea | 318.3054 | 318.3048 |
1.88 | 0.0360 |
C18H39NO3 | ↓ | Sphingolipid
metabolism |
| 8 |
9.69 |
17-Hydroxyprogesteroneb | 331.2241 | 331.2239 |
0.60 | 0.0235 |
C21H30O3 | ↓ | Steroid hormone
biosynthesis |
| 9 | 10.25 |
15-Keto-prostaglandin F2αb | 353.2293 | 353.2287 |
1.70 | 0.0001 |
C20H32O5 | ↑ | Arachidonic acid
metabolism |
| 10 | 10.46 |
Dihydrocortisolb | 365.2336 | 365.2330 |
1.68 | 0.0454 |
C21H32O5 | ↓ | Steroid hormone
biosynthesis |
Metabolite m/z values were used to determine the
probable molecular formula using the HMDB database (15–17).
Of these compounds, 4 were identified using authentic standards and
6 were identified by comparing the fragments based on their
molecular ion information and MS/MS data. An example is
17-hydroxyprogesterone, which exhibited an accurate biomarker mass
([M+H]+ at m/z 331.2241) in the mass spectrum. In
positive ion mode, the MS/MS contains the fragment ions m/z 195.1
[M+H-C9H12O]+ and m/z 138.0
[M+H-C12H17O2]+. The
HMDB database was also used to confirm the results (15–17).
Biomarker verification
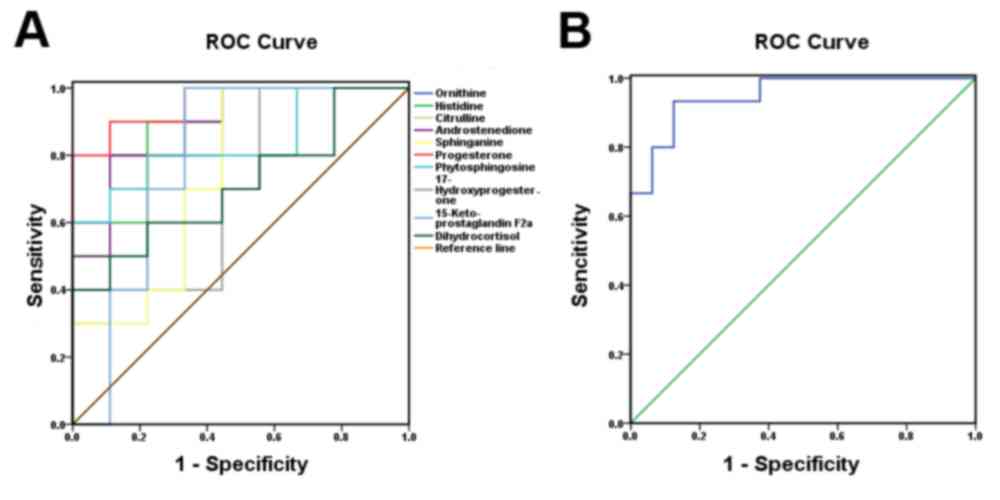
To determine the sensitivity and specificity of the
10 biomarkers identified in the luteal regression stage, SPSS 17.0
(SPSS Inc., Chicago, IL, USA) was used to analyze the ROC curves of
the biomarkers. The ROC curves were regarded as a potential
diagnosis threshold for the test results, and the sensitivity and
specificity were calculated and evaluated. Data were plotted as
1-specificity on the × axis and sensitivity on the y axis (Fig. 3). The ROC curve is proximal to the
upper left (Fig. 3B, blue line),
and the largest point boundary value of the Youden index (22) is the threshold. Therefore, the
sensitivity and specificity of the test are greater, and the rates
of misdiagnoses and missed diagnoses are relatively low. With
regard to the plotted curve and 45° oblique linear contrast, if
most of the curve coincides with the independent variable, the
value is a poor predictive value for the dependent variable. If the
data curves away from the 45° oblique line more than the
independent variable, the value is a better predictive value for
the dependent variable. In the present study the biomarkers with
AUC >0.7 were considered to have an important role in patients
with PD. Finally, as demonstrated in (Fig. 3A), the AUC of 6 metabolites was
>0.8. Thus, 6 important biomarker candidates were identified.
The combination of the 10 biomarkers' AUC at the 95% confidence
interval was 0.950, indicating high sensitivity and specificity
during the luteal regression stage (Fig. 3B).
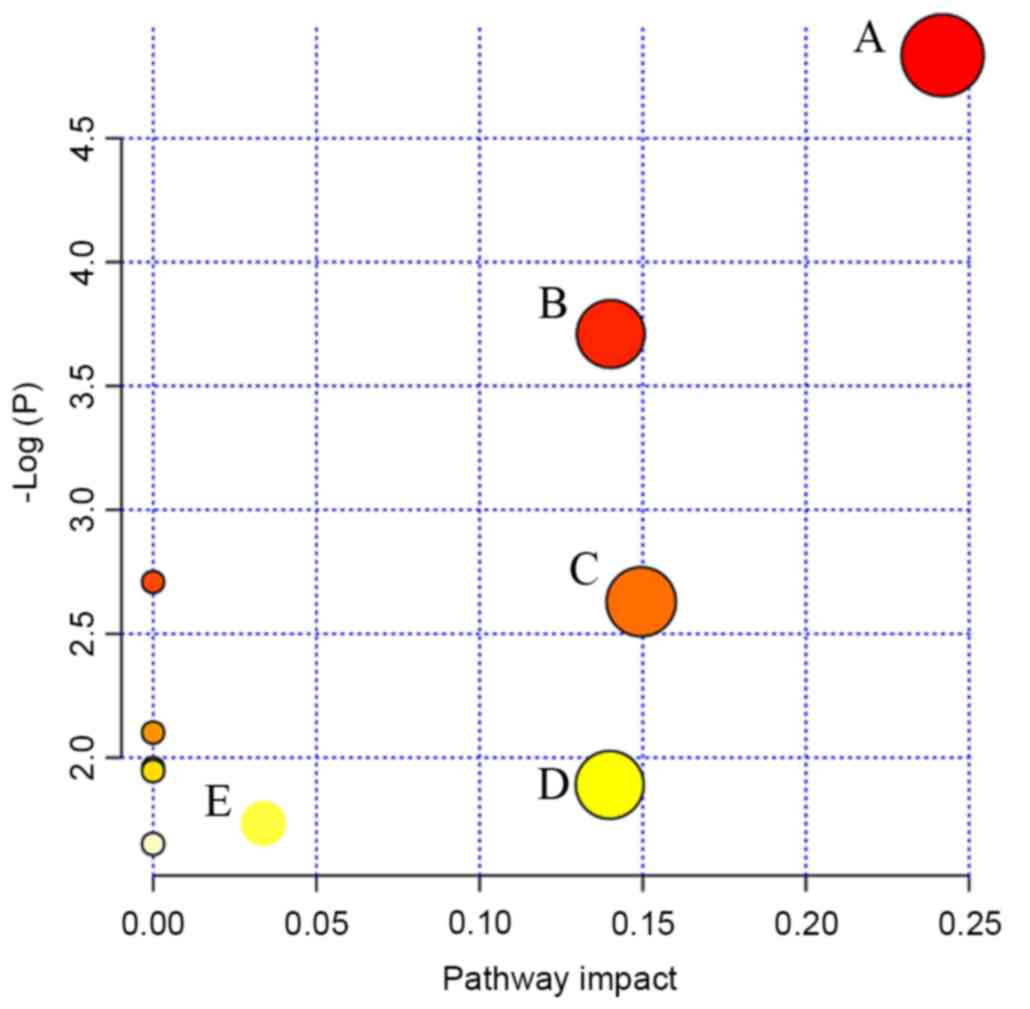
Metabolic pathways
MetPA (18), which
uses a library of metabolic pathways from the KEGG (19), was used for metabolic pathway
analyses of potential biomarkers (Fig.
4). The abscissa is the impact of the pathways. Where the
pathway impact value calculated from the pathway topology analysis
is >0, that pathway is likely associated with PD. It was
revealed that steroid hormone biosynthesis, sphingolipid
metabolism, arginine and proline metabolism, histidine metabolism
and arachidonic acid metabolism were perturbed at the luteal
regression stage in patients with PD (Fig. 4). Finally, the disturbed metabolic
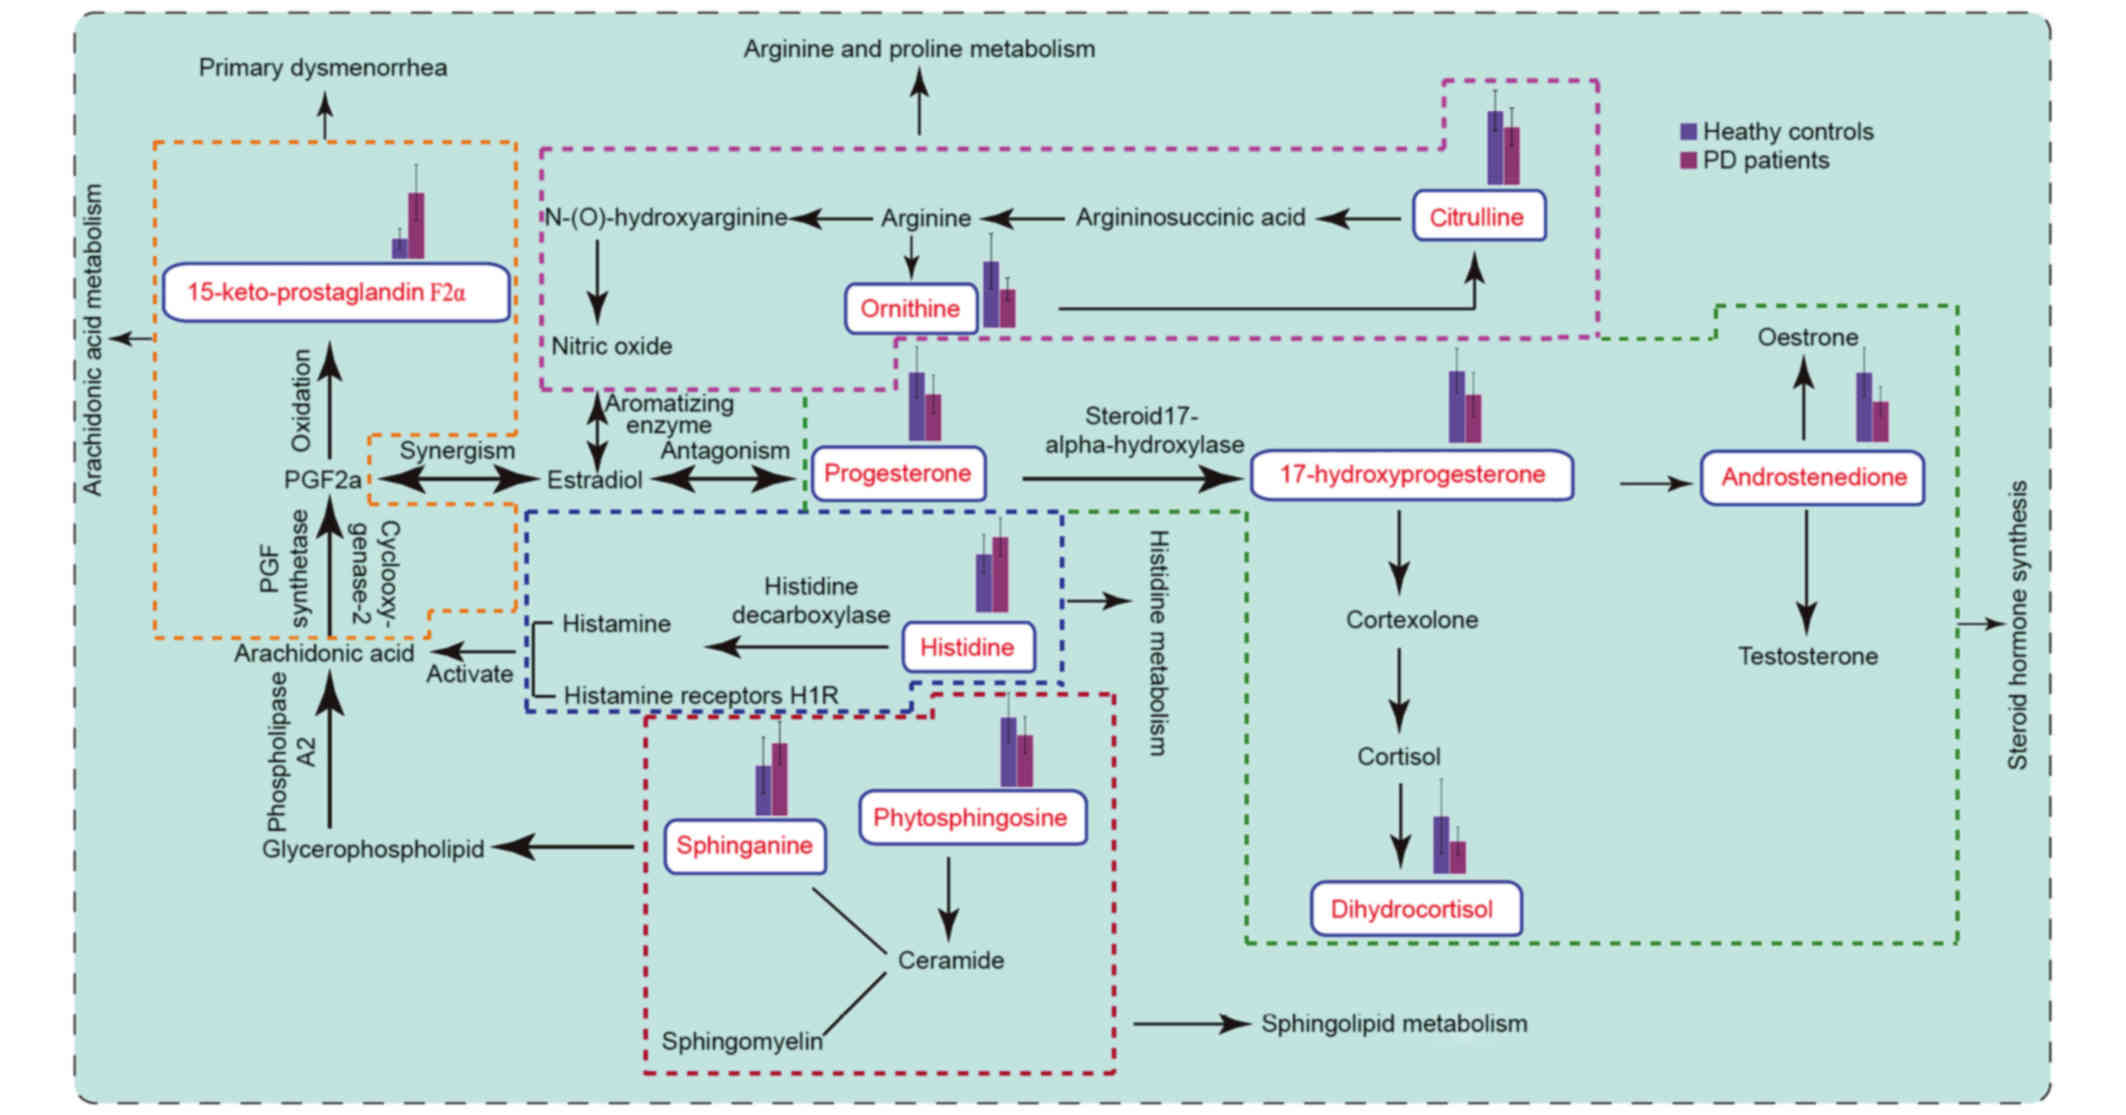
pathways detected by UPLC-Q/TOF-MS analysis were analyzed (Fig. 5).
Discussion
PD is associated with hormonal substance changes
in vivo, and fatty acid buildup in cell membrane
phospholipids (23,24). The present study surveyed metabolic
variations in patients with PD using UPLC-Q/TOF-MS-based
metabolomics during the luteal regression stage. A clear metabolic
difference was observed between patients with PD and healthy
controls, with citrulline, ornithine, androstenedione,
progesterone, phytosphingosine, dihydrocortisol and
17-hydroxyprogesterone levels decreased and sphinganine, histidine
and 15-keto-prostaglandin F2α levels increased in patients with PD
compared with healthy controls during the luteal regression
stage.
Figure 5
illustrates the disturbed metabolic pathways that were detected by
UPLC-Q/TOF-MS analysis. Phytosphingosine is converted into ceramide
and sphingosine 1 phosphate, and ceramide is converted into
sphingosine and sphingomyelin. Sphingosine is an important cell
membrane component, being a nerve receptor ligand, a signal
transduction effect factor and, in addition, involved in the
binding of prostaglandin E2 (PGE2) and prostaglandin F2α (PGF2α) to
the appropriate receptor during signal transduction processes
(25,26). Phospholipids in the cell membrane
are converted into arachidonic acid by phospholipase A2. Following
this, cyclic oxidase and PGF synthase generate PGF2α. PGF2α has a
strong vasoconstrictory effect, and is involved in the contraction
of uterine smooth muscle. Furthermore, 15-ketone-prostaglandin F2α
is a PGF2α metabolite, and the level of 15-ketone-prostaglandin F2α
was increased in patients with PD. This may lead to uterine
contractions, resulting in dysmenorrhea during the luteal
regression stage. In addition, increased prostaglandin levels may
increase peripheral nerve pain perception (27,28).
Progesterone, androstenedione, dihydrocortisol and
17-hydroxyprogesterone are the metabolic products of steroids,
which are a class of bioactive compounds derived from cholesterol.
Cholesterol is converted into pregnenolone, which is converted into
progesterone by mitochondrial enzymes and isomerases. Initially,
progesterone uses 17-hydroxylase to form 17-hydroxyprogesterone,
and 17-hydroxyprogesterone is converted into androstenedione by
carbon chain lyase. Previous studies have demonstrated that PGF2α
levels in the uterine muscle layer positively correlate with
estradiol levels and negatively correlate with progesterone levels
in the uterine vein. Increased estradiol levels accelerate PGF2α
synthesis and release, as well as cause uterine blood vessel spasms
and thus dysmenorrhea, but progesterone antagonizes this reaction
(29). During luteal regression,
progesterone levels in patients with PD was significantly lower
than in the healthy control, and estradiol levels were increased.
It has previously been reported that the level of progesterone
decreased in mice when the animal's pain threshold decreased, but
no pain was detected when progesterone secretion levels were high
(30). In addition,
dihydrocortisol is involved in cortisol metabolism, and in
vitro experiments have demonstrated that cortisol increases the
prostaglandin levels in uterine smooth muscle tissue and increases
myometrial contractions (31). The
results of the present study also suggest that changes in
prostaglandin levels may induce dysmenorrhea during luteal
regression.
Histidine is converted to histamine by histamine
decarboxylase. Histamine is a metabolite in mast cells and
typically exists in an inactive binding state. Mast cells exist in
the female reproductive system and are widely distributed in the
human uterine muscle layer. Histamine indirectly regulates normal
uterine smooth muscle contraction through activation of its
receptors (32,33). Previous studies indicate that
activation of the histamine receptor increases pain sensitivity in
mice (34). An increase in
histidine content leads to an increase in histamine content, which
increases uterine smooth muscle contractions and resulted in
dysmenorrhea (34).
Arginine is the precursor of nitric oxide (NO) and
ornithine, which are involved in citrulline synthesis. Nitric oxide
is a neurotransmitter involved in modulating peripheral and central
pain level, and is important for nervous and immune system
regulation. Through the NO-cyclic guanosine monophosphate pathway,
NO induces both pain and analgesic effects: When reduced, NO
induces pain and results in dysmenorrhea, but when increased it
inhibits the induced pain. During luteal regression, ornithine and
citrulline are involved in arginine metabolism (35). When ornithine and citrulline levels
were reduced, nitric oxide content was reduced and its analgesic
effect suppressed, resulting in dysmenorrhea (36). Therefore, in future studies, drug
interventions targeting these metabolic pathway biomarkers will be
used to alleviate pain, to reduce the distress caused by PD and to
discern the optimal time of administration.
By comparing PD biomarkers between menstruation and
luteal regression in patients with PD, it was revealed that primary
dysmenorrhea patients are affected by perturbations to steroid
metabolic pathways during the menstrual period and luteal
regression stage (9). The
hypothalamus-pituitary-gonadal axis is important for hormone
regulation during the menstrual cycle (37). The main ovarian hormones, estrogen
and progesterone, regulate menstruation (38). Progesterone is able to promote
estradiol transformation into low active estrone, thereby
generating reduced prostaglandin, which consequently reduces the
extent of uterine smooth muscle contraction and alleviates
dysmenorrhea. In the present study, it was observed that the
progesterone levels decreased, and also possibly that the
prostaglandin levels increased, which were consistent with previous
reports (39). Estrogen is able to
stimulate PGF2α and vasopressin synthesis, which is released in the
uterine spiral artery walls, mediated via PGF2α receptors. PGF2α,
in combination with its receptor, leads to the contraction of local
blood vessels, and reduced blood flow to the uterus and muscle, due
to pain-induced ischemia/hypoxia. Similarly, vasopressin causes the
muscle layers of small blood vessels of the uterus to contract,
leading to uterine ischemia and pain (27). If a target biomarker is converted
to a PD-associated form during luteal regression, and a drug
targeting this biomarker is applied during luteal regression, PD
may be attenuated. If this occurs, pain in patients with PD may be
reduced during menstruation (40).
Therefore, discovering these important biomarkers in the luteal
regression stage is essential for treating PD.
To conclude, in the present study a UPLC-Q/TOF-MS
analysis was used to create metabolic profiles of urine samples
during luteal regression, and indicated that metabolomic profiles
of patients with PD deviated from the healthy controls. In total,
10 biomarkers were identified in patients with PD during luteal
regression, associated with sphingolipid metabolism, steroid
hormone biosynthesis and arginine and proline metabolism. ROC
curves were used to evaluate biomarker sensitivities and
specificities during luteal regression. These results are
consistent with the theory of traditional Chinese medicine (TCM)
syndrome differentiation, and may help provide novel targets for
the treatment of PD.
Acknowledgements
The present study was supported by The Research
Programs of Application of Basic and Frontier Technology in Tianjin
(grant no. 13JCYBJC23900), Tianjin University Undergraduates
Teaching Quality and Teaching Reform Project (grant no. B07-1008)
and the Program for Changjiang Scholars and Innovative Research
Team in University (grant no. IRT_14R41).
Glossary
Abbreviations
Abbreviations:
|
PD
|
primary dysmenorrhea
|
|
UPLC-Q/TOF-MS
|
ultra performance liquid
chromatography quadrupole-time-of-flight mass spectrometry
|
|
PCA
|
principal component analysis
|
|
PLS-DA
|
partial least squares discriminate
analysis
|
|
ROC
|
receiver operating characteristic
|
|
AUC
|
area under the curve
|
|
TCM
|
traditional Chinese medicine
|
|
QC
|
quality control
|
|
VIP
|
variable-importance plots
|
|
PGE2
|
prostaglandin E2
|
|
PGF2α
|
prostaglandin F2α
|
References
|
1
|
French L: Dysmenorrhoea. Am Fam Physician.
71:285–291. 2005.PubMed/NCBI
|
|
2
|
Banikarim C, Chacko MR and Kelder SH:
Prevalence and impact of dysmenorrhea on Hispanic female
adolescents. Arch Pediatr Adolesc Med. 154:1226–1229. 2000.
View Article : Google Scholar : PubMed/NCBI
|
|
3
|
Davis AR and Westhoff CL: Primary
dysmenorrhea in adolescent girls and treatment with oral
contraceptives. J Pediatr Adolesc Gynecol. 14:3–8. 2001. View Article : Google Scholar : PubMed/NCBI
|
|
4
|
Wallace M, Hashim YY, Wingfield M,
Culliton M, McAuliffe F, Gibney MJ and Brennan L: Effects of
menstrual cycle phase on metabolomic profiles in premenopausal
women. Hum Reprod. 25:949–956. 2010. View Article : Google Scholar : PubMed/NCBI
|
|
5
|
Nicholson JK and Lindon JC: Systems
biology: Metabonomics. Nature. 455:1054–1056. 2008. View Article : Google Scholar : PubMed/NCBI
|
|
6
|
Vellodi A: Lysosomal storage disorders. Br
J Haematol. 128:413–431. 2005. View Article : Google Scholar : PubMed/NCBI
|
|
7
|
Plumb RS, Johnson KA, Rainville P, Smith
BW, Wilson ID, Castro-Perez JM and Nicholson JK:
UPLC/MSE; a new approach for generating molecular
fragment information for biomarker structure elucidation. Rapid
Commun Mass Spectrom. 20:1989–1994. 2006. View Article : Google Scholar : PubMed/NCBI
|
|
8
|
Michopoulos F, Lai L, Gika H, Theodoridis
G and Wilson I: UPLC-MS-based analysis of human plasma for
metabonomics using solvent precipitation or solid phase extraction.
J Proteome Res. 8:2114–2121. 2009. View Article : Google Scholar : PubMed/NCBI
|
|
9
|
Fang L, Dai N, Wang L, Zhang XX, Liu XY,
Wang YM and Li YB: Urine metabolomic study of primary dysmenorrhea
patients during menstrual period using an ultra performance liquid
chromatography coupled with quadrupole-time-of-flight mass
spectrometry (UPLC-Q-TOF-MS). RSC Adv. 4:44208–44213. 2014.
View Article : Google Scholar
|
|
10
|
People's Republic of China Ministry of
Health Pharmaceutical Council: Chinese medicine treatment of
dysmenorrhea clinical research guidelines. The National Ministry of
Health; China: pp. 263–266. 1993
|
|
11
|
Yue J: Obstetrics and Gynecology. 318.
7th. People's Health Publishing House; China: 2008
|
|
12
|
Wang X, Wang H, Zhang A, Lu X, Sun H, Dong
H and Wang P: Metabolomics study on the toxicity of aconite root
and its processed products using ultraperformance
liquid-chromatography/electrospray-ionization synapt
high-definition mass spectrometry coupled with pattern recognition
approach and ingenuity pathways analysis. J Proteome Res.
11:1284–1301. 2012. View Article : Google Scholar : PubMed/NCBI
|
|
13
|
Wang X, Zhang A, Wang P, Sun H, Wu G, Sun
W, Lv H, Jiao G, Xu H, Yuan Y, et al: Metabolomics coupled with
proteomics advancing drug discovery toward more agile development
of targeted combination therapies. Mol Cell Proteomics.
12:1226–1238. 2013. View Article : Google Scholar : PubMed/NCBI
|
|
14
|
Legido-Quigley C, Stella C, Perez-Jimenez
F, Lopez-Miranda J, Ordovas J, Powell J, van-der-Ouderaa F, Ware L,
Lindon JC, Nicholson JK and Holmes E: Liquid chromatography-mass
spectrometry methods for urinary biomarker detection in metabonomic
studies with application to nutritional studies. Biomed Chromatogr.
24:737–743. 2010. View
Article : Google Scholar : PubMed/NCBI
|
|
15
|
Wishart DS, Tzur D, Knox C, Eisner R, Guo
AC, Young N, Cheng D, Jewell K, Arndt D, Sawhney S, et al: HMDB:
The human metabolome database. Nucleic Acids Res. 35:(Database
issue). D521–D526. 2007. View Article : Google Scholar : PubMed/NCBI
|
|
16
|
Wishart DS, Knox C, Guo AC, Eisner R,
Young N, Gautam B, Hau DD, Psychogios N, Dong E, Bouatra S, et al:
HMDB: A knowledgebase for the human metabolome. Nucleic Acids Res.
37:(Database issue). D603–D610. 2009. View Article : Google Scholar : PubMed/NCBI
|
|
17
|
Wishart DS, Jewison T, Guo AC, Wilson M,
Knox C, Liu YF, Djoumbou Y, Mandal R, Aziat F, Dong E, et al: HMDB
3.0-The human metabolome database in 2013. Nucleic Acids Res.
41:(Database issue). D801–D807. 2013. View Article : Google Scholar : PubMed/NCBI
|
|
18
|
Xia J and Wishart DS: MetPA: A web-based
metabolomics tool for pathway analysis and visualization.
Bioinformatics. 26:2342–2344. 2010. View Article : Google Scholar : PubMed/NCBI
|
|
19
|
Kanehisa M, Sato Y and Morishima K:
BlastKOALA and GhostKOALA: KEGG tools for functional
characterization of genome and metagenome sequences. J Mol Biol.
428:726–731. 2016. View Article : Google Scholar : PubMed/NCBI
|
|
20
|
Rousseeuw PJ and Hubert M: Robust
statistics for outlier detection. WIREs Data Mining and Knowledge
Discovery. 1:73–79. 2011. View
Article : Google Scholar
|
|
21
|
Huberta M, Rousseeuwb PJ and Branden KV:
ROBPCA: A new approach to robust principal component analysis.
Technometrics. 47:64–79. 2005. View Article : Google Scholar
|
|
22
|
Kumar R and Indrayan A: Receiver operating
characteristic (ROC) curve for medical researchers. Indian Pediatr.
48:277–287. 2011. View Article : Google Scholar : PubMed/NCBI
|
|
23
|
Marsh EE, Shaw ND, Klingman KM,
Tiamfook-Morgan TO, Yialamas MA, Sluss PM and Hall JE: Estrogen
levels are higher across the menstrual cycle in African-American
women compared with Caucasian women. J Clin Endocrinol Metab.
96:3199–3206. 2011. View Article : Google Scholar : PubMed/NCBI
|
|
24
|
Cornel KM, Kruitwagen RF, Delvoux B,
Visconti L, Van de Vijver KK, Day JM, Van Gorp T, Hermans RJ,
Dunselman GA and Romano A: Overexpression of 17β-hydroxysteroid
dehydrogenase type 1 increases the exposure of endometrial cancer
to 17β-estradiol. J Clin Endocrinol Metab. 97:E591–E601. 2012.
View Article : Google Scholar : PubMed/NCBI
|
|
25
|
Arulkumaran S, Kandola MK, Hoffman B,
Hanyaloglu AC, Johnson MR and Bennett PR: The roles of
prostaglandin EP 1 and 3 receptors in the control of human
myometrial contractility. J Clin Endocrinol Metab. 97:489–498.
2012. View Article : Google Scholar : PubMed/NCBI
|
|
26
|
Li S, Zhang ZQ, Wu LJ, Zhang XG, Li YD and
Wang YY: Understanding ZHENG in traditional Chinese medicine in the
context of neuro-endocrine-immune network. IET Syst Biol. 1:51–60.
2007. View Article : Google Scholar : PubMed/NCBI
|
|
27
|
Su S, Duan J, Wang P, Liu P, Guo J, Shang
E, Qian D, Tang Y and Tang Z: Metabolomic study of biochemical
changes in the plasma and urine of primary dysmenorrhea patients
using UPLC-MS coupled with a pattern recognition approach. J
Proteome Res. 12:852–865. 2013. View Article : Google Scholar : PubMed/NCBI
|
|
28
|
Harel Z: A contemporary approach to
dysmenorrhea in adolescents. Pediatric Drugs. 4:797–805. 2002.
View Article : Google Scholar : PubMed/NCBI
|
|
29
|
Xue Z, Liu CZ, Gao SZ and Ma YX: The
herbal-partitioned moxibustion for primary dysmenorrhea and it's
impact on reproductive endocrinal function of patients. Zhongguo
Zhen Jiu. 34:209–212. 2014.(In Chinese). PubMed/NCBI
|
|
30
|
Sternberg WF, Mogil JS, Kest B, Page GG,
Leong T, Yam V and Liebeskind JC: Neonatal testosterone exposure
influences neurochemistry of non-opioid swim stress induced
analgesia in adult mice. Pain. 63:321–326. 1995. View Article : Google Scholar : PubMed/NCBI
|
|
31
|
Morimoto K and Oku M: Effect of
progesterone, cortisol and dehydroepiandrosterone-sulfate on
prostaglandin production by cultured human myometrial cells. Nihon
Sanka Fujinka Gakkai zasshi. 47:391–397. 1995.(In Japanese).
PubMed/NCBI
|
|
32
|
Brown RE, Steven DR and Haas HL: The
physiology of brain histamine. Prog Neurobiol. 63:637–672. 2001.
View Article : Google Scholar : PubMed/NCBI
|
|
33
|
He S, McEuen AR, Blewett SA, Li P, Buckley
MG, Leufkens P and Walls AF: The inhibition of mast cell activation
by neutrophil lactoferrin: Uptake by mast cells and interaction
with tryptase, chymase and cathepsin G. Biochem Pharmacol.
65:1007–1015. 2003. View Article : Google Scholar : PubMed/NCBI
|
|
34
|
Mobarakeh JI, Sakurada S, Katsuyama S,
Kutsuwa M, Kuramasu A, Lin ZY, Watanabe T, Hashimoto Y, Watanabe T
and Yanai K: Role of histamine H(1) receptor in pain perception: A
study of the receptor gene knockout mice. Eur J Pharmacol.
391:81–89. 2000. View Article : Google Scholar : PubMed/NCBI
|
|
35
|
Yallampalli C, Izumi H, Byamsmith M and
Garfield RE: An L-arginine-nitric oxide-cyclic guanosine
monophosphate system exists in the uterus and inhibits
contractility during pregnancy. Am J Obstet Gynecol. 170:175–185.
1994. View Article : Google Scholar : PubMed/NCBI
|
|
36
|
Bodelsson G, Sjöbery NO and Stjernquist M:
Contractile effect of endothelin in the human uterine artery and
autoradiographic localization of its binding sites. Am J Obstet
Gynecol. 167:745–750. 1992. View Article : Google Scholar : PubMed/NCBI
|
|
37
|
Roozendaal MM: Stress and the
hypothalamus-pituitary-gonadal axis in the cyclic rat. Stress &
the Hypothalamus Pituitary Gonadal Axis in the Cyclic Rat.
136:1997.
|
|
38
|
Sherman BM and Korenman SG: Hormonal
characteristics of the human menstrual cycle throughout
reproductive life. J Clin Invest. 55:699–706. 1975. View Article : Google Scholar : PubMed/NCBI
|
|
39
|
Rani M, Singh U, Agrawal GG, Natu SM, Kala
S, Ghidiyal A and Srivastava N: Impact of yoga nidra on menstrual
abnormalities in females of reproductive age. J Altern Complement
Med. 19:925–929. 2013. View Article : Google Scholar : PubMed/NCBI
|
|
40
|
Dawood MY: Primary dysmenorrhea: Advances
in pathogenesis and management. Obstet Gynecol. 108:428–441. 2006.
View Article : Google Scholar : PubMed/NCBI
|