Introduction
Kidney renal clear cell carcinoma (KIRC) is the
eighth most common type of cancer, which accounts for the majority
of malignant kidney tumors (1).
KIRC is known to be associated with radiotherapy and chemotherapy
resistance (2), and the 2-year
survival rate of patients with metastatic KIRC is <20% (3,4).
Early diagnosis and surgical resection may result in a good
prognosis; therefore, further investigations regarding the genomic
alterations and underlying molecular mechanisms of KIRC are
essential for improvements in early diagnosis and treatment.
Certain advances have been made in unveiling the
complicated molecular mechanisms underlying KIRC, since numerous
relevant pathways have been implicated in its pathogenesis.
Components of the mammalian target of rapamycin pathway have been
reported to be significantly associated with the pathological
features and survival of KIRC (5).
Frequent mutations in genes encoding ubiquitin-mediated proteolysis
pathway components have also been observed in KIRC (6). The Sonic hedgehog signaling pathway
(7) and MYC pathway (8) are also activated in KIRC and serve a
role in tumor growth. Furthermore, numerous biomarkers have been
identified, including cluster of differentiation 70 (8), succinate dehydrogenase B (8) and transforming growth factor beta 1
(9). Nevertheless, further studies
are required to identify novel prognostic genes and provide
potential therapeutic targets.
Previous studies have focused on the identification
of differentially expressed genes, which may serve roles in the
pathogenesis of KIRC (10,11). The present study performed a gene
co-expression network analysis and a survival analysis on RNA-seq
data in order to screen out prognostic genes in KIRC. These
findings may help improve understanding regarding the pathogenesis
of KIRC, and also provide potential markers for prognosis and
treatment.
Materials and methods
Gene expression data
RNA-seq (Illumina RNASeqV2, Level 3; Illumina, San
Diego, CA, USA) rsem.gene.results data of KIRC were downloaded from
The Cancer Genome Atlas (TCGA; https://cancergenome.nih.gov/) on September 25, 2015,
including 533 KIRC samples. Clinical information, including status,
follow-up time and time of death, was also collected.
Screening of feature genes
Raw data were normalized and filtered using the
TCGAbiolinks package in R (version 3.2.2, http://www.r-project.org/). Genes with an average
expression level <0.25 in all samples were excluded from the
subsequent analyses. Feature genes with a coefficient of variation
(CV) >0.5 in all samples were selected using the genefilter
package in R.
Construction of a gene co-expression
network
The KIRC samples were divided into two sets: The
training set (n=319 samples) and the validation set (n=214
samples), with a ratio of 3:2 using the caTools package in R.
Gene co-expression networks were constructed using
the weighted gene co-expression network analysis (WGCNA)
(12) package in R.
Adjacency coefficient (aij) was calculated as follows:
aij=SijβSij=|cor(xi,xj)|
Where xi and xj are vectors of
expression value for genes i and j; cor
represents Pearson's correlation coefficient of the two vectors;
and aij is adjacency coefficient, which is acquired via
exponential transform of Sij.
The WGCNA method takes topological properties into
consideration in order to identify modules from a gene
co-expression network. Therefore, this method not only considers
the relationship between two connected nodes, but also takes
associated genes into account. Weighting coefficient (Wij)
is calculated from aij as follows:
wij=lij+aijmin{ki,kj}+1–aijlij=∑uaiuauj,ki=∑uaiu
Where u represents common genes linked gene I and
gene j together; aiu, the connection coefficient of gene i and gene
u; and auj, the connection coefficient of gene u and gene j.
Wij considers overlapping between neighbor genes of genes
i and j. Modules were identified via hierarchical
clustering of weighting coefficient matrix W.
Survival analysis
A univariate Cox regression analysis was performed
using the survive package in R.
Functional enrichment analysis
Gene Ontology (GO) enrichment analysis and Kyoto
Encyclopedia of Genes and Genomes (KEGG) pathway enrichment
analysis were performed using DAVID (Database for Annotation,
Visualization and Integration Discovery; http://david.abcc.ncifcrf.gov/) (13).
Validation of the hub genes
A KIRC gene expression dataset (accession no.
E-GEOD-22541) was downloaded from ArrayExpress (http://www.ebi.ac.uk/arrayexpress/) to validate
the reliability of the 11 hub genes. Cases were divided into two
groups (high and low) based upon the expression levels of certain
hub genes, using the gene average expression level in all samples
as the cut-off. The samples in which the gene expression level were
higher than average expreesion level were defined as high exp; the
other samples were defined as low exp, correspondingly. Survival
analysis was performed using the Kaplan-Meier method.
Results
Feature genes
A total of 533 KIRC samples were collected from
TCGA. After pretreatment, 13,742 genes were selected according to
the threshold (average expression level >0.25 in all samples).
Finally, 6,758 feature genes with a CV >0.5 were acquired for
further analysis.
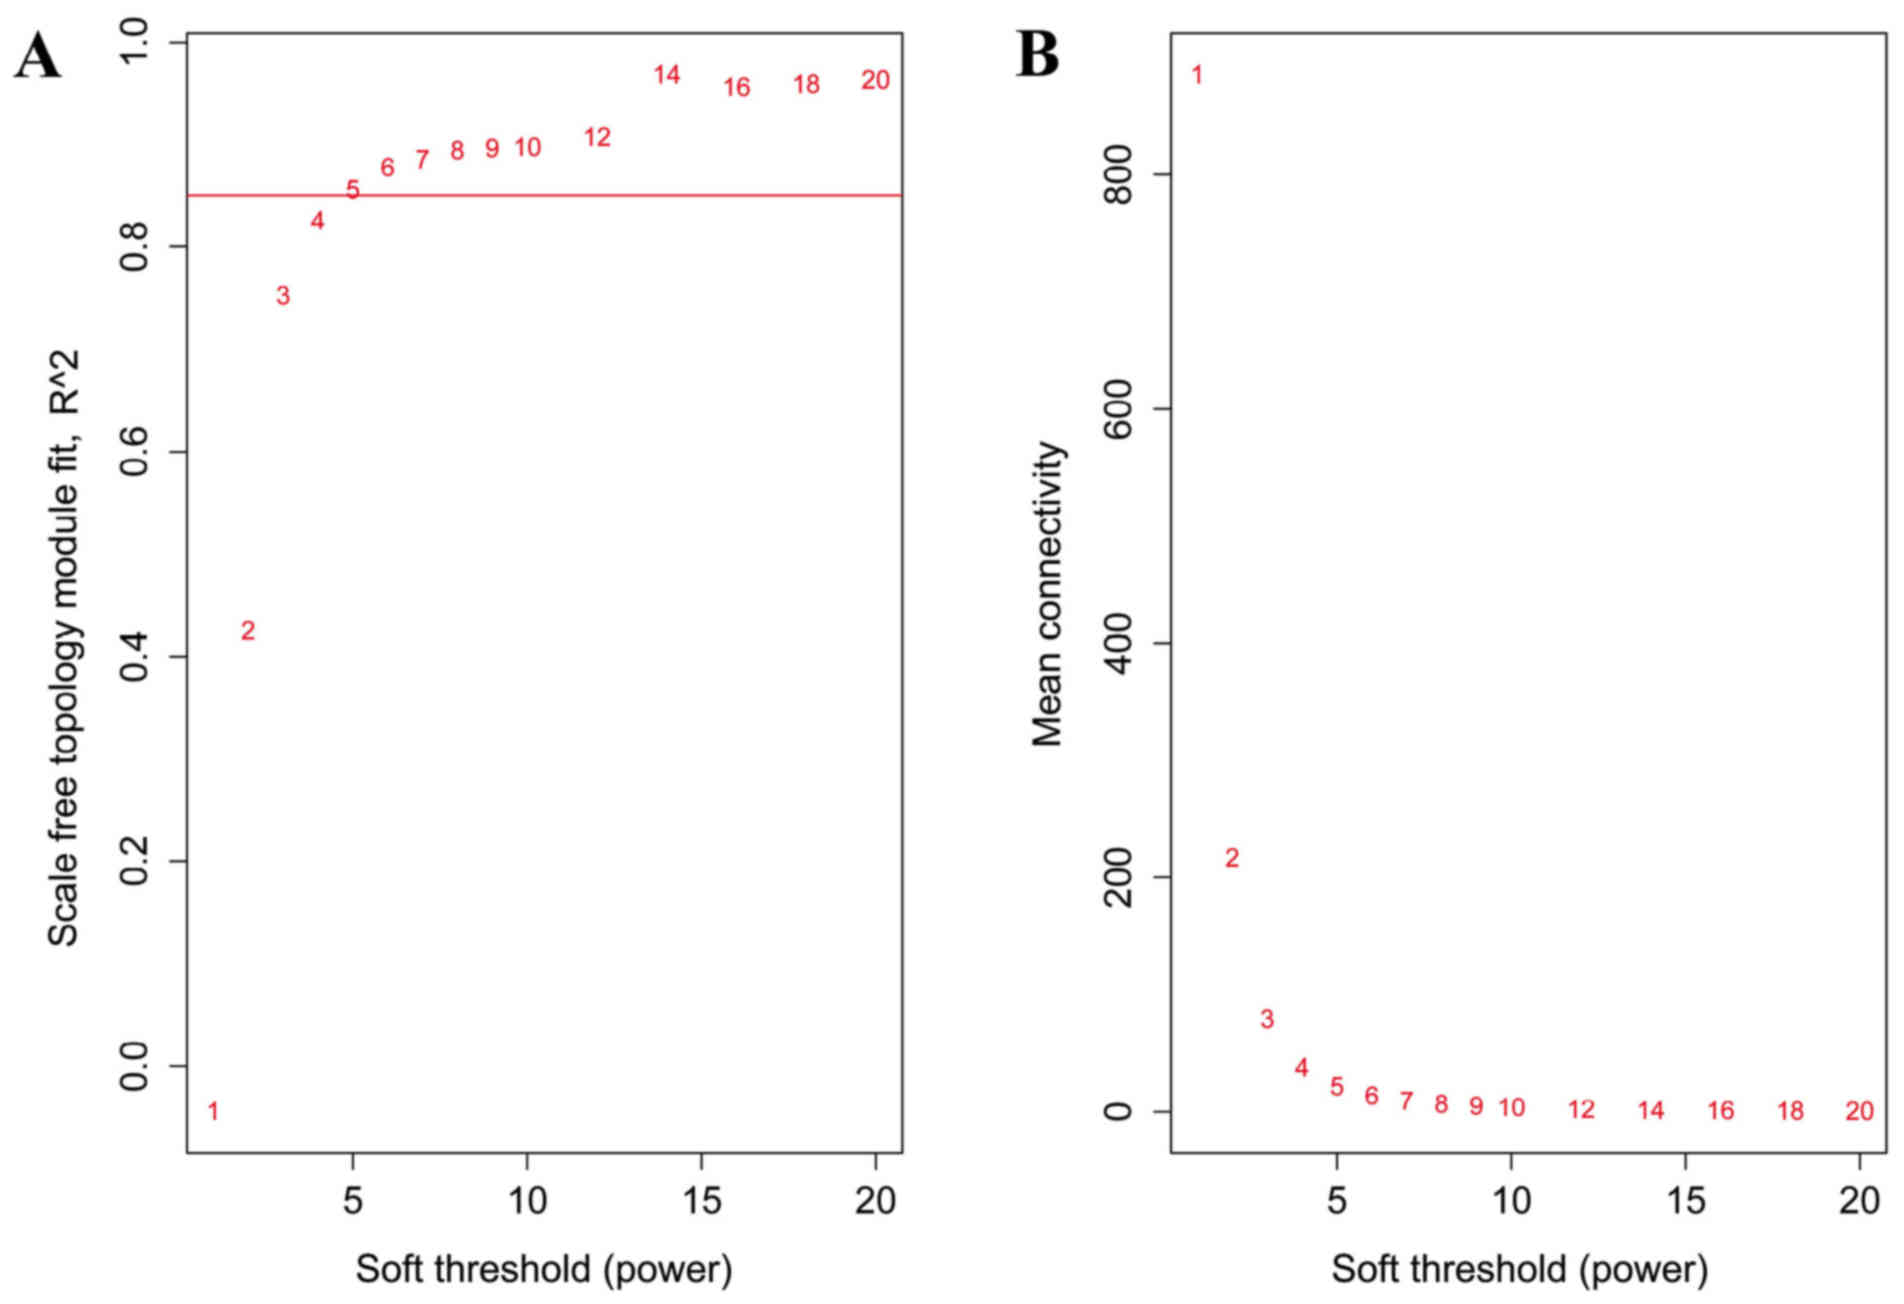
Gene co-expression network
The training set included 319 samples and the
validation set contained 214 samples. The training set was used to
construct a gene co-expression network, whereas the validation set
was used to examine the stability and accuracy of the network. The
soft threshold was set as 5 to construct the network (Fig. 1).
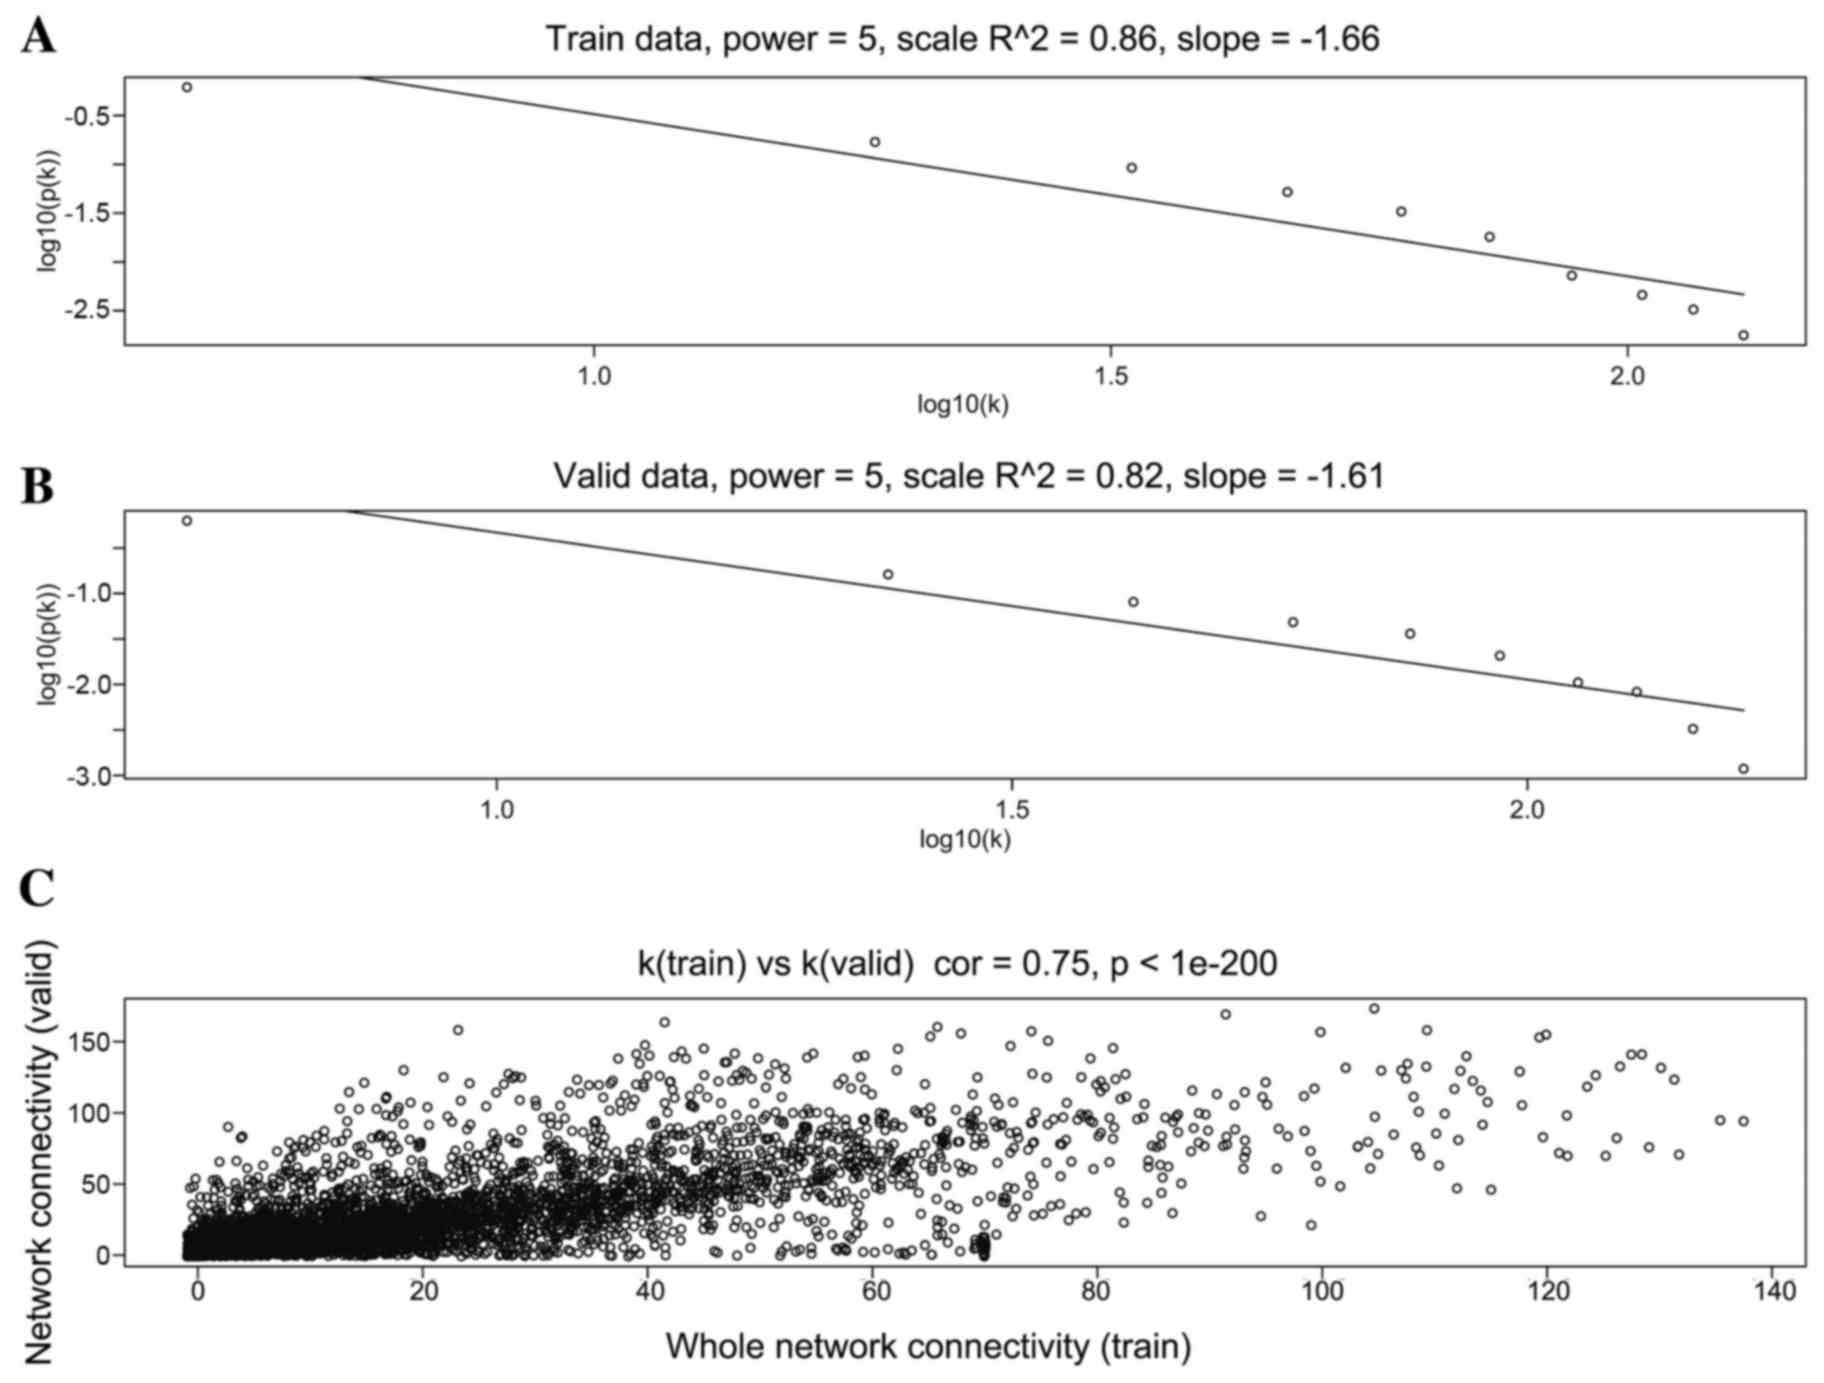
When the soft threshold was set as 5, both training
set and validation set networks obeyed power-law distribution,
exhibiting scale-free characteristics (Fig. 2). The correlation coefficient
between the two networks was 0.75, when the soft threshold was
5.
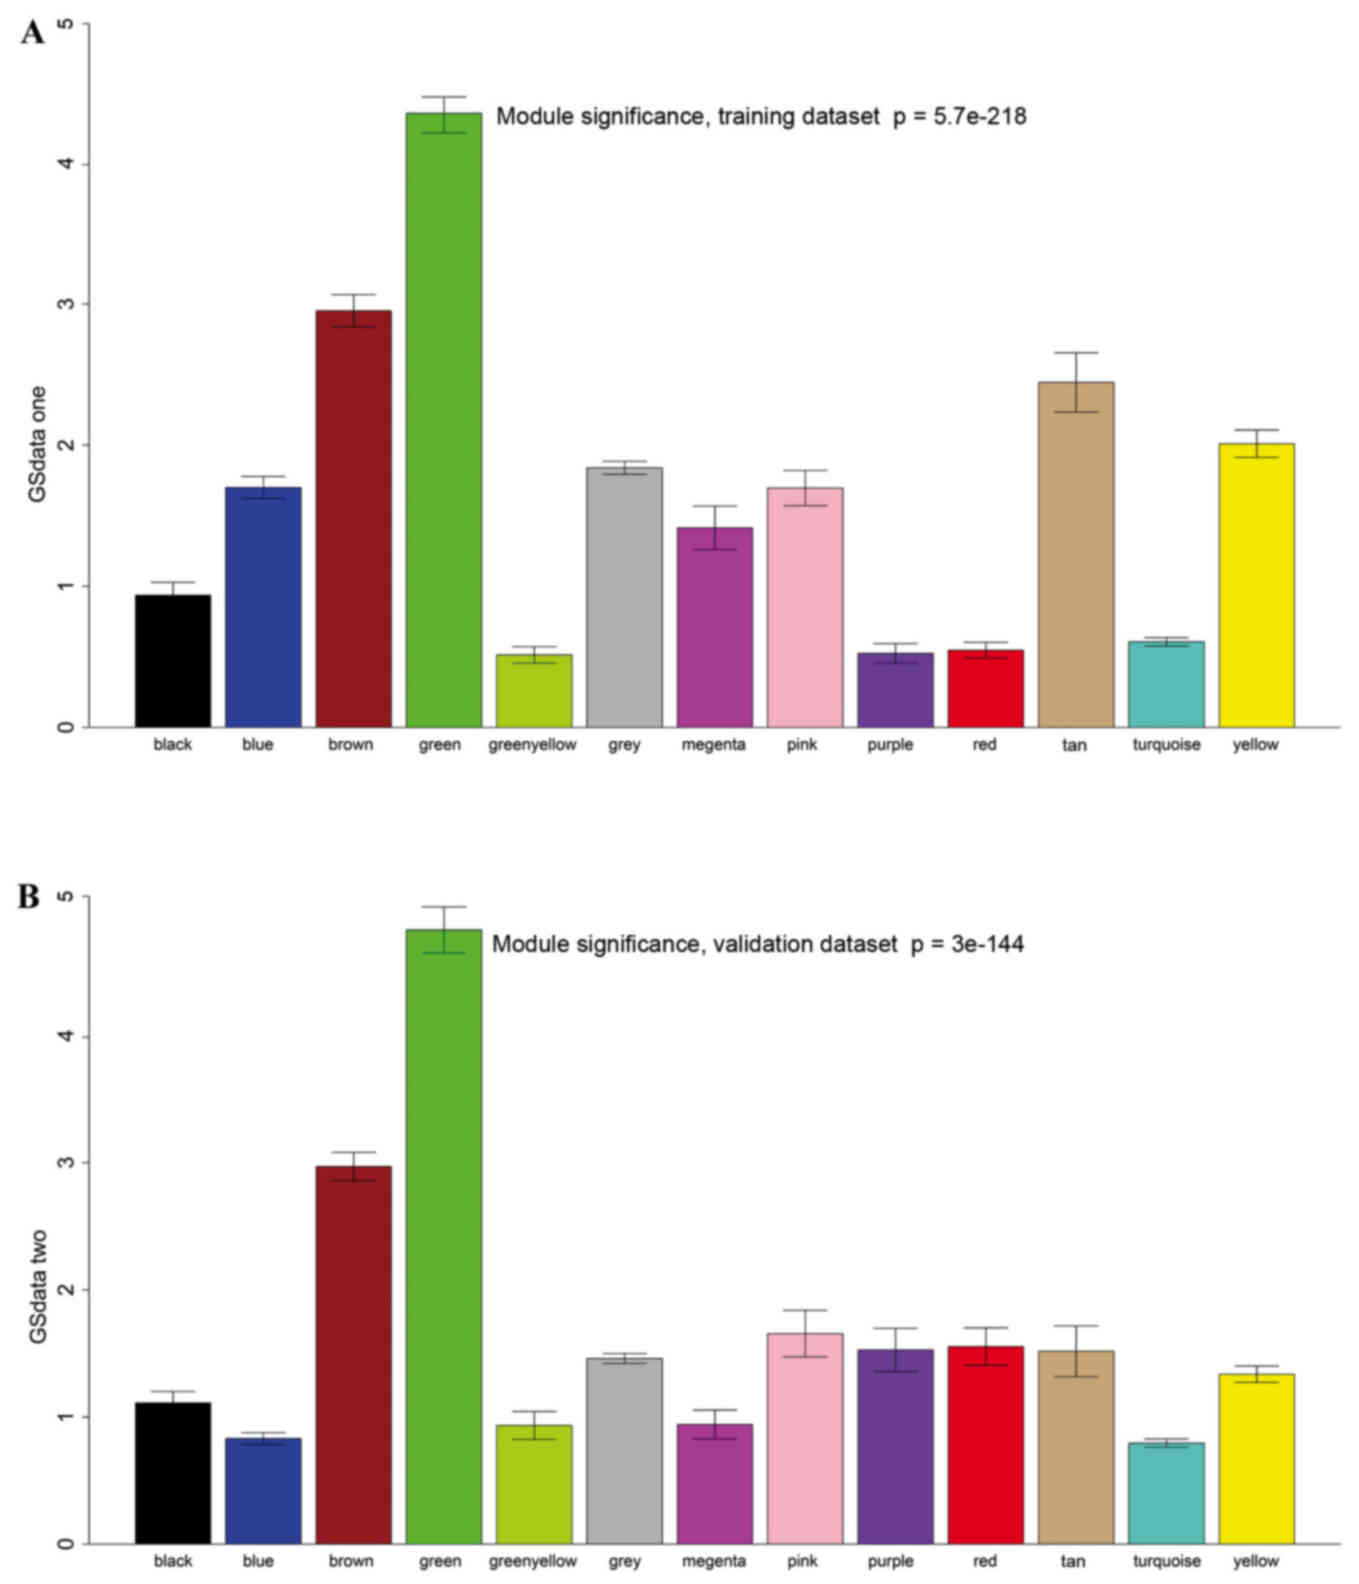
Survival-related modules
A total of 12 modules were revealed using the
cuttreeStaticColor function from WGCNA package (cutHeight=0.93;
minSize=50) (Fig. 3). A Cox
regression analysis was performed for each gene in both datasets
and a P-value was obtained. Hub genes may serve critical roles in
disease; therefore, degree (k) was also calculated for each gene.
The correlation between k and -log10(p) was subsequently
determined. Survival-associated genes were significantly
over-represented in the green module (Fig. 4).
Biological functions of the green
module
Significantly over-represented GO biological process
terms (Table I) and KEGG pathways
(Table II) were identified for
genes from the green module. The cell cycle and p53 signaling
pathway were revealed to be closely associated with KIRC.
 | Table I.Top 10 GO biological process terms of
genes from the green module. |
Table I.
Top 10 GO biological process terms of
genes from the green module.
| No. | Biological
process | Count | P-value |
|---|
| GO:0007049 | Cell cycle | 98 | 1.85E-74 |
| GO:0022403 | Cell cycle
phase | 79 | 3.66E-72 |
| GO:0000279 | M phase | 73 | 4.21E-71 |
| GO:0022402 | Cell cycle
process | 83 | 1.43E-66 |
| GO:0000278 | Mitotic cell
cycle | 68 | 7.52E-60 |
| GO:0000280 | Nuclear
division | 56 | 8.53E-57 |
| GO:0007067 | Mitotic nuclear
division | 56 | 8.53E-57 |
| GO:0000087 | M phase of mitotic
cell cycle | 56 | 2.56E-56 |
| GO:0048285 | Organelle
fission | 56 | 9.80E-56 |
| GO:0051301 | Cell division | 54 | 1.95E-46 |
| Table II.Significantly over-represented Kyoto
Encyclopedia of Genes and Genomes pathways of genes from the green
module. |
Table II.
Significantly over-represented Kyoto
Encyclopedia of Genes and Genomes pathways of genes from the green
module.
| No. | Pathway | Count | P-value |
|---|
| hsa04110 | Cell cycle | 25 | 2.63E-23 |
| hsa04114 | Oocyte meiosis | 13 | 7.35E-09 |
| hsa04914 |
Progesterone-mediated oocyte
maturation | 11 | 8.09E-08 |
| hsa04115 | p53 signaling
pathway | 7 | 1.86E-04 |
| hsa03440 | Homologous
recombination | 5 | 3.73E-04 |
Hub genes in the green module
A total of 202 genes were included in the green
module. Genes with P<0.01 in the Cox regression analysis of the
training and validation sets were selected. The intramodular degree
(kWithin) was then calculated for each gene. The top 20 genes in
the training and validation sets were subsequently obtained. The
overlapping genes were regarded as hub genes. A total of 11 hub
genes were identified (Table
III): Cyclin A2 (CCNA2), cyclin B2 (CCNB2), cell division cycle
20 (CDC20), cell division cycle associated 8 (CDCA8), G2 and
S-phase expressed 1 (GTSE1), kinesin family member 23 (KIF23),
kinesin family member 2C (KIF2C), kinesin family member 4A (KIF4A),
maternal embryonic leucine zipper kinase (MELK), topoisomerase II
alpha (TOP2A) and TPX2 microtubule-associated (TPX2).
| Table III.Summary of the 11 hub genes. |
Table III.
Summary of the 11 hub genes.
|
| P-value | k Total | k
Within |
|---|
|
|
|
|
|
|---|
| Gene | T set | V set | T set | V set | T set | V set |
|---|
| CCNA2 | 2.29E-06 | 8.15E-11 | 85.594 | 57.123 | 68.745 | 48.839 |
| CCNB2 | 9.08E-07 | 1.89E-08 | 94.399 | 68.515 | 72.728 | 55.378 |
| CDC20 | 6.17E-08 | 1.27E-08 | 93.507 | 60.032 | 74.198 | 50.181 |
| CDCA8 | 2.76E-05 | 5.21E-08 | 89.649 | 64.707 | 73.107 | 52.065 |
| GTSE1 | 1.88E-06 | 1.30E-08 | 93.828 | 63.922 | 73.780 | 53.611 |
| KIF23 | 3.21E-08 | 1.07E-08 | 91.183 | 60.441 | 69.097 | 48.626 |
| KIF2C | 3.00E-07 | 8.09E-08 | 88.153 | 64.374 | 70.517 | 54.608 |
| KIF4A | 1.14E-04 | 4.07E-08 | 92.184 | 63.336 | 69.749 | 51.397 |
| MELK | 9.74E-07 | 2.37E-07 | 85.264 | 60.536 | 69.125 | 52.317 |
| TOP2A | 3.88E-08 | 1.72E-08 | 88.265 | 61.531 | 72.680 | 53.977 |
| TPX2 | 7.24E-07 | 1.40E-08 | 88.309 | 68.001 | 71.906 | 57.164 |
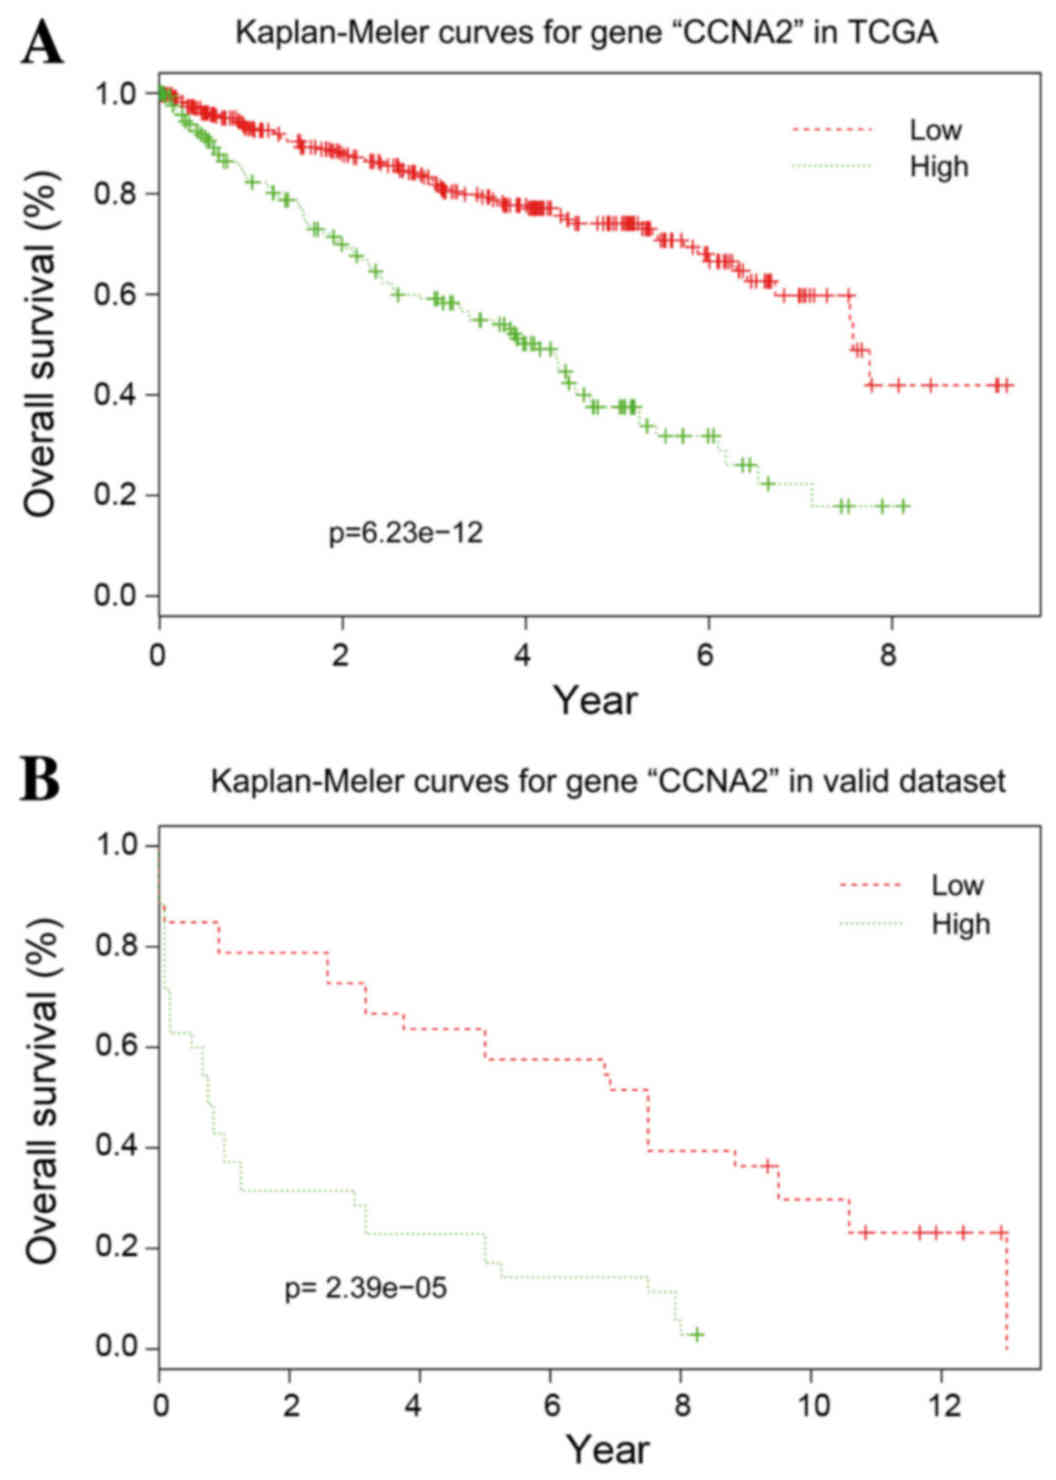
Validation of the hub genes
With the exception of CCNB2, the other 10 hub genes
exhibited good prognostic effects in the validation dataset E-GEOD
22541. The Kaplan-Meier survival curve of CCNA2 is presented in
Fig. 5.
Discussion
In the present study, a total of 533 KIRC samples
were collected from TCGA and 6,758 feature genes were revealed,
based upon which gene co-expression networks were constructed. A
total of 12 modules were identified; however, only one module
(green) was significantly associated with survival time. The green
module included 202 genes, which were implicated in the cell cycle
and p53 signaling pathway. Finally, a total of 11 hub genes were
revealed by network analysis combined with survival analysis; 10 of
which were validated using another gene expression dataset.
The majority of the validated hub genes were
involved in the cell cycle, including CCNA2, CDC20 and CDCA8. CDC20
acts as a regulatory protein at numerous points in the cell cycle.
It is negatively regulated by p53 and may be considered a good
potential therapeutic target (14). Increased TOP2A expression is
associated with more aggressive pathological features and an
increased risk of cancer-specific mortality among patients
undergoing surgery for localized KIRC (15). Chen et al indicated that
TOP2A is a prognostic marker in advanced renal cell carcinoma
(16). Furthermore, overexpression
of TOP2A has been reported in other types of cancer (17,18)
and is considered a therapeutic target (19). The results of the present study
indicated that it may also be a therapeutic target in KIRC. GTSE1
accumulates in the nucleus and binds to p53, resulting in its
translocation out of the nucleus and suppression of its
apoptosis-inducing ability. In addition, GTSE1 suppresses apoptotic
signaling and confers cisplatin resistance in gastric cancer cells
(20). Overexpression of GTSE1 has
previously been observed in KIRC (21) and may therefore exert a similar
function in KIRC.
Several prognostic genes have been implicated in
various types of cancer; however, their roles in KIRC require
further research. Kinesins are a family of molecular motor proteins
that travel along microtubule tracks in order to fulfill their
numerous roles in intracellular transport and cell division
(22). Several kinesins that are
involved in mitosis have emerged as potential targets for cancer
drug development (23). Three
kinesins (KIF23, KIF2C and KIF4A) were identified as prognostic
genes in KIRC in the present study. Previous studies have indicated
their roles in lung cancer (24),
colorectal cancer (25) and oral
cancer (26). MELK, which is a
highly conserved serine/threonine kinase, is a regulator in cell
cycle control and cancer (27,28).
Dysregulated expression of MELK is associated with a poor prognosis
in breast cancer (29). In
addition, a MELK inhibitor has been reported to have potential as a
novel molecular targeted therapy, which targets human cancer stem
cells (30). TPX2 is associated
with various types of cancer, including esophageal squamous cell
carcinoma (31), bladder carcinoma
(32) and cervical carcinoma
(33). In addition, it contributes
to the growth and metastasis of hepatocellular carcinoma (34). Further studies regarding these
genes may provide novel insights into the pathogenesis of KIRC and
provide potential prognostic markers.
In conclusion, the present study identified 11
critical genes associated with KIRC. The prognostic value of 10
genes was validated using another gene expression dataset, which
provides important evidence regarding the pathogenesis of KIRC.
Further studies are required to better define their roles in
KIRC.
References
|
1
|
Siegel R, Ma J, Zou Z and Jemal A: Cancer
statistics, 2014. CA Cancer J Clin. 64:9–29. 2014. View Article : Google Scholar : PubMed/NCBI
|
|
2
|
Linehan WM: Genetic basis of kidney
cancer: Role of genomics for the development of disease-based
therapeutics. Genome Res. 22:2089–2100. 2012. View Article : Google Scholar : PubMed/NCBI
|
|
3
|
Mickisch GH: Principles of nephrectomy for
malignant disease. BJU Int. 89:488–495. 2002. View Article : Google Scholar : PubMed/NCBI
|
|
4
|
Janzen NK, Kim HL, Figlin RA and
Belldegrun AS: Surveillance after radical or partial nephrectomy
for localized renal cell carcinoma and management of recurrent
disease. Urol Clin North Am. 30:843–852. 2003. View Article : Google Scholar : PubMed/NCBI
|
|
5
|
Robb VA, Magdalena K, Klein-Szanto AJ and
Henske EP: Activation of the mTOR signaling pathway in renal clear
cell carcinoma. J Urol. 177:346–352. 2007. View Article : Google Scholar : PubMed/NCBI
|
|
6
|
Guo G, Gui Y, Gao S, Tang A, Hu X, Huang
Y, Jia W, Li Z, He M, Sun L, et al: Frequent mutations of genes
encoding ubiquitin-mediated proteolysis pathway components in clear
cell renal cell carcinoma. Nat Genet. 44:17–19. 2012. View Article : Google Scholar
|
|
7
|
Dormoy V, Danilin S, Lindner V, Thomas L,
Rothhut S, Coquard C, Helwig JJ, Jacqmin D, Lang H and Massfelder
T: The sonic hedgehog signaling pathway is reactivated in human
renal cell carcinoma and plays orchestral role in tumor growth. Mol
Cancer. 8:1232009. View Article : Google Scholar : PubMed/NCBI
|
|
8
|
Tang SW, Chang WH, Su YC, Chen YC, Lai YH,
Wu PT, Hsu CI, Lin WC, Lai MK and Lin JY: MYC pathway is activated
in clear cell renal cell carcinoma and essential for proliferation
of clear cell renal cell carcinoma cells. Cancer Lett. 273:35–43.
2009. View Article : Google Scholar : PubMed/NCBI
|
|
9
|
Lebdai S, Verhoest G, Parikh H, Jacquet
SF, Bensalah K, Chautard D, Leclercq N Rioux, Azzouzi AR and Bigot
P: Identification and validation of TGFBI as a promising prognosis
marker of clear cell renal cell carcinoma. Urol Oncol.
33:69.e11–e18. 2015. View Article : Google Scholar
|
|
10
|
Liu X, Wang J and Sun G: Identification of
key genes and pathways in renal cell carcinoma through expression
profiling data. Kidney Blood Press Res. 40:288–297. 2015.
View Article : Google Scholar : PubMed/NCBI
|
|
11
|
Valletti A, Gigante M, Palumbo O, Carella
M, Divella C, Sbisà E, Tullo A, Picardi E, D'Erchia AM, Battaglia
M, et al: Genome-wide analysis of differentially expressed genes
and splicing isoforms in clear cell renal cell carcinoma. PLoS One.
8:e784522013. View Article : Google Scholar : PubMed/NCBI
|
|
12
|
Langfelder P and Horvath S: WGCNA: An R
package for weighted correlation network analysis. BMC
Bioinformatics. 9:5592008. View Article : Google Scholar : PubMed/NCBI
|
|
13
|
Dennis G Jr, Sherman BT, Hosack DA, Yang
J, Gao W, Lane HC and Lempicki RA: DAVID: Database for annotation,
visualization, and integrated discovery. Genome Biol. 4:P32003.
View Article : Google Scholar : PubMed/NCBI
|
|
14
|
Kidokoro T, Tanikawa C, Furukawa Y,
Katagiri T, Nakamura Y and Matsuda K: CDC20, a potential cancer
therapeutic target, is negatively regulated by p53. Oncogene.
27:1562–1571. 2008. View Article : Google Scholar : PubMed/NCBI
|
|
15
|
Gardner FP, Joseph RW, Serie D, Hilton TW,
Parasramka M, Eckel-Passow J, Cheville J and Bradley C: Association
of topoisomerase II expression and cancer-specific death in
patients with surgically resected clear cell renal cell carcinoma.
J Clin Oncol. 31 Suppl 6:abstr 446. 2013. View Article : Google Scholar : PubMed/NCBI
|
|
16
|
Chen D, Maruschke M, Riesenberg R,
Zimmermann W, Stief CG and Buchner A: MP29-03 TET3, hells, TOP2A
and ATAD2 are novel independent prognostic markers in advanced
renal cell carcinoma. J Urol. 191:e3052014. View Article : Google Scholar
|
|
17
|
Wong N, Yeo W, Wong WL, Wong NL, Chan KY,
Mo FK, Koh J, Chan SL, Chan AT, Lai PB, et al: TOP2A overexpression
in hepatocellular carcinoma correlates with early age onset,
shorter patients survival and chemoresistance. Int J Cancer.
124:644–652. 2009. View Article : Google Scholar : PubMed/NCBI
|
|
18
|
Lan J, Huang HY, Lee SW, Chen TJ, Tai HC,
Hsu HP, Chang KY and Li CF: TOP2A overexpression as a poor
prognostic factor in patients with nasopharyngeal carcinoma. Tumour
Biol. 35:179–187. 2014. View Article : Google Scholar : PubMed/NCBI
|
|
19
|
Jain M, Zhang L, He M, Zhang YQ, Shen M
and Kebebew E: TOP2A is overexpressed and a therapeutic target for
adrenocortical carcinoma. Endocr Relat Cancer. 20:361–370. 2013.
View Article : Google Scholar : PubMed/NCBI
|
|
20
|
Subhash VV, Tan SH, Tan WL, Yeo MS, Xie C,
Wong FY, Kiat ZY, Lim R and Yong WP: GTSE1 expression represses
apoptotic signaling and confers cisplatin resistance in gastric
cancer cells. BMC Cancer. 15:5502015. View Article : Google Scholar : PubMed/NCBI
|
|
21
|
Liu Q, Su PF, Zhao S and Shyr Y:
Transcriptome-wide signatures of tumor stage in kidney renal clear
cell carcinoma: Connecting copy number variation, methylation and
transcription factor activity. Genome Med. 6:1172014. View Article : Google Scholar : PubMed/NCBI
|
|
22
|
Rath O and Kozielski F: Kinesins and
cancer. Nature Rev Cancer. 12:527–539. 2012. View Article : Google Scholar
|
|
23
|
Sakowicz R, Finer JT, Beraud C, Crompton
A, Lewis E, Fritsch A, Lee Y, Mak J, Moody R, Turincio R, et al:
Antitumor activity of a kinesin inhibitor. Cancer Res.
64:3276–3280. 2004. View Article : Google Scholar : PubMed/NCBI
|
|
24
|
Taniwaki M, Takano A, Ishikawa N, Yasui W,
Inai K, Nishimura H, Tsuchiya E, Kohno N, Nakamura Y and Daigo Y:
Activation of KIF4A as a prognostic biomarker and therapeutic
target for lung cancer. Clin Cancer Res. 13:6624–6631. 2007.
View Article : Google Scholar : PubMed/NCBI
|
|
25
|
Gnjatic S, Cao Y, Reichelt U, Yekebas EF,
Nölker C, Marx AH, Erbersdobler A, Nishikawa H, Hildebrandt Y,
Bartels K, et al: NY-CO-58/KIF2C is overexpressed in a variety of
solid tumors and induces frequent T cell responses in patients with
colorectal cancer. Int J Cancer. 127:381–393. 2010.PubMed/NCBI
|
|
26
|
Minakawa Y, Kasamatsu A, Koike H, Higo M,
Nakashima D, Kouzu Y, Sakamoto Y, Ogawara K, Shiiba M, Tanzawa H
and Uzawa K: Kinesin family member 4A: A potential predictor for
progression of human oral cancer. PLoS One. 8:e859512013.
View Article : Google Scholar : PubMed/NCBI
|
|
27
|
Jiang P and Zhang D: Maternal embryonic
leucine zipper kinase (MELK): A novel regulator in cell cycle
control, embryonic development, and cancer. Int J Mol Sci.
14:21551–21560. 2013. View Article : Google Scholar : PubMed/NCBI
|
|
28
|
Ganguly R, Mohyeldin A, Thiel J, Kornblum
HI, Beullens M and Nakano I: MELK-a conserved kinase: Functions,
signaling, cancer, and controversy. Clin Transl Med. 4:112015.
View Article : Google Scholar : PubMed/NCBI
|
|
29
|
Pickard MR, Green AR, Ellis IO, Caldas C,
Hedge VL, Mourtada-Maarabouni M and Williams GT: Dysregulated
expression of Fau and MELK is associated with poor prognosis in
breast cancer. Breast Cancer Res. 11:R602009. View Article : Google Scholar : PubMed/NCBI
|
|
30
|
Chung S and Nakamura Y: MELK inhibitor,
novel molecular targeted therapeutics for human cancer stem cells.
Cell Cycle. 12:1655–1656. 2013. View Article : Google Scholar : PubMed/NCBI
|
|
31
|
Hsu PK, Chen HY, Yeh YC, Yen CC, Wu YC,
Hsu CP, Hsu WH and Chou TY: TPX2 expression is associated with cell
proliferation and patient outcome in esophageal squamous cell
carcinoma. J Gastroenterol. 49:1231–1240. 2014. View Article : Google Scholar : PubMed/NCBI
|
|
32
|
Yan L, Li S, Xu C, Zhao X, Hao B, Li H and
Qiao B: Target protein for Xklp2 (TPX2), a microtubule-related
protein, contributes to malignant phenotype in bladder carcinoma.
Tumor Biol. 34:4089–4100. 2013. View Article : Google Scholar
|
|
33
|
Jiang P, Shen K, Wang X, Song H, Yue Y and
Liu T: TPX2 regulates tumor growth in human cervical carcinoma
cells. Mol Med Rep. 9:2347–2351. 2014.PubMed/NCBI
|
|
34
|
Huang Y, Guo W and Kan H: TPX2 Is a
prognostic marker and contributes to growth and metastasis of human
hepatocellular carcinoma. Int J Mol Sci. 15:18148–18161. 2014.
View Article : Google Scholar : PubMed/NCBI
|