Introduction
The standard treatment for chronic hepatitis C virus
(HCV) infection is a weekly administration of peginterferon
(PEG-IFN) combined with a daily dose of ribavirin (RBV). However,
<50% of patients infected with HCV genotype-1 (HCV-1) treated
with this regimen achieve a sustained virological response (SVR) in
Western countries (1,2). Treatment with PEG-interferon (IFN)
plus RBV activates the immune system, marked by the expression of
cell membrane proteins and secretion of cytokines. In a preliminary
experiment, the authors of the present study demonstrated that
Toll-like receptor 4 (TLR4) expression was significantly
downregulated on peripheral blood mononuclear cells (PBMCs) during
PEG-IFN and RBV combination therapy in patients with genotype-1
chronic hepatitis C (CHC) (3). The
results suggested that IFN may regulate TLR4 expression,
subsequently affecting the immune cell signaling pathways, and thus
the production and secretion of cytokines. The TLR transmembrane
receptor family is important in the recognition of
pathogen-associated molecular patterns, thus leading to the
vigorous production of type I IFNs and proinflammatory cytokines
(4). It has previously been
demonstrated that TLR4 may be induced by hepatocyte-specific
transgenic expression of the HCV nonstructural protein (NS)5A
(5). TLR4 agonists, including
lipopolysaccharide (LPS), have been reported to induce
interferon-γ-inducible protein-10 (IP-10) production (6). Sahin et al (7) described a novel proapoptotic effect
of IP-10 in hepatocytes. Notably, the effect is not mediated via
its cognate chemokine receptor, but via TLR4. IP-10 is a
T-cell-specific CXC chemokine of 77 amino acids in its mature form,
which targets C-X-C motif receptor 3, and attracts natural killer
cells, T lymphocytes and monocytes.
The association between the dynamic alterations of
IP-10 during PEG-IFN and RBV treatment of patients with HCV-1, TLR4
expression on PBMCs and the development of the SVR, remains to be
fully elucidated. The present study investigated marked alterations
in IP-10, TLR4, IRF3 and IRF5 in patients with HCV treated with
PEG-IFN-based standard therapy. The results suggested that
decreasing levels of IP-10 were observed via a decrease in the
expression of TLR4 on PBMCs during PEG-IFN treatment. In addition,
SVR may be associated with IP-10, IRF5 and TLR4 expression on PBMCs
in patients with CHC during antiviral therapy.
Materials and methods
Patients
The present study recruited 31 patients with CHC; 19
male, and 12 female, who were receiving treatment at the Second
Xiangya Hospital of Central South University (Changsha, China)
between September 2011 and September 2012. The average age was 39
(range, 33–48 years). The HCV RNA load (lg10 RNA) was −6.53 (range,
−5.95 to −7.20). Alanine transaminase (ALT) and aspartate
aminotransferase (AST) levels were: 69.9 IU/l (range, 39.5–95.5
IU/l) and 57.2 IU/l (range, 38.0–91.3 IU/l), respectively. CHC was
diagnosed according to the Strategy for Prevention and Therapy of
Viral Hepatitis (8). HCV was
confirmed to be HCV-1 based on genotyping results. All subjects
were negative for hepatitis B and D, human immunodeficiency virus,
and for other markers of autoimmune hepatitis and drug-induced
hepatitis. The present study was approved by the Ethics Committee
of the Second Xiangya Hospital (Changsha, China).
Study design
CHC participants received subcutaneous injections of
PEG-IFN-a-2a (180 µg/week), and daily oral RBV (15 mg/kg; Kangmei
Pharmaceutical Co., Ltd., Shanghai, China) for 48 weeks. Blood
samples were collected at the baseline (prior to the treatment) and
at 4, 12, 24 and 48 weeks during the treatment, and additionally 24
weeks (72 weeks total) following discontinuation of antiviral
treatment.
Virological evaluations
HCV RNA levels were measured using the COBAS TaqMan
HCV assay (Roche Molecular Diagnostics, Pleasanton, CA, USA)
according to manufacturer's protocols, with low and high cut-off
limits of quantification, 15 to 6.9×10⁷ IU/ml (1.2–7.8 log IU/ml).
HCV genotype was determined using a HCV Genotype Primer kit
(Institute of Immunology, Tokyo, Japan) according to the
manufacturer's protocol.
Detection of TLR4+
PBMCs
PBMCs were isolated from heparinized blood using
Ficoll-Hypaque (Sigma-Aldrich; Merck Millipore, Darmstadt, Germany)
density gradient centrifugation in 200 µl staining buffer (BD
Biosciences, Franklin Lakes, NJ, USA) at room temperature for 5 min
at 800 × g. PBMCs (1×10⁶) were incubated with
allophycocyanin-labeled anti-TLR4 (1:20; cat. no. 564401; BD
Biosciences) in a 100 µl experimental sample at room temperature
for 30 min, and washed twice prior to analysis with flow cytometry
(FACScan flow cytometer; Beckman Coulter, Inc., Brea, CA, USA),
using Cell Quest software (version 5.1; BD Biosciences).
RNA isolation and reverse transcription-quantitative
polymerase chain reaction (RT-qPCR). Total RNA was extracted from
PBMCs using RNeasy Mini kit (Qiagen GmbH, Hilden, Germany). RT-qPCR
was conducted using a Rotor-Gene 3000 real-time PCR instrument
(Qiagen GmbH). RT was conducted with 10 µl RNA with 2 µl RT primer
and amplification kit (Enhanced Avian HS RT-PCR Kit; Sigma-Aldrich;
Merck Millipore) at 50°C for 60 min according to the manufacturer's
protocol. IRF3 and IRF5 mRNA was amplified with SYBR®
real-time PCR kit (Takara Biotechnology Co., Ltd., Dalian, China)
using PCR primers presented in Table
I. The thermocycling conditions of the reaction were as
follows: Initial denaturation at 94°C for 3 min, 30 cycles of
denaturation at 94°C for 30 sec, annealing at 58°C for 30 sec and
elongation at 72°C for 30 sec, and final elongation at 72°C for 7
min. All reactions were conducted in triplicate for three
independent experiments. The mean quantification cycle (Cq) value
of target genes was normalized against the Cq value of β-actin
mRNA, and the relative expression levels were calculated using the
following formula: 2−∆∆Cq, where
∆∆Cq=(Cq-Cqβ-actin) CHC
patient-(Cq-Cqβ-actin)Normal control
(9).
 | Table I.Polymerase chain reaction primers for
IRF3, IRF5 and β-actin. |
Table I.
Polymerase chain reaction primers for
IRF3, IRF5 and β-actin.
|
| Sequence (5′-3′) | Size (bp) |
|---|
| IRF3 | F:
5′-AAAGAAGGGTTGCGTTTAGC-3′ | 161 |
|
| R:
5′-CAGAATGTCTTCCTGGGTATCA-3′ |
|
| IRF5 | F:
5′-GAGCAGGTGGAACTCTTCG-3′ | 169 |
|
| R:
5′-CACAGGCGGATGGCATAA-3′ |
|
| β-actin | F:
5′-ATCATGTTTGAGACCTTCAACA-3′ | 318 |
|
| R:
5′-CATCTCTTGCTCGAAGTCCA-3′ |
|
Detection of IP-10 by ELISA
Plasma IP-10 levels were measured using Human
CXCL10/IP-10 Quantikine ELISA kit (R&D Systems, Inc.,
Minneapolis, MN, USA).
Statistical analysis
All variables were normally distributed, and data
was presented as mean ± standard deviation. Data in multiple groups
were compared with one-way analysis of variance followed by Tukey's
test, and the comparison between two groups was performed with an
independent sample t-test. A paired sample t-test was used to
analyze the data of different time points for one group. Spearman
correlation analysis was used to analyze the correlation between
IP-10 and IRF5, IP-10 and TLR4, and IRF5 and TLR4 in the SVR and
non-SVR groups. Multivariate regression analysis was used to
analyze the correlation between multiple factors including SVR,
IP-10, TLR4 and IRF5. All statistical analyses were based on
two-sided hypothesis tests, and P<0.05 was considered to
indicate a statistically significant difference. All analyses were
carried out using SPSS software version 16.0 (SPSS, Inc., Chicago,
IL, USA).
Results
Baseline characteristics associated
with SVR
At baseline, age and gender were comparable between
the SVR and non-SVR groups. ALT and AST were significantly higher
in the non-SVR group (P=0.0032 and 0.0042 vs. SVR group,
respectively). Frequency of TLR4 expression on PBMCs, and levels of
serum IP-10, IRF3 and IRF5 were similar between the SVR and the
non-SVR groups (Table II).
| Table II.Baseline characteristics in responders
vs. non-responders. |
Table II.
Baseline characteristics in responders
vs. non-responders.
| Characteristic | SVR (n=25) | Non-SVR (n=6) | P-value |
|---|
| Age in years median
(IQR) | 40 (33–46) | 47 (33–55) | 0.687 |
| Gender, male (%) | 60 | 83 | 0.116 |
| HCV RNA Log10, median
(IQR) | 6.21 (2.14–7.05) | 6.94 (5.95–7.59) | 0.558 |
| ALT (IU/l), median
(IQR) | 58 (37–86.1) | 123.7
(84.3–219.2) |
0.0032 |
| AST (IU/l), median
(IQR) | 56 (54–98.1) | 128.6
(75.3–186.5) |
0.0042 |
| TLR4-positive PBMCs
(%), median (IQR) | 31.65
(27.45–41.89) | 45.62
(36.73–59.28) |
0.0542 |
| IP-10 (pg/ml),
median (IQR) | 130.58
(119.67–217.59) | 186.09
(125.69–251.9) |
0.0898 |
| IRF3 (RQ), median
(IQR) | 14.65
(7.45–21.57) | 15.62
(8.73–29.28) | 0.762 |
| IRF5 (RQ), median
(IQR) | 20.16
(11.59–36.19) | 23.59
(16.73–39.28) | 0.642 |
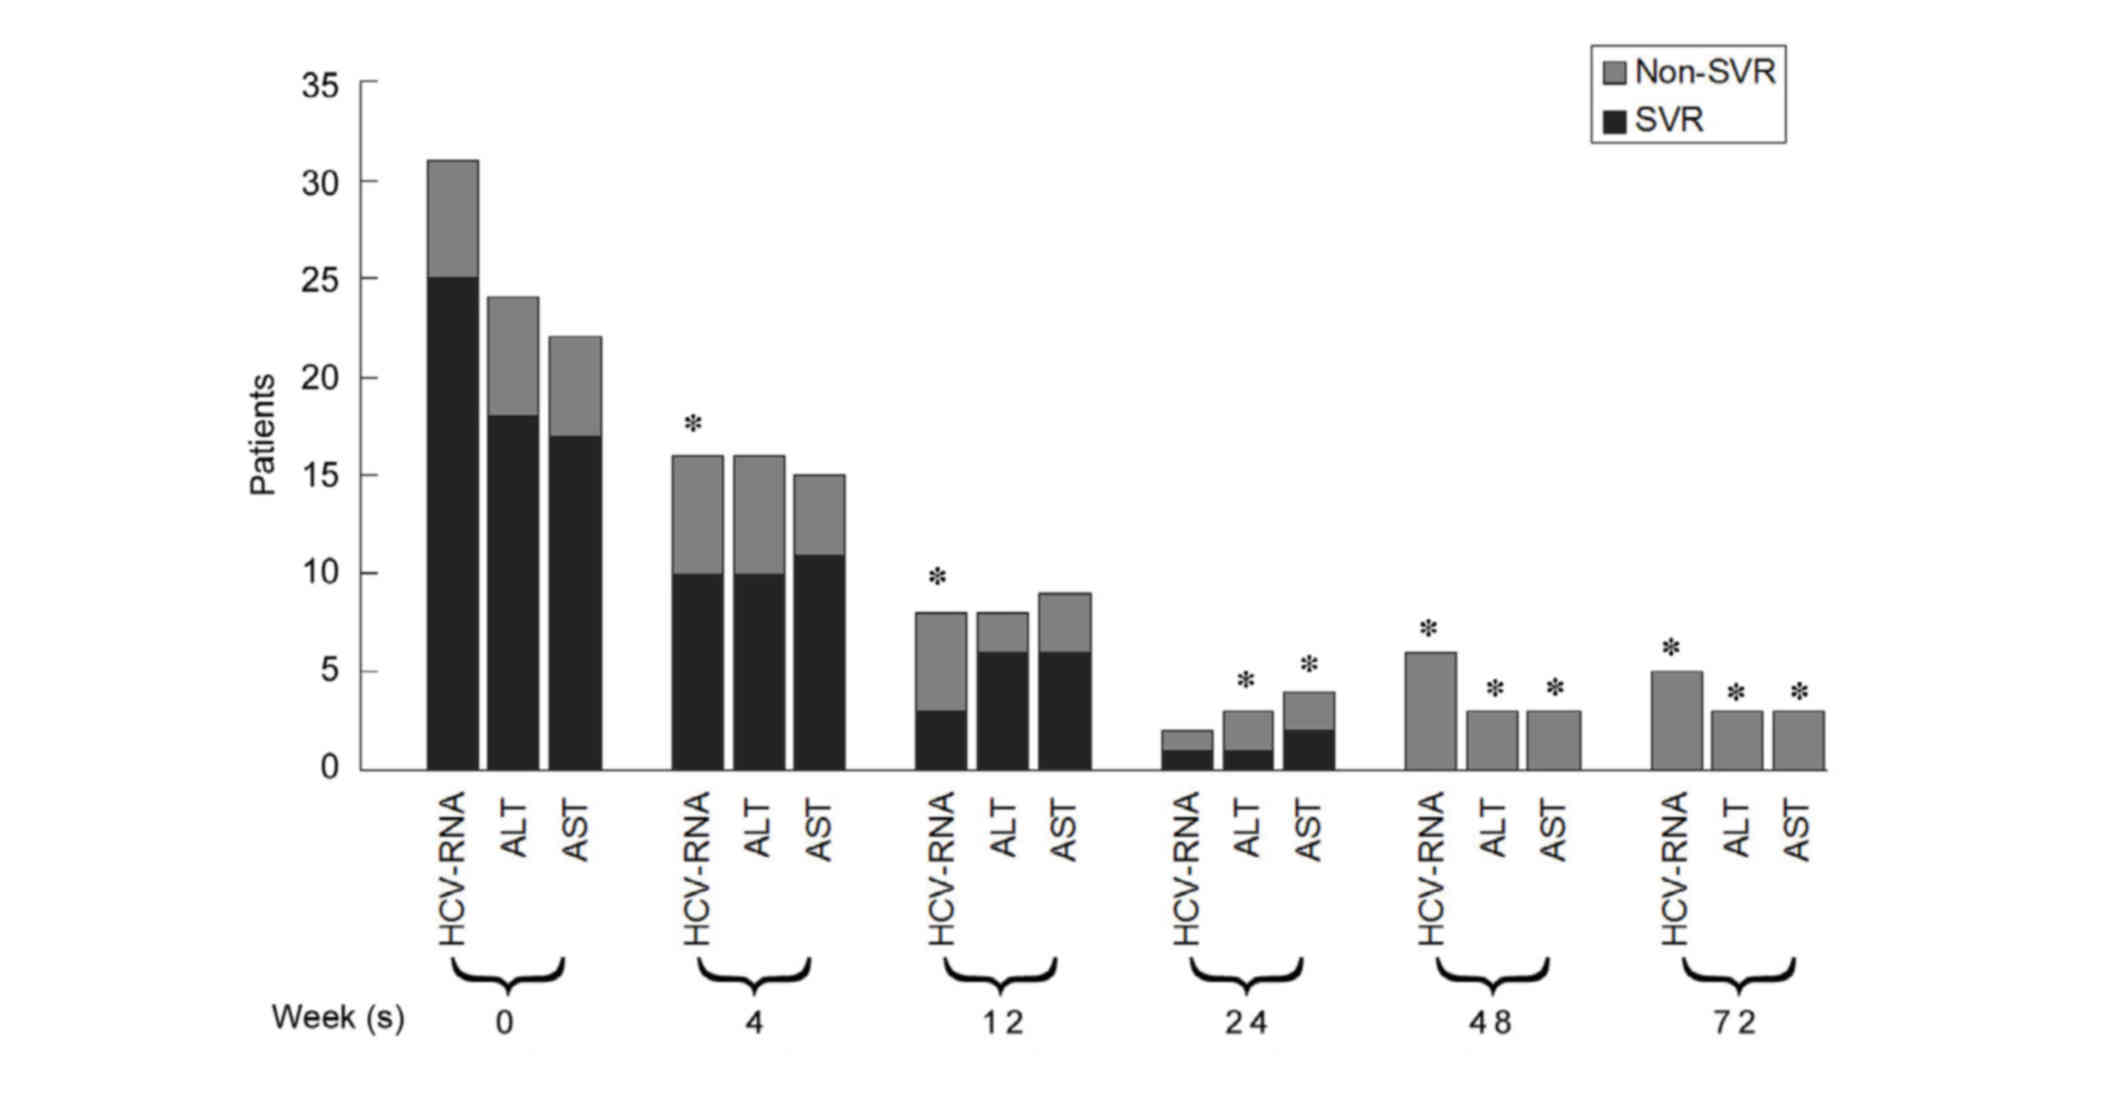
Viral load and serological alterations
in patients with CHC
A total of 25 patients (80.65%) achieved SVR and the
remaining six did not. HCV-RNA, ALT and AST levels declined
gradually during the treatment and follow-up period in the SVR and
non-SVR groups. The number of patients with detectable HCV-RNA in
the SVR group was significantly fewer than in the non-SVR group at
4, 12 and 48 weeks during the treatment period, and the 24 week
follow-up (P<0.05; Fig. 1). The
percentage of patients with abnormal ALT and AST in the SVR group
at 24 and 48 weeks during the treatment period, and the 24 week
follow-up was significantly lower than that in the non-SVR group
(P<0.05; Fig. 1).
TLR4, IRF3, IRF5 and IP-10 alterations
between SVR and non-SVR groups, at different time points
There was no difference in the percentage of TRL4+
PBMCs in SVR and non-SVR groups at baseline; however, with
treatment, the percentage gradually decreased, and was
significantly lower at 24 and 48 weeks in the SVR group compared
with the non-SVR group (P<0.0001 and P<0.0001; Fig. 2A). The mRNA expression levels of
IRF3 were similar at baseline in the SVR and the non-SVR groups
[SVR IRF3 relative quantification (RQ)=22.07±5.63 vs. non-SVR IRF3
RQ=24.83±6.38]. With an extended period of treatment the IRF3 RQ
values in the SVR group were slightly lower than in the non-SVR
group, but there was no statistically significant difference
between the two groups. A total of 24 weeks following treatment (72
weeks), the IRF3 RQ values in the non-SVR group were markedly
increased compared with the SVR group (P=0.035; Fig. 2B).
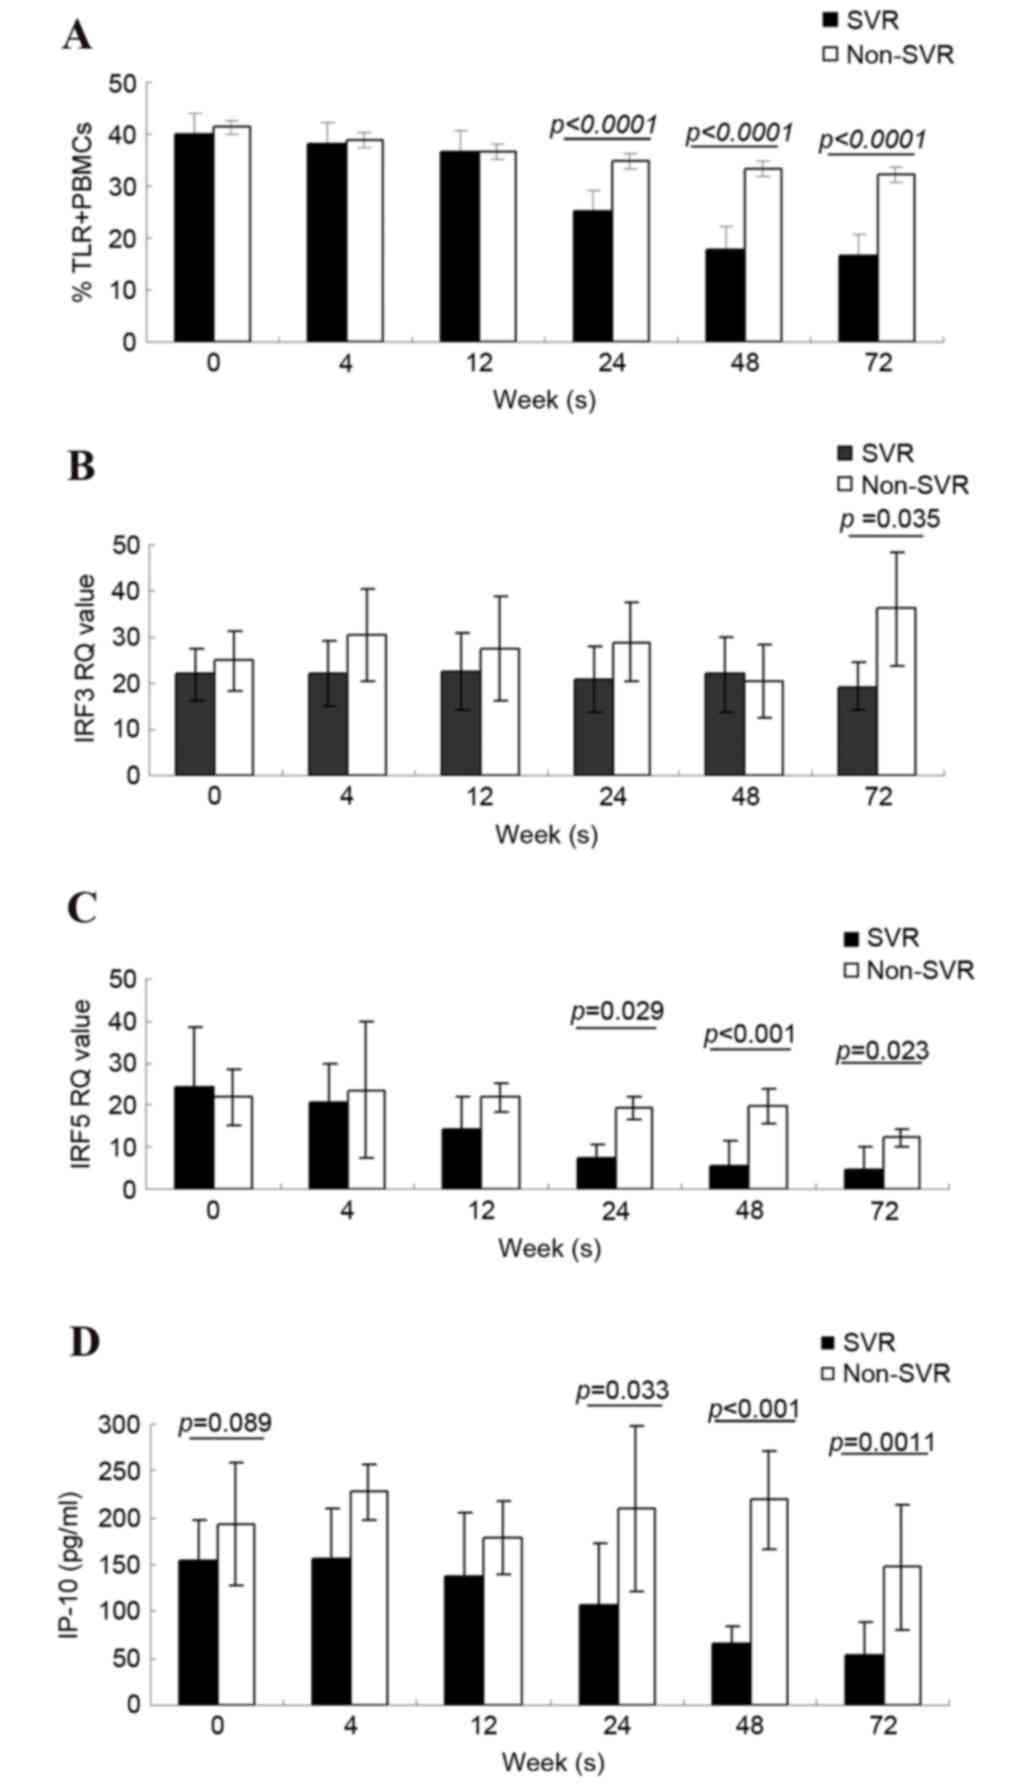 | Figure 2.Alterations in TLR4, IRF3, IRF5 and
IP-10, and differences between the SVR and non-SVR groups 0–72
weeks following start of therapy. Representation of (A) percentage
of TLR4+ PBMCs, (B) IRF3 value (C) IRF5 value and (D)
IP-10 concentration, over the differing time-points of treatment up
to 72 weeks, in SVR and non-SVR groups. Data are presented as the
mean ± standard deviation. TLR4, Toll-like receptor 4; IRF3/5,
interferon regulatory factor 3/5; IP-10, interferon-γ-inducible
protein-10; SVR, sustained virological response; PBMCs, peripheral
blood mononuclear cells; RQ, relative quantification. |
Conversely, the IRF5 levels in the SVR group
decreased during treatment compared with those of the non-SVR
group, even though similar levels were observed at baseline between
the two groups (SVR IRF5 RQ=24.52±13.78 vs. non-SVR IRF5
RQ=21.82±6.59). The IRF5 levels in the SVR group were significantly
lower than those in the non-SVR group at times ranging between 24
and 48 weeks following the initiation of treatment, and 24 weeks
following treatment (SVR IRF5 RQ=7.24±3.14, 5.66±1.67, 4.62±1.58
vs. non-SVR IRF5 RQ=19.19±2.75, 19.80±4.25, 12.20±2.00, P=0.029,
P<0.001 and P=0.0023; Fig.
2C).
The baseline levels of IP-10 in the SVR and non-SVR
groups were 154.59±43.36 and 192.78±65.25 pg/ml, respectively.
There was no statistically significant difference between the two
groups (P=0.089). During the course of treatment, the IP-10 levels
in the SVR group decreased. In addition, IP-10 levels did not
declined in the non-SVR group. At 24–72 weeks, the IP-10 levels in
the SVR group were significantly lower than in the non-SVR group.
The IP-10 expression levels at the final three time points (24, 48
and 72 weeks) were 107.71±65.74, 64.89±20.19 and 52.77±35.1 ng/ml,
respectively in the SVR group vs. 209.85±88.87, 218.88±112.67, and
147.65±66.68 pg/ml in the non-SVR group. P=0.003, P<0.001 and
P=0.0011; Fig. 2D).
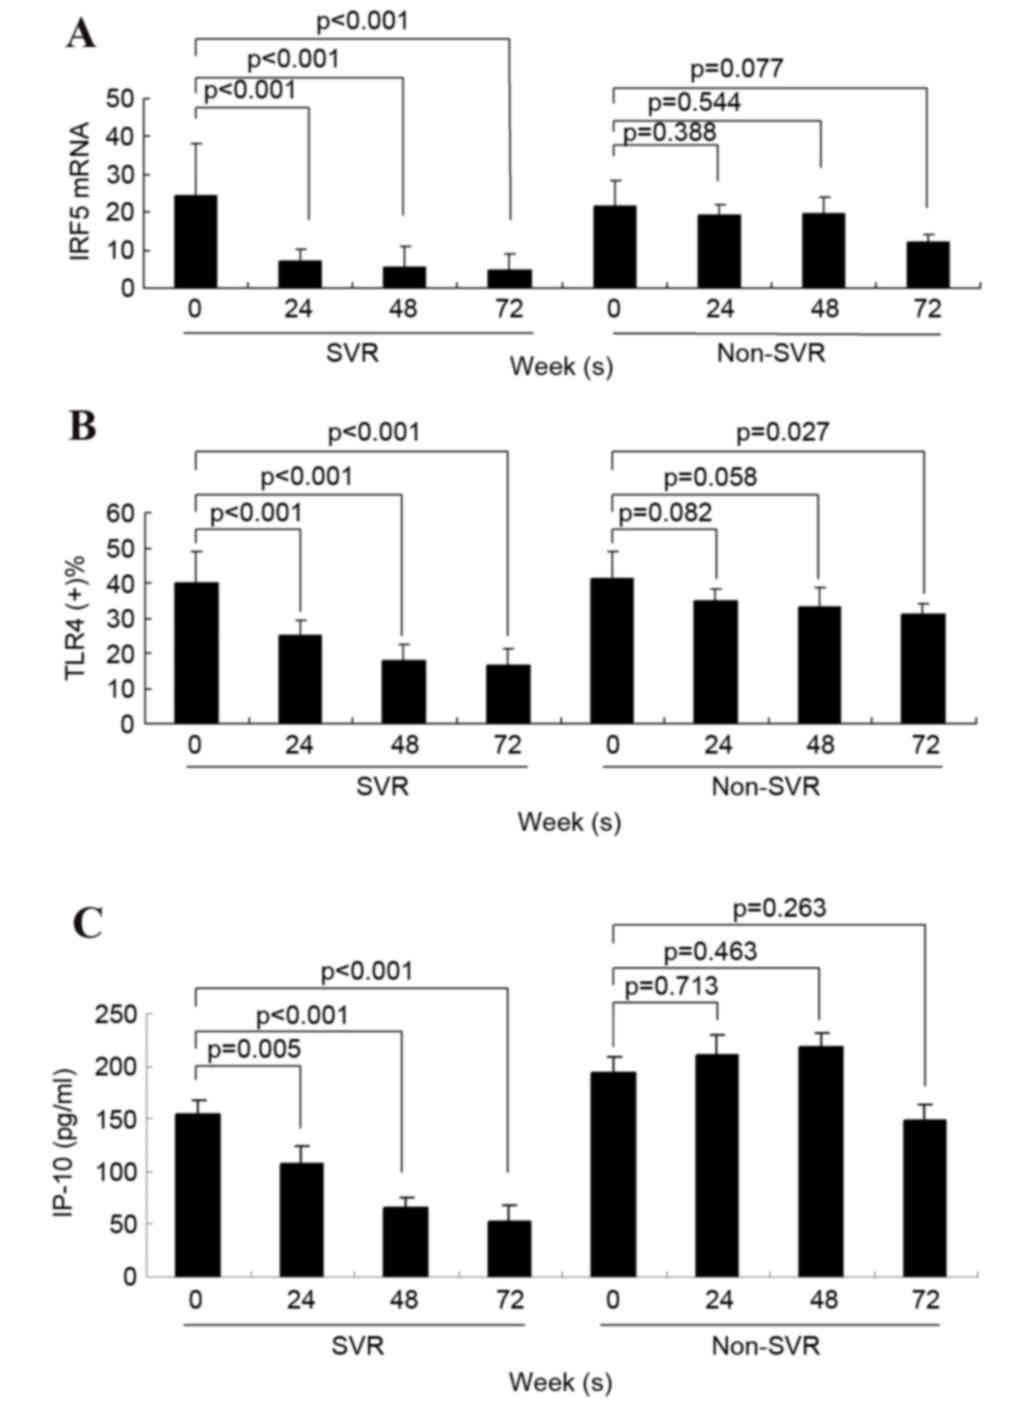
Decrease of serum IP-10 in SVR
Within the SVR group, serum IRF5 mRNA expression,
serum IP-10 concentration and the percentage of TLR4+ PBMCs were
all significantly lower at 24, 48 and 72 weeks compared with the
pretreatment baseline. In the non-SVR group, a significant decrease
in serum IP-10 concentration was not detected following treatment
(Fig. 3).
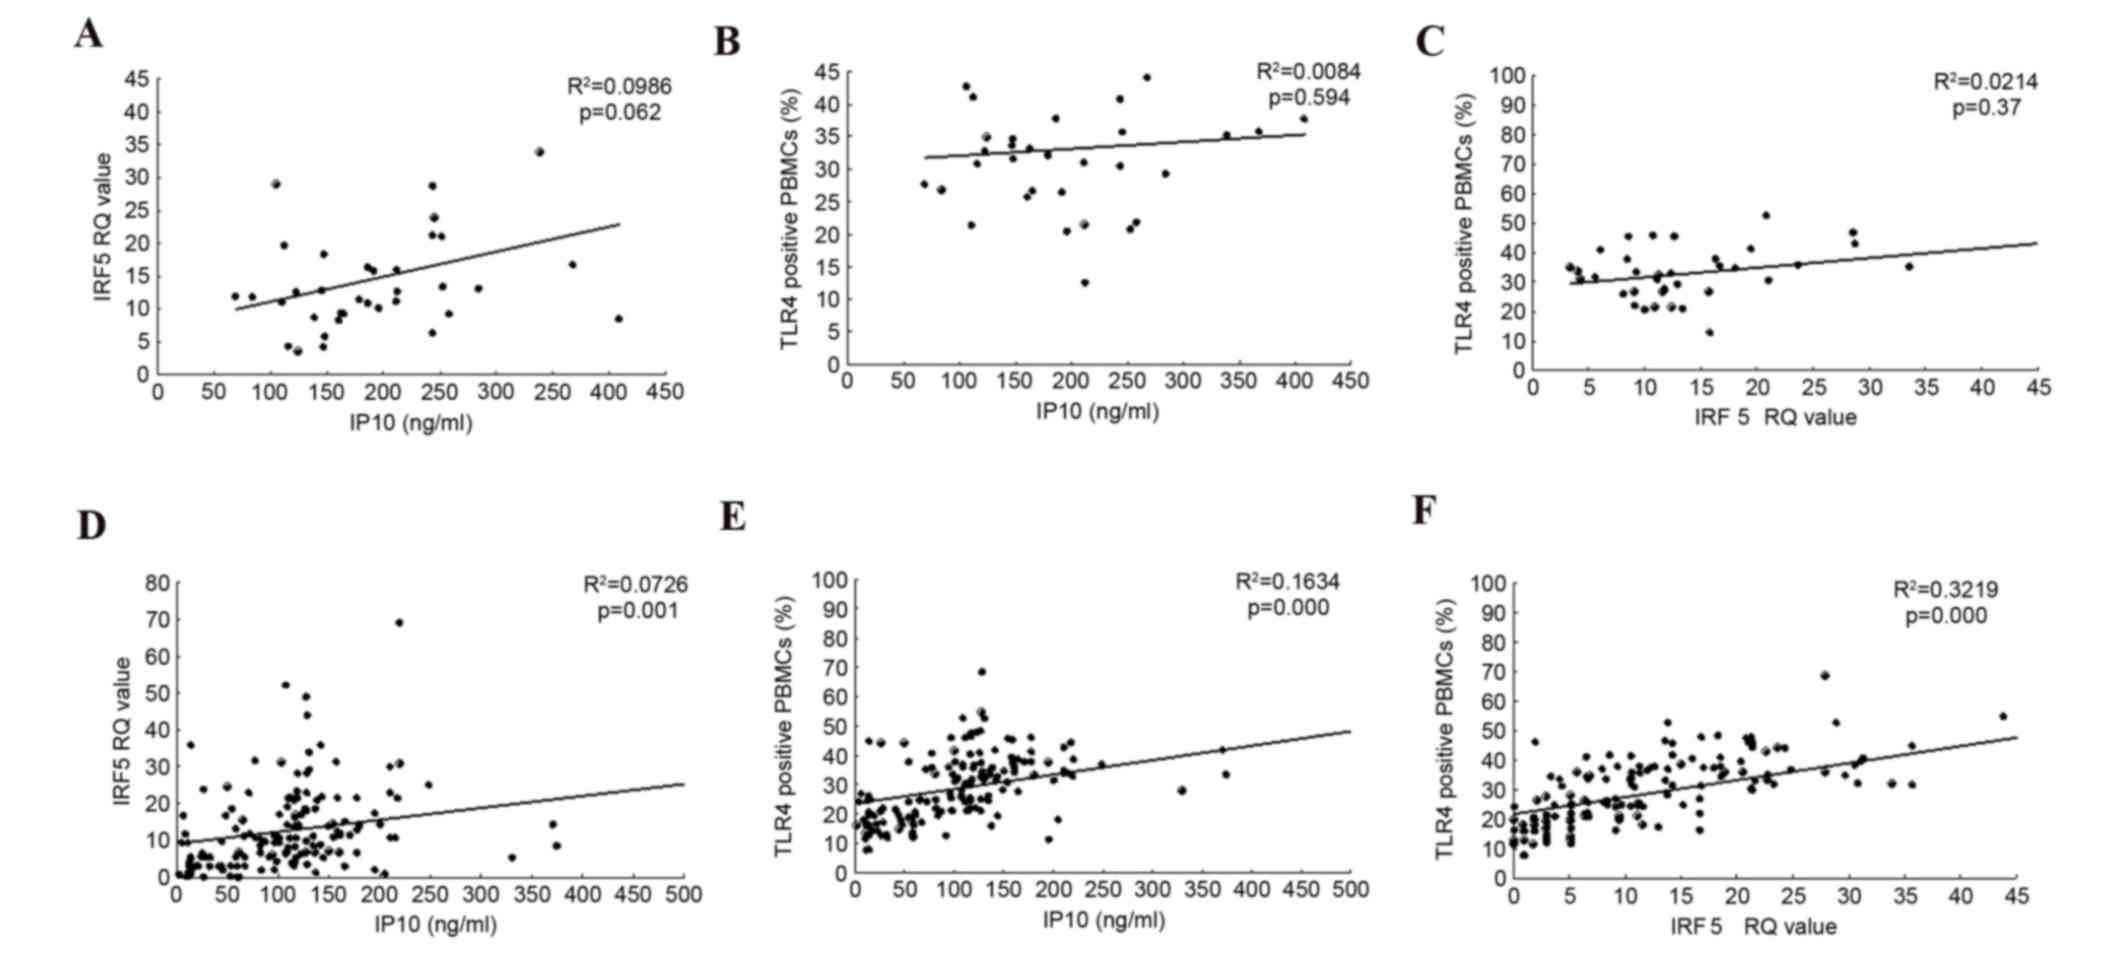
Correlations between serum levels of
IP-10, TLR4 and IRF5
Serum IP-10 levels exhibited a positive correlation
with IRF5 RQ values and with the frequency of TLR4+ PBMCs in the
SVR group, (R2=0.0726, P=0.001, R2=0.1634, P<0.0001,
respectively) but not in the non-SVR group (Fig. 4). In addition, a positive
correlation was observed between IRF5 and the frequency of TLR4+
PBMC cells in the SVR group (Fig.
4).
Discussion
HCV infects 130–170 million people worldwide and
frequently leads to the development of cirrhosis and hepatocellular
carcinoma (HCC) (1). The incidence
of HCV in China is high: ~42 million people are infected, with an
infection rate of ~2.6% (10).
Spontaneous viral clearance occurs in some patients following acute
HCV infection; however, 50–80% of individuals with an acute HCV
infection have it develop into a chronic infection, and are at a
significant risk of progressive liver fibrosis, and subsequent
liver cirrhosis and HCC.
Cytotoxic T cell (CTL) depletion or impairment is
one of the major features of chronic HCV infection. CTLs exhibit a
decline in the secretion of antiviral cytokines and proliferative
capacity, leading to a decrease in cytotoxicity (11,12).
T-cell activation is triggered primarily via major
histocompatibility complex molecules loaded with viral peptides on
antigen-presenting cells (APCs). There are two signaling events
involved in the activation process: Signal 1 is provided by the
T-cell receptor and signal 2 by co-stimulatory signals,
predominantly via cluster of differentiation (CD) 28, which
interacts with its ligands on the surface of APCs: B7-1 (CD80) and
B7-2 (CD86) (13). These
co-stimulatory molecules provide an activating signal, whereas
others provide an inhibitory signal and the balance between the two
determines the outcome of the cellular immune response (14). TLRs are a class of innate immune
receptors that may be expressed on APCs and immune effector cells.
TLR signals are transduced via two main pathways: Myeloid
differentiation primary response 88 (MyD88)-dependent and
MyD88-independent signaling pathways. These two pathways result in
the activation of mitogen-activated activated protein kinases
(MAPKs) and transcription factors that regulate inflammation,
including nuclear factor-κB, which regulates the production of
IFN-β, which in turn induces an increase in the levels of
co-stimulatory molecules, such as CD80 (B7-1) and CD86 (B7-2) on
the surface of APCs, and signals other cells to secrete cytokines
including IL-1, IL-6, IL-8, IL-12 and tumor necrosis factor
(TNF)-α, which all contribute to the activation of the adaptive
immune response (4).
TLR4 is a transmembrane receptor that recognizes LPS
as its primary ligand (15). The
function of TLR4 in LPS-stimulated proinflammatory responses of
Kupffer cells has been well characterized (16,17),
and a previous study has suggested a direct role of TLR4 in hepatic
fibrogenesis (18). Results from
in vitro experiments indicated that TLR4 may have a close
association with sustained HCV infection. TLR4 was upregulated in
BV2 cells incubated with HCV-positive serum, leading to the
secretion of the inflammatory cytokine TNF-α (19). Transfection of QSG7701 cells with
pCN5A; an NS5A expression vector, led to a detection of HCV NS5A in
the cytoplasm, and an upregulation of the mRNA and protein
expression levels of TLR4 (20).
Activation of TLR4 results in inflammation by promoting the
secretion of inflammatory cytokines, such as TNF-α and IL-6, via
the MyD88-dependent pathway; and antiviral effects by promotion of
the secretion of IFN-β via the MyD88-independent pathway (21). A previous study has also
demonstrated that the increased plasma levels of IP-10 in
hyperglycemia are mediated by the TLR4 pathway (22).
PEG-TNF-α 2a is now widely regarded as one of the
most effective antiviral drugs for the treatment of CHC. It
inhibits the replication of HCV RNA in cells, whilst modulating the
immune functions to promote removal of the virus. Genotype-1 virus
is associated with refractory HCV and several patients infected
with this genotype fail to achieve an ideal response to antiviral
therapy. Therefore, it is important to establish a curative effect
prediction index prior to and during the process of treatment to
improve patient compliance, to have an expectation of the long-term
efficacy of treatment and promptly adjust the treatment plan. The
current study investigated the marked alterations in TLR4
expression, IRF3, IRF5 and IP-10 levels in PBMCs of patients with
chronic HCV treated with PEG-IFN plus RBV, and the possible
correlation among these factors. To establish the association
between these factors and the efficacy of IFN therapy, the present
study observed 31 cases of patients with CHC treated with PEG-IFN-α
2a in combination with RBV, and determined the IL-28B genotype, the
serum HCV-RNA load, the percentage of TLR4+ PBMCs, the
mRNA expression levels of IRF3 and IRF5 in PBMCs, and serum IP-10
levels at baseline and 4, 12, 24, 48 and 72 weeks following
treatment, and analyzed the association between the curative
effects and these factors.
In the cohort of Chinese patients in the present
study, 80.65% (25 cases) exhibited SVR, which is significantly
greater compared with the value of 42–52% of patients in Western
countries (1). The remaining six
patients (19.35%) did not reach SVR. TLR4 expression on PBMCs and
levels of serum IP-10, IRF3 and IRF5 at baseline were similar
between the SVR and non-SVR groups.
The results of the present study suggested that the
success of IFN plus RBV treatment for patients with genotype-1 CHC
that exhibit SVR is associated with a reduction in the percentage
of TLR4+ PBMCs, lower levels of IRF5 mRNA in PBMCs, and
a reduction in the levels of inflammatory factors, including IP-10.
IP-10 is categorized in the CXC subfamily of chemokines, which
contain a single and variable amino acid between the first two of
four highly conserved cysteine residues (23). Determination of high levels of
IP-10 in bodily fluids is therefore a marker of host immune
response, particularly T helper 1 polarized T cells (24). It has been suggested that the
chemokine IP-10 is important in chronic inflammatory conditions,
including various autoimmune diseases (25). Previous studies have suggested a
significant association between the expression of the CXC
chemokines and the development of progressive liver injury in
patients with CHC (26,27). IP-10 is a key factor in liver
inflammation, and is expressed in the liver of patients with HCV
(28–30). Various independent studies
indicated that elevated plasma levels of IP-10 predict the failure
of combination therapy (31,32).
Human serum levels of IP-10 range between 20 and 400 pg/ml, with
the higher values commonly observed among individuals with chronic
inflammatory conditions, including HIV infection and HCV (33). To the best of our knowledge, the
present study additionally observed for the first time, that a
decrease in the serum concentration of IP-10 was associated with
SVR, as the difference in IP-10 levels 24–72 weeks following
treatment between the SVR and the non-SVR groups was statistically
significant. A previous study reported significant differences in
pretreatment serum IP-10 concentrations between patients with SVR
or those without; however, our study did not replicate these
findings (34). The reasons for
these discrepancies are unclear, it may due to the smaller sample
size. These results revealed that compared with the baseline levels
of IP-10, the decline of serum levels of IP-10 throughout the
course of treatment is an effective predictor of the occurrence of
SVR in IFN plus RBV treatment of HCV-1.
The results of the present study demonstrated that
serum IP-10 expression levels were positively correlated with IRF5
mRNA RQ value in PBMCs and with the % TLR4+ PBMCs,
(R2=0.0726, P=0.001 and R2=0.1634,
P<0.0001, respectively) in the SVR group, but not in the non-SVR
group. The IRF5 mRNA RQ value in PBMCs also correlated with the
frequency of TLR4+ PBMCs in the SVR group. Assessments
of the associations between serum IP-10 and TLR4, IRF5 and IRF3
revealed that IP-10 concentration was significantly correlated with
TLR4 and IRF5 in the SVR group. The correlation between these
indicators was not observed in the non-SVR group. TLR4 expression
on PBMCs was significantly lower in the SVR group at 24, 48 and 72
weeks into the treatment (P<0.0001). IRF5 levels in the SVR
group were decreased with the extension of treatment time, but this
was not observed in the non-SVR group. IRF5 levels in the SVR group
were significantly lower compared with the non-SVR group at 24–48
weeks, and 24 weeks following treatment (SVR IRF5 RQ=7.24±3.14,
5.66±1.67, 4.62±1.58 vs. non-SVR IRF5 RQ=19.19±2.75, 19.80±4.25,
12.20±2.00, P=0.029, P<0.001, P=0.023). The results suggested
that the dynamic changes of IRF5 may have a certain correlation
with TLR4 in the SVR group.
In conclusion, the results of the present study
demonstrated an association between the decrease in IP-10 levels
and a favorable viral kinetic response during combination treatment
with PEG-IFN-α2a and RBV in patients infected with HCV-1. A similar
association was observed between TLR4+ PBMCs and IRF5
mRNA expression levels. Further studies may include an analysis of
the underlying mechanism of how IFN results in a decline of TLR4
expression, which in turn may affect IRF5 signaling pathways and
result in a decrease of IP-10, which may exhibit an association
with the outcome of antiviral treatment in patients with genotype-1
CHC. The baseline expression levels of TLR4 within PEG-IFN plus
RBV-treated patients may be associated with the expression of the
IL-28B genotype in the host, resulting in the subsequent
development of SVR.
References
|
1
|
Fried MW, Shiffman ML, Reddy KR, Smith C,
Marinos G, Gonçales FL Jr, Häussinger D, Diago M, Carosi G,
Dhumeaux D, et al: Peginterferon alfa-2a plus ribavirin for chronic
hepatitis C virus infection. N Engl J Med. 347:975–982. 2002.
View Article : Google Scholar : PubMed/NCBI
|
|
2
|
Hadziyannis SJ, Sette H Jr, Morgan TR,
Balan V, Diago M, Marcellin P, Ramadori G, Bodenheimer H Jr,
Bernstein D, Rizzetto M, et al: Peginterferon-alpha2a and ribavirin
combination therapy in chronic hepatitis C: A randomized study of
treatment duration and ribavirin dose. Ann Intern Med. 140:346–355.
2004. View Article : Google Scholar : PubMed/NCBI
|
|
3
|
Zhang M, Jiang YF, Xiao XQ, Liu SF, Peng
ML, Liu D and Gong GZ: Dynamic changes in PD-1, TLR3, and TLR4
surface expression on peripheral blood mononuclear cells in chronic
hepatitis C patients undergoing PEG-IFNalpha-2a plus ribavirin
combination therapy. Zhonghua Gan Zang Bing Za Zhi. 21:196–201.
2013.(In Chinese). PubMed/NCBI
|
|
4
|
Akira S, Uematsu S and Takeuchi O:
Pathogen recognition and innate immunity. Cell. 124:783–801. 2006.
View Article : Google Scholar : PubMed/NCBI
|
|
5
|
Machida K, Tsukamoto H, Mkrtchyan H, Duan
L, Dynnyk A, Liu HM, Asahina K, Govindarajan S, Ray R, Ou JH, et
al: Toll-like receptor 4 mediates synergism between alcohol and HCV
in hepatic oncogenesis involving stem cell marker Nanog. Proc Natl
Acad Sci USA. 106:1548–1553. 2009. View Article : Google Scholar : PubMed/NCBI
|
|
6
|
Tedgui A and Mallat Z: Cytokines in
atherosclerosis: Pathogenic and regulatory pathways. Physiol Rev.
86:515–581. 2006. View Article : Google Scholar : PubMed/NCBI
|
|
7
|
Sahin H, Borkham-Kamphorst E, do O NT,
Berres ML, Kaldenbach M, Schmitz P, Weiskirchen R, Liedtke C,
Streetz KL, Maedler K, et al: Proapoptotic effects of the
chemokine, CXCL 10 are mediated by the noncognate receptor TLR4 in
hepatocytes. Hepatology. 57:797–805. 2013. View Article : Google Scholar : PubMed/NCBI
|
|
8
|
Chinese Liver Disease Association, .
Chinese Infectious and Parasitic Diseases Association: The strategy
for prevention and therapy of viral hepatitis C. Chin J Clinic
Hepatol. 12:194–198. 2004.
|
|
9
|
Zeremski M, Dimova R, Brown Q, Jacobson
IM, Markatou M and Talal AH: Peripheral CXCR3-associated chemokines
as biomarkers of fibrosis in chronic hepatitis C virus infection. J
Infect Dis. 200:1774–1780. 2009. View
Article : Google Scholar : PubMed/NCBI
|
|
10
|
Cui Y and Jia J: Update on epidemiology of
hepatitis B and C in China. J Gastroenterol Hepatol. 28 Suppl
1:S7–S10. 2013. View Article : Google Scholar
|
|
11
|
Gruener NH, Lechner F, Jung MC, Diepolder
H, Gerlach T, Lauer G, Walker B, Sullivan J, Phillips R, Pape GR
and Klenerman P: Sustained dysfunction of antiviral CD8+ T
lymphocytes after infection with hepatitis C virus. J Virol.
75:5550–5558. 2001. View Article : Google Scholar : PubMed/NCBI
|
|
12
|
Wedemeyer H, He XS, Nascimbeni M, Davis
AR, Greenberg HB, Hoofnagle JH, Liang TJ, Alter H and Rehermann B:
Impaired effector function of hepatitis C virus2specific CD8+ T
cells in chronic hepatitis C virus infection. J Immunol.
169:3447–3458. 2002. View Article : Google Scholar : PubMed/NCBI
|
|
13
|
Greenwald RJ, Freeman GH and Sharpe AH:
The B7 family revisited. Annu Rev Immunol. 23:515–548. 2005.
View Article : Google Scholar : PubMed/NCBI
|
|
14
|
Nurieva R, Thomas S, Nguyen T,
Martin-Orozco N, Wang Y, Kaja MK, Yu XZ and Dong C: T-cell
tolerance or function is determined by combinatorial costimulatory
signals. EMBO J. 25:2623–2633. 2006. View Article : Google Scholar : PubMed/NCBI
|
|
15
|
Beutler B: Inferences, questions and
possibilities in toll-like receptor signalling. Nature.
430:257–263. 2004. View Article : Google Scholar : PubMed/NCBI
|
|
16
|
Machida K, Cheng KT, Sung VM, Levine AM,
Foung S and Lai MM: Hepatitis C virus induces toll-like receptor 4
expression, leading to enhanced production of beta interferon and
interleukin-6. J Virol. 80:866–874. 2006. View Article : Google Scholar : PubMed/NCBI
|
|
17
|
Dolganiuc A, Norkina O, Kodys K, Catalano
D, Bakis G, Marshall C, Mandrekar P and Szabo G: Viral and host
factors induce macrophage activation and loss of toll-like receptor
tolerance in chronic HCV infection. Gastroenterology.
133:1627–1636. 2007. View Article : Google Scholar : PubMed/NCBI
|
|
18
|
Guo J and Friedman SL: Toll-like receptor
4 signaling in liver injury and hepatic fibrogenesis. Fibrogenesis
Tissue Repair. 3:212010. View Article : Google Scholar : PubMed/NCBI
|
|
19
|
Liu Q and Wang ZH: The changes of TLR4
expression and TNF-a secretion in BV2 cells after handled with HCV
positive serum. Courrent Immunlolgy. 31:219–222. 2011.(In
Chinese).
|
|
20
|
Wen M, Xiao XQ and Gong GZ: Hepatitis C
virus NS5A protein stimulates TLR4 expression. Chin J Clin Hepatol.
27:49–52. 2011.
|
|
21
|
Andreakos E, Foxwell B and Feldmann M: Is
targeting toll-like receptors and their signaling pathway a useful
therapeutic approach to modulating cytokine-driven inflammation?
Immunol Rev. 202:250–265. 2004. View Article : Google Scholar : PubMed/NCBI
|
|
22
|
Devaraj S and Jialal I: Increased
secretion of IP-10 from monocytes under hyperglycemia is via the
TLR2 and TLR4 pathway. Cytokine. 47:6–10. 2009. View Article : Google Scholar : PubMed/NCBI
|
|
23
|
Mihm S, Schweyer S and Ramadori G:
Expression of the chemokine IP-10 correlates with the accumulation
of hepatic IFN-gamm a and IL-18mRNA in chronic hepatitis C but not
in hepatitis B. J Med Virol. 70:562–570. 2003. View Article : Google Scholar : PubMed/NCBI
|
|
24
|
Fiorentino DF, Bond MW and Mosmann TR: Two
types of mouse T helper cells. IV. Th2 clones secrete a factor that
inhibits cytokine production by Th1 clones. J Exp Med.
170:2081–2095. 1989. View Article : Google Scholar : PubMed/NCBI
|
|
25
|
Antonelli A, Ferrari SM, Giuggioli D,
Ferrannini E, Ferri C and Fallahi P: Chemokine (C-X-C motif) ligand
(CXCL)10 in autoimmune diseases. Autoimmun Rev. 13:272–280. 2014.
View Article : Google Scholar : PubMed/NCBI
|
|
26
|
Larrubia JR, Benito-Martínez S, Calvino M,
Sanz-de-Villalobos E and Parra-Cid T: Role of chemokines and their
receptors in viral persistence and liver damage during chronic
hepatitis C virus infection. World J Gastroenterol. 14:7149–7159.
2008. View Article : Google Scholar : PubMed/NCBI
|
|
27
|
Zeremski M, Petrovic LM, Chiriboga L,
Brown QB, Yee HT, Kinkhabwala M, Jacobson IM, Dimova R, Markatou M
and Talal AH: Intrahepatic levels of CXCR3-associated chemokines
correlate with liver inflammation and fibrosis in chronic hepatitis
C. Hepatology. 48:1440–1450. 2008. View Article : Google Scholar : PubMed/NCBI
|
|
28
|
Harvey CE, Post JJ, Palladinetti P,
Freeman AJ, Ffrench RA, Kumar RK, Marinos G and Lloyd AR:
Expression of the chemokine IP-10 (CXCL10) by hepatocytes in
chronic hepatitis C virus infection correlates with histological
severity and lobular inflammation. J Leukoc Biol. 74:360–369. 2003.
View Article : Google Scholar : PubMed/NCBI
|
|
29
|
Narumi S, Tominaga Y, Tamaru M, Shimai S,
Okumura H, Nishioji K, Itoh Y and Okanoue T: Expression of
IFN-inducible protein-10 in chronic hepatitis. J Immunol.
158:5536–5544. 1997.PubMed/NCBI
|
|
30
|
Shields PL, Morland CM, Salmon M, Qin S,
Hubscher SG and Adams DH: Chemokine and chemokine receptor
interactions provide a mechanism for selective T cell recruitment
to specific liver compartments within hepatitis C-infected liver. J
Immunol. 163:6236–6243. 1999.PubMed/NCBI
|
|
31
|
Romero AI, Lagging M, Westin J, Dhillon
AP, Dustin LB, Pawlotsky JM, Neumann AU, Ferrari C, Missale G,
Haagmans BL, et al: Interferon (IFN)-gamma-inducible protein-10:
Association with histological results, viral kinetics, and outcome
during treatment with pegylated IFN-alpha 2a and ribavirin for
chronic hepatitis C virus infection. J Infect Dis. 194:895–903.
2006. View
Article : Google Scholar : PubMed/NCBI
|
|
32
|
Butera D, Marukian S, Iwamaye AE,
Hembrador E, Chambers TJ, Di Bisceglie AM, Charles ED, Talal AH,
Jacobson IM, Rice CM and Dustin LB: Plasma chemokine levels
correlate with the outcome of antiviral therapy in patients with
hepatitis C. Blood. 106:1175–1182. 2005. View Article : Google Scholar : PubMed/NCBI
|
|
33
|
Diago M, Castellano G, García-Samaniego J,
Pérez C, Fernández I, Romero M, Iacono OL and García-Monzón C:
Association of pretreatment serum interferon gamma inducible
protein 10 levels with sustained virological response to
peginterferon plus ribavirin therapy in genotype 1 infected
patients with chronic hepatitis C. Gut. 55:374–379. 2006.
View Article : Google Scholar : PubMed/NCBI
|
|
34
|
Darling JM, Aerssens J, Fanning G,
McHutchison JG, Goldstein DB, Thompson AJ, Shianna KV, Afdhal NH,
Hudson ML, Howell CD, et al: Quantitation of pretreatment serum
interferon-γ-inducible protein-10 improves the predictive value of
an IL28B gene polymorphism for hepatitis C treatment response.
Hepatology. 53:14–22. 2011. View Article : Google Scholar : PubMed/NCBI
|