Introduction
Osteosarcoma, as the most common primary bone
sarcoma, has a relatively high morbidity rate in young individuals
(1). In the first two decades of
life, ~60% of cases of bone cancer are osteosarcoma (2). Despite intensive investigation,
effective therapies for osteosarcoma have remained unchanged for
the last 30 years, with a five-year survival rate of ≤20% (3). Metastasis is considered to be one of
the primary reasons for the unsatisfactory improvements in survival
rates (4). To develop effective
treatments for osteosarcoma, further investigations are required to
understand the pathogenesis of this malignant tumor.
There is evidence that molecular interactions are
important in the mechanism of tumorigenesis and as a risk factor
(5). Gene-gene interaction
analysis is an essential tool to elucidate the nature of human
traits (6). At present, it is
clear that investigating the interactions of genes can provide
increased understanding of disease risk factors, compared with the
independent effects of gene variations (7,8).
Park et al (9) identified a
novel genetic risk factor for colorectal cancer using gene-gene
interaction analysis. Shen et al (10) found that the interaction between
DAB1 and RELN potentially increases the risk of autism in the Han
Chinese population. Network analysis is an effective method to
examine interactions and enables the potential identification of
communities corresponding to genes with associated functions by
module mining (11).
The present study aimed to investigate the
differentially expressed genes (DEGs) and the interaction network
of osteosarcoma samples, compared with normal samples. The network
was furthered divided into different interaction modules, and genes
in the differential expression modules were verified in the other
two datasets.
Materials and methods
Gene expression profiles
The gene expression profiles of osteosarcoma samples
and matched normal samples were downloaded from the Gene Expression
Omnibus (http://www.ncbi.nlm.nih.gov/geo/). For profile
retrieval, four keywords (osteosarcoma, normal, human and array
express) were used. In addition, eligible profiles were those
including at least three samples. In total, three datasets were
obtained (GSE36001, GSE19276 and GSE16088). A total of 21
osteosarcoma samples and four normal bone tissues were included in
GSE36001 (12), which was based on
the Illumina human-6 v2.0 expression beadchip platform. GSE19276
(13) was comprised of 44
osteosarcoma samples and five normal bone tissue samples, based on
the Agilent-012391 Whole Human Genome Oligo Microarray G4112A
platform. For the GSE16088 (14)
dataset, the platform used was the Affymetrix Human Genome U133A
Array, which included 17 osteosarcoma samples and six normal bone
tissue samples. The probe symbols in these profiles were converted
into gene symbols, and the average values of genes with multiple
corresponding probes were used as the expression values.
Screening of DEGs
To identify which genes were differentially
expressed in the osteosarcoma samples and normal tissue samples in
GSE16088, the significance analysis of microarrays (SAM) (15) method was applied rather than a
t-test to control the rate of false positives using the false
discovery rate (FDR). The cut-off level was FDR<0.05.
Subsequently, principle component analysis (PCA) (16) was performed to determine whether
the selected DEGs were able to distinguish the osteosarcoma samples
from the normal samples in this dataset.
Protein-protein interaction (PPI)
network
The Human Protein Reference Database, which stores
the most information on PPIs, was examined to determine the
interactions of the genes in GSE16088. Briefly, Pearson
coefficients between each interacting gene pair in osteosarcoma and
normal conditions were calculated using R version 3.1.3 (www.r-project.org), and pairs with coefficients
>0.5 were retained for the construction of two
condition-specific interaction networks. The two networks were then
integrated to remove the common interaction between the normal and
osteosarcoma PPI networks, leaving the interactions of the DEGs
only. Finally, the topological properties (17) of this differential interaction
network were examined, including the degree, betweenness and hub
score.
Differential expression module
mining
The modules, which comprise a group of specific
genes or proteins in the PPI network, exert important effects. The
multilevel community (18)
function of the igraph package (R/igraph 1.0.0; www.igraph.org) was utilized for network module
mining. Screening of the modules containing >15 genes was used
to perform differential expression analysis in the GSE16088 profile
using the GlobalAncova package in R language (version 3.42.0;
https://www.bioconductor.org/packages/release/bioc/html/GlobalAncova.html).
P<0.01 was considered to indicate a differential expression
module.
Enrichment analysis
Genes in the differential expression modules were
subjected to Database for Annotation, Visualization and Integrated
Discovery for Gene Ontology (GO) and Kyoto Encyclopedia of Genes
and Genomes (KEGG) enrichment (david.ncifcrf.gov). The GO and KEGG terms with
FDR<0.05 were regarded as significant functions and
pathways.
Differential expression module
verification
To verify the differential expression modules of the
osteosarcoma samples, the GSE36001 and GSE19276 datasets were used.
The expression levels of genes from modules 117, 135 and 152 in
these two datasets were calculated, based on which a hierarchical
clustering method was applied to confirm whether it was possible to
confirm the differential expression profile of these genes between
the osteosarcoma and normal samples.
Results
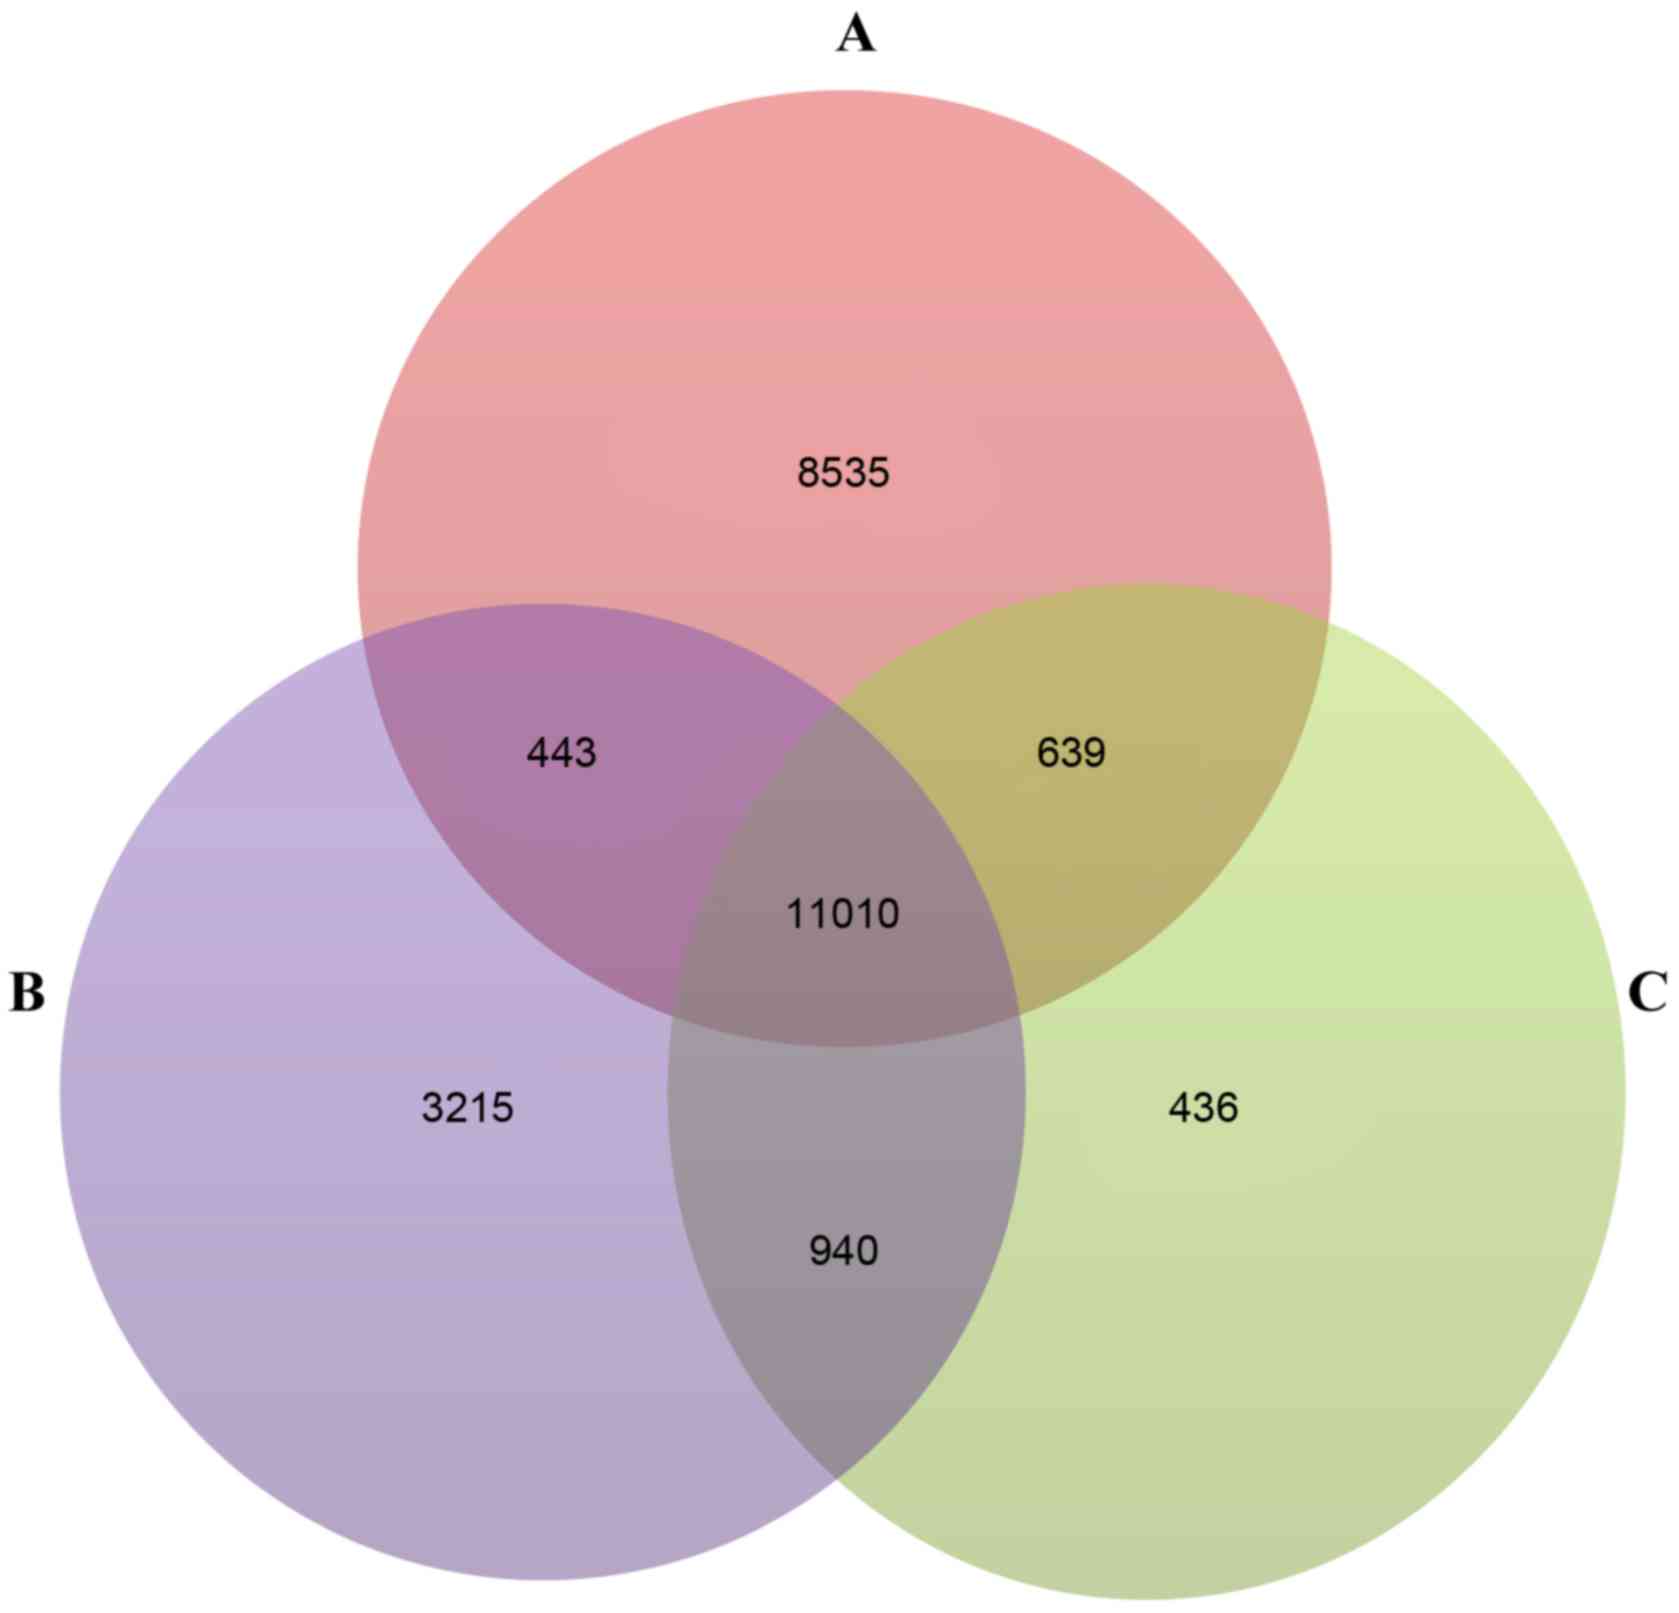
Screening of DEGs
Following preprocessing, 24,614, 19,595 and 13,025
genes were obtained in the GSE36001, GSE19276 and GSE16088
datasets, respectively. A total of 11,010 genes were identified as
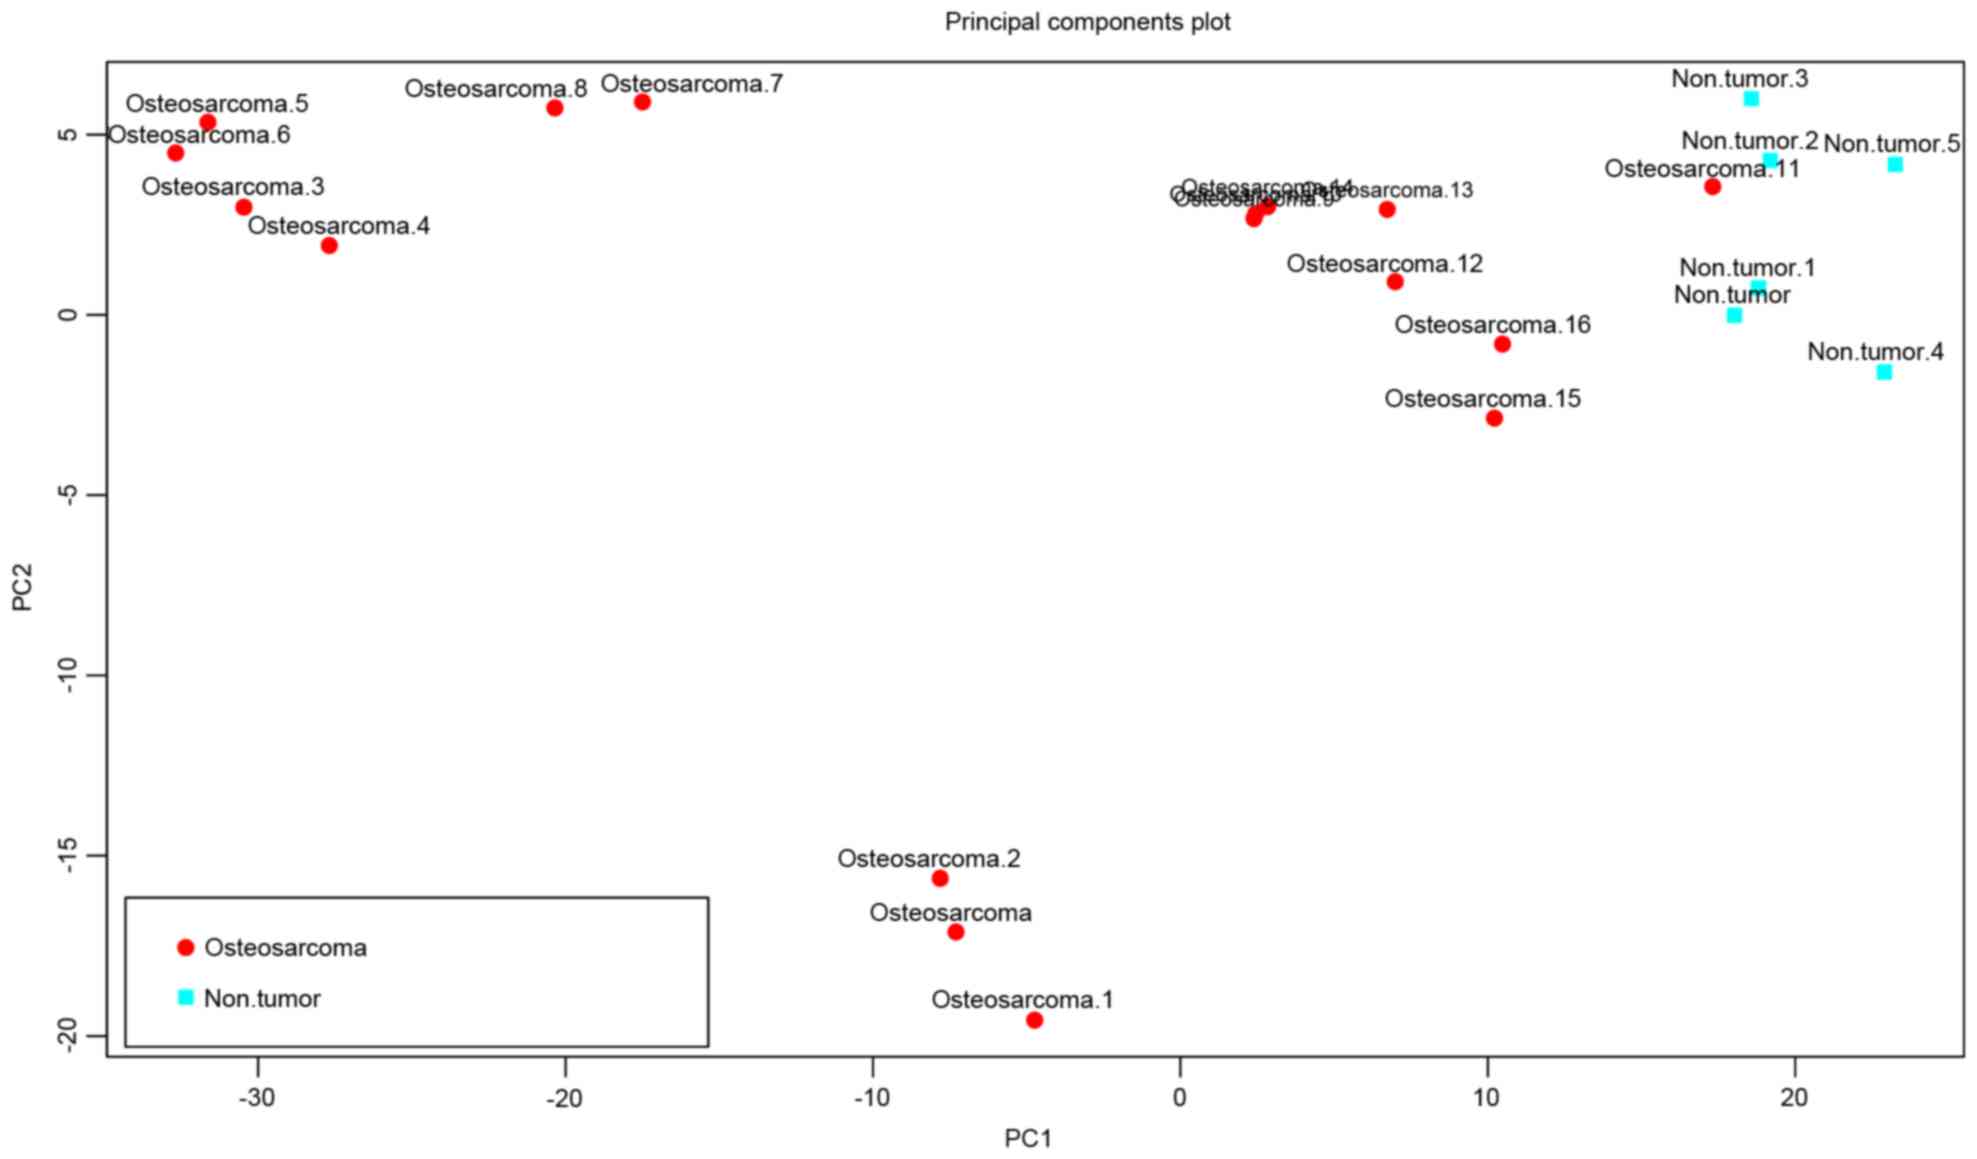
genes common genes to the three datasets (Fig. 1A-C). Using the SAM method, 616 DEGs
were screened out between the osteosarcoma and normal samples in
the GSE16088 dataset. The results of the following PCA analysis
showed that these DEGs enabled isolation of the osteosarcoma
samples from the normal samples (Fig.
2).
PPI network of the DEGs
Proteins are the components, which perform the
majority of the biological functions in the human body and usually
function in interactive pairs during these processes. The PPI
network of the DEGs in the GSE16088 dataset comprised 13,820
protein interaction pairs and 5,780 genes. The degree represents
the importance of a node in the network, whereas the betweenness is
the distance between a node and other nodes in the network. The 10
genes with the highest degree, betweenness and hub score are listed
in Table I, and included tumor
protein p53 (TP53), sarcoma (SRC), mitogen-activated protein kinase
1 (MAPK1) and estrogen receptor 1 (ESR1). SRC was the gene with the
highest degree, betweenness and hub score.
 | Table I.Top 10 gene nodes with highest
degrees, hub scores and betweenness in the differentially expressed
gene network. |
Table I.
Top 10 gene nodes with highest
degrees, hub scores and betweenness in the differentially expressed
gene network.
| Gene | Degree | Gene | Hub score | Gene | Betweenness |
|---|
| SRC | 109 | SRC | 1 | SRC | 0.046616 |
| GRB2 | 97 | ESR1 | 0.777419 | TP53 | 0.042007 |
| EP300 | 96 | SHC1 | 0.76465 | SMAD2 | 0.032582 |
| TP53 | 96 | GRB2 | 0.763542 | GRB2 | 0.031228 |
| ESR1 | 87 | MAPK1 | 0.741441 | CTNNB1 | 0.029823 |
| MAPK1 | 79 | EGFR | 0.696561 | ESR1 | 0.02954 |
| FYN | 76 | FYN | 0.620895 | EP300 | 0.028269 |
| CSNK2A1 | 76 | PRKCD | 0.585712 | SMAD3 | 0.02601 |
| SMAD2 | 75 | EP300 | 0.582316 | EGFR | 0.024847 |
| SMAD3 | 75 | LCK | 0.579908 | MAPK1 | 0.023829 |
Differential expression module
mining
The multilevel community method identified 23
modules in the PPI network of the DEGs, and each of these modules
had >15 genes (Table II).
Following screening using the GlobalAncova package, a total of
three modules (modules 117, 135 and 152) were selected as the
differential expression modules (P<0.01; Table II).
| Table II.Differential expression modules. |
Table II.
Differential expression modules.
| Module | F-value | P.perm |
|---|
| 117 | 3.27 |
0 |
| 152 | 2.87 |
0 |
| 135 | 3.15 |
0 |
| 86 | 2.64 | 0.01 |
| 123 | 3.02 | 0.01 |
| 101 | 2.14 |
0.02 |
| 124 | 2.53 |
0.02 |
| 130 | 3.10 |
0.02 |
| 103 | 2.82 |
0.02 |
| 96 | 2.63 |
0.02 |
| 147 | 2.73 |
0.03 |
| 85 | 2.54 |
0.03 |
| 120 | 2.66 |
0.03 |
| 106 | 2.76 |
0.04 |
| 121 | 2.53 |
0.04 |
| 127 | 2.93 |
0.04 |
| 61 | 2.65 |
0.05 |
| 159 | 2.55 |
0.05 |
| 122 | 2.70 |
0.05 |
| 153 | 3.11 |
0.05 |
| 137 | 2.77 |
0.06 |
| 50 | 2.49 |
0.06 |
| 114 | 2.60 |
0.12 |
Enrichment analysis
The genes in the differential expression modules
underwent GO and pathway enrichment analyses (Table III). The genes in module 117 were
primarily associated with the autophagy function, including
intracellular membrane-bounded organelle and intracellular
organelle, whereas module 135 was primarily enriched in the
fibroblast growth factor receptor (FGFR) signaling pathway and MAPK
signaling pathway. Module 152 was most closely involved with
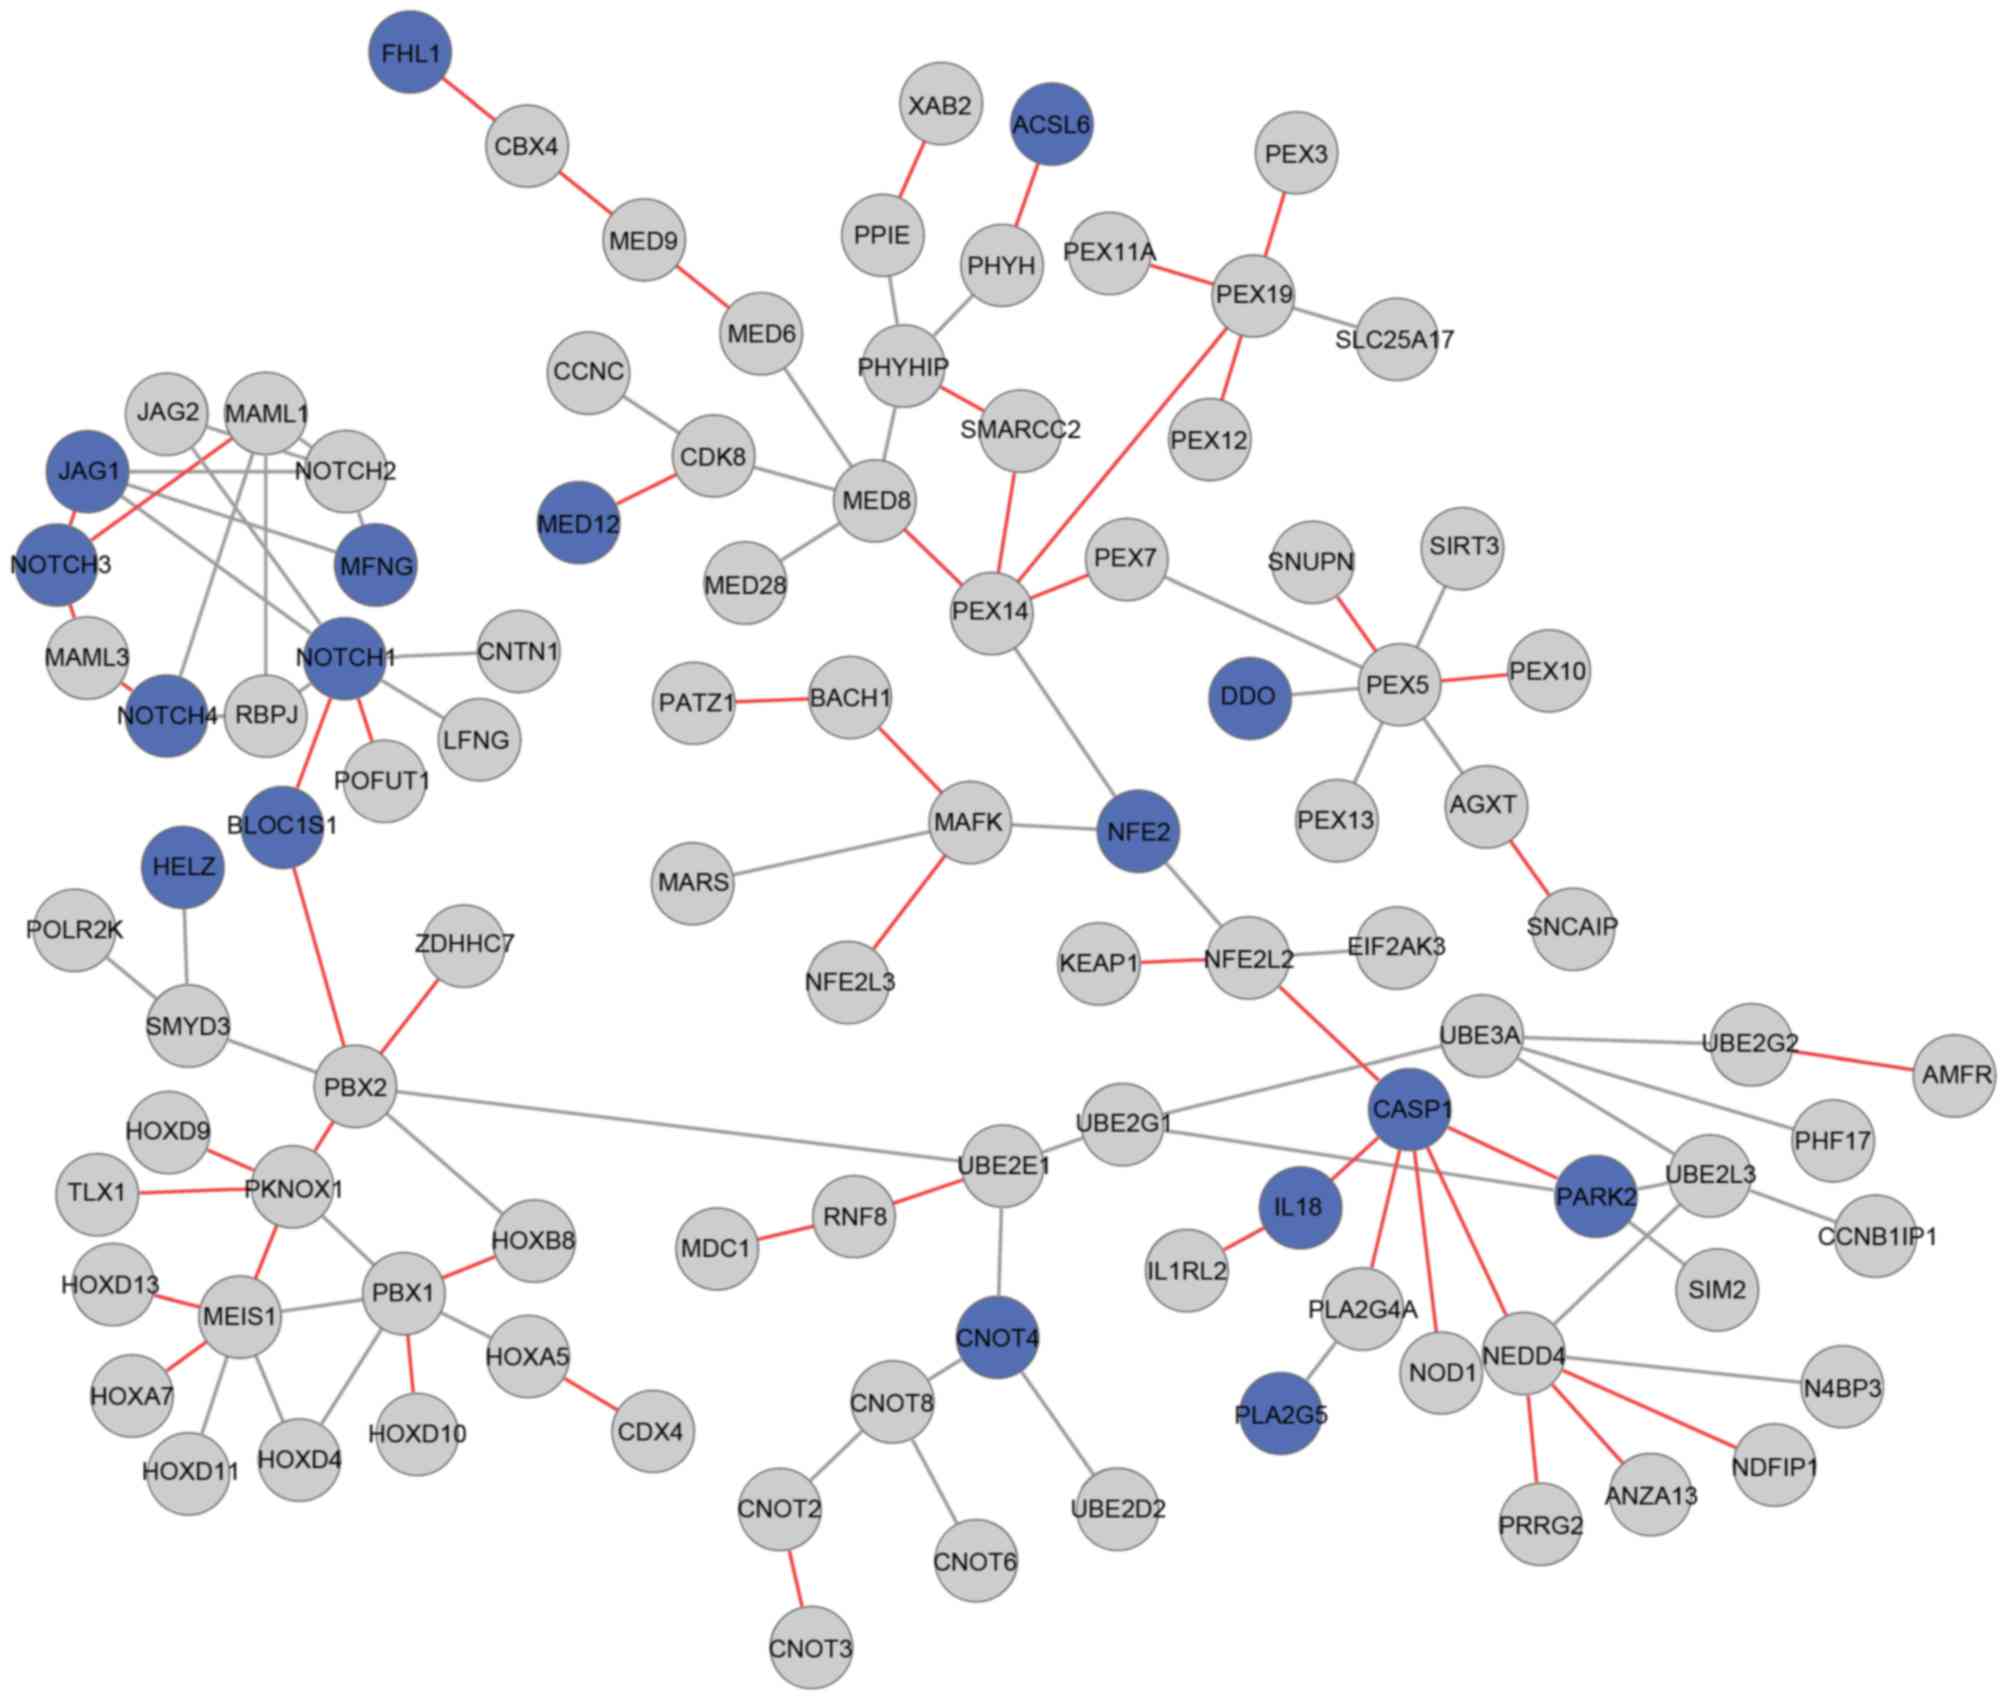
tumor-associated terms, including the Notch signaling pathway.
Furthermore, in module 152, the neurogenic locus notch homolog
protein 3 (NOTCH3) and caspase 1 (CASP1) genes only interacted with
other genes in the osteosarcoma status (Fig. 3).
| Table III.Top 10 enriched function and pathway
terms of the differential expression modules. |
Table III.
Top 10 enriched function and pathway
terms of the differential expression modules.
| Module | GO term | P-value | Bonferroni |
|---|
| 117 | GO:0030118~clathrin
coat | 1.21E-15 | 2.23E-13 |
| 117 | GO:0030135~coated
vesicle | 1.90E-13 | 3.47E-11 |
| 117 | GO:0030117~membrane
coat | 6.94E-13 | 1.27E-10 |
| 117 | GO:0044431~Golgi
apparatus part | 7.05E-13 | 1.29E-10 |
| 117 |
GO:0043231~intracellular membrane-bounded
organelle | 2.41E-11 | 4.41E-09 |
| 117 | GO:0005794~Golgi
apparatus | 1.64E-10 | 3.00E-08 |
| 117 | GO:0030125~clathrin
vesicle coat | 3.03E-10 | 5.54E-08 |
| 117 |
hsa04142:Lysosome | 5.38E-10 | 2.37E-08 |
| 117 |
GO:0043229~intracellular organelle | 8.78E-10 | 1.61E-07 |
| 117 |
GO:0006897~endocytosis | 2.02E-09 | 1.22E-06 |
| 135 | GO:0044459~plasma
membrane part | 1.46E-16 | 1.73E-14 |
| 135 |
REACT_9470:Signaling by FGFR | 1.30E-13 | 2.33E-12 |
| 135 |
REACT_1505:Integration of energy
metabolism | 7.89E-13 | 1.42E-11 |
| 135 |
GO:0005834~heterotrimeric G-protein
complex | 1.79E-11 | 2.80E-09 |
| 135 | hsa04130:SNARE
interactions in vesicular transport | 5.08E-11 | 2.95E-09 |
| 135 | GO:0034703~cation
channel complex | 1.39E-10 | 2.17E-08 |
| 135 |
REACT_15380:Diabetes pathways | 8.10E-09 | 1.46E-07 |
| 135 |
GO:0019897~extrinsic to plasma
membrane | 1.99E-09 | 3.10E-07 |
| 135 | GO:0031201~SNARE
complex | 2.71E-09 | 4.23E-07 |
| 135 | hsa04010:MAPK
signaling pathway | 1.31E-08 | 7.58E-07 |
| 152 | GO:0006625~protein
targeting to peroxisome | 1.74E-14 | 1.07E-11 |
| 152 |
GO:0042579~microbody | 1.07E-13 | 1.10E-11 |
| 152 |
GO:0005777~peroxisome | 1.07E-13 | 1.10E-11 |
| 152 |
GO:0043574~peroxisomal transport | 3.71E-14 | 2.28E-11 |
| 152 |
GO:0005778~peroxisomal membrane | 2.56E-13 | 2.61E-11 |
| 152 |
GO:0031903~microbody membrane | 2.56E-13 | 2.61E-11 |
| 152 | hsa04330:Notch
signaling pathway | 8.59E-13 | 3.27E-11 |
| 152 |
GO:0044438~microbody part | 6.73E-12 | 6.86E-10 |
| 152 |
GO:0044439~peroxisomal part | 6.73E-12 | 6.86E-10 |
| 152 | GO:0007219~Notch
signaling pathway | 3.26E-12 | 2.01E-09 |
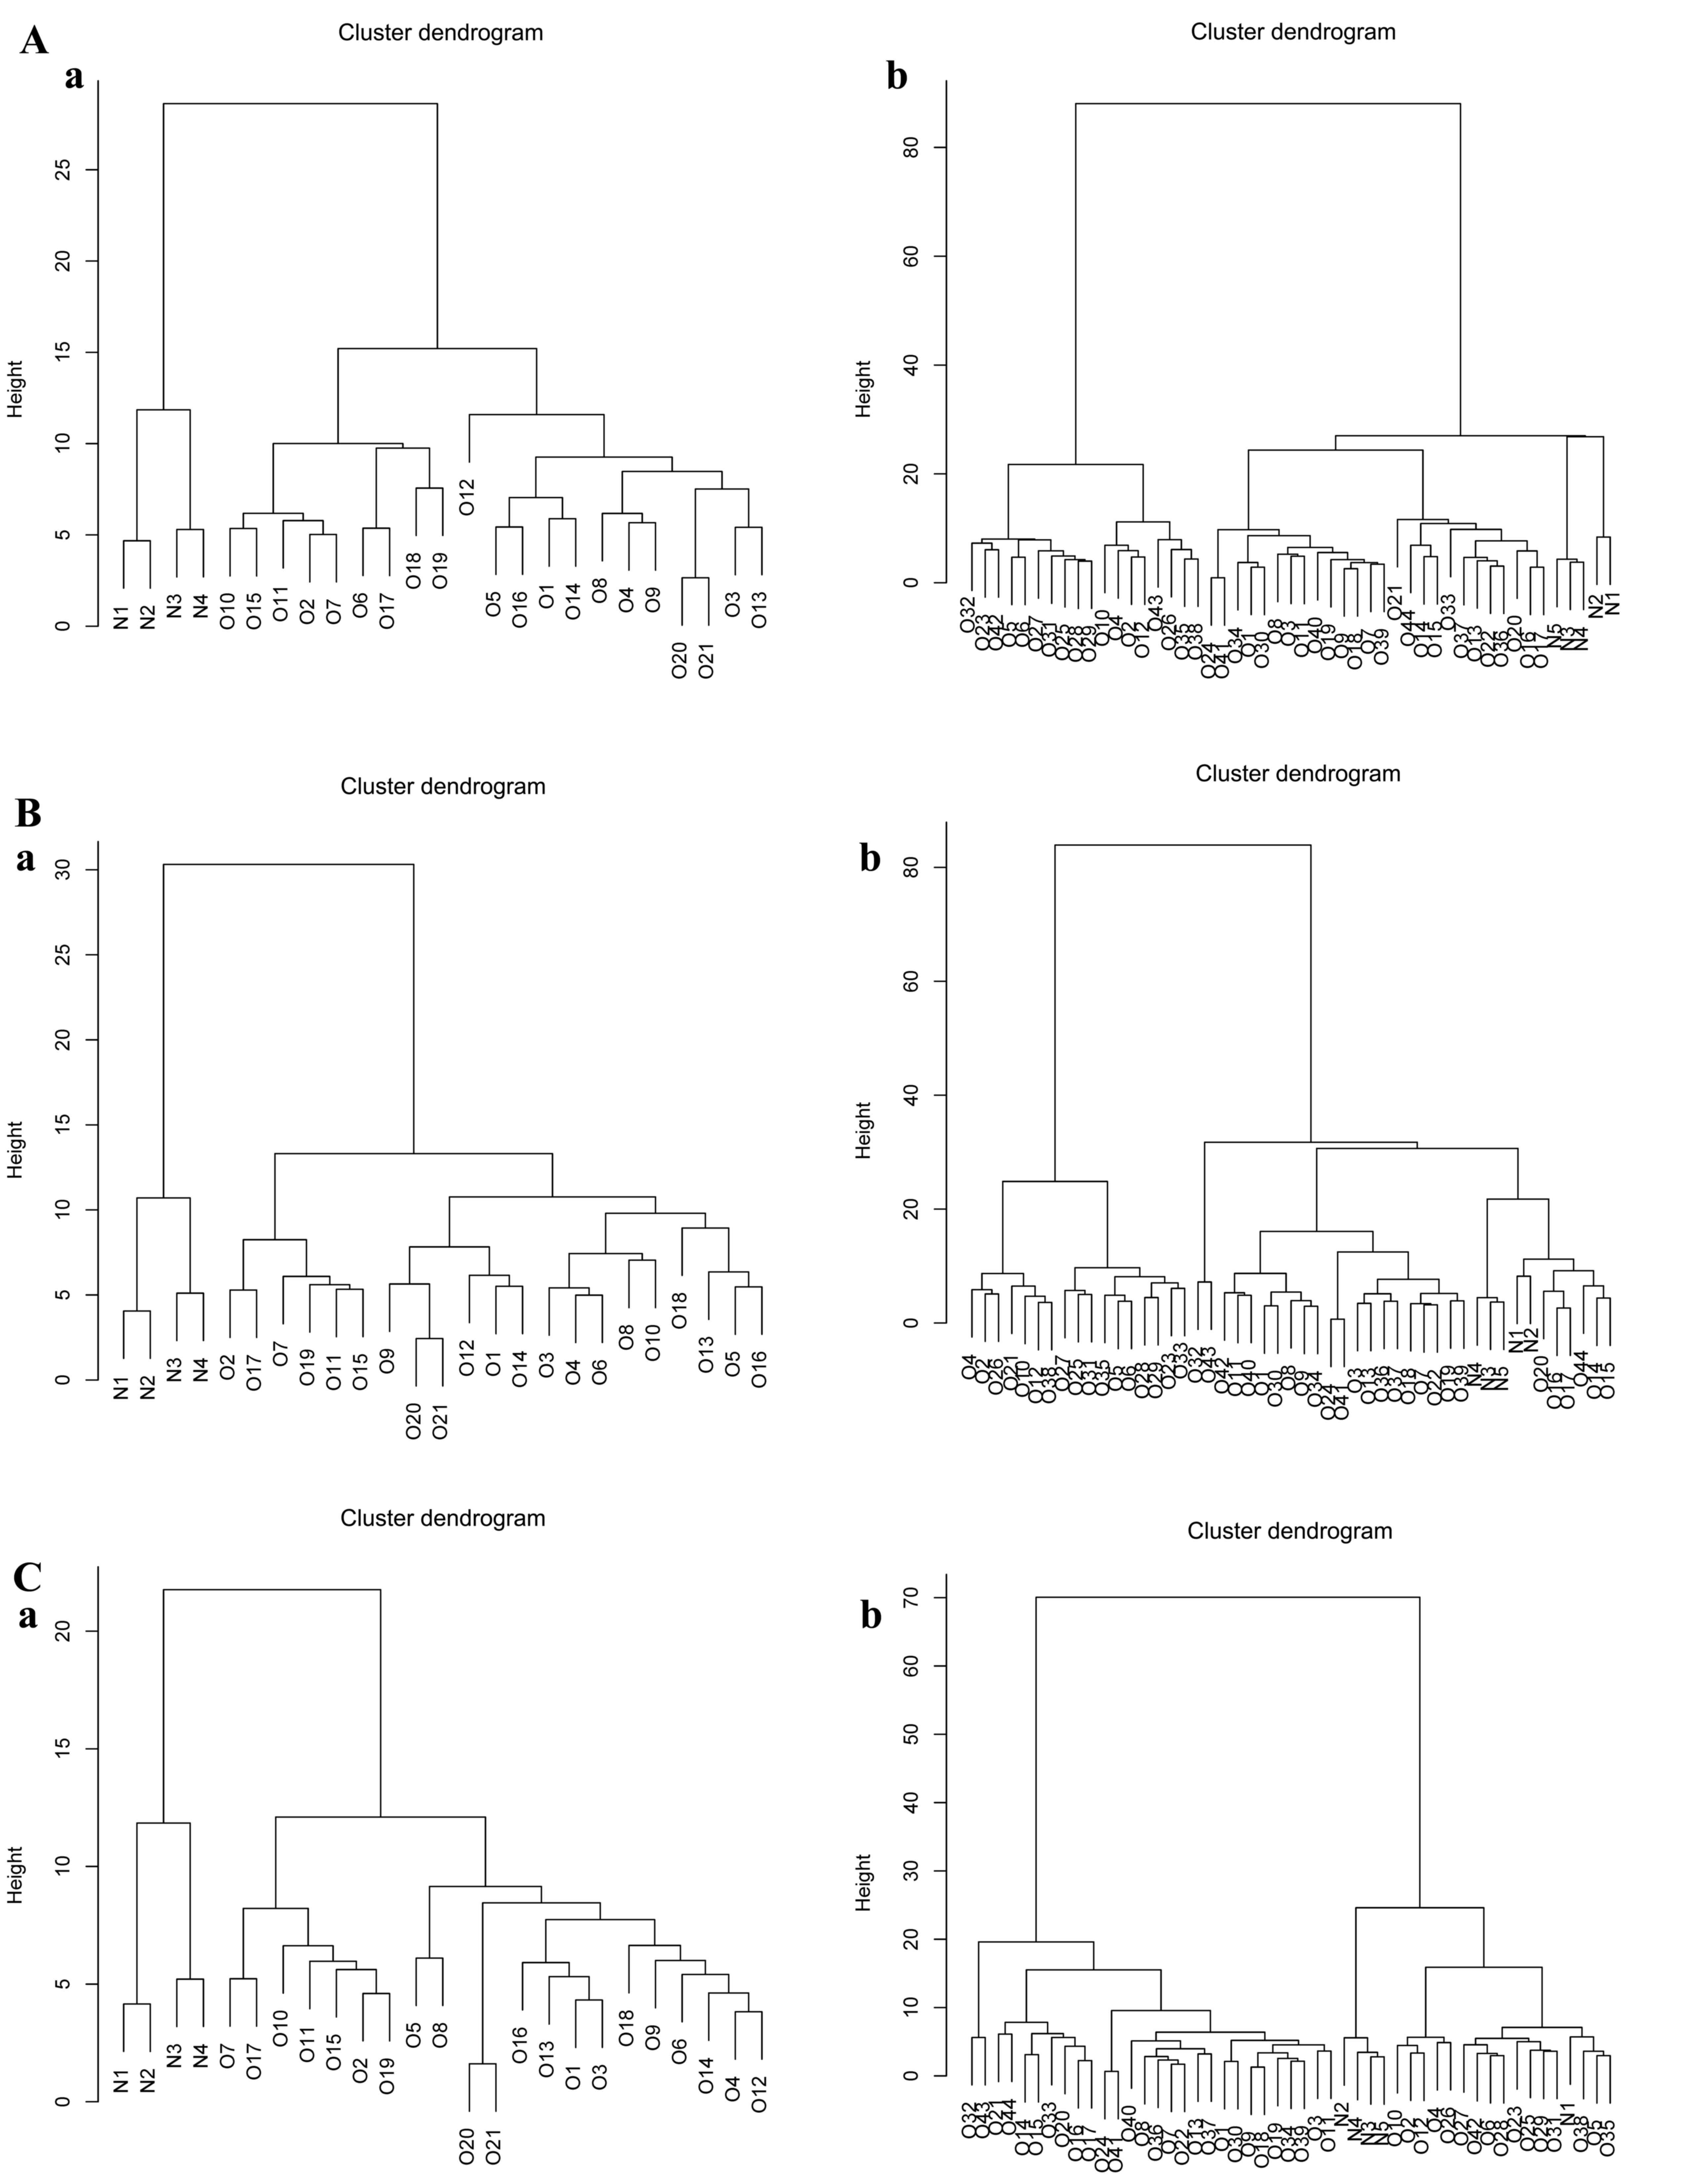
Differential expression module
verification
The genes in the differential expression modules
were assessed for their ability to classify different samples in
the other two expression profiles to verify the results from the
GSE16088 dataset. The 151 genes in differential expression module
117 (Fig. 4A) were able to
distinguish osteosarcoma genes from normal genes. The genes in
modules 135 and 152 also enabled satisfactory distinguishing of
osteosarcoma samples (Fig. 4B and
C).
Discussion
In order to investigate the possible molecular
pathogenesis of osteosarcoma, the expression profiles and the
interactions between DEGs were examined in the present study. A
total of 616 DEGs were obtained in the osteosarcoma samples using
the GSE16088 microarray data. A tumor-specific PPI network was then
constructed using 13,820 interaction pairs and 5,780 genes,
including normal specific-interaction pairs and disease-specific
interaction pairs. Subsequently, the significantly connected
sub-network modules were mined in this PPI network, from which
three differential expression modules were identified. Functional
and pathway enrichment analyses were used to analyze the enriched
terms of the genes in these three modules. Finally, the genes in
these modules were confirmed to be able to distinguish osteosarcoma
samples from normal samples in the GSE36001 and GSE19276
datasets.
The topological properties of the degree,
betweenness and hub score of the PPI network were examined. DEGs,
including SRC, TP53 and ESR1 were found to be altered significantly
in the osteosarcoma status, compared with the normal status. Thus,
it was inferred that their roles were markedly altered in the
osteosarcoma samples, and they may have specific contributions to
the occurrence and development of this disease.
SRC showed the highest degree, betweenness and hub
score levels, suggesting that SRC is the central gene during the
development of osteosarcoma, and all the other connections were
initiated by SRC. SRC is a known proto-oncogene (19), and the vital roles of SRC in colon
cancer (20) and breast cancer
(21) have been reported. SRC is
involved in regulating cellular signaling, which results in the
migration and invasion of cancer cells (22). In addition, evidence shows that SRC
is a prognostic gene for tumors in osteosarcoma (23). In the present study, genes in the
PPI network with a high rank in terms of their topological
properties were considered to be causal genes for osteosarcoma.
TP53, MAPK1 and ESR1 were also in the list of top 10 genes with
important roles in the PPI network. It has been reported that these
are all important oncogenes and osteosarcoma-associated genes
(24). In a previous study on
sporadic osteosarcoma reported ~3–7% had TP53 mutations (25). TP53 suppresses the proliferation,
metastasis and angiogenesis of osteosarcoma cells through
inhibition of the phosphoinositide 3-kinase/AKT/mammalian target of
rapamycin pathway (26). ESR1 can
initiate or enhance the transcription of genes responding to
estrogen stimulation (27) and the
DNA methylation of ESR1 is reported to be a useful prognostic
indicator in osteosarcoma (24).
By examining the expression levels of genes in the
differential expression modules, it was found that not all of these
genes were DEGs in the osteosarcoma samples, suggesting it is not
sufficient to investigate the mechanism of osteosarcoma by
analyzing the differential expression of DEGs alone. The present
study found that the interaction between NOTCH3 and CASP1 only
existed under the osteosarcoma status in module 152, indicating
that they were potential osteosarcoma-associated genes. The
involvement of Notch signaling is important in cancer, and NOTCH3
is reported to be involved in the growth and survival of lung
cancer (28). The expression of
NOTCH3 is upregulated in osteosarcoma cells (29). The activation of caspase is
involved in the execution of apoptosis in humans, and activation of
caspase 1 has been shown to affect apoptosis in human prostate
cancer (30). The overexpression
of CASP1 has been confirmed as an inducer of apoptosis in mammalian
cells (31).
The PCA analysis performed in the present study
demonstrated that the differential expression module was verified
in the GSE36001 and GSE19276 datasets. Therefore, the differential
expression modules were able to isolate osteosarcoma samples from
normal samples. The reliable molecular modules identified based on
the analysis of gene expression profiles and interaction mining may
be provide valuable clues to elucidating the molecular pathogenesis
of tumors.
In conclusion, TP53, MAPK1, ESR1, NOTCH3 and CASP1
may be important in the development of osteosarcoma, which provides
valuable clues to investigate the pathogenesis of osteosarcoma
together with three differential expression modules.
References
|
1
|
Mirabello LJ, Yeager M, Mai PL,
Gastier-Foster JM, Gorlick R, Khanna C, Patiño-Garcia A,
Sierrasesúmaga L, Lecanda F, Andrulis IL, et al: Abstract 5574:
High prevalence of germline TP53 mutations in young osteosarcoma
cases. Cancer Res. 75 Suppl:S55742015. View Article : Google Scholar
|
|
2
|
Mirabello L, Troisi RJ and Savage SA:
Osteosarcoma incidence and survival rates from 1973 to 2004: Data
from the surveillance, epidemiology, and end results program.
Cancer. 115:1531–1543. 2009. View Article : Google Scholar : PubMed/NCBI
|
|
3
|
Lussier DM, Johnson JL, Hingorani P and
Blattman JN: Combination immunotherapy with α-CTLA-4 and α-PD-L1
antibody blockade prevents immune escape and leads to complete
control of metastatic osteosarcoma. J Immunother Cancer. 3:212015.
View Article : Google Scholar : PubMed/NCBI
|
|
4
|
Carrle D and Bielack S: Osteosarcoma lung
metastases detection and principles of multimodal therapyPediatric
and Adolescent Osteosarcoma. Springer; New York, NY: pp. 165–184.
2010
|
|
5
|
Betts JA, French JD, Brown MA and Edwards
SL: Long-range transcriptional regulation of breast cancer genes.
Genes Chromosomes Cancer. 52:113–125. 2013. View Article : Google Scholar : PubMed/NCBI
|
|
6
|
Hall MA, Verma SS, Wallace J, Lucas A,
Berg RL, Connolly J, Crawford DC, Crosslin DR, De Andrade M, Doheny
KF, et al: Biology-driven gene-gene interaction analysis of
age-related cataract in the eMERGE network. Genet Epidemiol.
39:376–384. 2015. View Article : Google Scholar : PubMed/NCBI
|
|
7
|
Kallberg H, Padyukov L, Plenge RM,
Ronnelid J, Gregersen PK, van der Helm-van Mil AH, Toes RE,
Huizinga TW, Klareskog L and Alfredsson L: Epidemiological
Investigation of Rheumatoid Arthritis study group: Gene-gene and
gene-environment interactions involving HLA-DRB1, PTPN22 and
smoking in two subsets of rheumatoid arthritis. Am J Hum Genet.
80:867–875. 2007. View
Article : Google Scholar : PubMed/NCBI
|
|
8
|
Seddighzadeh M, Korotkova M, Källberg H,
Ding B, Daha N, Kurreeman FA, Toes RE, Huizinga TW, Catrina AI,
Alfredsson L, et al: Evidence for interaction between
5-hydroxytryptamine (serotonin) receptor 2A and MHC type II
molecules in the development of rheumatoid arthritis. Eur J Hum
Genet. 18:821–826. 2010. View Article : Google Scholar : PubMed/NCBI
|
|
9
|
Park J, Kim I, Jung KJ, Kim S, Jee SH and
Yoon SK: Gene-gene interaction analysis identifies a new genetic
risk factor for colorectal cancer. J Biomed Sci. 22:732015.
View Article : Google Scholar : PubMed/NCBI
|
|
10
|
Shen Y, Xun G, Guo H, He Y, Ou J, Dong H,
Xia K and Zhao J: Association and gene-gene interactions study of
reelin signaling pathway related genes with autism in the Han
Chinese population. Autism Res. 9:436–442. 2016. View Article : Google Scholar : PubMed/NCBI
|
|
11
|
Wang YR, Jiang K, Feldman LJ, Bickel PJ
and Huang H: Inferring gene-gene interactions and functional
modules using sparse canonical correlation analysis. Ann Appl Stat.
9:300–323. 2015. View Article : Google Scholar
|
|
12
|
Kresse SH, Rydbeck H, Skårn M, Namløs HM,
Barragan-Polania AH, Cleton-Jansen AM, Serra M, Liestøl K,
Hogendoorn PC, Hovig E, et al: Integrative analysis reveals
relationships of genetic and epigenetic alterations in
osteosarcoma. PLoS One. 7:e482622012. View Article : Google Scholar : PubMed/NCBI
|
|
13
|
Endo-Munoz L, Cumming A, Sommerville S,
Dickinson I and Saunders NA: Osteosarcoma is characterised by
reduced expression of markers of osteoclastogenesis and antigen
presentation compared with normal bone. Br J Cancer. 103:73–81.
2010. View Article : Google Scholar : PubMed/NCBI
|
|
14
|
Paoloni M, Davis S, Lana S, Withrow S,
Sangiorgi L, Picci P, Hewitt S, Triche T, Meltzer P and Khanna C:
Canine tumor cross-species genomics uncovers targets linked to
osteosarcoma progression. BMC Genomics. 10:6252009. View Article : Google Scholar : PubMed/NCBI
|
|
15
|
Grace C and Nacheva EP: Significance
analysis of microarrays (SAM) offers clues to differences between
the genomes of adult Philadelphia positive ALL and the lymphoid
blast transformation of CML. Cancer Inform. 11:173–183. 2012.
View Article : Google Scholar : PubMed/NCBI
|
|
16
|
McClure R, Balasubramanian D, Sun Y,
Bobrovskyy M, Sumby P, Genco CA, Vanderpool CK and Tjaden B:
Computational analysis of bacterial RNA-Seq data. Nucleic Acids
Res. 41:e1402013. View Article : Google Scholar : PubMed/NCBI
|
|
17
|
McDermott JE, Diamond DL, Corley C,
Rasmussen AL, Katze MG and Waters KM: Topological analysis of
protein co-abundance networks identifies novel host targets
important for HCV infection and pathogenesis. BMC Syst Biol.
6:282012. View Article : Google Scholar : PubMed/NCBI
|
|
18
|
Subelj L and Bajec M: Unfolding
communities in large complex networks: Combining defensive and
offensive label propagation for core extraction. Phys Rev E Stat
Nonlin Soft Matter Phys. 83:0361032011. View Article : Google Scholar : PubMed/NCBI
|
|
19
|
Liu W, Yue F, Zheng M, Merlot A, Bae DH,
Huang M, Lane D, Jansson P, Lui GY, Richardson V, et al: The
proto-oncogene c-Src and its downstream signaling pathways are
inhibited by the metastasis suppressor, NDRG1. Oncotarget.
6:8851–8874. 2015. View Article : Google Scholar : PubMed/NCBI
|
|
20
|
Bartolomé RA, García-Palmero I, Torres S,
López-Lucendo M, Balyasnikova IV and Casal JI: IL-13 receptor α2
signaling requires a scaffold protein, FAM120A, to activate the FAK
and PI3K pathways in colon cancer metastasis. Cancer Res.
75:2434–2444. 2015. View Article : Google Scholar : PubMed/NCBI
|
|
21
|
Correction: Associations and Interactions
between Ets-1 and Ets-2 and Coregulatory proteins, SRC-1, AIB1, and
NCoR in breast cancer. Clin Cancer Res. 21:2190–2191. 2015.
View Article : Google Scholar : PubMed/NCBI
|
|
22
|
Guarino M: Src signaling in cancer
invasion. J Cell Physiol. 223:14–26. 2010.PubMed/NCBI
|
|
23
|
Hu C, Deng Z, Zhang Y, Yan L, Cai L, Lei J
and Xie Y: The prognostic significance of Src and p-Src expression
in patients with osteosarcoma. Med Sci Monit. 21:638–645. 2015.
View Article : Google Scholar : PubMed/NCBI
|
|
24
|
Sonaglio V, De Carvalho AC, Toledo SR,
Salinas-Souza C, Carvalho AL, Petrilli AS, de Camargo B and Vettore
AL: Aberrant DNA methylation of ESR1 and p14ARF genes could be
useful as prognostic indicators in osteosarcoma. Onco Targets Ther.
6:713–723. 2013.PubMed/NCBI
|
|
25
|
McIntyre JF, Smith-Sorensen B, Friend SH,
Kassell J, Borresen AL, Yan YX, Russo C, Sato J, Barbier N, Miser
J, et al: Germline mutations of the p53 tumor suppressor gene in
children with osteosarcoma. J Clin Oncol. 12:925–930. 1994.
View Article : Google Scholar : PubMed/NCBI
|
|
26
|
Song R, Tian K, Wang W and Wang L: P53
suppresses cell proliferation, metastasis, and angiogenesis of
osteosarcoma through inhibition of the PI3K/AKT/mTOR pathway. Int J
Surg. 20:80–87. 2015. View Article : Google Scholar : PubMed/NCBI
|
|
27
|
Stossi F, Barnett DH, Frasor J, Komm B,
Lyttle CR and Katzenellenbogen BS: Transcriptional profiling of
estrogen-regulated gene expression via estrogen receptor (ER) alpha
or ERbeta in human osteosarcoma cells: Distinct and common target
genes for these receptors. Endocrinology. 145:3473–3486. 2004.
View Article : Google Scholar : PubMed/NCBI
|
|
28
|
Yi F, Amarasinghe B and Dang TP: Manic
fringe inhibits tumor growth by suppressing Notch3 degradation in
lung cancer. Am J Cancer Res. 3:490–499. 2013.PubMed/NCBI
|
|
29
|
Li R, Zhang W, Cui J, Shui W, Yin L, Wang
Y, Zhang H, Wang N, Wu N, Nan G, et al: Targeting BMP9-promoted
human osteosarcoma growth by inactivation of notch signaling. Curr
Cancer Drug Targets. 14:274–285. 2014. View Article : Google Scholar : PubMed/NCBI
|
|
30
|
Guo Y and Kyprianou N: Restoration of
transforming growth factor beta signaling pathway in human prostate
cancer cells suppresses tumorigenicity via induction of
caspase-1-mediated apoptosis. Cancer Res. 59:1366–1371.
1999.PubMed/NCBI
|
|
31
|
Whyte M: ICE/CED-3 proteasesin apoptosis.
Trends Cell Biol. 6:245–248. 1996. View Article : Google Scholar : PubMed/NCBI
|