Introduction
Avascular necrosis of the femoral head (ANFH) is a
progressive pathological process that leads to avascular necrosis
and collapse of the femoral head due to an obstructed blood supply,
resulting in impaired hip joint function and permanent disability
(1,2). ANFH causes significant morbidity as
well as impairment of daily function to patients (3). In addition, ANFH is considered
irreversible, therefore any diagnostic strategy or therapeutic
intervention for ANFH is best introduced at an early stage
(4).
Glucocorticoid (GC) administration is known to be
the most common non-traumatic cause of ANFH (5). GCs are widely used to treat most
inflammatory disorders and are also included in most chemotherapy
protocols (6). Therefore, ANFH due
to GC use is a potential major complication for a large patient
group (6). However, the exact
pathogenesis of AFNH associated with GC remains to be fully
elucidated. There are several alternative mechanisms including fat
embolization, modified artery constriction, intramedullary pressure
changes, coagulation disorders, circulatory impairment and cell
dysfunction. There is evidence that apoptosis of osteoblasts and
osteocytes, not compromised vascularity, is the direct effect and
primary etiology of GC-induced ANFH (7,8).
Kerachian et al (9).
suggested that GCs may contribute to differential gene expression
in ANFH in rats, and revealed that GC-induced ANFH in rats may be
mediated by α-2-macroglobulin (A2M). In addition, Samara
et al (10). demonstrated
that osteoprotegerin, receptor activator of nuclear factor-κB
(RANK) and RANK ligand mRNA levels were higher in the necrotic part
of the femoral head of patients with avascular necrosis compared
with the normal site (9). However,
despite the strong association of GC with ANFH, the underlying
mechanisms are yet to be fully understood, in particular the
mechanisms associated with the change of gene expression
pattern.
Using the same microarray data as Kerachian et
al (9), the present study
performed bioinformatic analysis with the aim of identifying
additional genes associated with GC-induced ANFH. In the present
study, differentially expressed genes (DEGs) were identified in
femoral head samples of steroid-induced ANFH rats compared with
placebo-treated rat samples. Gene Ontology (GO) and pathway
enrichment analyses were performed upon these DEGs. An enrichment
map was generated to identify overrepresented themes with regard to
the enriched GO terms, and a text-mining gene association network
associated with femoral necrosis was generated, followed by the
construction of a transcriptional regulation network and a
protein-protein interaction (PPI) network. An improved
understanding of the molecular mechanisms underlying GC-induced
ANFH will likely provide novel targets for diagnostic and
therapeutic treatment.
Materials and methods
Microarray data
The ArrayExpress Archive of Functional Genomics Data
(http://www.ebi.ac.uk/arrayexpress) is
one of three major international repositories for functional
genomics public data, alongside the Gene Expression Omnibus at NCBI
and the DDBJ Omics Archive (11).
The mRNA expression profile deposited by Kerachian et al
(9), was downloaded from the
ArrayExpress database (accession number, E-MEXP-2751; http://www.ebi.ac.uk/arrayexpress/experiments/E-MEXP-2751/).
The platform used was A-AFFY-99-Affymetrix GeneChip Rat Exon 1.0 ST
Array [RaEx-1_0-st-v1]. As the original study described (9), glucocorticoid pellets or placebo
pellets were administered to age-matched Wistar Kyoto rats for 6
months. Following the 6 month period of the experiment, rats were
sacrificed and tissue samples were obtained from the proximal
femur, containing the femoral head. In the present study, a dataset
consisting of 5 steroid-induced ANFH rat samples (named
Steroid_ANFH) and 5 placebo-treated rat samples (named
Placebo_no_ANFH) were used in the follow-up analysis.
Data preprocessing and screening of
DEGs
The raw data (CEL. format files) were preprocessed
in R using the Bioconductor package, oligo (12). Data were subjected to background
correction, quantile normalization, and calculation of expression
values using the robust multi-array average algorithm (13). The probe symbols were then
transformed into the corresponding gene symbols. When several
probes were mapped to one gene, the average value was calculated
and represented as the expression levels of this gene. Finally, the
gene expression matrix was obtained.
Upregulated and downregulated DEGs were screened in
Steroid_ANFH against Placebo_no_ANFH using the linear models for
microarray data (limma) package version 2.14.1 (14) in Bioconductor. In addition,
P-values from unpaired t-tests (15) in the limma package were calculated
to determine the significance of differences between samples. In
the present study, genes with log2fold change (FC) ≥0.4
and P<0.05 were selected as DEGs. Furthermore, the DEGs
identified between Steroid_ANFH and Placebo_no_ANFH were clustered
using gplots package (version 2.12.1; https://cran.r-project.org/web/packages/gplots/index.html)
(16) in R to evaluate whether the
identified DEGs were sample-specific. The clustering results were
visualized as heat maps.
Functional and pathway enrichment
analysis
The database for annotation, visualization and
integrated discovery (DAVID) is a web-accessible program that
provides functional interpretation of large gene lists through
facilitating the transition from data collection to biological
meaning (17). In the present
study, in order to analyze the identified upregulated genes and
downregulated genes in Steroid_ANFH on the functional level, GO
(18) and Kyoto Encyclopedia of
Genes and Genomes (KEGG) (19)
pathway enrichment analyses were performed using DAVID (17). The hypergeometric test (20) was applied to calculate P-values. In
particular, gene count ≥2 and P<0.05 were selected as the
threshold for identifying significant GO terms and KEGG
pathways.
Visualization of GO enrichment
analysis
To gain a full view of the probable functions of the
upregulated and downregulated genes, an enrichment map was
constructed with the Enrichment Map plugin (21) in Cytoscape version 2.8 (22) (http://www.baderlab.org/Software/EnrichmentMap), using
the GO enrichment results as the input. The parameters were set as
follows: Similarity cutoff, overlap coefficient; cutoff, 0.5;
P-value cutoff, 0.005; false discovery rate Q value cutoff, 0.1. In
the Enrichment Map, each node represented a gene set corresponding
to an enriched GO term. Node size corresponded to the total number
of genes in each GO term. Each weighted line indicated the overlap
between two gene sets and the line thickness indicated the number
of overlapping genes between nodes.
Generation of association network
through text-mining
The Agilent Literature Search plugin (23) was used in conjunction with
Cytoscape (22) for text-mining
literature with structured queries and for obtaining
gene-association networks according to the text-mining results
(24). In the present study, in
order to further ensure that the upregulated and downregulated
genes were biologically associated with ANFH, the Agilent
Literature Search tool (23) was
used to query published literature associated with the context, and
meanwhile construct an association network according to the
text-mining results. ‘Femoral necrosis’ was provided as context
terms while the genes from the identified DEG (upregulated and
downregulated genes) gene-set were used as search terms. In
addition, the species was limited to ‘rat’.
Computational searches for
transcription factors (TFs)
The standard integrated analysis package Genomatix
Software Suite version 2.1 (Genomatix GmbH, Munich, Germany;
http://www.genomatix.de) provides large amounts
of functional information about genes and their interactions,
including TFs (25). In the
present study, to gain insights into the transcriptional regulation
of the identified DEGs, a software tool within the Genomatix
software suite (http://www.genomatix.de/cgi-bin//GePS/gene-tf_analysis.pl?)
(25) was applied to search for
IFs that regulated the DEGs and to evaluate the number of TFs with
altered expression in the samples. This analysis was based on the
literature-derived gene-TF annotation. The input gene-set was the
identified upregulated and downregulated genes. The parameter of
evidence level was set as the sentence level.
Construction of PPI network
The online database resource Search Tool for the
Retrieval of Interacting Genes (STRING) is a comprehensive database
providing functional links of proteins, including experimental as
well as predicted interaction information by text mining or
comparative genomics (26).
Interactions of proteins in the STRING database were provided with
a confidence score (26). In the
present study, a PPI network was constructed using data derived
from the STRING database. Genes included in the PPI network were
all identified DEGs and a confidence score ≥0.4 was set as the
threshold. Proteins encoded by upregulated and downregulated genes
were represented by nodes in the network, and lines indicated
interactions among proteins. Hub proteins in the PPI network were
deemed as those that interacted with the most proteins and that had
a higher degree. Cytoscape software version 2.8 (22) was applied for network
visualization.
Results
DEG screening
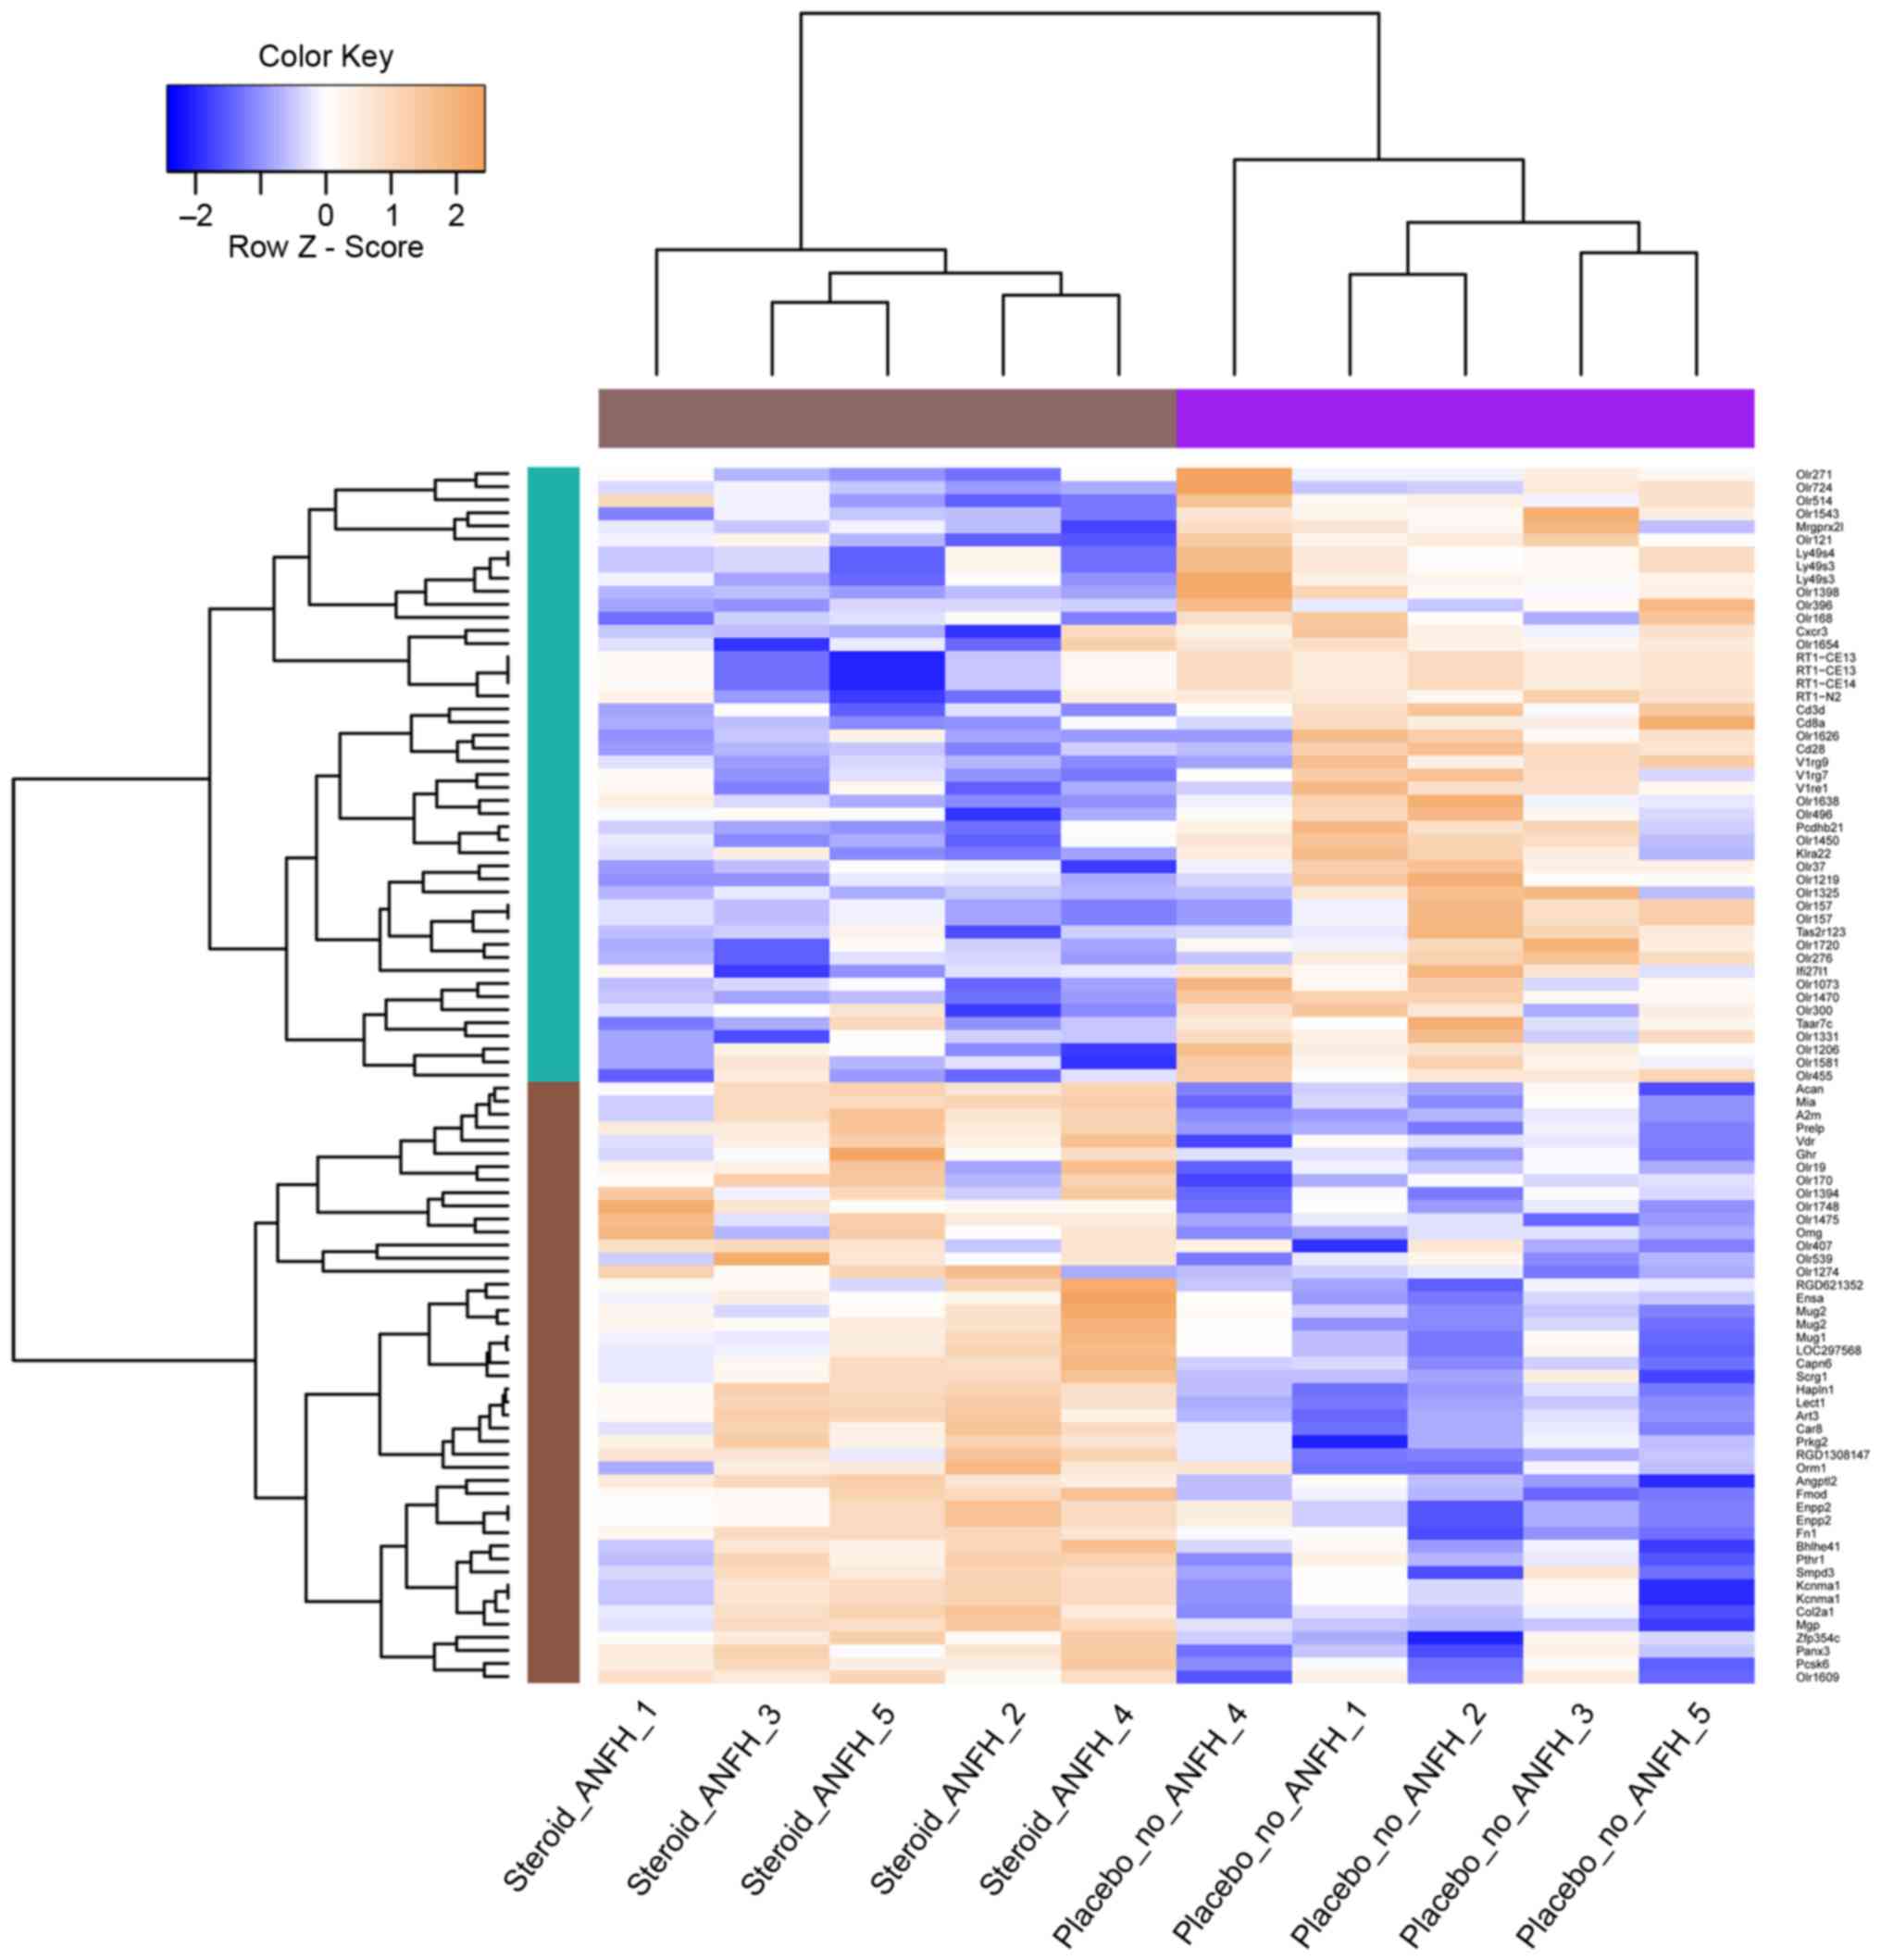
Compared with Placebo_no_ANFH controls, a total of
46 upregulated genes and 47 downregulated genes were identified in
Steroid_ANFH samples. The mean log2FC value of upregulated genes
was 0.5655 while the average log2FC value of downregulated genes
was −0.5832. Furthermore, the expression pattern of identified DEGs
correctly distinguished the Steroid_ANFH samples from
Placebo_no_ANFH control samples, as visualized in Fig. 1.
Biological interpretation of ANFH gene
expression signature
GO terms, including biological processes, cellular
component, and molecular function categories of the significantly
up and downregulated genes were summarized in Table I. The results demonstrated that the
upregulated genes were significantly concerned with bone
development processes, including cartilage development, skeletal
system development, bone development and chondrocyte
differentiation. The downregulated genes were enriched in different
GO terms, including cell surface receptor-linked signal
transduction and detection of chemical stimulus. The results of
KEGG pathway enrichment analysis were summarized in Table II. From the results, upregulated
genes were revealed to be involved in one pathway; olfactory
transduction. The downregulated genes were enriched in distinct
pathways, including antigen processing and presentation.
 | Table I.The enriched GO terms of upregulated
genes and downregulated genes. |
Table I.
The enriched GO terms of upregulated
genes and downregulated genes.
| Category | Term | Count | P-value |
|---|
| Upregulated |
|
|
|
| BP |
GO:0051216~cartilage development | 6 |
2.27×10−06 |
|
| GO:0001501~skeletal
system development | 8 |
1.06×10−05 |
|
|
GO:0006953~acute-phase response | 4 |
1.24×10−04 |
|
| GO:0060348~bone
development | 5 |
4.81×10−04 |
|
|
GO:0002062~chondrocyte
differentiation | 3 | 0.00175 |
|
|
GO:0030198~extracellular matrix
organization | 4 | 0.0022 |
|
| GO:0002526~acute
inflammatory response | 4 | 0.0024 |
|
|
GO:0006954~inflammatory response | 5 | 0.0038 |
| CC |
GO:0005576~extracellular region | 17 |
7.61×10−08 |
|
|
GO:0044421~extracellular region part | 13 |
2.06×10−07 |
|
|
GO:0031012~extracellular matrix | 8 |
5.73×10−06 |
|
|
GO:0005615~extracellular space | 9 |
5.55×10−05 |
|
|
GO:0005578~proteinaceous extracellular
matrix | 6 |
3.73×10−04 |
|
| GO:0005604~basement
membrane | 3 | 0.0181 |
|
|
GO:0044420~extracellular matrix part | 3 | 0.0315 |
| MF |
GO:0005539~glycosaminoglycan binding | 5 |
1.49×10−04 |
|
| GO:0001871~pattern
binding | 5 |
2.45×10−04 |
|
|
GO:0030247~polysaccharide binding | 5 |
2.45×10−04 |
|
|
GO:0030246~carbohydrate binding | 6 | 0.0019 |
|
|
GO:0005201~extracellular matrix structural
constituent | 3 | 0.0037 |
|
| GO:0008201~heparin
binding | 3 | 0.0158 |
| Downregulated |
|
|
|
| BP |
GO:0007186~G-protein coupled receptor
protein signaling pathway | 33 |
8.15×10⁻¹⁹ |
|
| GO:0007166~cell
surface receptor linked signal transduction | 35 |
2.64×10⁻¹⁸ |
|
| GO:0007606~sensory
perception of chemical stimulus | 26 |
1.89×10⁻¹⁵ |
|
| GO:0007600~sensory
perception | 27 |
3.35×10⁻¹⁵ |
|
|
GO:0050911~detection of chemical stimulus
involved in sensory perception of smell | 25 |
6.47×10⁻¹⁵ |
|
|
GO:0050907~detection of chemical stimulus
involved in sensory perception | 25 |
7.79×10⁻¹⁵ |
|
|
GO:0009593~detection of chemical
stimulus | 25 |
9.98×10⁻¹⁵ |
|
| GO:0007608~sensory
perception of smell | 25 |
1.13×10⁻¹⁴ |
| CC | GO:0016021~integral
to membrane | 39 |
8.59×10⁻¹⁶ |
|
|
GO:0031224~intrinsic to membrane | 39 |
2.67×10⁻¹⁵ |
|
| GO:0042612~MHC
class I protein complex | 3 | 0.010435218 |
|
| GO:0042611~MHC
protein complex | 3 | 0.015440507 |
| MF |
GO:0004984~olfactory receptor
activity | 26 |
9.54×10⁻¹⁷ |
|
|
GO:0016503~pheromone receptor
activity | 3 | 0.0349 |
| Table II.The enriched KEGG pathways of
upregulated and downregulated genes. |
Table II.
The enriched KEGG pathways of
upregulated and downregulated genes.
| Term | Count | P-value |
|---|
| Upregulated |
|
|
|
rno04740:Olfactory
transduction | 9 | 0.0073 |
| Downregulated |
|
rno04740:Olfactory
transduction | 19 |
2.09×10−08 |
|
rno05332:Graft-versus-host
disease | 4 | 0.0018 |
|
rno05330:Allograft
rejection | 4 | 0.0020 |
|
rno04940:Type I diabetes
mellitus | 4 | 0.0029 |
|
rno05320:Autoimmune thyroid
disease | 4 | 0.0030 |
|
rno04514:Cell adhesion
molecules (CAMs) | 5 | 0.0052 |
|
rno05416:Viral
myocarditis | 4 | 0.0081 |
|
rno04612:Antigen processing
and presentation | 4 | 0.0084 |
Overview of enrichment map
profiling
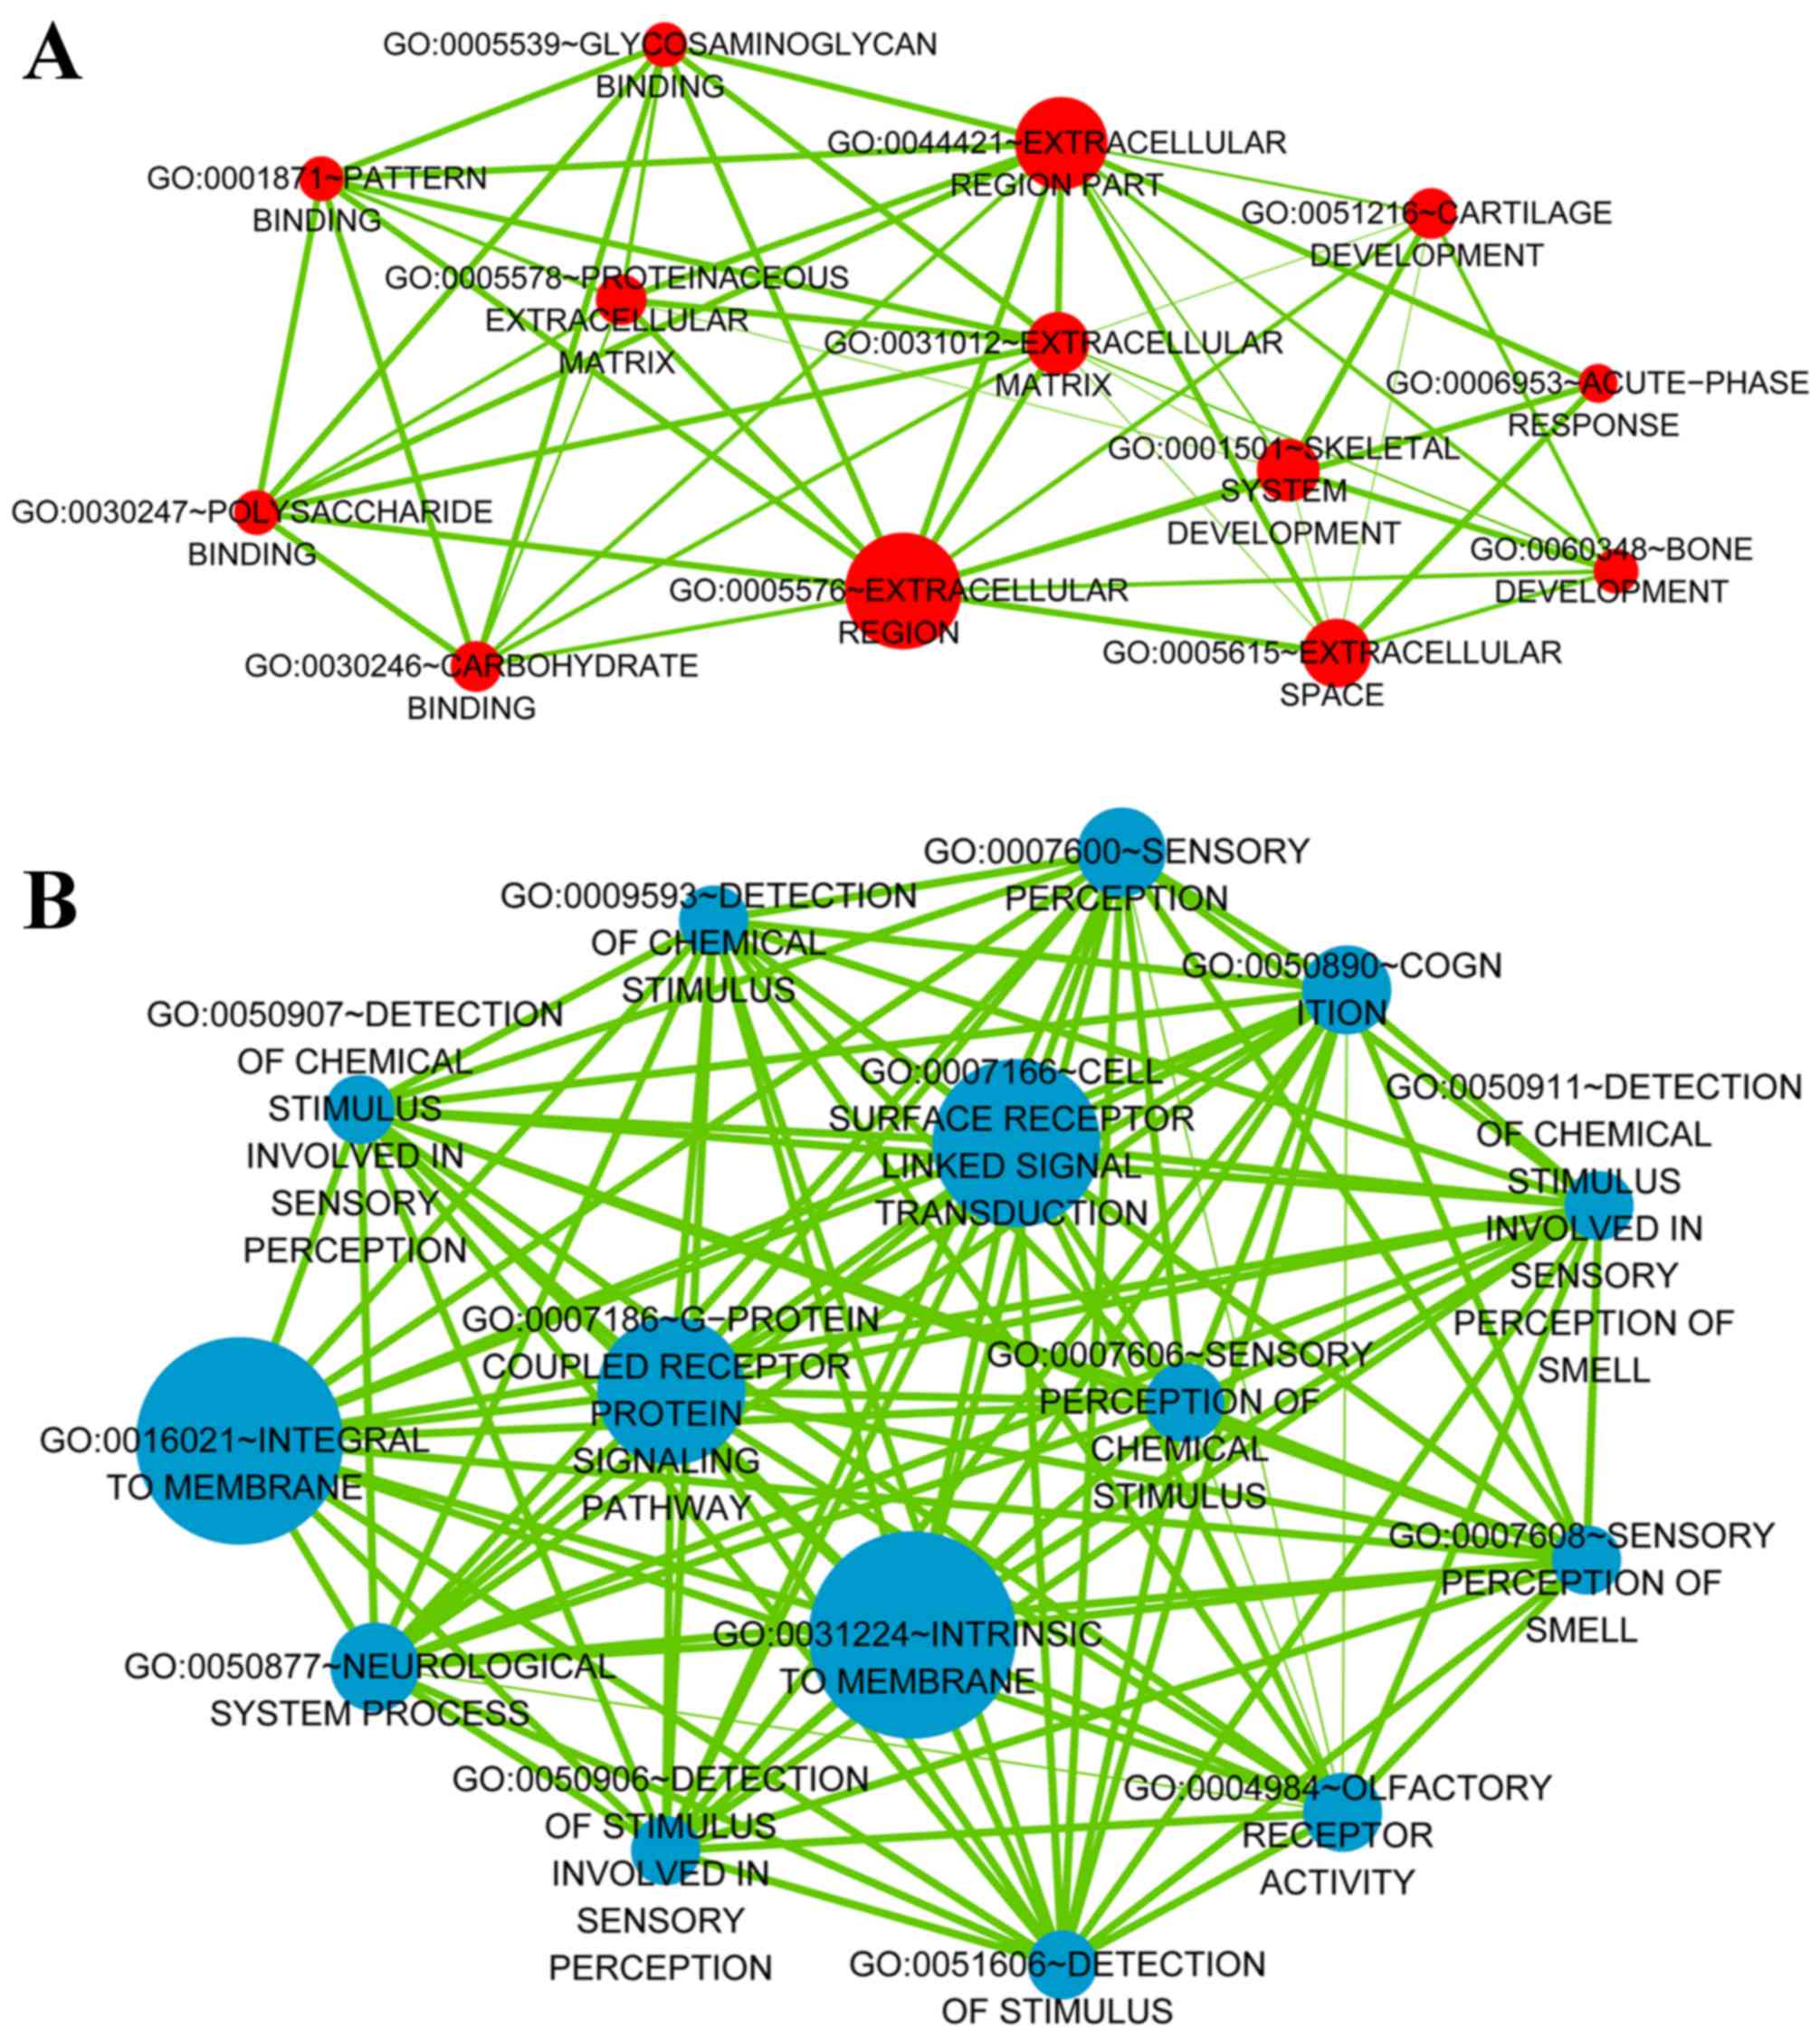
In the present study, the enrichment map was
generated to unravel overrepresented themes in ANFH through
enrichment analysis with regard to the enriched GO terms. The
enrichment maps of upregulated genes and downregulated genes were
visualized in Fig. 2A and B,
respectively. The enrichment network algorithmically clustered GO
terms with highly similar genes and the GO term of
GO:0001501~SKELETAL SYSTEM DEVELOPMENT was interconnected with
several other GO terms by gene overlap. The degree of this node
(GO:0001501) was 7. The enrichment map of downregulated genes
revealed that GO terms in this enrichment network were tightly
linked and the degree of each GO term in this network was 14.
Extracting significant associations
and the construction of the literature mined network of femoral
necrosis
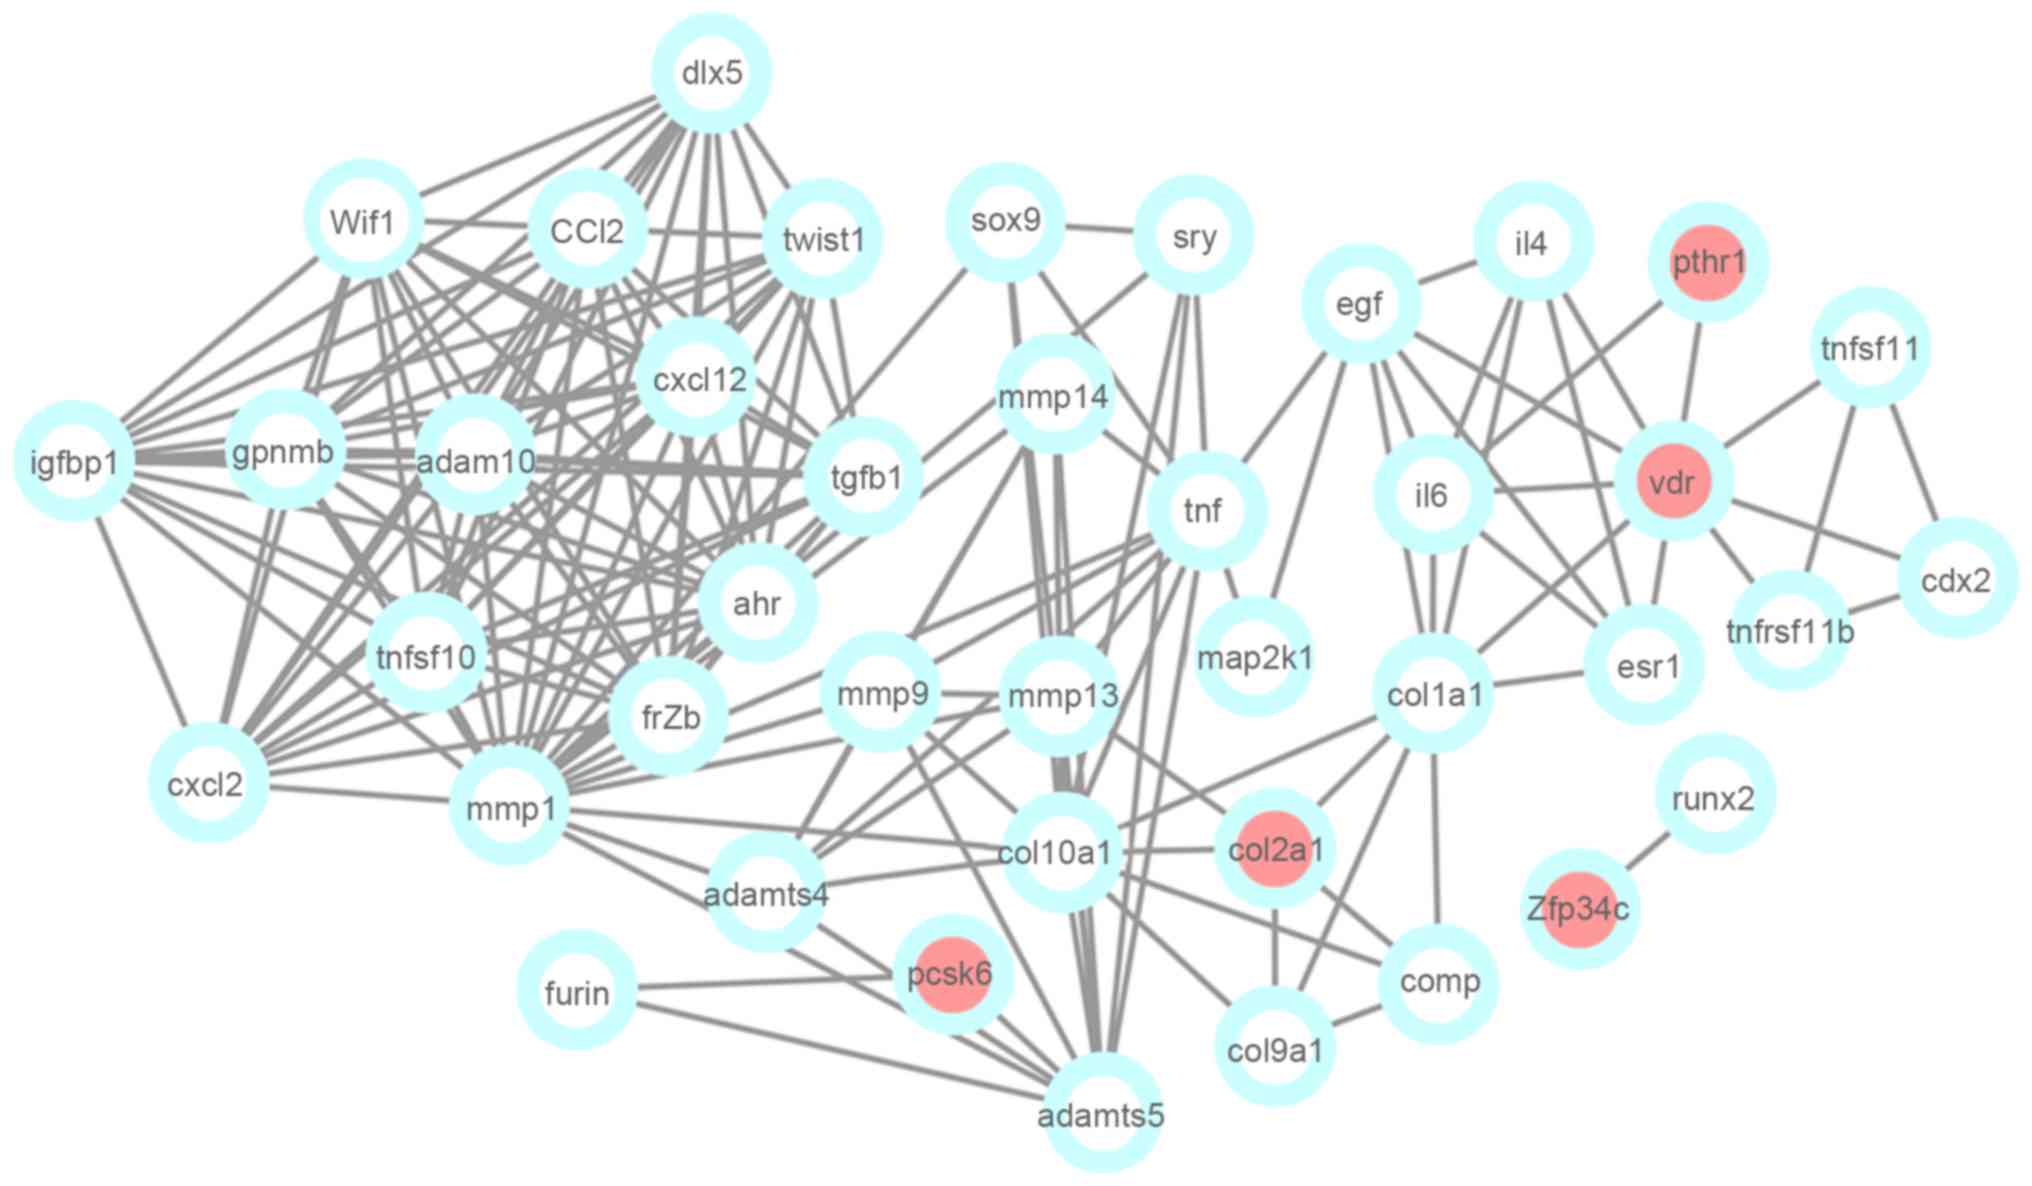
With the available data in regard to interactions of
different proteins, protein partners for the genes associated with
femoral necrosis were searched for using the Agilent Literature
Search tool, and a text-mining association network associated with
femoral necrosis was generated (Fig.
3). The literature mined network analysis revealed that a total
of 5 upregulated genes identified in the present study were
involved in the network, including parathyroid hormone receptor 1
(PTHR1), vitamin D (1,25-Dihydroxyvitamin D3) receptor
(VDR), collagen, type II, α1 (COL2A1), proprotein
convertase subtilisin/kexin type 6 (PCSK60), and zinc finger
protein 354C (ZFP354C). These 5 upregulated genes were
identified to be associated with femoral necrosis, and interacted
with other disease-related genes to generate the network.
The construction of transcriptional
regulation network and PPI network
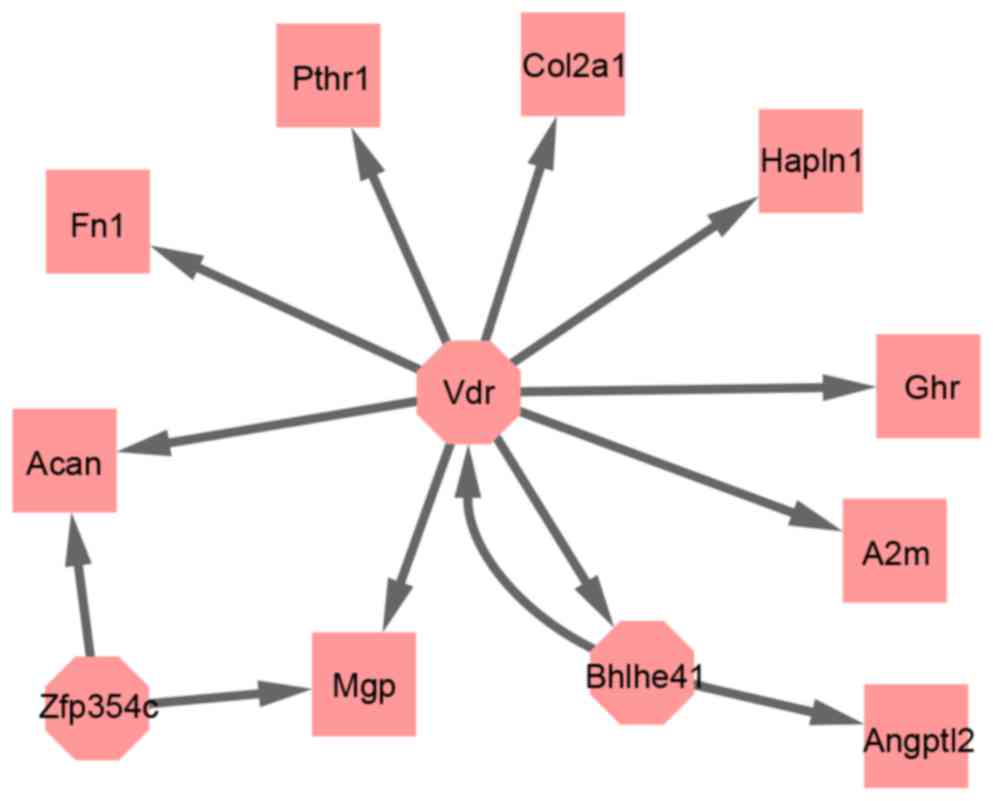
The transcriptional regulation network was
visualized in Fig. 4. The results
revealed that out of all the DEGs 3 TFs were identified, namely
ZFP354C, VDR, and basic helix-loop-helix family,
member E41 (BHLHE41). These 3 TFs were all upregulated and
their target genes were also upregulated (Fig. 4). In addition, ZFP354C and
VDR were also identified as associated with femoral
necrosis, as mentioned above.
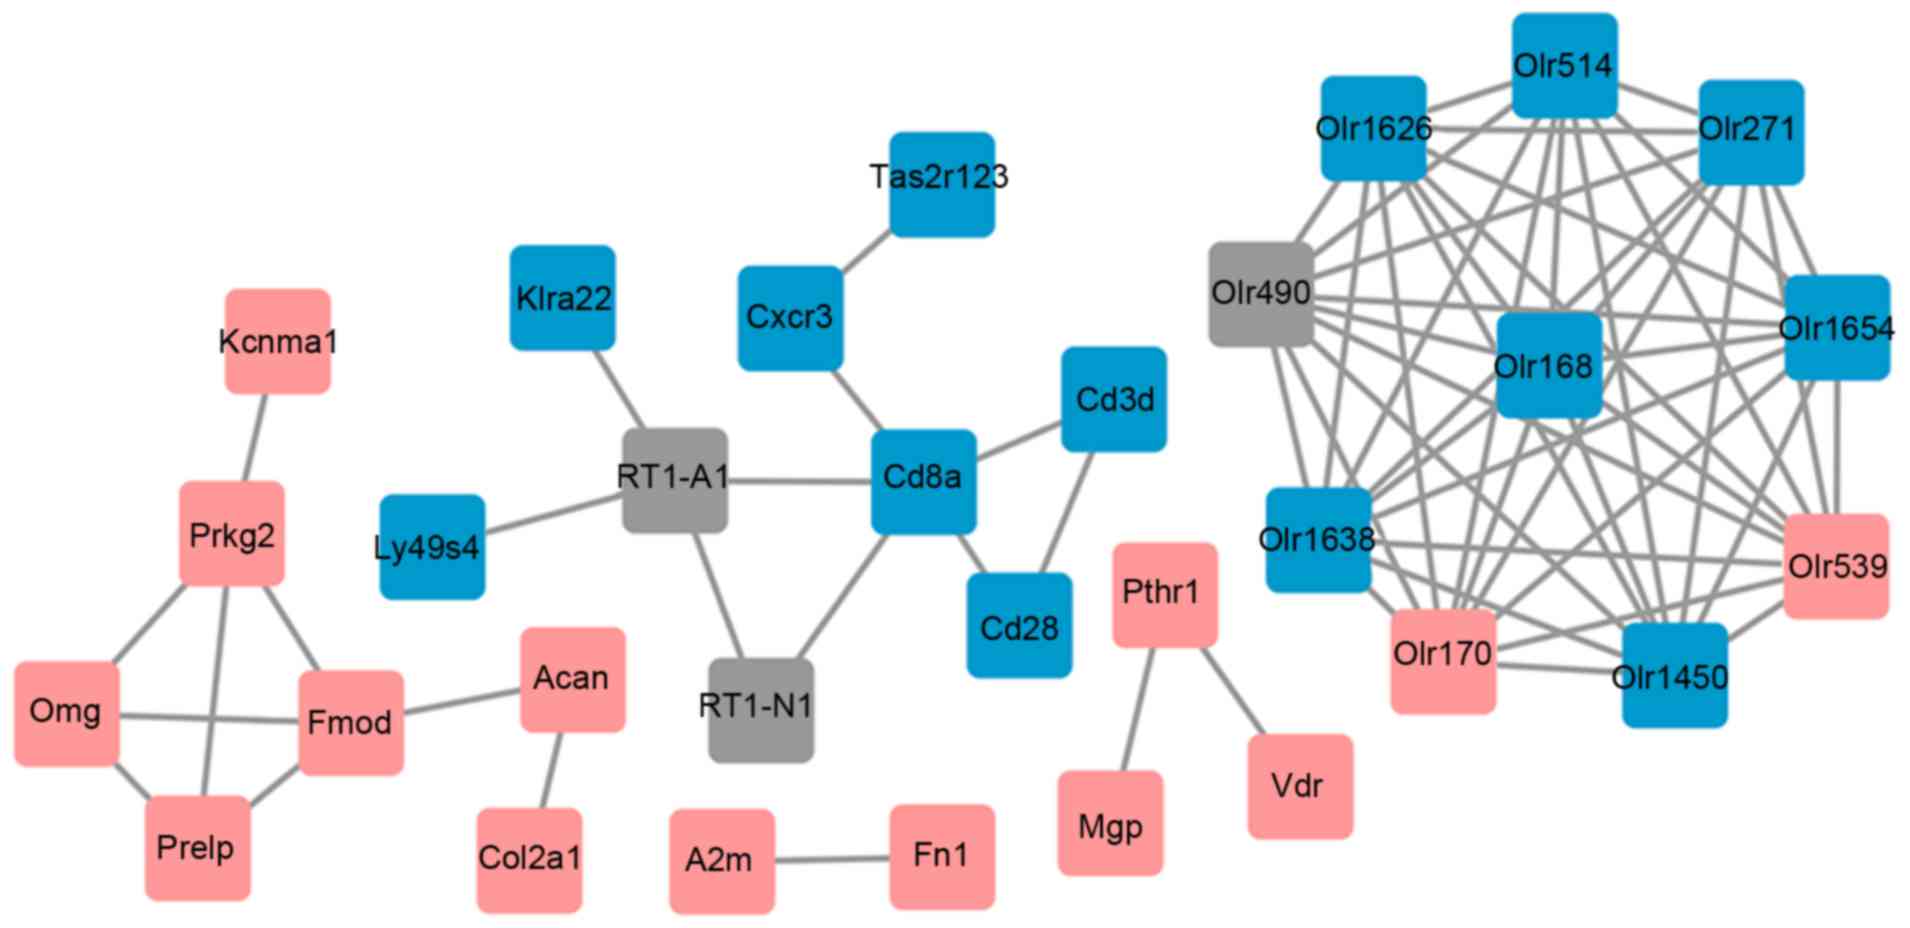
Furthermore, a PPI network was constructed (Fig. 5). The PPI network consisted of 31
nodes and 67 lines (interactions). The results revealed that the
interactive relationships of proteins were relatively simple.
However, olfactory receptor genes (including Olr168 and
Olr1654) were revealed to make up an interaction module.
Furthermore, the PPI network revealed that PTHR1 interacted
with VDR. A2M was also revealed to interact with
fibronectin 1 (FN1).
Discussion
There is a considerable negative effect of ANFH on
the workforce and, subsequently, on economics. Major efforts are
being made to understand GC-induced ANFH at a molecular level. In
the present study, a total of 93 DEGs (46 up and 47 downregulated
genes) were identified in GC-induced ANFH samples compared with
controls. These DEGs were enriched in different GO terms and
pathways, including chondrocyte differentiation and detection of
chemical stimuli. The enrichment map revealed that the GO term of
skeletal system development was interconnected with several other
GO terms by gene overlap. The literature mined network analysis
revealed that 5 upregulated genes were associated with femoral
necrosis, including PTHR1, VDR, COL2A1,
PCSK60, and ZFP354C. In addition, ZFP354C and
VDR were also identified as TFs. Furthermore, PTHR1
was identified to interact with VDR and A2M was
revealed to interact with FN1 in the PPI network.
The protein encoded by PTHR1 is a member of
the G-protein coupled receptor family 2, and this protein is a
receptor for parathyroid hormone (PTH) and for parathyroid
hormone-like hormone (PTHLH) (27). Previous studies have demonstrated
that injected PTH may be used to restore bone loss resulting from
excessive glucocorticoid use, and PTH-associated protein peptides
may be useful as putative bone regenerative therapies in GC-related
bone diseases (28,29). On the other hand, VDR
encodes the nuclear hormone receptor for vitamin D3, and VDR may
act as a TF that mediates the action of vitamin D3 through
controlling the expression of hormone sensitive genes (30). Previous evidence demonstrates that
VDR polymorphisms are putatively associated with the risk of
osteonecrosis and are significantly associated with the development
of osteonecrosis (31). In
addition, the work of Goltzman et al (32) revealed that the development of the
cartilaginous growth plate and parathyroid gland size were each
coordinately regulated by calcium and by the active form of vitamin
D, 1,25-dihydroxyvitamin D [1,25 (OH)2D], and that an intact
1,25(OH)2D/VDR system was required for an appropriate osteoclastic
response to increased PTH. Consistent with this notion, the present
study revealed that the upregulated gene PTHR1 may interact
with another upregulated gene, VDR, in the PPI network.
Collectively, this suggests that PTHR1 may be involved in
the pathogenesis of GC-induced ANFH via interacting with
VDR.
The protein encoded by A2M is a protease
inhibitor and cytokine transporter (33). A2M inhibits multiple proteases,
including trypsin, thrombin and collagenase (33). Kerachian et al (9) reported that A2M shared vascular,
cartilaginous and osteogenic functions and may be involved in the
development of early GC-induced ANFH (9). FN1 encodes fibronectin, a
glycoprotein present on the cell surface and in the extracellular
matrix, and this protein is involved in cell adhesion and migration
processes (34). Previous data has
revealed that fibronectin-aggrecan complex may be useful as a
marker for cartilage degradation in patients with non-arthritic hip
pain (35). ANFH is characterized
by pain in the hip, bone collapse and functional loss (6). In addition, a close connection was
identified between FN1 and A2M genes in the study of
Zhang et al (36).
Furthermore, A2M was revealed to interact with FH1 in the
PPI network in the present study. In this context, it is possible
to suggest that A2M has an interaction with FN1 and
is involved in the development of GC-induced ANFH. However, further
studies and experiments are required to confirm this finding.
However, the present study has several limitations.
First, the sample size is small, so further investigations based on
larger samples may be required. Second, this is a computational
study based on bioinformatics approaches, which gives simulated
results. The lack of cross-checking and further experimental
verification were also a limitation of the present investigation.
Statistical validation using other datasets may be used to
cross-check these results. Furthermore, experimental verifications
will be performed to determine the findings in future studies using
different approaches, including reverse transcription-quantitative
polymerase chain reaction and western blot analysis.
In conclusion, the present study demonstrated that
several potential key genes (PTHR1, VDR, A2M, and
FN1) were associated with the development of GC-induced
ANFH. PTHR1 may be involved in the pathogenesis of
GC-induced ANFH via interacting with VDR. A2M may also have
a significant function in the development of GC-induced ANFH
through interacting with FN1. Further investigations with
more samples as well as further experimental validation may provide
novel insights into the mechanism of GC-induced ANFH and will aid
the discovery of novel diagnostic and therapeutic approaches.
References
|
1
|
Chan KL and Mok CC: Glucocorticoid-induced
avascular bone necrosis: Diagnosis and management. Open Orthop J.
6:449–457. 2012. View Article : Google Scholar : PubMed/NCBI
|
|
2
|
Weinstein RS: Clinical practice.
Glucocorticoid-induced bone disease. N Engl J Med. 365:62–70. 2011.
View Article : Google Scholar : PubMed/NCBI
|
|
3
|
Colomb-Lippa D: Avascular necrosis of the
femoral head. JAAPA. 27:40–41. 2014.PubMed/NCBI
|
|
4
|
Weinstein RS: Glucocorticoid-induced
osteoporosis and osteonecrosis. Endocrinol Metab Clin North Am.
41:595–611. 2012. View Article : Google Scholar : PubMed/NCBI
|
|
5
|
Kerachian MA, Séguin C and Harvey EJ:
Glucocorticoids in osteonecrosis of the femoral head: A new
understanding of the mechanisms of action. J Steroid Biochem Mol
Biol. 114:121–128. 2009. View Article : Google Scholar : PubMed/NCBI
|
|
6
|
Bekler H, Uygur AM, Gökçe A and
Beyzadeoğlu T: The effect of steroid use on the pathogenesis of
avascular necrosis of the femoral head: An animal model. Acta
Orthop Traumatol Turc. 41:58–63. 2007.(In Turkish). PubMed/NCBI
|
|
7
|
Bian Y, Qian W, Li H, Zhao RC, Shan WX and
Weng X: Pathogenesis of glucocorticoid-induced avascular necrosis:
A microarray analysis of gene expression in vitro. Int J Mol Med.
36:678–684. 2015.PubMed/NCBI
|
|
8
|
Zalavras C, Shah S, Birnbaum MJ and
Frenkel B: Role of apoptosis in glucocorticoid-induced osteoporosis
and osteonecrosis. Crit Rev Eukaryot Gene Expr. 13:221–235. 2003.
View Article : Google Scholar : PubMed/NCBI
|
|
9
|
Kerachian MA, Cournoyer D, Harvey EJ, Chow
TY, Bégin LR, Nahal A and Séguin C: Research article New insights
into the pathogenesis of glucocorticoid-induced avascular necrosis:
microarray analysis of gene expression in a rat model. 2010.
|
|
10
|
Samara S, Dailiana Z, Chassanidis C,
Koromila T, Papatheodorou L, Malizos KN and Kollia P: Expression
profile of osteoprotegerin, RANK and RANKL genes in the femoral
head of patients with avascular necrosis. Exp Mol Pathol. 96:9–14.
2014. View Article : Google Scholar : PubMed/NCBI
|
|
11
|
Rustici G, Kolesnikov N, Brandizi M,
Burdett T, Dylag M, Emam I, Farne A, Hastings E, Ison J, Keays M,
et al: Arrayexpress update-trends in database growth and links to
data analysis tools. Nucleic Acids Res. 41(Database Issue):
D987–D990. 2013. View Article : Google Scholar : PubMed/NCBI
|
|
12
|
Carvalho BS and Irizarry RA: A framework
for oligonucleotide microarray preprocessing. Bioinformatics.
26:2363–2367. 2010. View Article : Google Scholar : PubMed/NCBI
|
|
13
|
Silver JD, Ritchie ME and Smyth GK:
Microarray background correction: Maximum likelihood estimation for
the normal-exponential convolution. Biostatistics. 10:352–363.
2009. View Article : Google Scholar : PubMed/NCBI
|
|
14
|
Smyth GK: Limma: linear models for
microarray dataBioinformatics and computational biology solutions
using R and Bioconductor. Springer; pp. 397–420. 2005, View Article : Google Scholar
|
|
15
|
Cindrova-Davies T, Yung HW, Johns J,
Spasic-Boskovic O, Korolchuk S, Jauniaux E, Burton GJ and
Charnock-Jones DS: Oxidative stress, gene expression, and protein
changes induced in the human placenta during labor. Am J Pathol.
171:1168–1179. 2007. View Article : Google Scholar : PubMed/NCBI
|
|
16
|
Zhang Y, Limaye PB, Renaud HJ and Klaassen
CD: Effect of various antibiotics on modulation of intestinal
microbiota and bile acid profile in mice. Toxicol Appl Pharmacol.
277:138–145. 2014. View Article : Google Scholar : PubMed/NCBI
|
|
17
|
Dennis G Jr, Sherman BT, Hosack DA, Yang
J, Gao W, Lane HC and Lempicki RA: DAVID: Database for annotation,
visualization and integrated discovery. Genome Biol. 4:P32003.
View Article : Google Scholar : PubMed/NCBI
|
|
18
|
Ashburner M, Ball CA, Blake JA, Botstein
D, Butler H, Cherry JM, Davis AP, Dolinski K, Dwight SS, Eppig JT,
et al: Gene ontology: Tool for the unification of biology. The gene
ontology consortium. Nat Genet. 25:25–29. 2000. View Article : Google Scholar : PubMed/NCBI
|
|
19
|
Kanehisa M, Sato Y, Kawashima M, Furumichi
M and Tanabe M: KEGG as a reference resource for gene and protein
annotation. Nucleic Acids Res. 44:D457–D462. 2016. View Article : Google Scholar : PubMed/NCBI
|
|
20
|
Mao X, Cai T, Olyarchuk JG and Wei L:
Automated genome annotation and pathway identification using the
KEGG Orthology (KO) as a controlled vocabulary. Bioinformatics.
21:3787–3793. 2005. View Article : Google Scholar : PubMed/NCBI
|
|
21
|
Merico D, Isserlin R, Stueker O, Emili A
and Bader GD: Enrichment map: A network-based method for gene-set
enrichment visualization and interpretation. PLoS One.
5:e139842010. View Article : Google Scholar : PubMed/NCBI
|
|
22
|
Smoot ME, Ono K, Ruscheinski J, Wang PL
and Ideker T: Cytoscape 2.8: New features for data integration and
network visualization. Bioinformatics. 27:431–432. 2011. View Article : Google Scholar : PubMed/NCBI
|
|
23
|
Cline MS, Smoot M, Cerami E, Kuchinsky A,
Landys N, Workman C, Christmas R, Avila-Campilo I, Creech M, Gross
B, et al: Integration of biological networks and gene expression
data using Cytoscape. Nat Protoc. 2:2366–2382. 2007. View Article : Google Scholar : PubMed/NCBI
|
|
24
|
Priyadarshini S and Aich P: Effects of
psychological stress on innate immunity and metabolism in humans: A
systematic analysis. PLoS One. 7:e43a2322012. View Article : Google Scholar
|
|
25
|
Werner T, Dombrowski SM, Zgheib C, Zouein
FA, Keen HL, Kurdi M and Booz GW: Elucidating functional context
within microarray data by integrated transcription factor-focused
gene-interaction and regulatory network analysis. Eur Cytokine
Netw. 24:75–90. 2013.PubMed/NCBI
|
|
26
|
Franceschini A, Szklarczyk D, Frankild S,
Kuhn M, Simonovic M, Roth A, Lin J, Minguez P, Bork P, von Mering C
and Jensen LJ: String v9. 1: Protein-protein interaction networks,
with increased coverage and integration. Nucleic Acids Res.
41(Database issue): D808–D815. 2013. View Article : Google Scholar : PubMed/NCBI
|
|
27
|
Tenne M, McGuigan F, Jansson L, Gerdhem P,
Obrant KJ, Luthman H and Akesson K: Genetic variation in the PTH
pathway and bone phenotypes in elderly women: Evaluation of PTH,
PTHLH, PTHR1 and PTHR2 genes. Bone. 42:719–727. 2008. View Article : Google Scholar : PubMed/NCBI
|
|
28
|
de Castro LF, Lozano D, Dapía S,
Portal-Núñez S, Caeiro JR, Gómez-Barrena E and Esbrit P: Role of
the N-and C-terminal fragments of parathyroid-hormone-related
protein as putative therapies to improve bone regeneration under
high glucocorticoid treatment. Tissue Eng Part A. 16:1157–1168.
2010. View Article : Google Scholar : PubMed/NCBI
|
|
29
|
Morley P, Whitfield JF and Willick GE:
Therapeutic prospects for parathyroid hormone and parathyroid
hormone analogs. Current Medicinal Chemistry-Immunology, Endocrine
& Metabolic Agents. 1:269–287. 2001. View Article : Google Scholar
|
|
30
|
Carlberg C and Campbell MJ: Vitamin D
receptor signaling mechanisms: Integrated actions of a well-defined
transcription factor. Steroids. 78:127–136. 2013. View Article : Google Scholar : PubMed/NCBI
|
|
31
|
Relling MV, Yang W, Das S, Cook EH, Rosner
GL, Neel M, Howard S, Ribeiro R, Sandlund JT, Pui CH and Kaste SC:
Pharmacogenetic risk factors for osteonecrosis of the hip among
children with leukemia. J Clin Oncol. 22:3930–3936. 2004.
View Article : Google Scholar : PubMed/NCBI
|
|
32
|
Goltzman D: Emerging roles for
calcium-regulating hormones beyond osteolysis. Trends in
Endocrinology & Metabolism. 21:512–518. 2010. View Article : Google Scholar
|
|
33
|
Rehman AA, Ahsan H and Khan FH:
α-2-Macroglobulin: A physiological guardian. J Cell Physiol.
228:1665–1675. 2013. View Article : Google Scholar : PubMed/NCBI
|
|
34
|
Martino MM, Tortelli F, Mochizuki M, Traub
S, Ben-David D, Kuhn GA, Müller R, Livne E, Eming SA and Hubbell
JA: Engineering the growth factor microenvironment with fibronectin
domains to promote wound and bone tissue healing. Sci Transl Med.
3:100ra892011. View Article : Google Scholar : PubMed/NCBI
|
|
35
|
Abrams GD, Safran MR, Shapiro LM, Maloney
WJ, Goodman SB, Huddleston JI, Bellino MJ and Scuderi GJ:
Fibronectin-aggrecan complex as a marker for cartilage degradation
in non-arthritic hips. Knee Surg Sports Traumatol Arthrosc.
22:768–773. 2014. View Article : Google Scholar : PubMed/NCBI
|
|
36
|
Zhang P, Li Y, Zhang LD, Wang LH, Wang X,
He C and Lin ZF: Proteome changes in mesenteric lymph induced by
sepsis. Mol Med Rep. 10:2793–2804. 2014.PubMed/NCBI
|