Introduction
Brain dead donors are becoming a major source of
organ transplantation in China (1–3).
Although the number of kidney transplantations from brain dead
donors has markedly increased, the supply of donor kidneys still do
not meet requirements (4,5). In addition, the outcome of patients
receiving grafts from donation after brain death (DBD) in kidney
transplantation is often unoptimistic, which mainly involves
delayed graft function, primary non-function, acute rejection
following transplantation and high levels of urine creatinine (Cr)
following 5 years (6,7).
Furthermore, previous studies reported that the
injury to organs from brain dead donors may be related to
hemodynamic changes, the release of inflammatory cytokines,
apoptosis, consumption of coagulation factors, endocrine and
hormonal changes (8–10). The relevant pathophysiological
alterations impacted on the quality of brain-dead organ donors and
may be the key issues constraining the wide use of organs from
brain dead donors (11–14). However, the specific details remain
unclear. An accurate method is required urgently in order to
evaluate the quality of donor kidneys.
In recent years, mass spectrometry (MS)-based
proteomics, which was first introduced for the aim of global
characterization of a proteome, including protein expression,
structure, modifications, functions and interactions has developed
rapidly and its quantitative accuracy has improved dramatically
(15). A previous study of the
authors has demonstrated the difference in protein expression in
livers affected by brain death compared with normal livers and one
of the typical downregulated biomarkers in brain death livers the
Runt-related transcription factor 1 (RUNX1) (16). Using this previous study, the
authors used high-resolution MS-based proteomics to identify
differentially expressed proteins and study preliminarily the
mechanism of kidney injury induced by brain death.
Materials and methods
Animals
A total of 30 12-week-old male rabbits (weight,
3,000–3500 g; Wuhan Wan Qian Jia He Experimental Animal Breeding
Center, Wuhan, China) were randomly divided into two groups:
Control (n=15) and the DBD groups (n=15). Each group was further
divided into four subgroups, according to the 2, 6 and 8 h time
points after brain death (n=5 each). The rabbits were housed in a
12 h light/dark cycle and temperature-controlled environment and
had free access to food and water in the Experimental Animal Center
of Wuhan University (Wuhan, China). All animal experiments were
conducted under institutional guidelines and approved by the
Ethical Committee for Animal Care and Use of Wuhan University
(Wuhan, China) according to animal protocol.
Establishment of the model of rabbit
brain death
Similar to the establishment of a pig brain death
model (17), a novel model
involving progressive intracranial pressure was established. All
rabbits were anesthetized with an injection of 1% pentobarbital
sodium (40 mg/kg; Shandong Xinhua Pharmaceutical Co., Ltd., Zibo,
China). The rabbits were placed in a supine position and
cannulation of the femoral artery and vein was performed, as was
xiphoid separation and tracheal intubation, thus allowing for burr
hole and catheter placement. In addition, the animals were
maintained during the procedure with the assistance of a biological
functional system, a rodent ventilator and an intelligent
temperature control instrument (Chengdu Thai Union technology Co.
Ltd., Chengdu, China). This allows for several parameters to be
quantified, including respiration and heart activity, using a
ventilator and electrocardiogram, respectively. The intracranial
pressure was gradually increased until brain death occurred.
Renal function measuring
Blood samples were collected from each rabbit at the
points of 2, 6 and 8 h following brain death to determine blood
urea nitrogen and creatinine levels, quantified by the Beckman Kurt
AU680 automatic biochemical analyzer (Beckman Coulter Co., Ltd.
Shanghai, China).
Histomorphometrical evaluation
The pathological samples were fixed in
paraformaldehyde, embedded in paraffin, sectioned (4 mm thickness),
and stained for 5 min with hematoxylin and eosin for examination. A
pathologist, who was blind to the experimental groups, analyzed the
sections.
Protein extraction and 2-DE proteomics
profiling
Protein concentration of the supernatant was
measured with the Quanti Pro™ BCA assay kit
(Sigma-Aldrich; Merck KGaA, Darmstadt, Germany) using 2 mg/ml
bovine serum albumin (Beijing Bioco Laibo Technology Co. Ltd.,
Beijing, China). Samples were de-salted and concentrated with the
2-D Clean-Up kit (cat. no. 80-6484-51; GE Healthcare Life Sciences,
Pittsburgh, PA, USA) following manufacturer's instructions,
following by dissolving with sample buffer. A total of 150 µg
protein from the control groups and those in the 6 h experimental
group were mixed with rehydration buffer which was composed of 7
mol/l carbamide, 2 mol/l sulfocarbamide, 4%
3-3-Cholamidopropyldimethylammonio-propanesulfonate, 65 mmol/l
dithiothreitol, 0.2% BioLyte and 0.001% bromophenol blue. The
mixture was in turn isoelectrically focused at 500 V for 1 h, 1,000
for 1 h, 3,000 V for 1 h and 8,000 V for 9.5 h following
rehydration for 12 h at 30 V using Immobiline IPG DryStrips (GE
Healthcare Life Sciences) with an Ettan IPGphor Electrophoresis
system (GE Healthcare Bio-Sciences). IPG strips were applied for
12% SDS-PAGE using a PROTEAN® II xi Cell system (Bio-Rad
Laboratories, Inc., Hercules, California, USA) following
equilibration for 2×15 min subsequently in the equilibration buffer
including 1% dithiothreitol and 4% iodoacetamide. The temperature
was maintained at 20°C throughout by use of an external cooler.
Following staining with Coomassie Brilliant Blue G-250 solution
(Beyotime Institute of Biotechnology, Haimen, China), the gels were
run overnight using a constant current of 2 mA/gel. Each sample was
measured in triplicate.
Gel image acquisition and
analysis
The SDS-PAGE gels were scanned by the LabScan
software (GE Healthcare Life Sciences,) to get the electron images
of 2D gel. The 170–9620 PDQuest Basic 2-D Analysis software
(Bio-Rad Laboratories, Inc.) was applied to detect protein spots,
subduct background, normalize, match, establish an average gel and
compare differences, respectively. A total of 6 2-D electrophoresis
(E) maps in three replicates were analyzed by the software and
compared to identify differentially-expressed proteins. A protein
was considered to be expressed differentially if there was
>two-fold difference in the spectral count ratios between the
two samples.
Protein identification
Among these exclusive spots identified by 2-DE image
analysis, protein components of the 10 most prominent spots were
investigated using a 4700 proteomics analyzer (Applied Biosystems;
Thermo Fisher Scientific, Waltham, MA, USA). The protein spots
excised from 2-D gels were subjected to de-staining, washing and
in-gel digestion with protease trypsin at 37°C overnight, following
the description of Shevchenko et al (18). The digestion was stopped the next
morning by adding acetic acid to lower the pH to <6, and the
samples were centrifuged at 10,000 × g and 25°C for 20 sec to
remove insoluble material. Re-dissolving in 0.5% trifluoroacetic
acid, the peptide mixtures were detected by the Voyager-DE STR 4307
MALDI-TOF-MS tandem mass spectrometry (Applied Biosystems; Thermo
Fisher Scientific, Inc.). The proteins were identified using the
Mascot Distiller 2.0 software (Matrix Science Ltd., London, UK).
The mass spectra collected in the experiment were analyzed using
the Swiss-Prot protein database (19). Protein scores >56 were regarded
as significant. The one with the highest score was taken into
account, if one spot was matched >1 protein member.
Re-identification of typical proteins
by western blot analysis
To further identify the differentially expressed
proteins, three typical differential proteins named prohibitin
(PHB), superoxide dismutase (SOD2) and cytochrome b-c1
complex subunit 1 (UQCRC1) in two groups was detected by western
blot analysis. Briefly, per sample, three 20 µm cryostat sections
were lysed in 200 µl radioimmunoprecipitation assay buffer
containing protease inhibitors (Boston Bioproducts, Ashland, MA,
USA). Samples were lysed on ice, centrifuged for 10 min at 10,000 ×
g (4°C) and supernatants were collected. Protein concentrations of
the lysates were measured using a QuantiPro™ BCA assay
kit. Proteins were loaded onto polyacrylamide gel and separated
using 10% SDS-PAGE using the PROTEAN® II xi Cell system
(Bio-Rad Laboratories, Inc.). Gels were then transferred onto a
polyvinylidene difluoride membrane (0.2 µm; EMD Millipore,
Billerica, MA, USA). Following blocking for nonspecific antibody
binding with 5% nonfat milk overnight and probing with primary
rabbit polyclonal antibody against PHB (cat. no. ab75766; 1:1,000),
SOD2 (cat. no. ab1398; 1:1,000) and UQCRC1 (cat. no. ab84901;
1:1,000 (all obtained from Abcam, Cambridge, MA, USA) for 1 h at
37°C. Then, the proteins were detected on the blot using
horseradish peroxidase (HRP)-conjugated goat anti-rabbit IgG
H&L (cat. no. ab6702; 1:10,000; Abcam) at 37°C for 30 min
visualized at 800 nm fluorescence channels. β-actin was used as an
internal control. The blot was developed and quantified by Odyssey
Infrared Imaging System version 3.0 (LI-COR Biosciences, Lincoln,
NE, USA) following the manufacturer's instructions.
Re-identification of typical protein
by immunohistochemistry
PHB levels were further examined using
immunohistochemistry. The kidney tissues from control and
experimental groups of 2, 6 and 8 h following brain death were
fixed with 4% paraformaldehyde for 24 h, dehydrated and embedded in
paraffin. Paraffin blocks were sectioned into 5 µm-thick slices and
fixed with a chilled 1:1 mixture of methanol:acetone for 5 min
following pretreatment with 0.3% hydrogen peroxide for 20 min at
room temperature. For PHB-specific staining, the sections were
incubated by primary polyclonal rabbit antibody (cat. no. ab75766;
1:1,000; Abcam) for 1 h at 37°C. Subsequently, incubation with
HRP-conjugated goat anti-rabbit IgG H&L (1:10,000; Abcam,
Cambridge, MA, USA) at 37°C for 30 min was followed by reaction
with 3,3-diaminobenzidine substrate solution and counterstaining
with hematoxylin. A total of five random fields of view of each
stained section were pictured and analyzed using morphometric
software (MIAS-2000 medical image analysis system; Beijing
University of Aeronautics and Astronautics, Beijing, China) by an
investigator blind to the study group.
Statistical analysis
Statistical analyses of the data were performed
using SPSS software (version, 18.0; SPSS Inc., Chicago, IL, USA).
All the data are expressed as mean ± standard deviation. The
differences between more than two groups, BUN and Cr values were
compared and the relative absorbance of PHB, SOD and UQCRC1 were
assessed with a one-way analysis of variance and the post hoc tests
used was Student-Newman-Keuls. P<0.05 was considered to indicate
a statistically significant difference.
Results
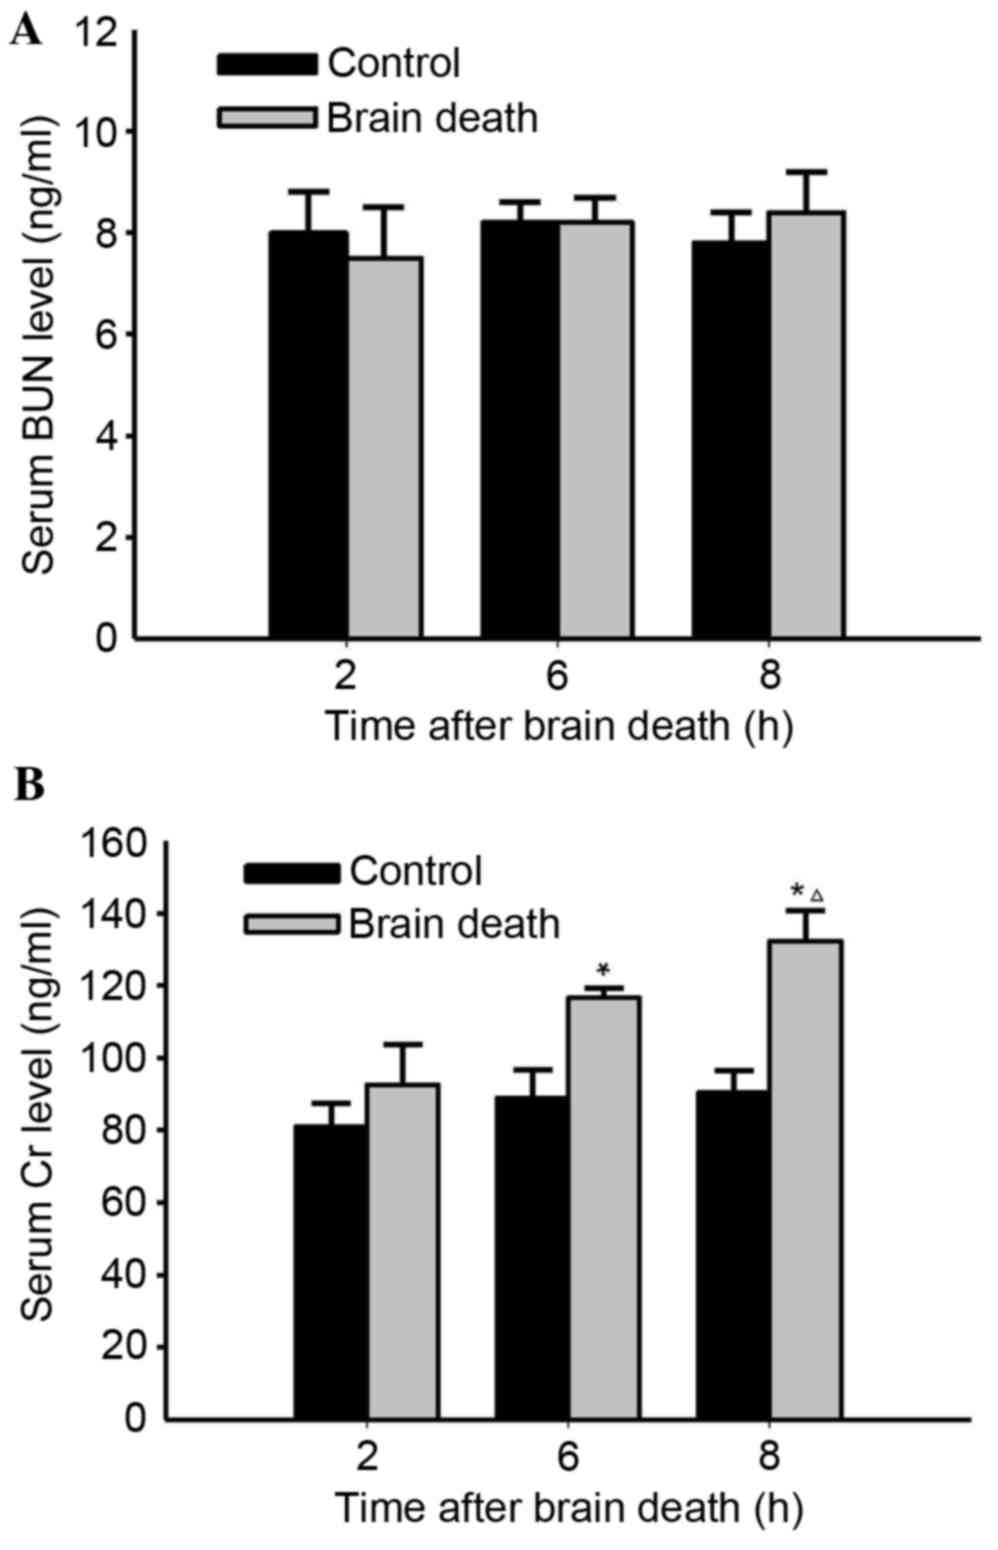
The alteration of renal function
The results indicated that there were no obvious
differences in serum BUN levels in the DBD group compared with
those in both the previous time point group and the control group
during the period following brain death induction to 8 h after this
point (P>0.05; Fig. 1A).
However, obvious serum Cr level alterations were observed 6 and 8 h
following brain death, when compared with those in the control
group (P<0.05; Fig. 1B).
Particularly, compared with the control group, serum Cr level in
the 8 h improved significantly (P<0.05; Fig. 1B).
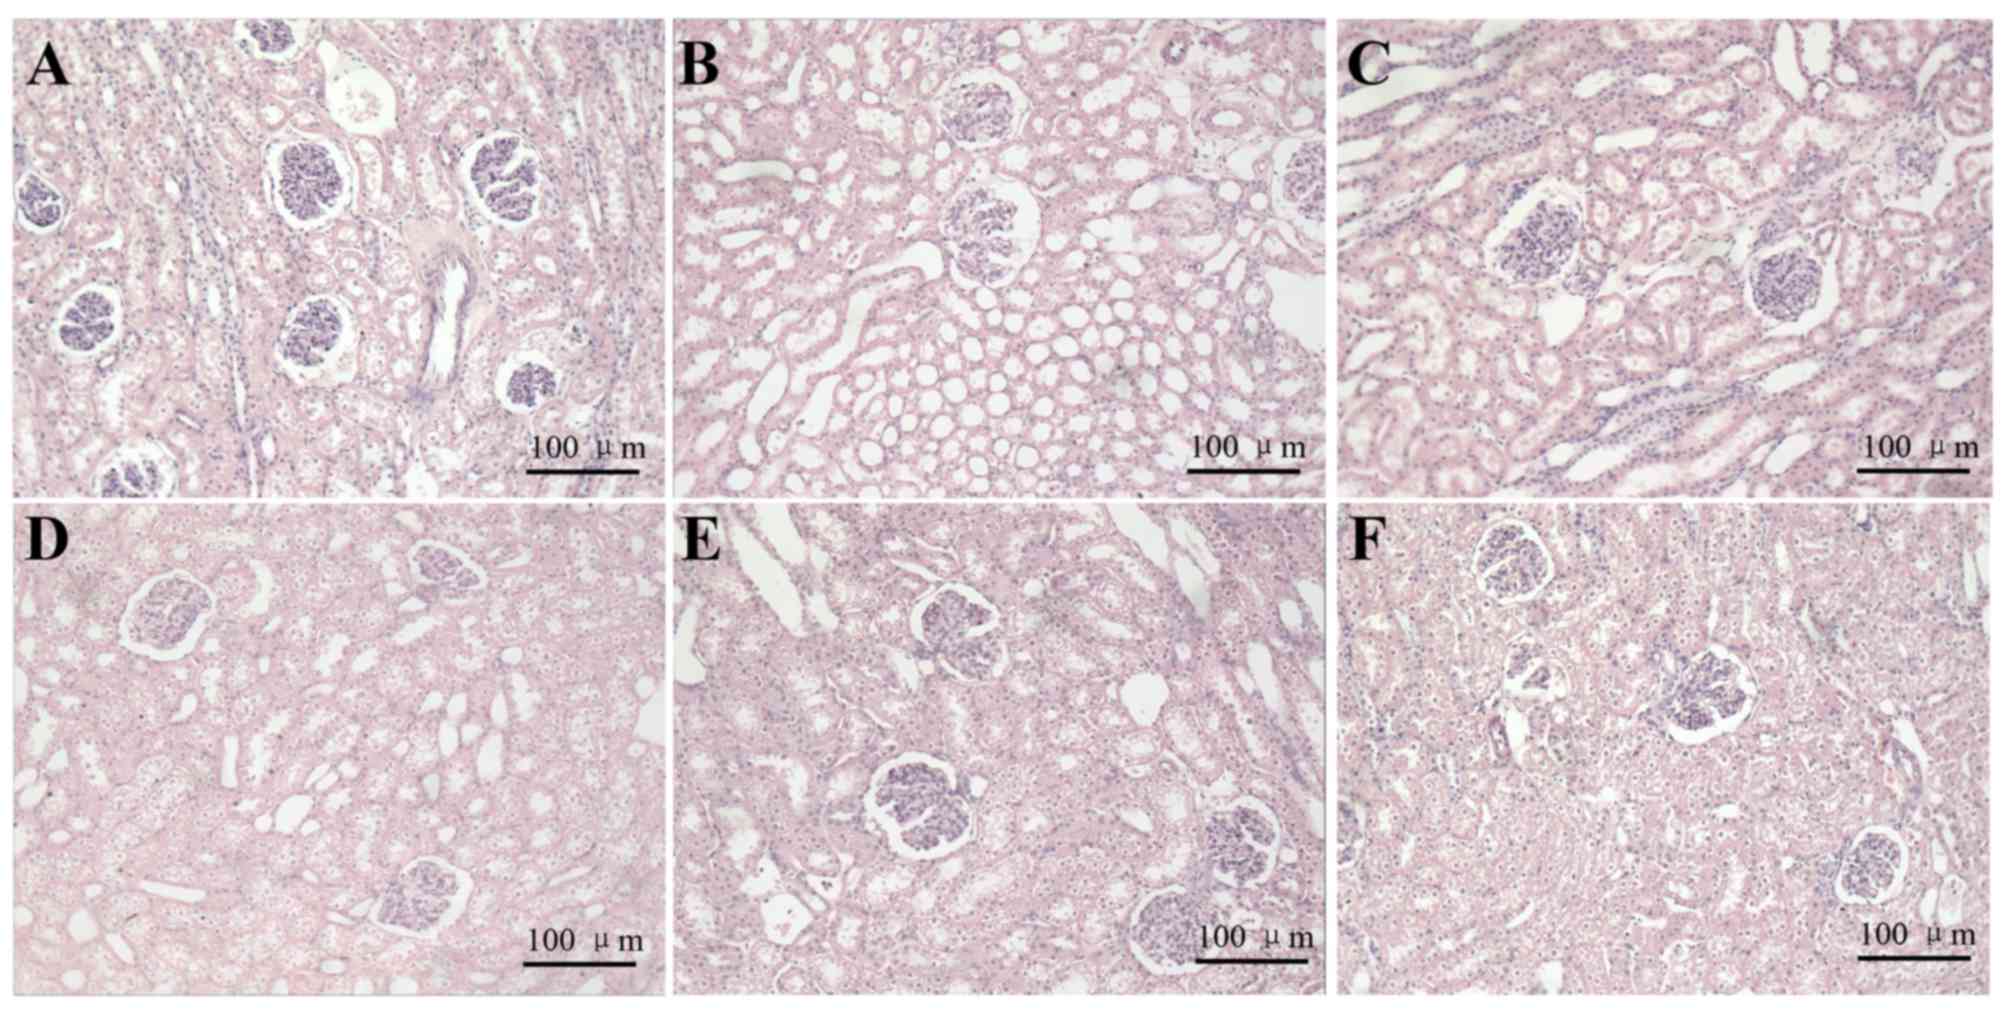
The morphological alteration of
kidney
Using the light microscope, kidney cells in the
control groups were arranged in neat rows and were stained evenly
at different time points. In addition, the structure of glomerular
and renal tubule was normal (Fig.
2). The structure of glomerulus in DBD groups at 2 h was
relatively normal, as reflected by its similarities to the 2 h
control group. In addition, the proximal convoluted tubule at 2 h
was similar. However, in the 6 h DBD group, the local vascular
dilation and congestion, as well as the degeneration and necrosis
in some tubules and the atrophy in some glomeruli, was also
observed. In the 8 h DBD group, some tubules had obvious
degeneration and even presented cellular edema. Furthermore,
vacuolar degeneration in kidney cells and proximal convoluted
tubule occlusion were observed (Fig.
2).
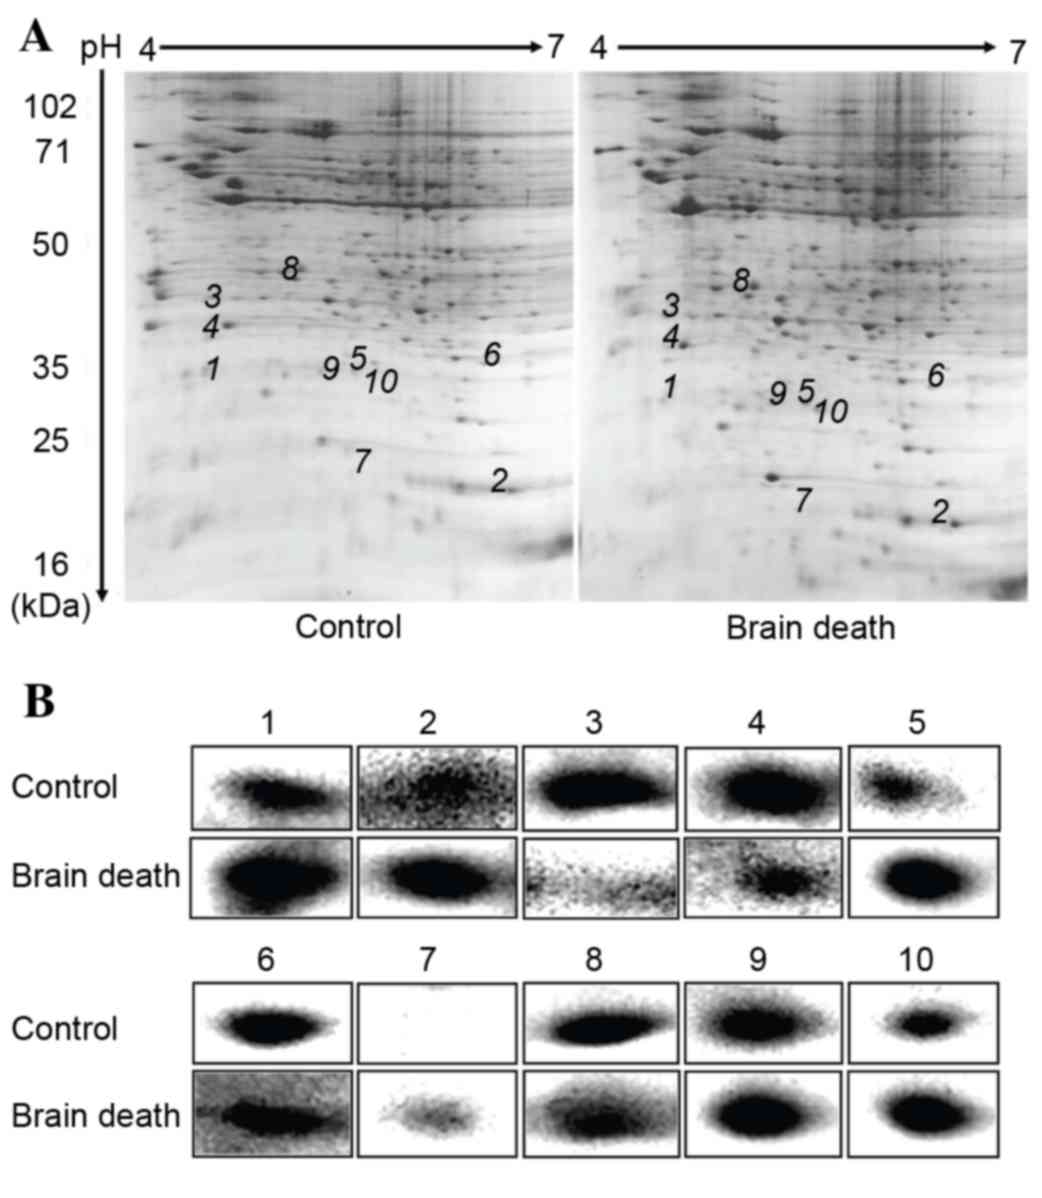
The 2-DE proteomic profiling of
different proteins
The total protein maps of the kidney tissue in the 6
h control group and 6 h DBD group were observed and analyzed by
2-DE. Stained with Coomassie Brilliant Blue, high resolution 2-DE
maps were observed in triplicate. The PDQuest Basic 2-D Analysis
software was applied to detect protein spots, subduct background,
normalize, match and establish an average gel, respectively.
Selecting the weakest, smallest and strongest points, the software
synthesized a new gel using the protein point data and matched each
other to acquire the map of differentially-expressed proteins.
Finally, these differentially-expressed proteins (with a >2-fold
difference) were identified. The results demonstrated that 904±19
protein spots in control groups could be detected and 916±25
protein spots in the DBD group could be detected. There were ~45
protein spots that were differentially expressed identified by
Voyager-DE STR 4307 MALDI-TOF-MS tandem mass spectrometry analysis.
Compared with control groups, 24 proteins were upregulated and 21
proteins were downregulated in DBD experimental groups. The 2-DE
map is on presented in Fig. 3A.
Partial enlargement of the differentially expressed proteins is
presented in Fig. 3B.
Mass spectrum identification and the
function classification of different proteins
Excised from the gel, 13 enzymolysis proteins were
analyzed by MS to obtain peptide mass fingerprinting and peptide
sequence tags, respectively. Using Mascot to query the SWISS-PROT
database, the authors identified ten differential expressed
proteins. A total of six were upregulated, whereas the other four
proteins were downregulated in hepatocellular carcinoma. According
to their functions, the proteins were classified as the following
groups: Proteins associated with proliferation and differentiation,
proteins associated with signal transduction, proteins associated
with their modification, proteins associated with the electron
transport chain and proteins associated with oxidation reduction.
Subcellular localization of these proteins was analyzed using
detailed information given by the Swiss-Prot database. These
proteins were localized in cytoplasm, mitochondria and nucleus. The
detailed information of subcellular localization is listed in
Table I.
 | Table I.Proteins identified by mass
spectrometry. |
Table I.
Proteins identified by mass
spectrometry.
|
|
|
|
|
|
|
|
|
|
| Intensity of protein
expression (IHC) |
|---|
|
|
|
|
|
|
|
|
|
|
|
|
|---|
| Protein no. | Protein
namea | Gene name | Accession
nob | pIc | Sequence coverage
(%) | Mascot score | MWC
(Da) | Subcellular
localization | Biological
function |
Controld | Brain
deathe |
P-valuef |
|---|
| 1 | Prohibitin, | PHB | P67779 | 5.57 | 65 | 194 | 29859 | Mitochondria | Proliferation |
89274 | 136620 | <0.05 |
|
| isoform |
|
|
|
|
|
| Cell membrane |
Differentiation |
|
|
|
|
| CRA_b |
|
|
|
|
|
| Cytoplasm |
| 2 | PRP38 pre-mRNA | PRPF38A | D3ZGL5 | 6.63 | 36 | 74 | 10044 | Cytoplasm | Protein |
34122 | 116846 | <0.05 |
|
| processing
factor |
|
|
|
|
|
|
| modification |
|
|
|
|
| 38 (yeast)
domain |
|
| containing A |
| 3 | Beta-1,3-N- | B3GALNT1 | Q6AY39 | 7.18 | 33 | 75 | 39531 | Cytoplasm | Protein |
88192 |
21820 | <0.05 |
|
| acetylgalactos |
|
|
|
|
|
| Cell membrane | modification |
|
| aminyltransferase
1 |
| 4 | Annexin A5 | ANXA5 | P14668 | 4.93 | 32 | 64 | 35807 | Cytoplasm | Coagulation | 116252 |
72511 | <0.05 |
|
|
|
|
|
|
|
|
|
| function |
| 5 | Calcineurin | CANB1 | P63100 | 4.64 | 39 | 57 | 19402 | Cytoplasm | Signal |
70458 | 137404 | <0.05 |
|
| subunit B type
1 |
|
|
|
|
|
|
| transduction |
| 6 | Superoxide | SOD2 | P09671 | 8.96 | 25 | 56 | 24887 | Cytoplasm | Oxidation | 69771 |
28887 | <0.05 |
|
| dismutase
[Mn], |
|
|
|
|
|
|
| reduction |
|
| mitochondrial |
| 7 | V-type proton | ATP6V1G1 | O75348 | 6.75 | 28 | 69 | 13816 | Cytoplasm | Ion |
7811 |
12435 | <0.05 |
|
| ATPase |
|
|
|
|
|
|
| transportation |
|
| subunit G 1 |
| 8 | Cytochrome b-c1
complex subunit 1, mitochondrial precursor | UQCRC1 | P86201 | 5.57 | 32 | 112 | 53500 | Mitochondria | Electron transport
chain |
90833 |
40277 | <0.05 |
| 9 | NADH [ubiquinone] 1
beta subcomplex subunit 10 | NDUFB10 | Q9DCS9 | 7.57 | 31 | 75 | 21131 | Mitochondria | Electron transport
chain |
93262 | 142973 | <0.05 |
| 10 | Peroxiredoxin-3,
mitochondrial | PRDX3 | Q9Z0V6 | 7.67 | 61 | 71 | 28017 | Mitochondria
microsomes | Oxidation
reduction |
70842 | 106290 | <0.05 |
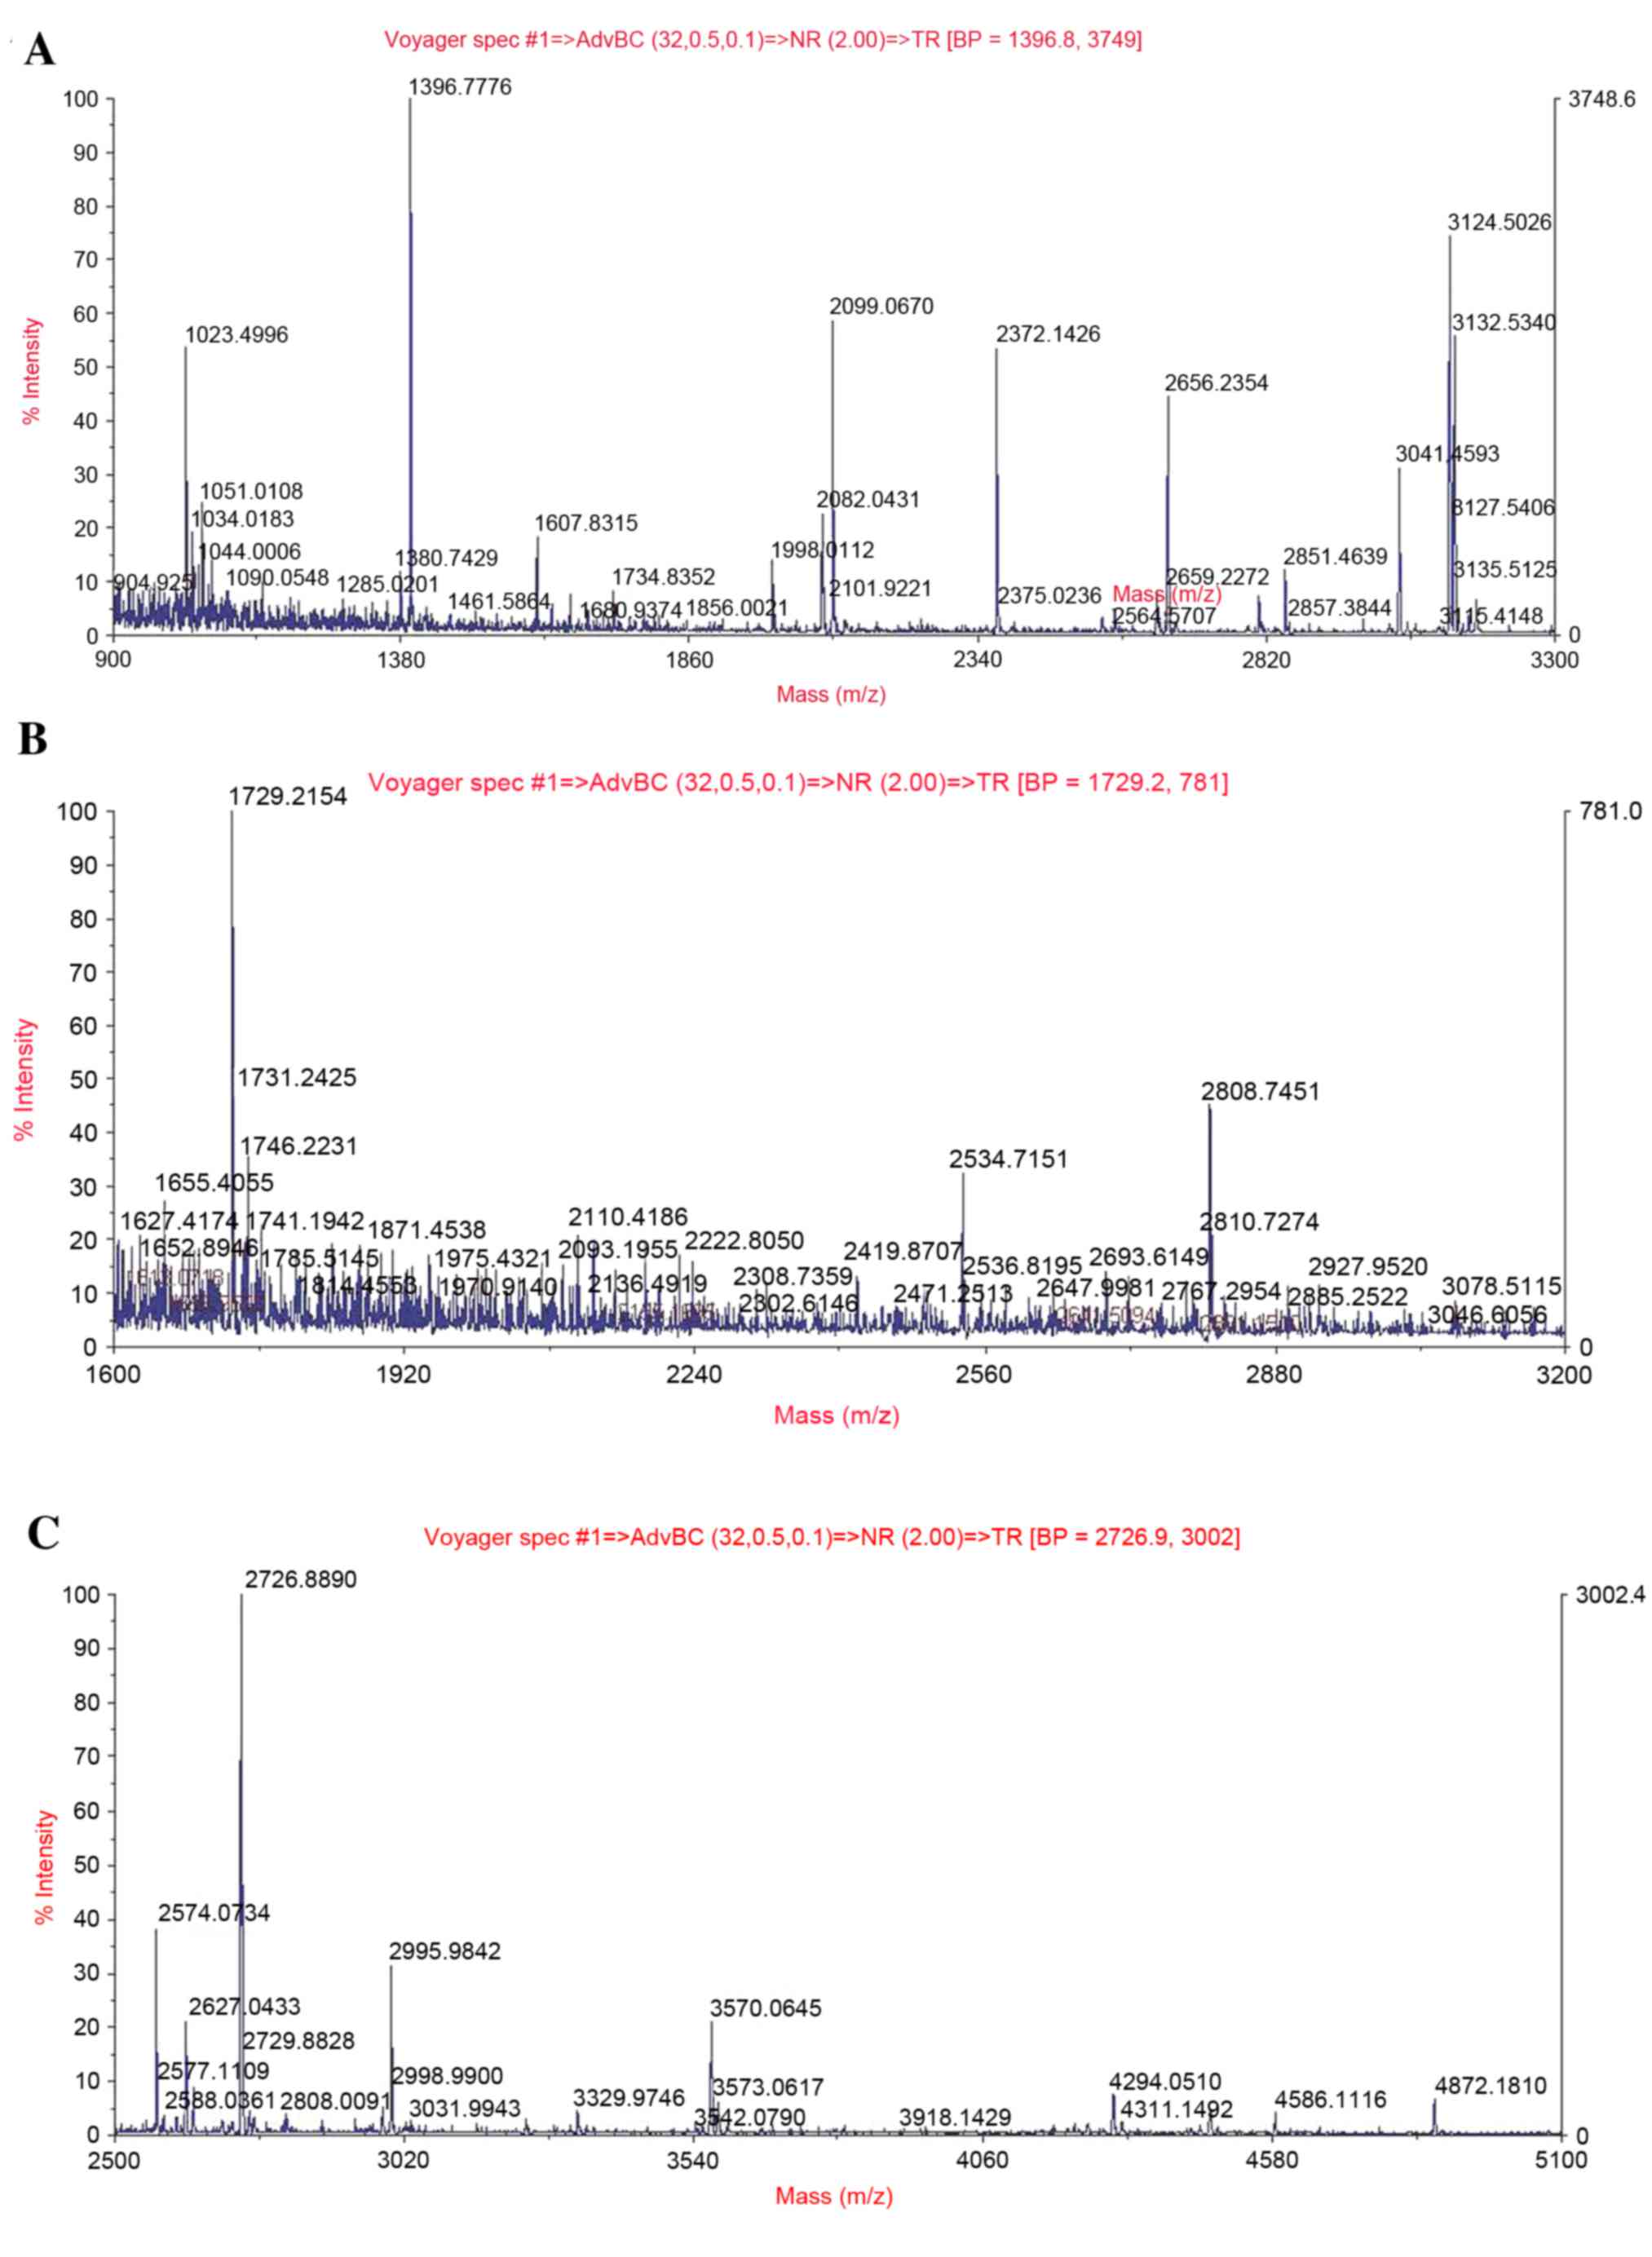
Identification and re-identification
of typical proteins
A representative peptide mass fingerprinting map of
PHB, SOD2 and UQCRC1 protein spots 1, 6 and 8 is demonstrated in
Fig. 4A-C. MS/MS analysis
demonstrated that the Mascot score and the sequence coverage of
PHB, SOD2 and UQCRC1 were 194 + 65, 56 + 25 and 112 + 32%,
respectively. As presented in the western blotting, PHB proteins
band in the control groups expressed at a low level. The expression
of PHB proteins in kidney tissue from DBD groups increased over
time and was highest at 8 h following brain death. In contrast, the
expression of SOD2 and UQCRC1 proteins in DBD groups were
significantly lower those in the respective control groups (SOD2,
P<0.05 at 2 and 6 h; UQCRC1, P<0.05 at 2, 6 and 8 h).
(Fig. 5).
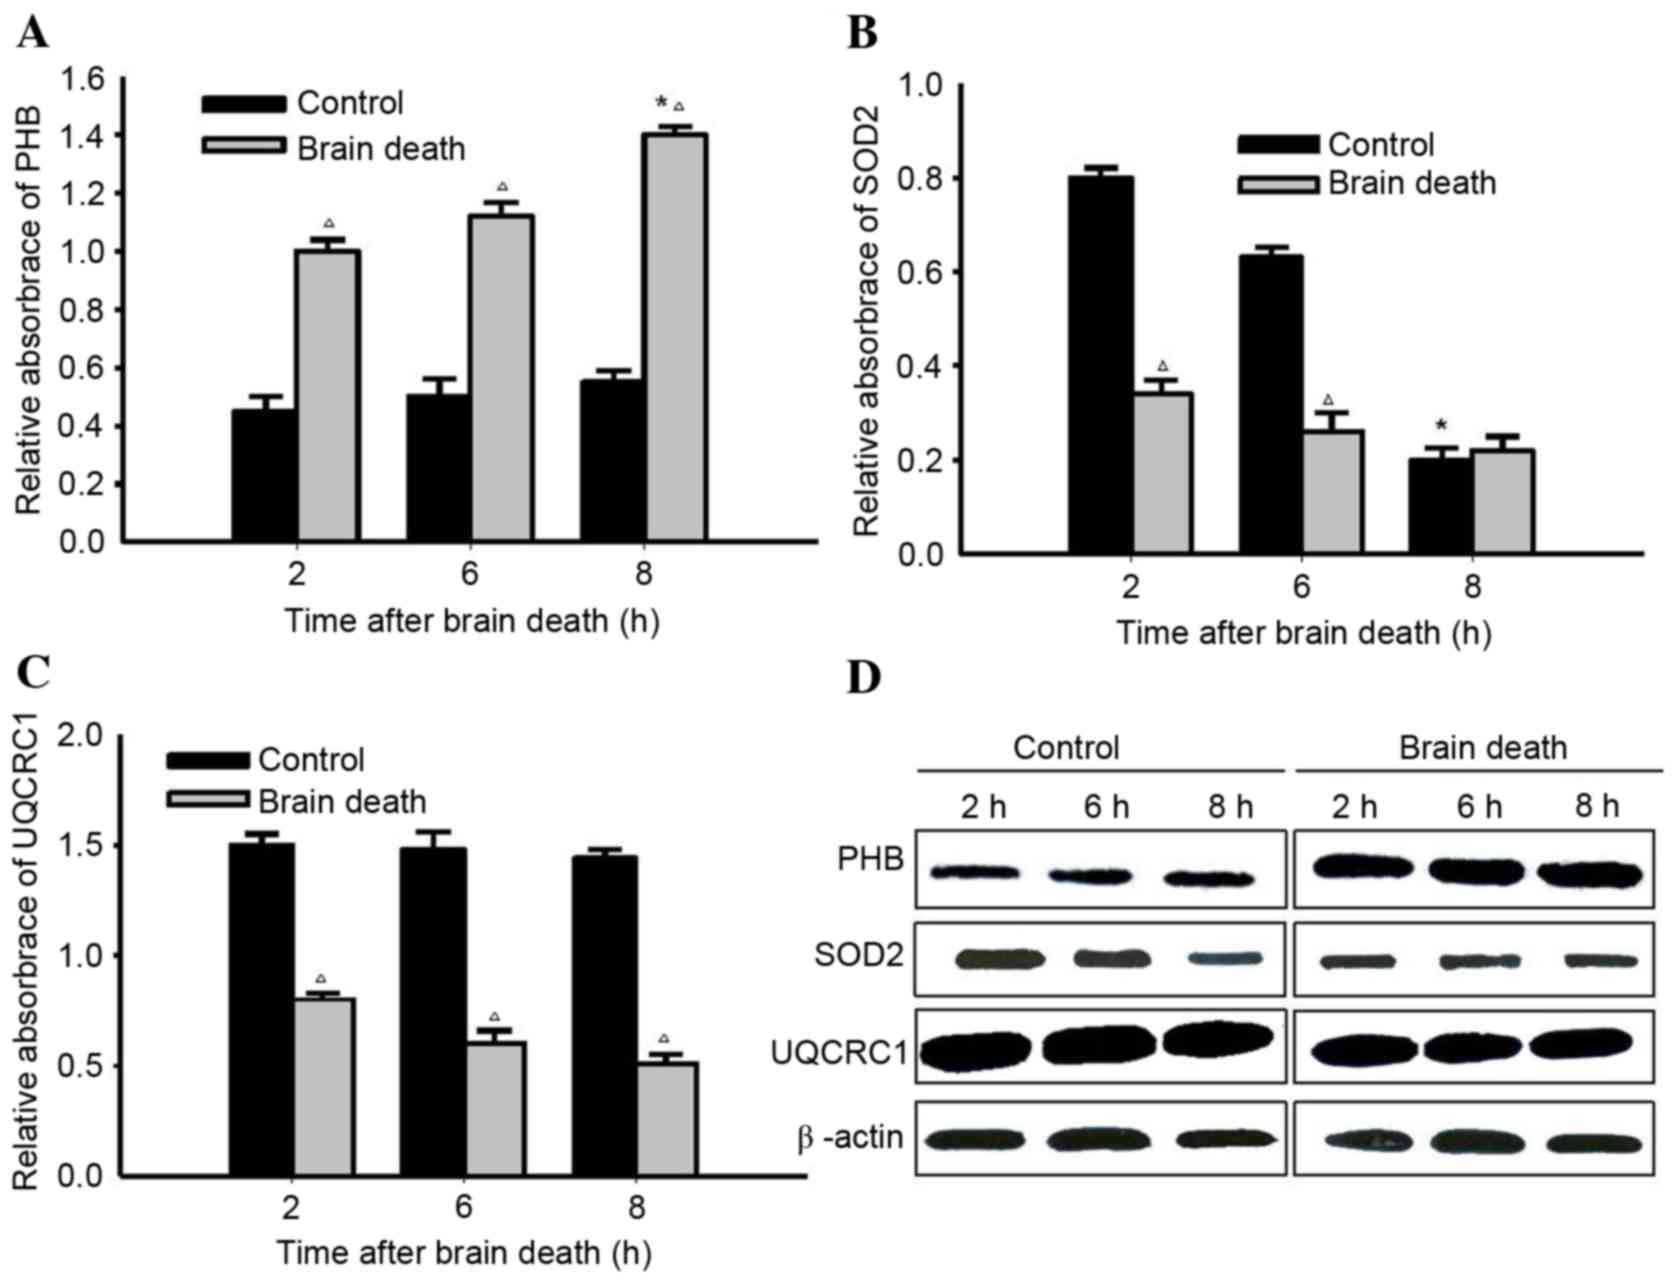 | Figure 5.Re-identification of 3 typical
proteins using western blot analysis. (A) Representative results of
PHB in paired DBD and control samples presenting expression levels
at various time points. PHB expression in DBD groups increased
significantly at 8 h, compared with the control groups at 8 h. At
each time point, statistical differences were identified between
DBD and control groups. (B) Representative results of SOD2 in
paired DBD and control samples demonstrating its expression levels
at various time points. The expression in the control group
decreased significantly with respect to the DBD group at 8 h. At 2
and 6 h, statistical differences were identified between DBD and
control groups. (C) Representative results of UQCRC1 in paired DBD
and control samples displaying differential expression at various
time points. At each time point, statistical differences were
identified between the DBD group and control group. (D)
Representative results of western blot analysis of PHB, SOD2 and
UQCRC1 in paired DBD groups and control samples with β-actin
serving as an internal control. *P<0.05 vs. previous time point
groups; ∆P<0.05 vs. Control groups. PHB, prohibitin;
DBD, donation after brain death; SOD2, superoxide dismutase;
UQCRC1, cytochrome b-c1 complex subunit 1, mitochondrial
precursor. |
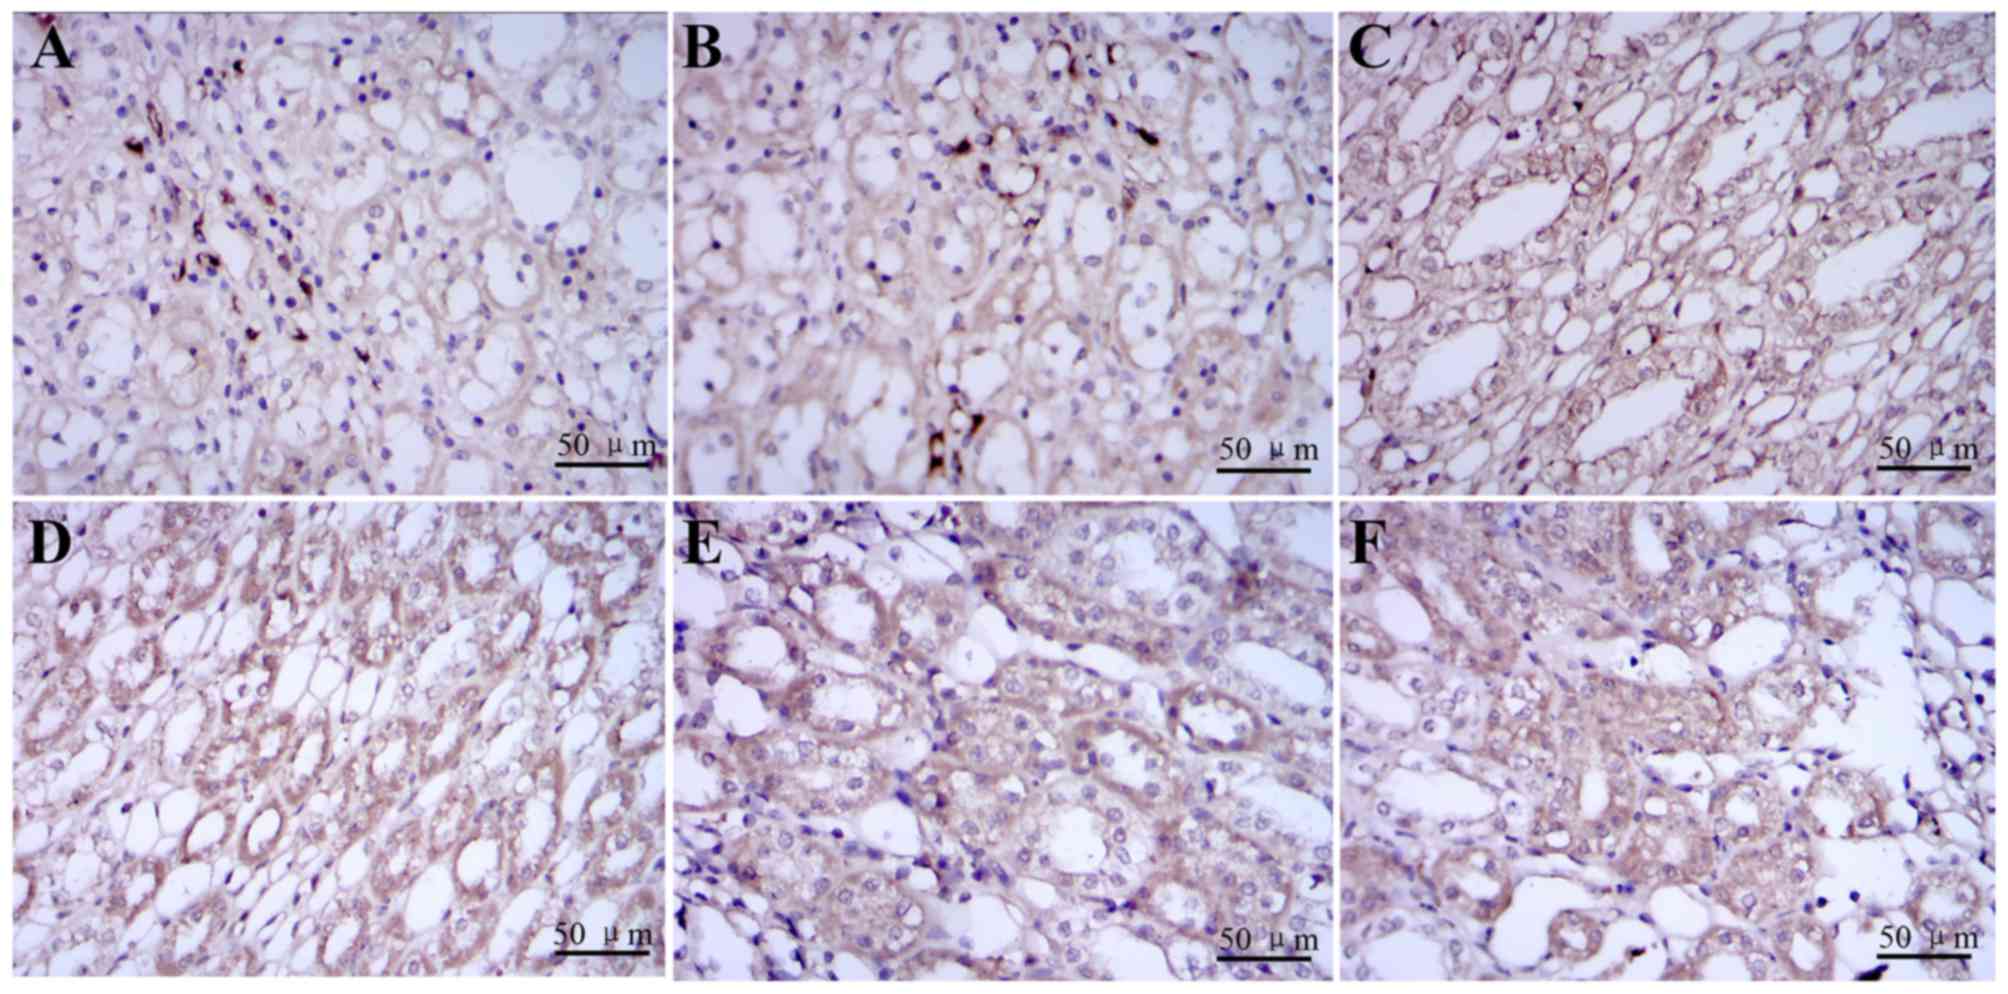
Re-identification of PHB protein using
immunohistochemistry
The prohibitin was detected as the yellow brown
granular in cytoplasm of renal tubular epithelial cells. The
expression of PHB proteins was detected at 2, 6 and 8 h in DBD
groups and control groups using immunohistochemistry (Fig. 6).
Discussion
Brain death refers to the irreversible cessation of
all functions of the entire brain including the brainstem, as well
as a potential future direction in studies involving organ use
(20). Many studies have argued
that the poor outcomes organs following brain death were mainly
associated with hemodynamic alterations (21,22),
the release of inflammatory cytokines (23–25),
consumption of coagulation factors (26,27)
and endocrine and hormonal changes (28–30).
However, the molecular mechanism underlying how the status of brain
death organs influences the transplantation outcomes remains
unclear. Mikhova et al (31) established a porcine model to
demonstrate that hemoadsorption of cytokines attenuates brain
death-induced ventricular dysfunction. Similar to the method of
Pratschke et al (17), in
the present study, a novel technique involving progressive
intracranial pressure brain death model was used, with the help of
a biological functional system, a rodent ventilator and an
intelligent temperature control instrument. To ensure that the
model induced brain death in a similar fashion to genuine cases,
continuous breathing and an electroencephalogram were monitored in
real time.
Proteins perform various life functions and have a
vital role in cells (32);
therefore, identifying differentially expressed proteins in rabbit
kidney induced by brain death should provide persuasive evidence
that can reveal the molecular mechanism underlying how organs
status following brain death influences transplantation outcomes.
One of the authors' previous studies using rabbits focused on
examining the alterations to liver protein expression (16). A relatively small number of studies
have been published on rabbits' kidney injury induced by brain
death, including hemodynamic changes, release of inflammatory
cytokines, apoptosis, consumption of coagulation factors, endocrine
and hormonal changes (1–3). To the best of our knowledge, no prior
studies have used proteomics to investigate differentially
expressed proteins in rabbit kidney induced by brain death. The
results of the current study demonstrated that protein spot 2-DE
distribution patterns of DBD groups are greatly different from
control groups. A total of 45 spots in the 2-DE gels presented a
statistically significant difference in expression. From these
spots, a total of 10 altered proteins were identified primarily
using MS analysis. One of the downregulated proteins was identified
as PHB protein, using the Swiss-Prot database. The peptide pieces
(m/z 1396.8) from this protein scored 194 points and the sequences
coverage was 65%. Because PHB protein is associated with cell
proliferation and differentiation, it raised a high level of
concern. PHB protein has been identified as a molecular factor that
can mediate anti-apoptotic signals, and is essential for
mitochondrial function. It is a member of a highly conserved family
of proteins that are thought to serve major roles in cell cycle
control, differentiation, senescence and apoptosis (33). Liu et al (34) has previously indicated that
downregulation of PHB can trigger oxidative stress and result in
organ or tissue damage. Using immunohistochemistry techniques in
the present study, PHB protein was screened and identified, as it
may be associated with injury induced by brain death. To ensure the
reliability of preliminary screening and the feasibility of
follow-up study, the expression of PHB proteins in kidney tissues
was validated. As demonstrated, the expression of PHB proteins in
kidney tissue from DBD groups increased over time, which indicated
that PHB protein may be a key factor affecting the kidney
injury.
Acknowledgements
The present study was supported by the National
Natural Science Foundation of China (grant no. U1403222) and the
Natural Science Fund of Hubei Province (grant no. 2015CFA018).
References
|
1
|
Li Y, Li J, Fu Q, Chen L, Fei J, Deng S,
Qiu J, Chen G, Huang G and Wang C: Kidney transplantation from
brain-dead donors: Initial experience in China. Transplant Proc.
48:2592–2595. 2016. View Article : Google Scholar : PubMed/NCBI
|
|
2
|
Sui WG, Yan Q, Xie SP, Chen HZ, Li D, Hu
CX, Peng WJ and Dai Y: Successful organ donation from brain dead
donors in a Chinese organ transplantation center. Am J Transplant.
11:2247–2249. 2011. View Article : Google Scholar : PubMed/NCBI
|
|
3
|
Wang C, Liu L, Fu Q, Meng F, Li J, Deng S,
Fei J, Yuan X, Han M, Chen L, et al: Kidney transplantation from
donors after brain or cardiac death in China-a clinical analysis of
94 cases. Transplant Proc. 45:1323–1326. 2013. View Article : Google Scholar : PubMed/NCBI
|
|
4
|
Zhang L, Zeng L, Gao X, Wang H and Zhu Y:
Transformation of organ donation in China. Transpl Int. 28:410–415.
2015. View Article : Google Scholar : PubMed/NCBI
|
|
5
|
Sun Q, Gao X, Ko DS and Li XC: Organ
transplantation in China-not yet a new era-Authors' reply. Lancet.
384:741–742. 2014. View Article : Google Scholar : PubMed/NCBI
|
|
6
|
Kosmoliaptsis V, Salji M, Bardsley V, Chen
Y, Thiru S, Griffiths MH, Copley HC, Saeb-Parsy K, Bradley JA,
Torpey N and Pettigrew GJ: Baseline donor chronic renal injury
confers the same transplant survival disadvantage for DCD and DBD
kidneys. Am J Transplant. 15:754–763. 2015. View Article : Google Scholar : PubMed/NCBI
|
|
7
|
Hatamizadeh P, Molnar MZ, Streja E,
Lertdumrongluk P, Krishnan M, Kovesdy CP and Kalantar-Zadeh K:
Recipient-related predictors of kidney transplantation outcomes in
the elderly. Clin Transplant. 27:436–443. 2013. View Article : Google Scholar : PubMed/NCBI
|
|
8
|
Mertes PM, el Abassi K, Jaboin Y, Burtin
P, Pinelli G, Carteaux JP, Burlet C, Boulange M and Villemot JP:
Changes in hemodynamic and metabolic parameters following induced
brain death in the pig. Transplantation. 58:414–418. 1994.
View Article : Google Scholar : PubMed/NCBI
|
|
9
|
Barklin A, Larsson A, Vestergaard C,
Kjaergaard A, Wogensen L, Schmitz O and Tønnesen E: Insulin alters
cytokine content in two pivotal organs after brain death: A porcine
model. Acta Anaesthesiol Scand. 52:628–634. 2008. View Article : Google Scholar : PubMed/NCBI
|
|
10
|
Lisman T, Leuvenink HG, Porte RJ and Ploeg
RJ: Activation of hemostasis in brain dead organ donors: An
observational study. J Thromb Haemost. 9:1959–1965. 2011.
View Article : Google Scholar : PubMed/NCBI
|
|
11
|
Fang H, Zhang S, Guo W, Cao S, Yan B, Lu Y
and Li J: Cobalt protoporphyrin protects the liver against
apoptosis in rats of brain death. Clin Res Hepatol Gastroenterol.
39:475–481. 2015. View Article : Google Scholar : PubMed/NCBI
|
|
12
|
Oberhuber R, Ritschl P, Fabritius C,
Nguyen AV, Hermann M, Obrist P, Werner ER, Maglione M, Flörchinger
B, Ebner S, et al: Treatment With tetrahydrobiopterin overcomes
brain death-associated injury in a murine model of pancreas
transplantation. Am J Transplant. 15:2865–2876. 2015. View Article : Google Scholar : PubMed/NCBI
|
|
13
|
Qureshi MS, Callaghan CJ, Bradley JA,
Watson CJ and Pettigrew GJ: Outcomes of simultaneous
pancreas-kidney transplantation from brain-dead and controlled
circulatory death donors. Br J Surg. 99:831–838. 2012. View Article : Google Scholar : PubMed/NCBI
|
|
14
|
Pratschke J, Wilhelm MJ, Kusaka M, Basker
M, Cooper DK, Hancock WW and Tilney NL: Brain death and its
influence on donor organ quality and outcome after transplantation.
Transplantation. 67:343–348. 1999. View Article : Google Scholar : PubMed/NCBI
|
|
15
|
Tezel G: A proteomics view of the
molecular mechanisms and biomarkers of glaucomatous
neurodegeneration. Prog Retin Eye Res. 35:18–43. 2013. View Article : Google Scholar : PubMed/NCBI
|
|
16
|
Du B, Li L, Zhong Z, Fan X, Qiao B, He C,
Fu Z, Wang Y and Ye Q: Brain death induces the alteration of liver
protein expression profiles in rabbits. Int J Mol Med. 34:578–584.
2014.PubMed/NCBI
|
|
17
|
Pratschke J, Wilhelm MJ, Kusaka M,
Laskowski I and Tilney NL: A model of gradual onset brain death for
transplant-associated studies in rats. Transplantation. 69:427–430.
2000. View Article : Google Scholar : PubMed/NCBI
|
|
18
|
Shevchenko A, Wilm M, Vorm O and Mann M:
Mass spectrometric sequencing of proteins silver-stained
polyacrylamide gels. Anal Chem. 68:850–858. 1996. View Article : Google Scholar : PubMed/NCBI
|
|
19
|
Jou YC, Fang CY, Chen SY, Chen FH, Cheng
MC, Shen CH, Liao LW and Tsai YS: Proteomic study of renal uric
acid stone. Urology. 80:260–266. 2012. View Article : Google Scholar : PubMed/NCBI
|
|
20
|
Sade RM: Brain death, cardiac death, and
the dead donor rule. J S C Med Assoc. 107:146–149. 2011.PubMed/NCBI
|
|
21
|
Avlonitis VS, Wigfield CH, Kirby JA and
Dark JH: The hemodynamic mechanisms of lung injury and systemic
inflammatory response following brain death in the transplant
donor. Am J Transplant. 5:684–693. 2005. View Article : Google Scholar : PubMed/NCBI
|
|
22
|
Rostron AJ, Avlonitis VS, Cork DM, Grenade
DS, Kirby JA and Dark JH: Hemodynamic resuscitation with arginine
vasopressin reduces lung injury after brain death in the transplant
donor. Transplantation. 85:597–606. 2008. View Article : Google Scholar : PubMed/NCBI
|
|
23
|
Kuecuek O, Mantouvalou L, Klemz R, Kotsch
K, Volk HD, Jonas S, Wesslau C, Tullius S, Neuhaus P and Pratschke
J: Significant reduction of proinflammatory cytokines by treatment
of the brain-dead donor. Transplant Proc. 37:387–388. 2005.
View Article : Google Scholar : PubMed/NCBI
|
|
24
|
Koudstaal LG, t Hart NA, Ottens PJ, van
den Berg A, Ploeg RJ, van Goor H and Leuvenink HG: Brain death
induces inflammation in the donor intestine. Transplantation.
86:148–154. 2008. View Article : Google Scholar : PubMed/NCBI
|
|
25
|
Auraen H, Mollnes TE, Bjørtuft Ø, Bakkan
PA, Geiran O, Kongerud J, Fiane A and Holm AM: Multiorgan
procurement increases systemic inflammation in brain dead donors.
Clin Transplant. 27:613–618. 2013. View Article : Google Scholar : PubMed/NCBI
|
|
26
|
Hvas CL, Fenger-Eriksen C, Høyer S,
Sørensen B and Tønnesen E: Hypercoagulation following brain death
cannot be reversed by the neutralization of systemic tissue factor.
Thromb Res. 132:300–306. 2013. View Article : Google Scholar : PubMed/NCBI
|
|
27
|
Wu X, Du Z, Yu J, Sun Y, Pei B, Lu X, Tang
Z, Yin M, Zhou L and Hu J: Activity of factor VII in patients with
isolated blunt traumatic brain injury: Association with
coagulopathy and progressive hemorrhagic injury. J Trauma Acute
Care Surg. 76:114–120. 2014. View Article : Google Scholar : PubMed/NCBI
|
|
28
|
Leber B, Stadlbauer V, Stiegler P, Stanzer
S, Mayrhauser U, Koestenbauer S, Leopold B, Sereinigg M, Puntschart
A, Stojakovic T, et al: Effect of oxidative stress and endotoxin on
human serum albumin in brain-dead organ donors. Transl Res.
159:487–496. 2012. View Article : Google Scholar : PubMed/NCBI
|
|
29
|
Vespa PM: Hormonal dysfunction in
neurocritical patients. Curr Opin Crit Care. 19:107–112. 2013.
View Article : Google Scholar : PubMed/NCBI
|
|
30
|
Ranasinghe AM and Bonser RS: Endocrine
changes in brain death and transplantation. Best Pract Res Clin
Endocrinol Metab. 25:799–812. 2011. View Article : Google Scholar : PubMed/NCBI
|
|
31
|
Mikhova KM, Don CW, Laflamme M, Kellum JA,
Mulligan MS, Verrier ED and Rabkin DG: Effect of cytokine
hemoadsorption on brain death-induced ventricular dysfunction in a
porcine model. J Thorac Cardiovasc Surg. 145:215–224. 2013.
View Article : Google Scholar : PubMed/NCBI
|
|
32
|
Vazquez A, Flammini A, Maritan A and
Vespignani A: Global protein function prediction from
protein-protein interaction networks. Nat Biotechnol. 21:697–700.
2003. View
Article : Google Scholar : PubMed/NCBI
|
|
33
|
Chowdhury I, Branch A, Olatinwo M, Thomas
K, Matthews R and Thompson WE: Prohibitin (PHB) acts as a potent
survival factor against ceramide induced apoptosis in rat granulosa
cells. Life Sci. 89:295–303. 2011. View Article : Google Scholar : PubMed/NCBI
|
|
34
|
Liu T, Tang H, Lang Y, Liu M and Li X:
MicroRNA-27a functions as an oncogene in gastric adenocarcinoma by
targeting prohibitin. Cancer Lett. 273:233–242. 2009. View Article : Google Scholar : PubMed/NCBI
|