Introduction
Nasopharyngeal carcinoma (NPC) is a common head and
neck cancer that arises from the nasopharynx epithelium. Although
excellent local control can be achieved with advances in multimodal
therapy, the poor prognosis of NPC with frequent tumor recurrence
and distant metastases obstructs long-term patient survival
(1). As previously described
(2), genetic susceptibility, as
well as environmental factors and Epstein-Bar virus (EBV) infection
are the three primary etiologic factors of NPC. However, the
molecular mechanism of its pathogenesis is still unclear (2). Exploring the underlying molecular
mechanisms of NPC involved in its pathogenesis and progression may
improve NPC diagnosis and therapy.
MicroRNAs (miRNAs/miRs), a class of small non-coding
RNAs, have emerged as post-transcriptional regulators of gene
expression by binding to the untranslated region during various
biological processes (3). There
are an increasing number of studies concerning miRNA-dysregulation
in cancers including NPC (4–6). As
noted previously, miRNAs including hsa-miR-141, hsa-miR-138,
hsa-miR-200a and hsa-miR-26a are altered in NPC (7–9).
However, these studies were focused on experimental validation for
selected outlier miRNAs. Systematic computational methods, which
integrate miRNA regulatory data and gene expression profiling data,
provide an effective tool to understand the role of miRNA with
respect to modules or interactions (10). A conceptual miRNA regulation module
has been proposed based on the multiple-to-multiple relationship
between miRNAs and their target genes (11). Due to the co-regulatory effects of
miRNAs on the same genes, abnormal miRNAs may exhibit increased
functional synergism (12). This
concept has been investigated in cancer research and several
candidate abnormal miRNAs or miRNA regulatory modules have been
identified (13–15).
A change in gene expression levels is observed in
tumor samples, which is believed to be an important mechanism of
tumorigenesis and pathogenicity. Gene expression is not isolated
and there is an association between gene expression and gene
function, leading to a tendency to study modular expression
associated with function (16,17).
Gene regulatory network modules are able to be organized into lower
dimensional function modules, which have marked biological
significance (18). The functional
pairs with highly correlating expression trends may be obtained
through analyzing the expression correlation of these function
modules. Furthermore, the functional pairs associated with NPC may
be screened using hypergeometric testing.
In the present study, the miRNA and mRNA expression
profiles were integrated, as well as functional pairs, to construct
an miRNA-mRNA-pathway network to evaluate the candidate risk
factors associated with NPC and the miRNA biomarkers.
Materials and methods
Data collection and processing
mRNA and miRNA expression profiles were collected
and extracted from the European Molecular Biology
Laboratory-European Bioinformatics Institute (EMBL-EBI; www.ebi.ac.uk). ‘NPC’ was selected as the key word to
search gene expression profiles, within which the study type was
limited to array expression profiling and the species was limited
to human. The following datasets were excluded: i) Tissue samples
were cell samples; ii) samples were not NPC tissue; iii) the
datasets did not include normal controls; and iv) the microarray
platform did not include sufficient intersecting data with other
platforms.
The normalized data from included microarrays were
downloaded and the raw probe-level data in the mRNA expression
files were converted into expression measures. For each sample, the
expression values for a given gene were reduced to a single value
by taking the average expression value of all probes.
Differentially expressed gene (DEG)
and differentially expressed miRNA (DEmiR) analysis
The metaDE package (19) in R language was used to screen out
the DEGs and DEmiRs between NPC samples and normal controls.
P<0.05 and |log2 fold change (FC)|>1.0 were set as
thresholds.
Prediction risk genes for NPC
The target genes of DEmiRs were obtained from three
different databases: miRecords (version 3; http://c1.accurascience.com/miRecords/), miRTarbase
(release 2.5; http://mirtarbase.mbc.nctu.edu.tw/) and Tarbase
(version 5.0; http://diana.imis.athena-innovation.gr/DianaTools/index.php?r=tarbase/index/).
The target genes predicted by the above three databases were merged
to one uniform non-redundant set. The intersection of DEGs and the
target genes of DEmiRs were considered to be the risk genes of NPC
for further analysis.
Pathway enrichment analysis
Gene Ontology (GO) (20) and Kyoto Encyclopedia of Genes and
Genomes (KEGG) (21) were
performed for biological processes analysis and functional pathways
enrichment of risk genes by Database for Annotation, Visualization
and Integrated Discovery (DAVID) (22), which is an integrated biological
knowledge base and effective analytic tool to systematically
extract biological information and explore the biological meanings
behind abundant lists of genes or proteins. P<0.05 was set as
the threshold value.
Pathway expression profile
construction
All known signaling pathways and pathway genes in
humans were downloaded from the PATHWAY database in KEGG. The
expression levels for each pathway in the selected samples were
evaluated by Median, using the following formula:
Pathik=Mediank (g1,
g2, g3, …, gn), where
Pathik indicates the expression level of pathway
i in sample k; and g1, g2,
g3, …, gn indicate the expression level
of all genes from the pathway in sample k (23). Therefore, the pathway expression
profile was established based on the expression level of pathways
in selected samples by calculating the Median.
Expression correlation analysis among
signaling pathways
The pathogenesis of NPC is associated with abnormal
expression of multiple signaling pathways. The expression
correlation between pathway pairs was calculated to identify the
important pathway. The pathways were considered critical pathways
if they were highly correlated in both NPC and normal samples.
The expression correlation between two pathways in
all samples (NPC samples and control samples) were evaluated by
calculating the Pearson's correlation coefficient:
PX,Y=∑(X–X¯)(Y–Y¯)∑(X–X¯)2∑(Y–Y¯)2
Where PX, Y indicates the
expression coefficient between pathway X and pathway
Y among all samples; and X and Y and indicate
the mean expression level of pathway X and pathway Y
among all samples, respectively. The pathway pairs with coefficient
>0.5 were considered to be candidates.
The pathway pairs involved in NPC were screened
using the hypergeometric test as follows:
p=1–∑i=0k–1CMiCN–Mn–iCNn
Where n indicates the same risk genes between
two couple pathways; N indicates all genes between two
couple pathways; and M indicates all risk genes between two
couple pathways. Any pathway pair with P<0.05 was considered to
be a prominent pathway pair in NPC.
Establishment of miRNA-mRNA-pathway
network
The same genes in prominent pathway pairs were
selected and the corresponding mRNA-pathway pairs were obtained.
Furthermore, mRNA-mRNA pairs were extracted from the Human Protein
Reference Database (HPRD; www.hprd.org).
Afterwards, the miRNA-mRNA pairs, the mRNA-pathway pairs and the
mRNA-mRNA pairs were constructed into a miRNA-mRNA-pathway
network.
The nodes in the network included miRNA, risk genes
and pathway pairs, while the edges represented the miRNA-mRNA
relationship pairs as well as mRNA-pathway pairs. This
miRNA-mRNA-pathway network reflects not only the regulatory
association between miRNA and risk genes, but also indicates the
regulatory function of miRNA.
The risk genes involved in NPC were further screened
by analyzing the topological properties of the miRNA-mRNA-pathway
network using the network analysis plugin in Cytoscape (24) in combination with the consideration
of the regulatory function of miRNA. These topological properties
included degree, average shortest path length, closeness
centrality, betweenness centrality and topological coefficient. The
10-fold cross-validation was used to measure the performance of the
selected risk genes and their corresponding miRNA for the NPC by
calculating the AUC (area under the curve) of the
receiver-operating characteristic (ROC) curve.
Results
Raw data
A total of 43 relevant gene expression profiles were
identified in EMBL-EBI, of which 36 were excluded. A total of six
gene expression profiles (four for mRNA expression profiles and two
for miRNA expression profiles) were included in the present study
(Table I).
 | Table I.mRNA and miRNA datasets information
for NPC. |
Table I.
mRNA and miRNA datasets information
for NPC.
| Microarray | Microarray
type | Platform | No. of NPC
samples | No. of normal
control samples |
|---|
| GSE12452 | mRNA | GPL570 | 31 | 10 |
| GSE13597 | mRNA | GPL96 | 25 | 3 |
| GSE34573 | mRNA | GPL570 | 15 | 3 |
| GSE53819 | mRNA | GPL6480 | 18 | 18 |
| GSE32960 | miRNA | GPL14722 | 312 | 18 |
| GSE46172 | miRNA | GPL16770 |
4 | 4 |
Identification of DEGs and DEmiRs in
NPC
A total of 1540 DEGs were selected between NPC
samples and normal controls. Among these DEGs, 699 genes were
upregulated and 841 genes were downregulated. A total of 218 DEmiRs
were collected, including 192 upregulated and 26 downregulated
miRNAs.
Prediction risk genes for NPC
A total of 3,641 miRNA-target gene pairs were
identified for NPC-specific DEmiRs. The intersection of DEGs and
the target genes of DEmiRs were considered to be the risk genes of
NPC for further analysis. A total of 403 miRNA-mRNA pairs including
40 miRNA and 302 risk genes were obtained.
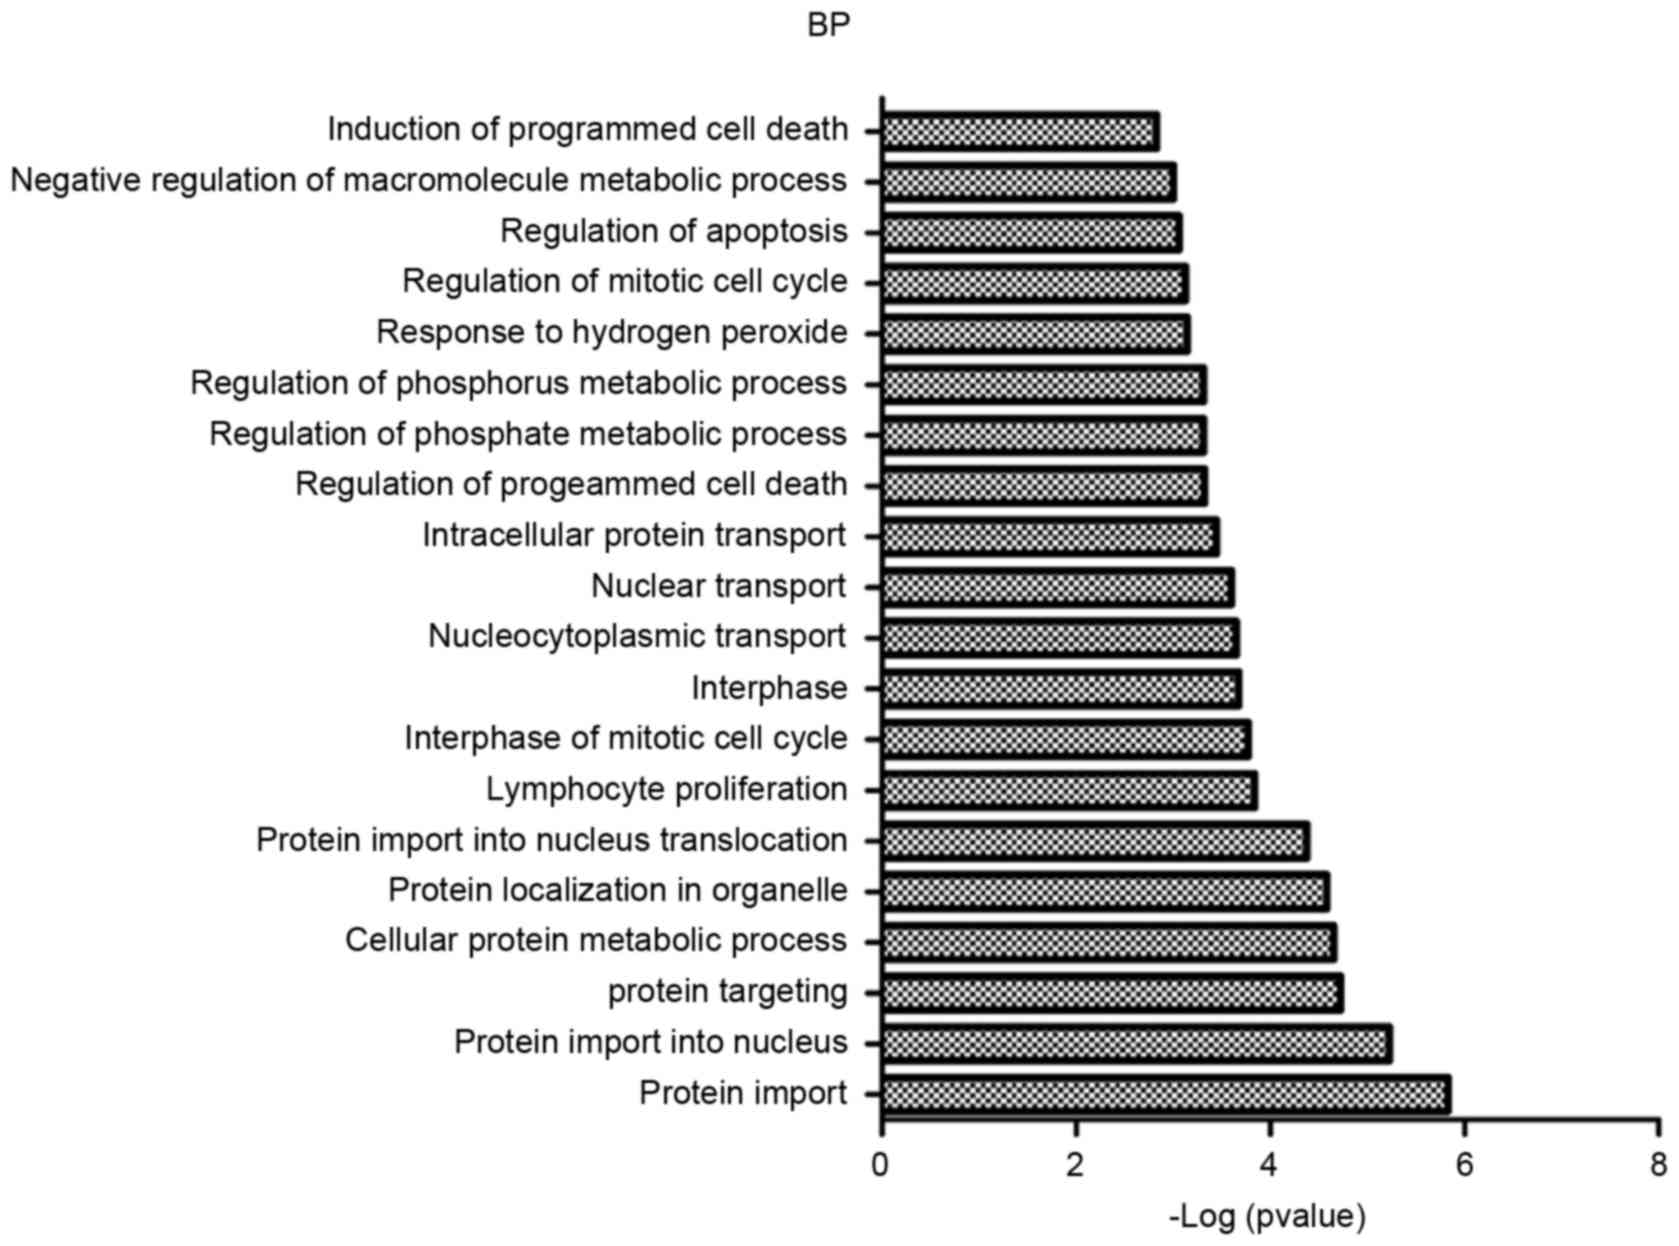
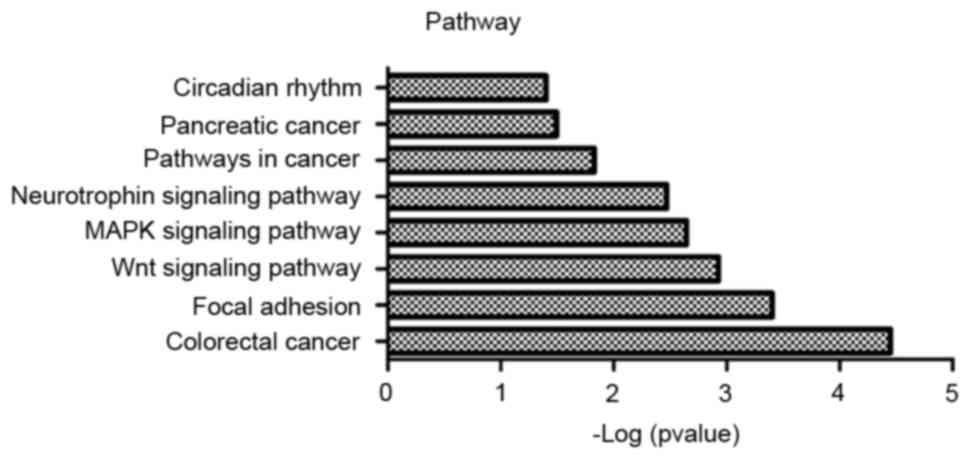
Significant function and pathways of
risk genes
GO and KEGG pathway enrichment analyses were
performed for risk genes, and the results are presented in Figs. 1 and 2. According to the results, risk genes
were enriched in multiple GO categories, primarily including
protein import, protein targeting and protein localization in an
organelle, etc. Simultaneously, the risk genes were enriched in
several signaling pathways, including colorectal cancer pathways,
Wnt signaling pathways and mitogen-activated protein kinase
signaling pathways.
Prediction pathways for NPC
A total of 293 human signaling pathways were
downloaded from the PATHWAY database in KEGG. The pathway
expression profile was obtained by calculating the
Pathik of each pathway in each sample. Following
calculation of the Pearson's correlation coefficient, 473
highly-correlated pathway pairs were acquired. A total of 22
prominent pathway pairs were subsequently selected using the
hypergeometric test, all of which were associated with risk genes
(Table II).
| Table II.Topological properties of 22
prominent pathways pairs in the miRNA-risk gene-pathway
network. |
Table II.
Topological properties of 22
prominent pathways pairs in the miRNA-risk gene-pathway
network.
| Pathway pair | Topological
Coefficient | Average shortest
path length | Betweenness
centrality | Closeness
centrality | Degree |
|---|
| Pathways in cancer
_focal adhesiona | 0.1742 | 2.8952 | 0.0268 | 0.3454 | 24 |
| Proteoglycans in
cancer _pathways in cancer | 0.1854 | 2.8754 | 0.0243 | 0.3478 | 21 |
| Wnt signaling
pathway _pathways in cancer | 0.2162 | 2.9207 | 0.0109 | 0.3424 | 19 |
| Epstein-barr virus
infection _htlv-i infection | 0.2144 | 3.1473 | 0.0107 | 0.3177 | 17 |
| Pathways in cancer
_colorectal cancer | 0.2280 | 2.9292 | 0.0068 | 0.3414 | 17 |
| Htlv-i infection
_colorectal cancer | 0.2419 | 2.9688 | 0.0059 | 0.3368 | 15 |
| Viral
carcinogenesis_herpes simplex infection | 0.1946 | 2.9972 | 0.0128 | 0.3336 | 15 |
| Wnt signaling
pathway _colorectal cancer | 0.2637 | 2.9745 | 0.0054 | 0.3362 | 13 |
| Wnt signaling
pathway _choline metabolism in cancer | 0.2876 | 3.1671 | 0.0025 | 0.3157 | 11 |
| Cell cycle _small
cell lung cancer | 0.2909 | 3.0623 | 0.0026 | 0.3265 | 9 |
| Colorectal cancer
_hepatitis b | 0.3575 | 3.1983 | 0.0013 | 0.3127 | 8 |
| Rap1 signaling
pathway _adherens junction | 0.2609 | 3.2720 | 0.0026 | 0.3056 | 8 |
| Bladder cancer
_calcium signaling pathway | 0.2912 | 3.0850 | 0.0017 | 0.3242 | 7 |
| Bladder cancer
_cell cycle | 0.3544 | 3.1841 | 0.0008 | 0.3141 | 7 |
| Bladder cancer
_small cell lung cancer | 0.3383 | 3.2465 | 0.0004 | 0.3080 | 7 |
| Chemokine signaling
pathway _viral myocarditis | 0.2612 | 3.2238 | 0.0046 | 0.3102 | 7 |
| Ecm-receptor
interaction _amoebiasis | 0.3029 | 3.3541 | 0.0014 | 0.2981 | 7 |
| P53 signaling
pathway _cell cycle | 0.3794 | 3.2125 | 0.0007 | 0.3113 | 6 |
| Shigellosis
_pancreatic cancer | 0.3690 | 3.2380 | 0.0010 | 0.3088 | 6 |
| NF-kappa b
signaling pathway _tuberculosis | 0.3273 | 3.6232 | 0.0013 | 0.2760 | 5 |
| Salmonella
infection _shigellosis | 0.4872 | 3.3399 | 0.0004 | 0.2994 | 4 |
| Bile secretion
_salivary secretion | 0.5000 | 3.7960 | 0.0002 | 0.2634 | 2 |
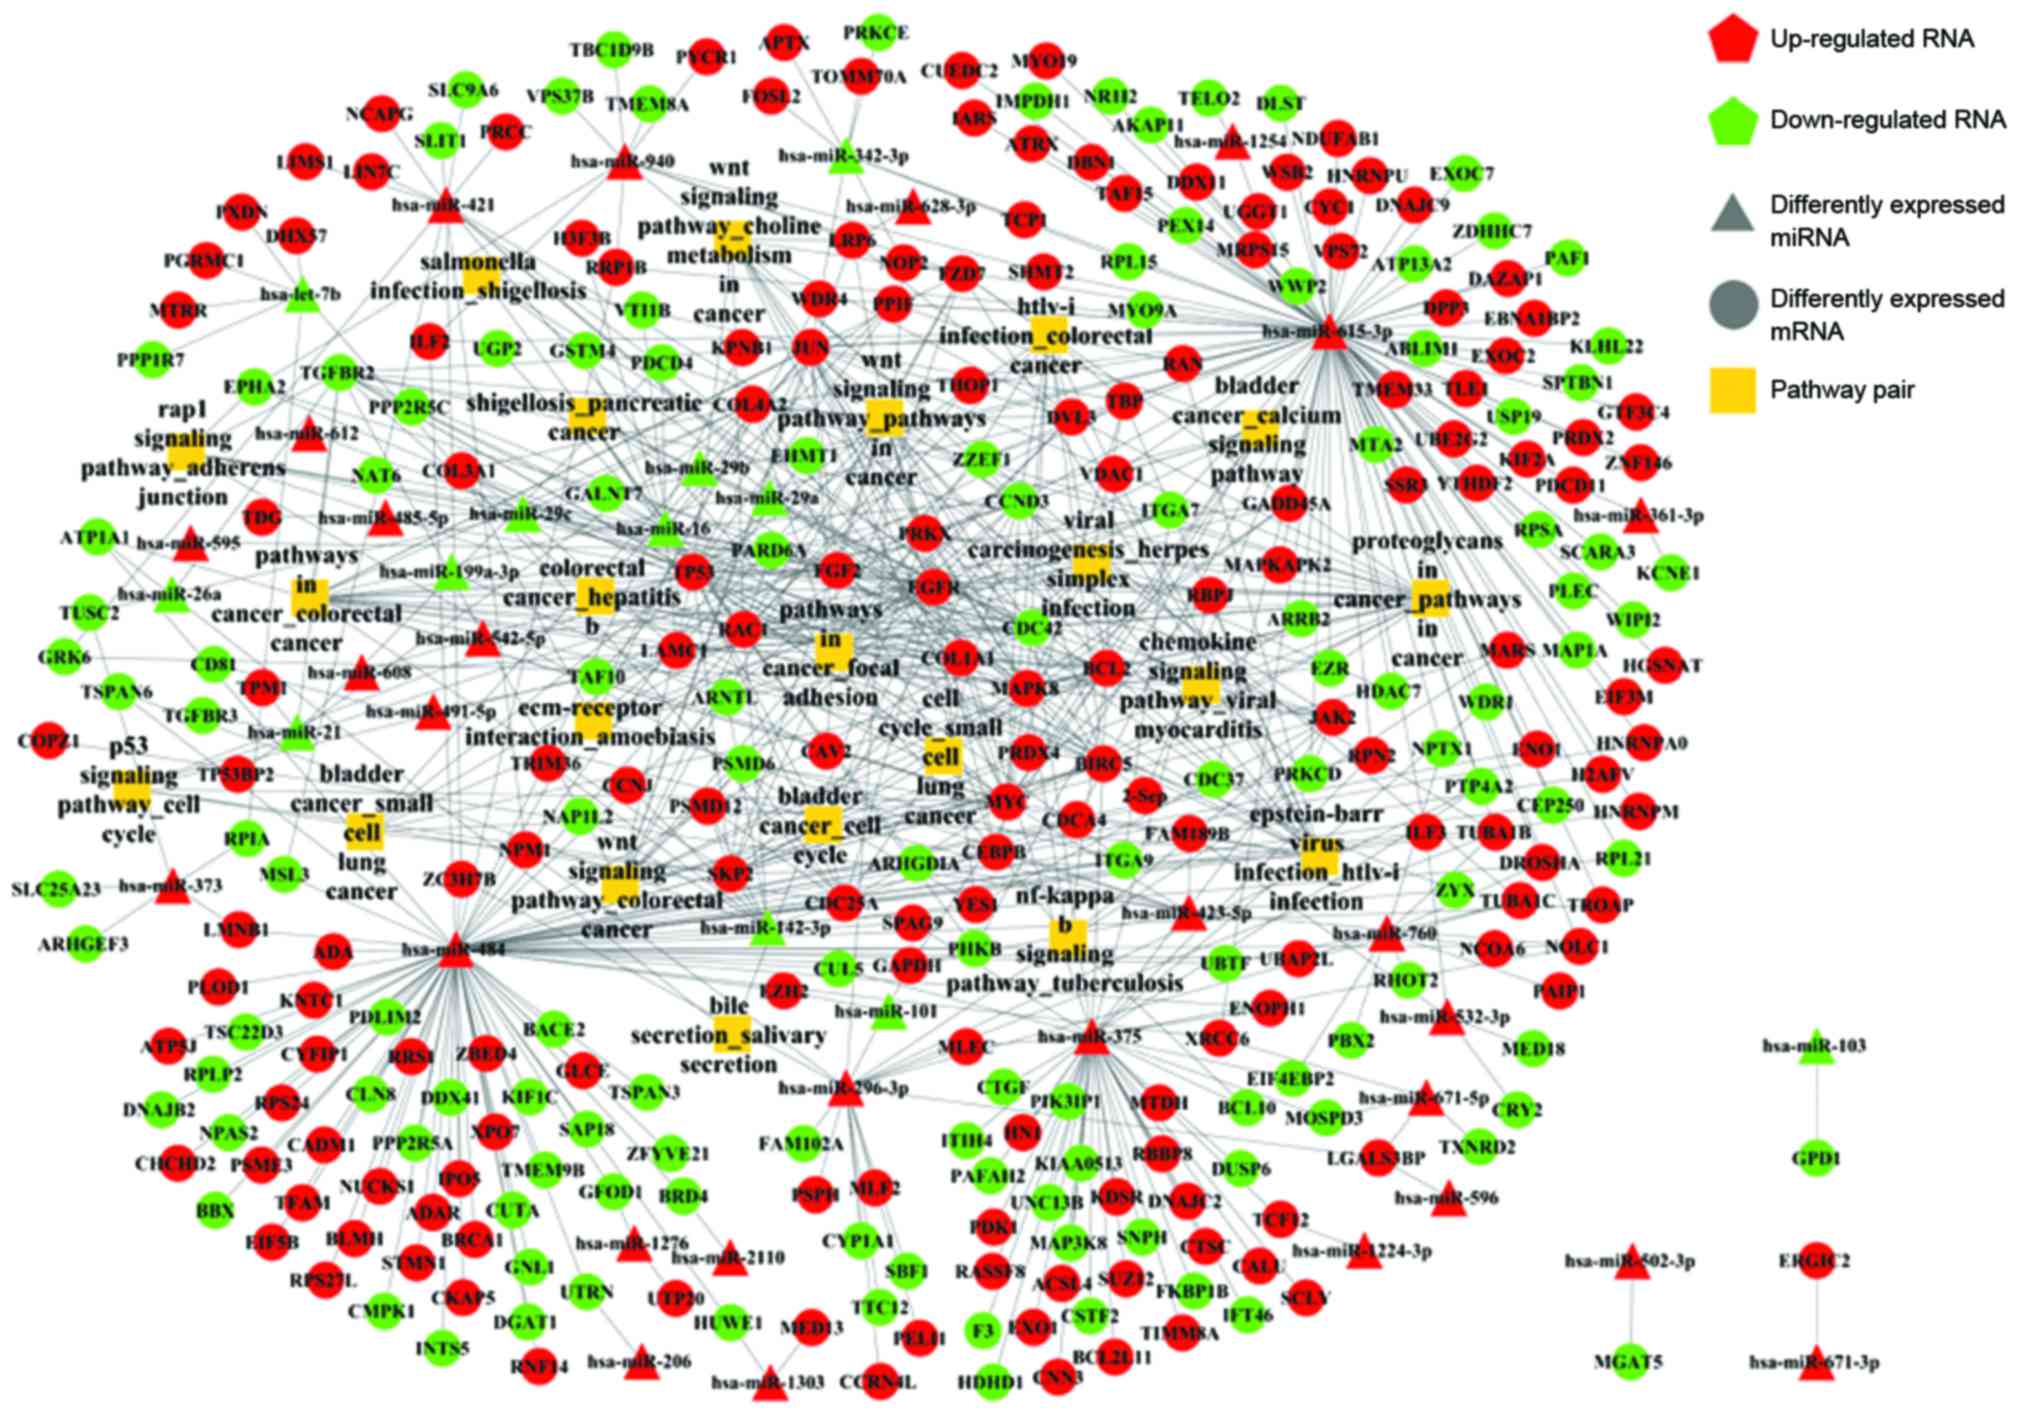
Construction of miRNA-mRNA-pathway
network
There were 69 mRNA-mRNA pairs extracted from HPRD
with 38 risk genes. Following the merging of the miRNA-mRNA
relationship pairs, the mRNA-pathway pairs and the mRNA-mRNA pairs,
the miRNA-mRNA-pathway network was constructed. A total of 702
relationship pairs and 360 nodes were discovered (Fig. 3).
Functional analysis of
miRNA-mRNA-pathway network
Following analysis of the topological properties of
22 prominent pathways pairs in the miRNA-mRNA-pathway network,
three pathway pairs were associated with risk genes, including
focal adhesion, proteoglycans in cancer and the Wnt signaling
pathway.
Subsequently, 15 risk genes with the highest degrees
were extracted in the present study and their topological
properties are presented in Table
III. Prediction accuracy of these 15 risk genes for NPC was
measured by 10-fold cross-validation, the AUC values for which are
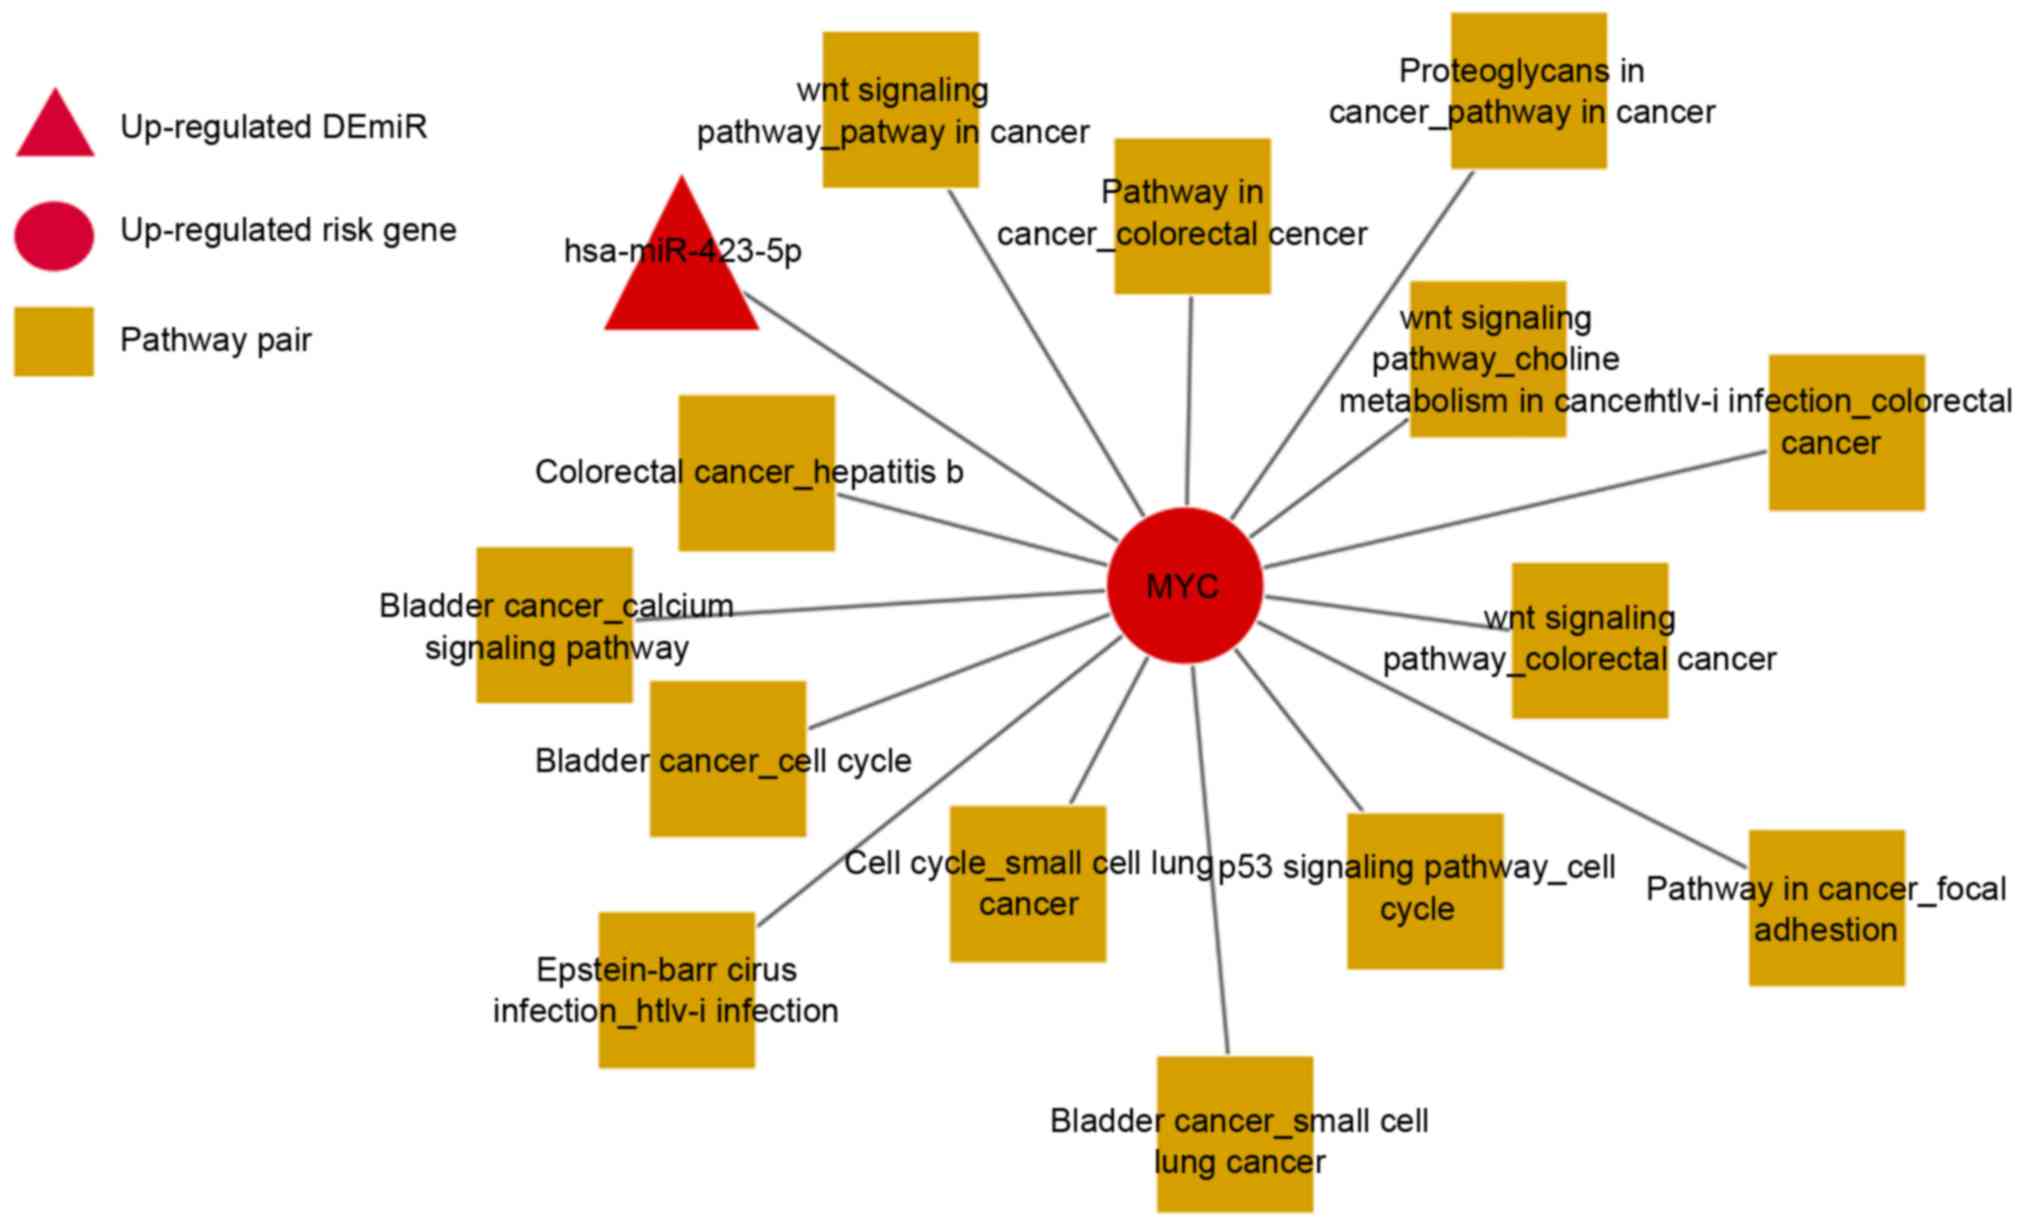
presented in Table IV. Among
these risk genes, v-myc avian myelocytomatosis viral oncogene
homolog (MYC), as a hub gene connecting with both miRNA and pathway
pairs, serves the most important role in the miRNA-mRNA-pathway
network (Fig. 4).
| Table III.Topological properties of 15 selected
risk genes with highest degrees in the miRNA-risk gene-pathway
network. |
Table III.
Topological properties of 15 selected
risk genes with highest degrees in the miRNA-risk gene-pathway
network.
| Risk gene | Topological
coefficient | Average shortest
path length | Betweenness
centrality | Closeness
centrality | Degree |
|---|
| MYCa | 0.0026 | 2.0741 | 0.3792 | 0.4821 | 841 |
| TP53 | 0.0031 | 2.1036 | 0.2838 | 0.4754 | 668 |
| JUN | 0.0063 | 2.2764 | 0.0923 | 0.4393 | 268 |
| EGFR | 0.0065 | 2.528 | 0.1124 | 0.3956 | 294 |
| BIRC5 | 0.0074 | 2.3675 | 0.0784 | 0.4224 | 194 |
| TBP | 0.0075 | 2.429 | 0.065 | 0.4117 | 195 |
| MAPK8 | 0.009 | 2.3637 | 0.0543 | 0.4231 | 170 |
| SKP2 | 0.01 | 2.4516 | 0.044 | 0.4079 | 156 |
| JAK2 | 0.0103 | 2.668 | 0.0513 | 0.3748 | 168 |
| FGF2 | 0.0106 | 2.5393 | 0.0467 | 0.3938 | 139 |
| RAC1 | 0.0106 | 2.8012 | 0.0708 | 0.357 | 217 |
| BCL2 | 0.0108 | 2.4651 | 0.0418 | 0.4057 | 126 |
| CDC42 | 0.0126 | 2.7745 | 0.0419 | 0.3604 | 146 |
| EZR | 0.0126 | 2.7924 | 0.0473 | 0.3581 | 133 |
| PSMD12 | 0.0245 | 2.9105 | 0.023 | 0.3436 | 125 |
| Table IV.Prediction accuracy of 15 risk genes
for NPC after 10-fold cross-validation. |
Table IV.
Prediction accuracy of 15 risk genes
for NPC after 10-fold cross-validation.
| Risk gene | AUC in
GSE12452 | AUC in
GSE34573 | AUC in
GSE53819 | AUC in
GSE13597 |
|---|
| BCL2 | 0.829 | 1 | 0.5278 | 0.68 |
| BIRC5 | 0.8903 | 0.6 | 0.7901 | 0.9467 |
| CDC42 | 0.7 | 0.5778 | 0.7377 | 0.64 |
| EGFR | 0.6258 | 0.6 | 0.6975 | 0.6 |
| EZR | 0.9774 | 1 | 0.8179 | 0.7333 |
| FGF2 | 0.8548 | 0.7778 | 0.5617 | 0.8667 |
| JAK2 | 0.7806 | 0.9111 | 0.5895 | 0.68 |
| JUN | 0.6258 | 0.6444 | 0.8827 | 0.68 |
| MAPK8 | 0.8581 | 0.5556 | 0.8025 | 0.72 |
| MYCa | 0.8645 | 0.5333 | 0.8302 | 0.8133 |
| PSMD12 | 0.8323 | 0.9778 | 0.8981 | 0.76 |
| RAC1 | 0.6226 | 0.8 | 0.8272 | 0.92 |
| SKP2 | 0.9323 | 0.6 | 0.7994 | 0.9733 |
| TBP | 0.6903 | 0.9111 | 0.5123 | 0.6267 |
| TP53 | 0.7645 | 0.6 | 0.6914 | 0.8 |
Cross-validation of risk genes and its
corresponding miRNA
MYC is differentially expressed in NPC. The AUC of
MYC in GSE12452, GSE13597, GSE34573 and GSE53819 were 0.8645,
0.8133, 0.5333 and 0.8302, respectively. As presented in Fig. 4, MYC regulates 14 pathway pairs,
including pathways in cancer_focal adhesion, proteoglycans in
cancer_pathways in cancer, and Wnt signaling pathway_colorectal
cancer. Additionally, focal adhesion has the highest degrees in the
network, which is speculated to be associated with the development
of NPC.
In addition, MYC is regulated by hsa-miR-423-5p,
which is differentially expressed in NPC. The AUC for
hsa-miR-423-5p is 0.7798.
Discussion
In order to improve understanding of the
pathogenesis of NPC, the high-throughput sequencing datasets for
NPC in EMBL-EBI were analyzed. A total of 1,540 DEGs and 218 DEmiRs
were identified in the present study (699 upregulated genes and 841
downregulated genes; 192 upregulated miRNAs and 26 downregulated
miRNAs). Genome-wide miRNA-, mRNA- and pathway-expression in the
NPC was subsequently investigated, and the miRNA-mRNA-pathway
network in NPC was constructed. Considering the topological
properties of nodes in the network, the risk gene (MYC) with the
highest degree was selected, which was indicated to serve an
important role in NPC. Additionally, hsa-miR-423-5p, which is
differentially expressed in NPC, was identified to regulate
MYC.
In the present study, the focal adhesion pair
pathway was significantly associated with NPC. As previously
described, integrin cluster signaling is involved in cell migration
and tumor invasion and focal adhesion kinase (FAK) is the key
molecule in this signaling pathway (25). Suppressing the expression of FAK
may retard cell invasion and redistribute the actin cytoskeleton to
resemble a rounded dormant cell (26). Furthermore, re-expression of FAK
may restore the motile phenotypes in FAK-negative cells (26). The focal adhesion pathway has
previously been demonstrated to be involved in NPC carcinogenesis
and progression (27,28). Additionally, Kassis et al
(29) indicated that the focal
adhesion pathway serves an important role in promoting
EBV-associated invasiveness of NPC. EBV infection (a potential
etiologic factor underlying NPC) is able to increase
phosphorylation of FAK. The present study was consistent with
previous discoveries and demonstrated the important role of focal
adhesion in cancer, particularly in NPC.
Following extraction of information based on the
topological properties from the miRNA-mRNA-pathway network, the
risk gene MYC was observed to have the highest degree. It is
well-accepted that activated signaling of MYC genes is a hallmark
of several types of cancer, which also contributes to tumorigenesis
by promoting cell growth, metastasis and angiogenesis (30). Additionally, MYC genes acting as
transcription factors are able to modulate the transcription and
expression of their target genes through various mechanisms
(31,32). MYC mutation or overexpression is
associated with tumorigenesis (33,34).
In the present study, aberrantly-expressed MYC was identified with
a prediction accuracy of 0.7568. Previous studies have demonstrated
that MYC genes are involved in the tumor progression and metastasis
of NPC (33,34), which was also indicated in the
present study.
In addition, the MYC gene transcriptional network
has been indicated to include miRNAs (35). Certain miRNAs, including those
belonging to the oncogenic miR-17-92 cluster, have been
demonstrated to be involved in MYC signaling (36–39).
In the present study, a more general insight into the association
between miRNAs and mRNAs within the MYC transcriptional network was
provided. From the miRNA-mRNA-pathways network, hsa-miR-423-5p, a
novel biomarker targeting MYC, has been identified. Following
10-fold cross-validation, the prediction accuracy for
classification effects of hsa-miR-423-5p was 0.7798. Studies have
demonstrated that hsa-miR-423-5p is able to promote autophagy of
tumor cells (40), which may also
be considered a potential biomarker for cancer (41,42).
Based on the results of the present study, the targeting of MYC by
hsa-miR-423-5p may serve an important role in the tumorigenesis,
progression and metastasis of NPC, however, further experimental
studies are required to identify their exact mechanisms in NPC.
In conclusion, MYC and hsa-miR-423-5p were
identified to be potential miRNA and mRNA signatures of NPC,
respectively. In addition, focal adhesion was indicated as one of
the most important signaling pathways in the progression of NPC.
The results provide molecular candidates for further studies into
the diagnosis and treatment of NPC.
References
|
1
|
Lai SZ, Li WF, Chen L, Luo W, Chen YY, Liu
LZ, Sun Y, Lin AH, Liu MZ and Ma J: How does intensity-modulated
radiotherapy versus conventional two-dimensional radiotherapy
influence the treatment results in nasopharyngeal carcinoma
patients? Int J Radiat Oncol Biol Phys. 80:661–668. 2011.
View Article : Google Scholar : PubMed/NCBI
|
|
2
|
Chou J, Lin YC, Kim J, You L, Xu Z, He B
and Jablons DM: Nasopharyngeal carcinoma-review of the molecular
mechanisms of tumorigenesis. Head Neck. 30:946–963. 2008.
View Article : Google Scholar : PubMed/NCBI
|
|
3
|
He L and Hannon GJ: MicroRNAs: Small RNAs
with a big role in gene regulation. Nat Rev Genet. 5:522–531. 2004.
View Article : Google Scholar : PubMed/NCBI
|
|
4
|
Chen J, Zhang D, Zhang W, Tang Y, Yan W,
Guo L and Shen B: Clear cell renal cell carcinoma associated
microRNA expression signatures identified by an integrated
bioinformatics analysis. J Transl Med. 11:1692013. View Article : Google Scholar : PubMed/NCBI
|
|
5
|
Lerebours F, Cizeron-Clairac G, Susini A,
Vacher S, Mouret-Fourme E, Belichard C, Brain E, Alberini JL,
Spyratos F, Lidereau R and Bieche I: miRNA expression profiling of
inflammatory breast cancer identifies a 5-miRNA signature
predictive of breast tumor aggressiveness. Int J Cancer.
133:1614–1623. 2013. View Article : Google Scholar : PubMed/NCBI
|
|
6
|
Pignot G, Cizeron-Clairac G, Vacher S,
Susini A, Tozlu S, Vieillefond A, Zerbib M, Lidereau R, Debre B,
Amsellem-Ouazana D and Bieche I: microRNA expression profile in a
large series of bladder tumors: Identification of a 3-miRNA
signature associated with aggressiveness of muscle-invasive bladder
cancer. Int J Cancer. 132:2479–2491. 2013. View Article : Google Scholar : PubMed/NCBI
|
|
7
|
Xia H, Ng SS, Jiang S, Cheung WK, Sze J,
Bian XW, Kung HF and Lin MC: miR-200a-mediated downregulation of
ZEB2 and CTNNB1 differentially inhibits nasopharyngeal carcinoma
cell growth, migration and invasion. Biochem Biophys Res Commun.
391:535–541. 2010. View Article : Google Scholar : PubMed/NCBI
|
|
8
|
Sengupta S, Den Boon JA, Chen IH, Newton
MA, Dahl DB, Chen M, Cheng YJ, Westra WH, Chen CJ, Hildesheim A, et
al: Genome-wide expression profiling reveals EBV-associated
inhibition of MHC class I expression in nasopharyngeal carcinoma.
Cancer Res. 66:7999–8006. 2006. View Article : Google Scholar : PubMed/NCBI
|
|
9
|
Liu X, Lv XB, Wang XP, Sang Y, Xu S, Hu K,
Wu M, Liang Y, Liu P, Tang J, et al: MiR-138 suppressed
nasopharyngeal carcinoma growth and tumorigenesis by targeting the
CCND1 oncogene. Cell Cycle. 11:2495–2506. 2012. View Article : Google Scholar : PubMed/NCBI
|
|
10
|
Zhang W, Zang J, Jing X, Sun Z, Yan W,
Yang D, Shen B and Guo F: Identification of candidate miRNA
biomarkers from miRNA regulatory network with application to
prostate cancer. J Transl Med1. 2:662014. View Article : Google Scholar
|
|
11
|
Yoon S and De Micheli G: Prediction of
regulatory modules comprising microRNAs and target genes.
Bioinformatics. 21 Suppl 2:ii93–ii100. 2005. View Article : Google Scholar : PubMed/NCBI
|
|
12
|
Bandyopadhyay S, Mitra R, Maulik U and
Zhang MQ: Development of the human cancer microRNA network.
Silence. 1:62010. View Article : Google Scholar : PubMed/NCBI
|
|
13
|
Zhang W, Edwards A, Fan W, Flemington EK
and Zhang K: miRNA-mRNA correlation-network modules in human
prostate cancer and the differences between primary and metastatic
tumor subtypes. PLoS One. 7:e401302012. View Article : Google Scholar : PubMed/NCBI
|
|
14
|
Zhang S, Li Q, Liu J and Zhou XJ: A novel
computational framework for simultaneous integration of multiple
types of genomic data to identify microRNA-gene regulatory modules.
Bioinformatics. 27:i401–i409. 2011. View Article : Google Scholar : PubMed/NCBI
|
|
15
|
Kim SJ, Ha JW and Zhang BT: Constructing
higher-order miRNA-mRNA interaction networks in prostate cancer via
hypergraph-based learning. BMC Sys Biol. 7:472013. View Article : Google Scholar
|
|
16
|
Ross DT, Scherf U, Eisen MB, Perou CM,
Rees C, Spellman P, Iyer V, Jeffrey SS, Van de Rijn M, Waltham M,
et al: Systematic variation in gene expression patterns in human
cancer cell lines. Nat Genet. 24:227–235. 2000. View Article : Google Scholar : PubMed/NCBI
|
|
17
|
Ihmels J, Friedlander G, Bergmann S, Sarig
O, Ziv Y and Barkai N: Revealing modular organization in the yeast
transcriptional network. Nat Genet. 31:370–377. 2002.PubMed/NCBI
|
|
18
|
Segal E, Shapira M, Regev A, Peer D,
Botstein D, Koller D and Friedman N: Module networks: Identifying
regulatory modules and their condition-specific regulators from
gene expression data. Nat Genet. 34:166–176. 2003. View Article : Google Scholar : PubMed/NCBI
|
|
19
|
Li J and Tseng GC: An adaptively weighted
statistic for detecting differential gene expression when combining
multiple transcriptomic studies. Annals Applied Statistics.
5:994–1019. 2011. View Article : Google Scholar
|
|
20
|
Ashburner M, Ball CA, Blake JA, Botstein
D, Butler H, Cherry JM, Davis AP, Dolinski K, Dwight SS, Eppig JT,
et al: Gene ontology: Tool for the unification of biology. The gene
ontology consortium. Nat Genet. 25:25–29. 2000. View Article : Google Scholar : PubMed/NCBI
|
|
21
|
Aoki-Kinoshita KF and Kanehisa M: Gene
annotation and pathway mapping in KEGG. In ‘Comparative Genomics2.
Bergman N.H.: Humana Press; Methods Mol. Biol. 396. pp. 71–92.
2007, View Article : Google Scholar
|
|
22
|
Huang DW, Sherman BT, Tan Q, Collins JR,
Alvord WG, Roayaei J, Stephens R, Baseler MW, Lane HC and Lempicki
RA: The DAVID Gene Functional Classification Tool: A novel
biological module-centric algorithm to functionally analyze large
gene lists. Genome Biol. 8:R1832007. View Article : Google Scholar : PubMed/NCBI
|
|
23
|
Vigneron A, Gao LX, Golin MJ, Italiano GF
and Li B: An algorithm for finding a k-median in a directed tree.
Information Processing Lett. 74:81–88. 2000. View Article : Google Scholar
|
|
24
|
Shannon P, Markiel A, Ozier O, Baliga NS,
Wang JT, Ramage D, Amin N, Schwikowski B and Ideker T: Cytoscape: A
software environment for integrated models of biomolecular
interaction networks. Genome Res. 13:2498–2504. 2003. View Article : Google Scholar : PubMed/NCBI
|
|
25
|
Parsons JT, Martin KH, Slack JK, Taylor JM
and Weed SA: Focal adhesion kinase: A regulator of focal adhesion
dynamics and cell movement. Oncogene. 19:5606–5613. 2000.
View Article : Google Scholar : PubMed/NCBI
|
|
26
|
Sieg DJ, Hauck CR and Schlaepfer DD:
Required role of focal adhesion kinase (FAK) for
integrin-stimulated cell migration. J Cell Sci. 112:2677–2691.
1999.PubMed/NCBI
|
|
27
|
Xu YF, Li YQ, Guo R, He QM, Ren XY, Tang
XR, Jia WH, Kang TB, Zeng MS, Sun Y, et al: Identification of
miR-143 as a tumour suppressor in nasopharyngeal carcinoma based on
microRNA expression profiling. Int J Biochem Cell Biol. 61:120–128.
2015. View Article : Google Scholar : PubMed/NCBI
|
|
28
|
Ou J, Pan F, Geng P, Wei X, Xie G, Deng J,
Pang X and Liang H: Silencing fibronectin extra domain a enhances
radiosensitivity in nasopharyngeal carcinomas involving an
FAK/Akt/JNK Pathway. Int J Radiat Oncol Biol Phys. 82:e685–e691.
2012. View Article : Google Scholar : PubMed/NCBI
|
|
29
|
Kassis J, Maeda A, Teramoto N, Takada K,
Wu C, Klein G and Wells A: EBV-expressing AGS gastric carcinoma
cell sublines present increased motility and invasiveness. Int J
Cancer. 99:644–651. 2002. View Article : Google Scholar : PubMed/NCBI
|
|
30
|
Adhikary S and Eilers M: Transcriptional
regulation and transformation by Myc proteins. Nat Rev Mol Cell
Biol. 6:635–645. 2005. View Article : Google Scholar : PubMed/NCBI
|
|
31
|
Nagesh N, Raju G, Srinivas R, Ramesh P,
Reddy MD and Reddy ChR: A dihydroindolizino indole derivative
selectively stabilizes G-quadruplex DNA and down-regulates c-MYC
expression in human cancer cells. Biochim Biophys Acta.
1850:129–140. 2015. View Article : Google Scholar : PubMed/NCBI
|
|
32
|
Škunca Ž, Domimis M, Plninc-Peraica A and
Jakšić B: Clinical features in DLBCL and translocation BCL2/c-MYC
‘double hit’ lymphoma. Acta Medica Croatica. 68:299–305. 2015.(In
Croatian).
|
|
33
|
Yu X, Zhen Y, Yang H, Wang H, Zhou Y, Wang
E, Marincola FM, Mai C, Chen Y, Wei H, et al: Loss of connective
tissue growth factor as an unfavorable prognosis factor activates
miR-18b by PI3K/AKT/C-Jun and C-Myc and promotes cell growth in
nasopharyngeal carcinoma. Cell Death Dis. 4:e6342013. View Article : Google Scholar : PubMed/NCBI
|
|
34
|
Zhou W, Feng X, Ren C, Jiang X, Liu W,
Huang W, Liu Z, Li Z, Zeng L, Wang L, et al: Over-expression of
BCAT1, a c-Myc target gene, induces cell proliferation, migration
and invasion in nasopharyngeal carcinoma. Mol Cancer. 12:532013.
View Article : Google Scholar : PubMed/NCBI
|
|
35
|
Bartel DP: MicroRNAs: Target recognition
and regulatory functions. Cell. 136:215–233. 2009. View Article : Google Scholar : PubMed/NCBI
|
|
36
|
Chang TC, Yu D, Lee YS, Wentzel EA, Arking
DE, West KM, Dang CV, Thomas-Tikhonenko A and Mendell JT:
Widespread microRNA repression by Myc contributes to tumorigenesis.
Nat Genet. 40:43–50. 2008. View Article : Google Scholar : PubMed/NCBI
|
|
37
|
Dews M, Homayouni A, Yu D, Murphy D,
Sevignani C, Wentzel E, Furth EE, Lee WM, Enders GH, Mendell JT and
Thomas-Tikhonenko A: Augmentation of tumor angiogenesis by a
Myc-activated microRNA cluster. Nat Genet. 38:1060–1065. 2006.
View Article : Google Scholar : PubMed/NCBI
|
|
38
|
Fontana L, Fiori ME, Albini S, Cifaldi L,
Giovinazzi S, Forloni M, Boldrini R, Donfrancesco A, Federici V,
Giacomini P, et al: Antagomir-17-5p abolishes the growth of
therapy-resistant neuroblastoma through p21 and BIM. PLoS One.
3:e22362008. View Article : Google Scholar : PubMed/NCBI
|
|
39
|
O'Donnell KA, Wentzel EA, Zeller KI, Dang
CV and Mendell JT: c-Myc-regulated microRNAs modulate E2F1
expression. Nature. 435:839–843. 2005. View Article : Google Scholar : PubMed/NCBI
|
|
40
|
Stiuso P, Potenza N, Lombardi A,
Ferrandino I, Monaco A, Zappavigna S, Vanacore D, Mosca N,
Castiello F, Porto S, et al: MicroRNA-423-5p promotes autophagy in
cancer cells and is increased in serum from hepatocarcinoma
patients treated with sorafenib. Mol Ther Nucleic Acids.
4:e2332015. View Article : Google Scholar : PubMed/NCBI
|
|
41
|
McDermott AM, Miller N, Wall D, Martyn LM,
Ball G, Sweeney KJ and Kerin MJ: Identification and validation of
oncologic miRNA biomarkers for luminal a-like breast Cancer. PLoS
One. 9:e870322014. View Article : Google Scholar : PubMed/NCBI
|
|
42
|
Hatse S, Brouwers B, Dalmasso B, Laenen A,
Kenis C, Schöffski P and Wildiers H: Circulating MicroRNAs as
easy-to-measure aging biomarkers in older breast cancer patients:
Correlation with chronological age but not with fitness/frailty
status. PLoS One. 9:e1106442014. View Article : Google Scholar : PubMed/NCBI
|