Introduction
Glaucoma is a neurodegenerative ocular disease,
which is recognized worldwide as the key causal factor in
irreversible blindness (1). The
predominant form of glaucoma is primary open-angle glaucoma (POAG).
There are multiple genetic factors, which are significant in the
etiology of glaucoma. There are >20 genetic loci associated with
POAG, however, only a few of these have been identified, including
myocilin, WD-repeat domain 36, optineurin (OPTN), and TANK-binding
kinase-1 (2,3). The OPTN gene mutations, which encode
amino acid substitutions including R545Q, E50K and H486R, have been
linked to POAG and normal-tension glaucoma (NTG) (4–7). In
a previous study, it was shown that, in transgenic mice models, the
OPTN (E50K) mutation was the key element leading to the apoptosis
of retinal ganglion cells, however, the specific mechanism remains
to be fully elucidated (8).
Long noncoding RNAs (lncRNAs) are defined as
structurally resembling mRNAs and transcribing >200 nucleotides,
but not encoding proteins. These lncRNAs have been considered to be
transcriptional noise; however, increasing evidence suggests that
lncRNAs are important regulators governing various biological
processes (BPs), including genomic imprinting, transcription
activation and inhibition, chromatin modification, and tissue
development (9). POAG is a
complicated pathological process, which mediates the gene
regulatory network. The latent function of lncRNAs in the retina of
OPTN (E50K) transgenic mice remains to be elucidated. The present
study analyzed the expression profile of differentially expressed
lncRNAs in OPTN (E50K) transgenic and wild-type mice. It was found
that eight lncRNAs were annotated in the GO BPs, and two of these
eight lncRNAs, ASMM10P055228 and ASMM10P040128, were annotated with
negative regulation of oxidative stress-induced cell death and
regulation of execution phase of apoptosis, which may be the
underlying mechanism for POAG.
Materials and methods
Animals and sample collection
All animal experiments were performed according to
the guidelines of the National Institutes of Health and Regulations
on the Care and Use of Laboratory Animals (National Institutes of
Health, Bethesda, MA, USA). The retinas from 8-month-old transgenic
and wild-type mice were collected. The retinas from six transgenic
and wild-type mice were divided into three groups (E1, E2 and E3)
and (W1, W2 and W3), respectively and were analyzed independently
for the expression of lncRNAs.
RNA extraction
Total RNA from each sample was extracted using
TRIzol reagent, and quantified using a NanoDrop ND-1000
spectrophotometer; and RNA integrity was evaluated using standard
denaturing agarose gel electrophoresis.
Microarray analysis
The expression profiles of the genome-wide mRNA and
lncRNAs of the mice were examined using Arraystar mouse lncRNA
microarray version 3.0, designed for the profiling of mouse
genome-wide lncRNAs and protein-coding transcripts, performed by
KangChen Biotech Co., Ltd. (Shanghai, China). This microarray
contains 35,923 lncRNAs collected from the National Center for
Biotechnology Information Refseq, UCSC, Ensembl, RNAdb 2.0,
Fantom3, ncRNA expression databases, and from previous literature.
A total of 24,881 coding transcripts were extracted based on the
Collaborative Consensus Coding Sequence (CCDS) public source.
The microarrays were performed using an Agilent
scanner (G2505C; Agilent DNA microarray scanner; Agilent
Technologies, Inc., Santa Clara, CA, USA) and the captured array
images were analyzed using Agilent feature extraction software
(version 11.0.1.1; Agilent Technologies, Inc.). The GeneSpring GX
v12.1 software package (Agilent Technologies, Inc.) was used to
perform quantile normalization and subsequent data processing.
Following normalization, mRNAs and lncRNAs, in which at least three
of the six samples contained flags in present or marginal (‘All
Targets Value’) were selected for subsequent data analysis.
Gene ontology (GO) and pathway
enrichment analysis
GO analysis bonding was used to associate the
differentially expressed mRNAs with GO function terms. The
threshold for significant GO terms was P=0.05. The mRNAs were
considered to have a higher level of association with the GO term
if its P-value was lower. The enrichment pathways of the
differentially expressed mRNA were identified using the Kyoto
Encyclopedia of Genes and Genomes (KEGG) database with Fisher
P<0.05. The GO and KEGG enrichment analyses were performed using
the Database for Annotation, Visualization and Integrated Discovery
(DAVID; https://david.ncifcrf.gov/).
Establishment of the lncRNA and mRNA co-expression
network. The lncRNA-mRNA co-expression pairs were based on the
normalized signal intensity of microarray data for the mutant and
wild-groups. Pearson's correlation coefficients (PCCs) were used to
calculate the correlation between lncRNA and mRNA pairs for all
combinations among all the differentially expressed lncRNAs and
mRNAs. The pairs with PCC values ≥0.95 or ≤-0.95 and with P<0.01
were selected as linkages in the network, and were considered to be
significantly correlated pairs. The lncRNA and mRNA co-expression
network was constructed using Cytoscape software version 3.3.0
(http://www.cytoscape.org/) (10).
GO BP prediction of the differentially
expressed lncRNAs
The GO BPs of the differentially expressed lncRNAs
were predicted using a computational method, gene set enrichment
analysis (GSEA) (11). This method
interprets gene expression data by focusing on gene sets, which
share common biological function, chromosomal location or
regulation. The expression level of each differentially expressed
lncRNA was considered as a profile and correlated with all
protein-coding genes of the microarray by computing the PCCs. For
each lncRNA, a list of correlation-based ranked protein-coding
genes was constructed. In the present study, GSEA was based on the
mice GO BP-relevant gene sets. These gene sets were obtained from
enrichment mapping (mice_GO_bp_with_GO_iea_entrezgene.gmt;
http://baderlab.org/GeneSets, Accessed
February 24, 2015), which covers 13,190 GO BP terms, with
corresponding genes representing the gene set for each GO term.
This ranked list was used to calculate an enrichment score, which
is a running sum beginning from the highest correlating gene, and
the significant gene sets were identified using the weighted
Kolmogorov-Smirnov test. To obtain the false discovery rate
P-values, the gene sets were permuted 1,000 times to obtain 1,000
random gene sets. Any gene set of GO BP terms with a family-wise
error rate P<0.05 was determined to be significantly associated
with the corresponding lncRNA, and the GO BP was considered to be a
predicted BP of that particular lncRNA.
Statistical analysis
The expression levels of lncRNA and mRNA between the
mutant and wild-groups were compared using a two-tailed t-test.
Differentially expressed lncRNAs and mRNAs with statistical
significance between the two groups were defined as the genes with
absolute fold change ≥1.5 and P<0.05. Hierarchical clustering
was performed using R software version 3.1.3 (www.r-project.org).
Results
Overview of lncRNA and mRNA
profiles
The microarray evaluated in the present study
contained 35,923 lncRNA probes collected from updated databases and
literature, and 24,881 mRNA probes based on the public source,
CCDS. The expression profiles of the lncRNA and mRNA are shown in
Table I. Only 0.74% of the
expressed lncRNAs (69/9,386) were significantly differentially
expressed, whereas 0.57% of the expressed mRNAs (40/7,051) were
significantly differentially expressed in the two groups (Table I).
 | Table I.Summary of results of lncRNA and mRNA
profile analysis. |
Table I.
Summary of results of lncRNA and mRNA
profile analysis.
| Probe class | Total | Expression above
background n (%) | Differentially
expressed n (%) |
|---|
| lncRNAs | 35,923 | 9,386
(26.13) | 69
(0.74) |
| mRNAs | 24,881 | 7,051
(28.34) | 40
(0.57) |
| Combined | 60,804 | 16,437 (27.03) | 109 (0.66) |
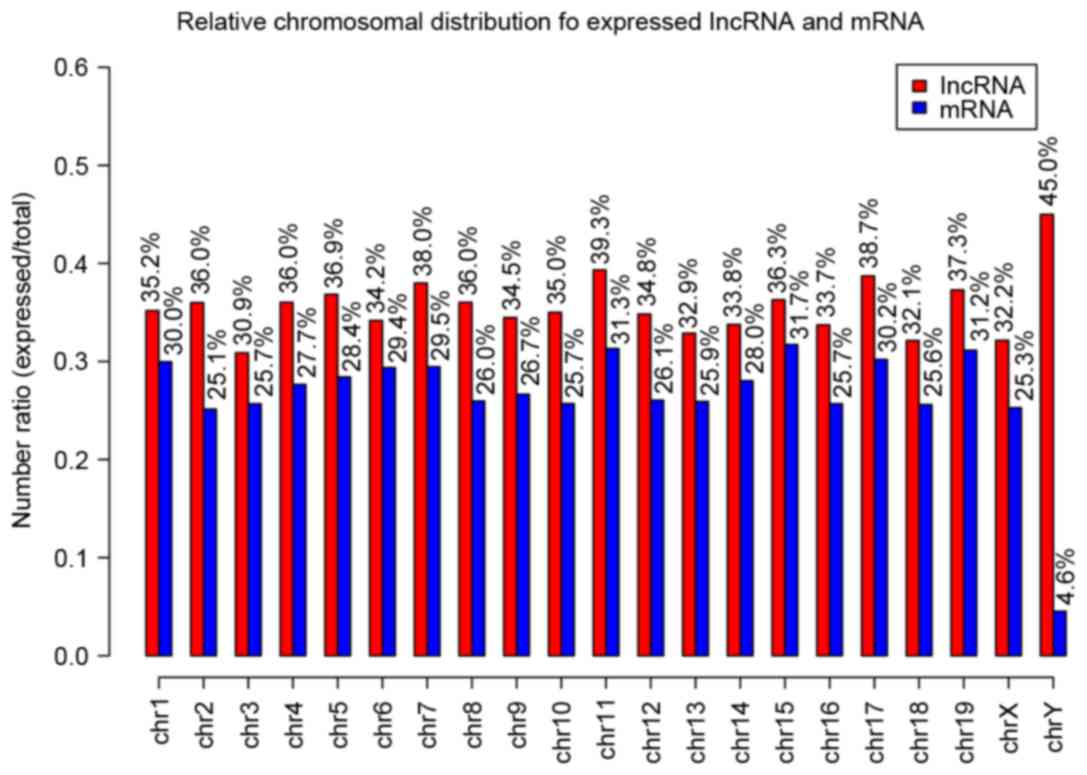
As shown in Fig. 1,
the distribution of the expressed probes in all the chromosomes of
the lncRNAs and mRNAs were determined. For the chromosome
distribution of mRNA, the ratio of the expressed probes/total
probes of each chromosome was similar with a range of 20–30%, with
the exception of the Y chromosome ratio of only 4.6%. The
chromosome distribution of the lncRNA profile was similar, with a
range of 30–40%.
Differentially expressed lncRNAs in
mutant and wild-type mice
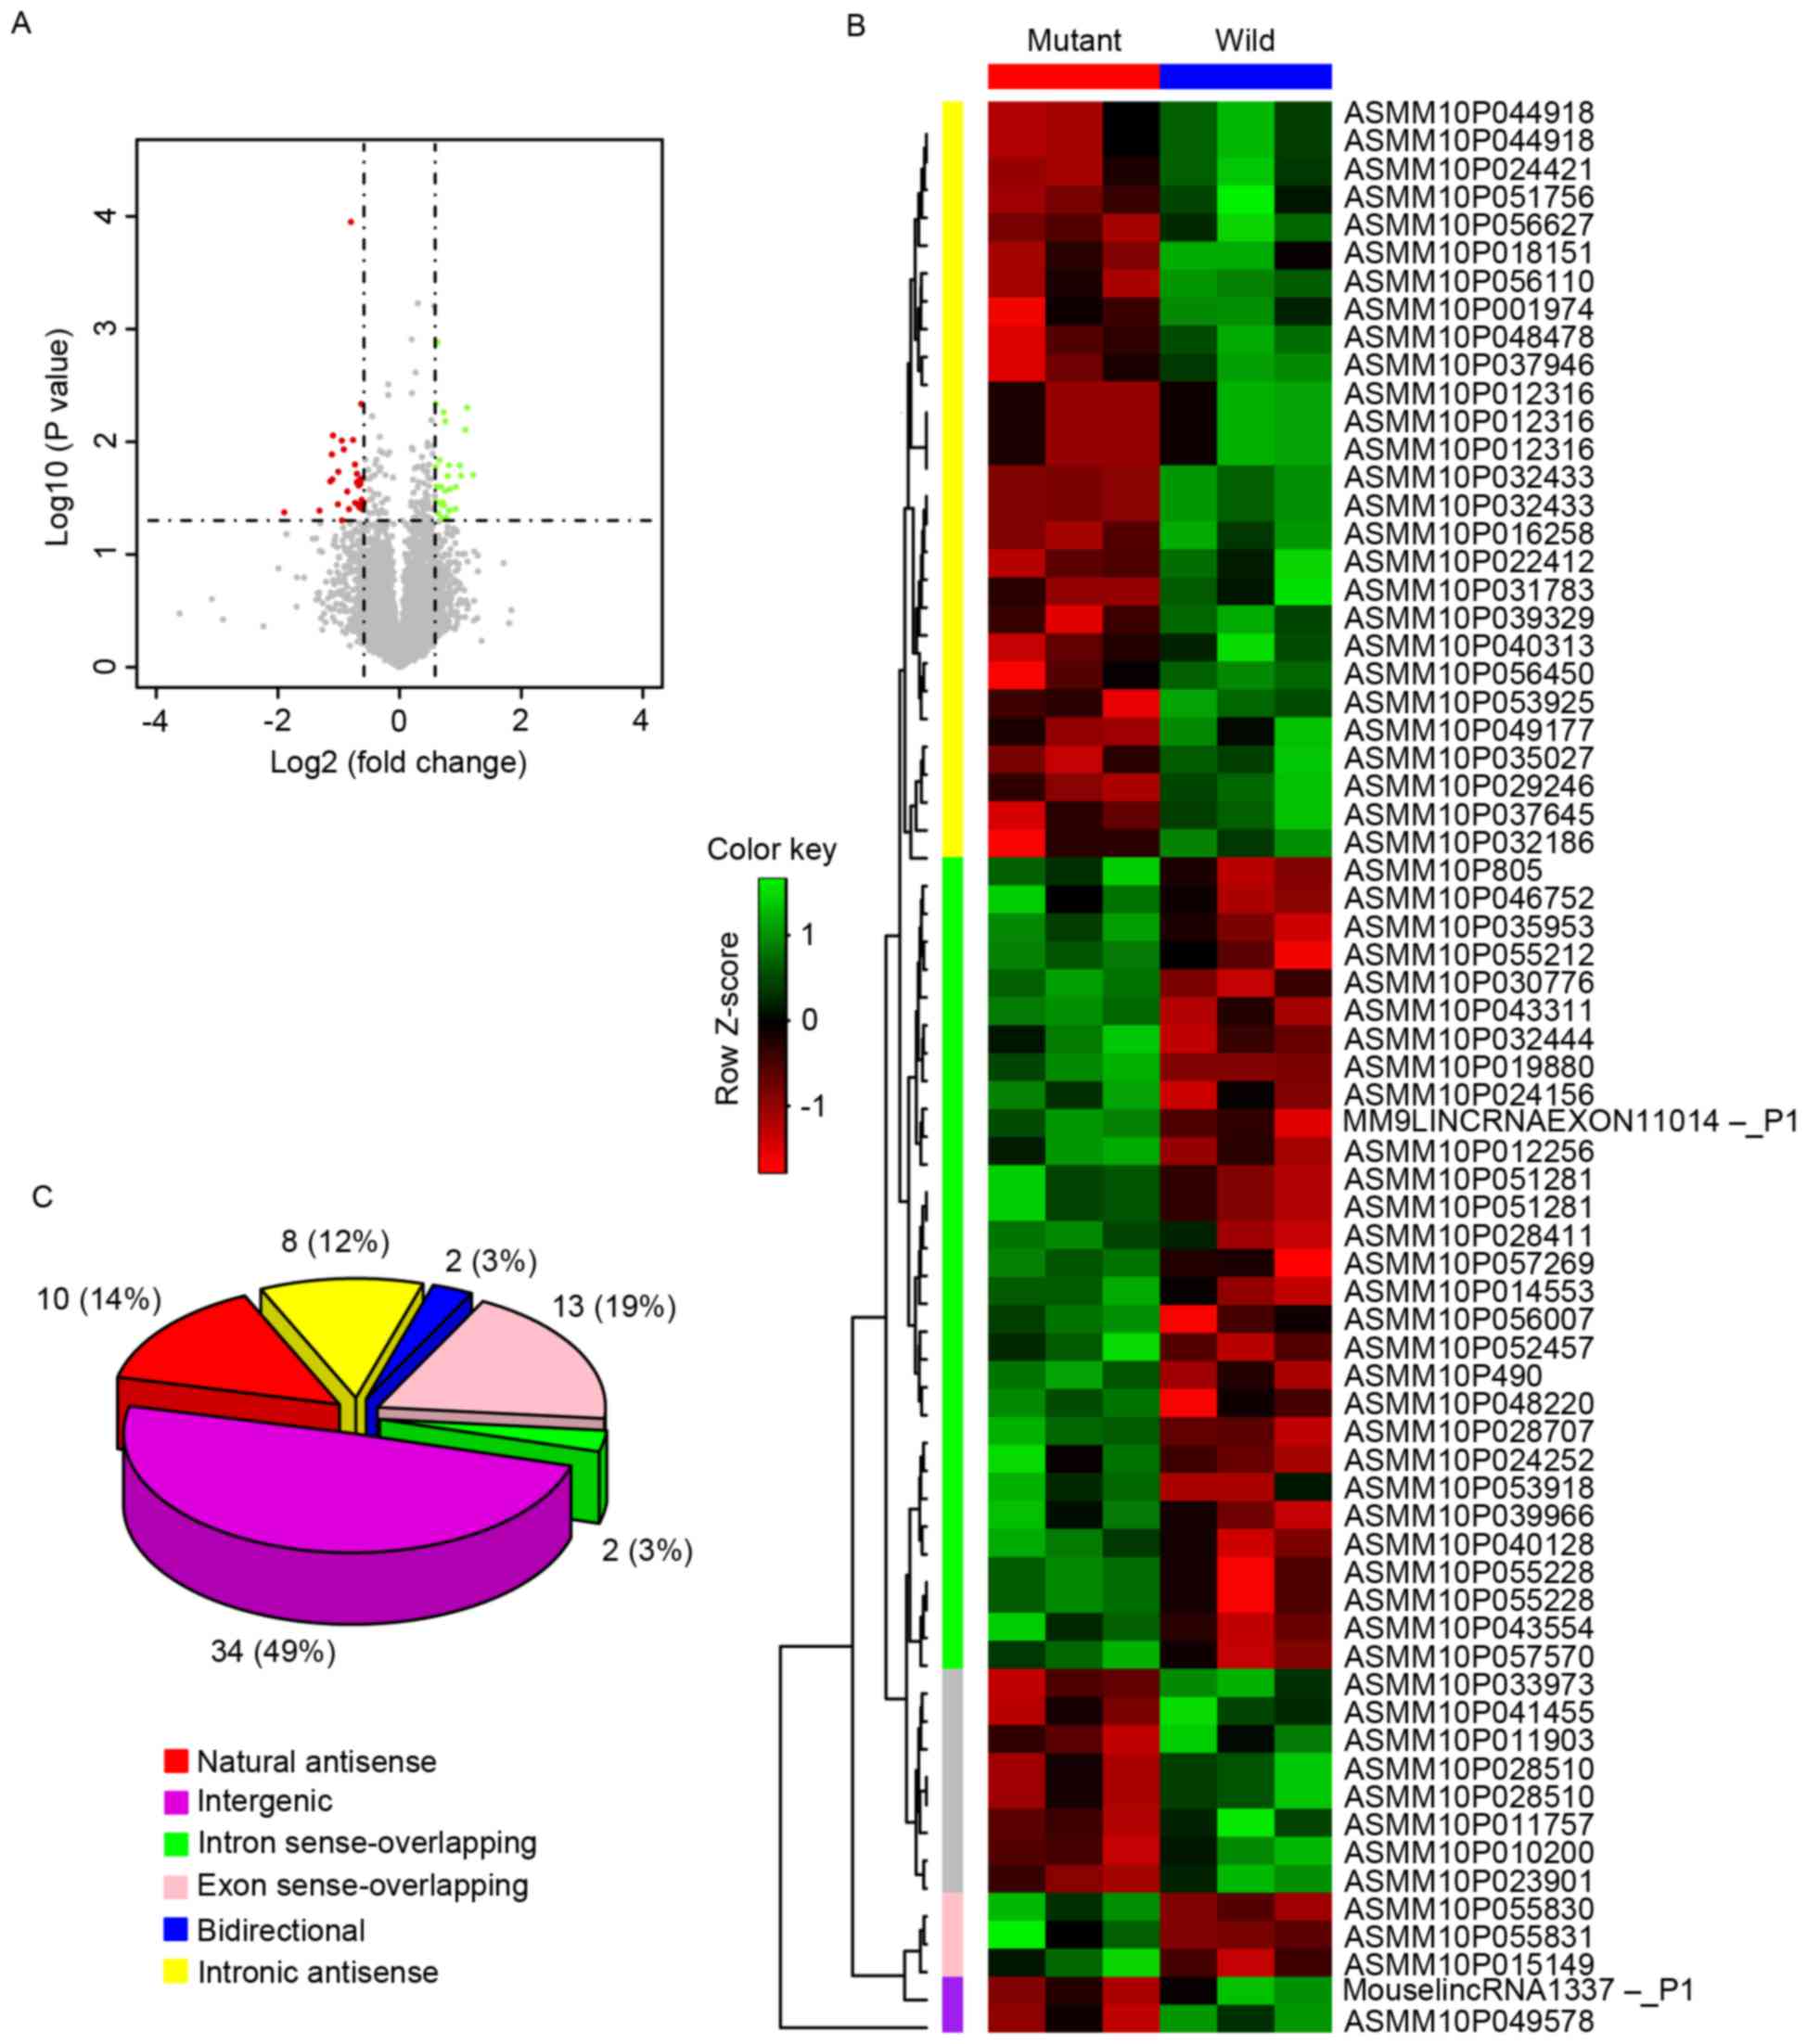
According to the lncRNA expression profiles, among
the 9,386 probes with expression signals above that of background
noise, only 69 lncRNAs were differentially expressed (absolute fold
change >1.5 and P<0.05) between the mutant and wild-mice
(Fig. 2A). Among the 69
differentially expressed lncRNAs, 37 lncRNAs were identified as
being downregulated and 32 lncRNAs were upregulated with
statistical significance in the mutant mice. The unsupervised
hierarchical clustering of the 69 differentially expressed lncRNAs
for the mutant and wild-types showed that the expression values of
each lncRNA in the three samples of the same group were similar,
whereas the expression values of each lncRNA in the six samples of
the two groups were different (Fig.
2B). The 69 differentially expressed lncRNAs in the two sets of
mice samples contained 10 natural antisense (five upregulated and
five downregulated), 34 intergenic (17 upregulated and 17
downregulated), eight intronic antisense (four upregulated and four
downregulated), two introns (upregulated), 13 exon
sense-overlapping (two upregulated and 11 downregulated) and two
bidirectional sequences (upregulated), as shown in Fig. 2C.
Differentially expressed mRNAs in
mutant and wild-type mice
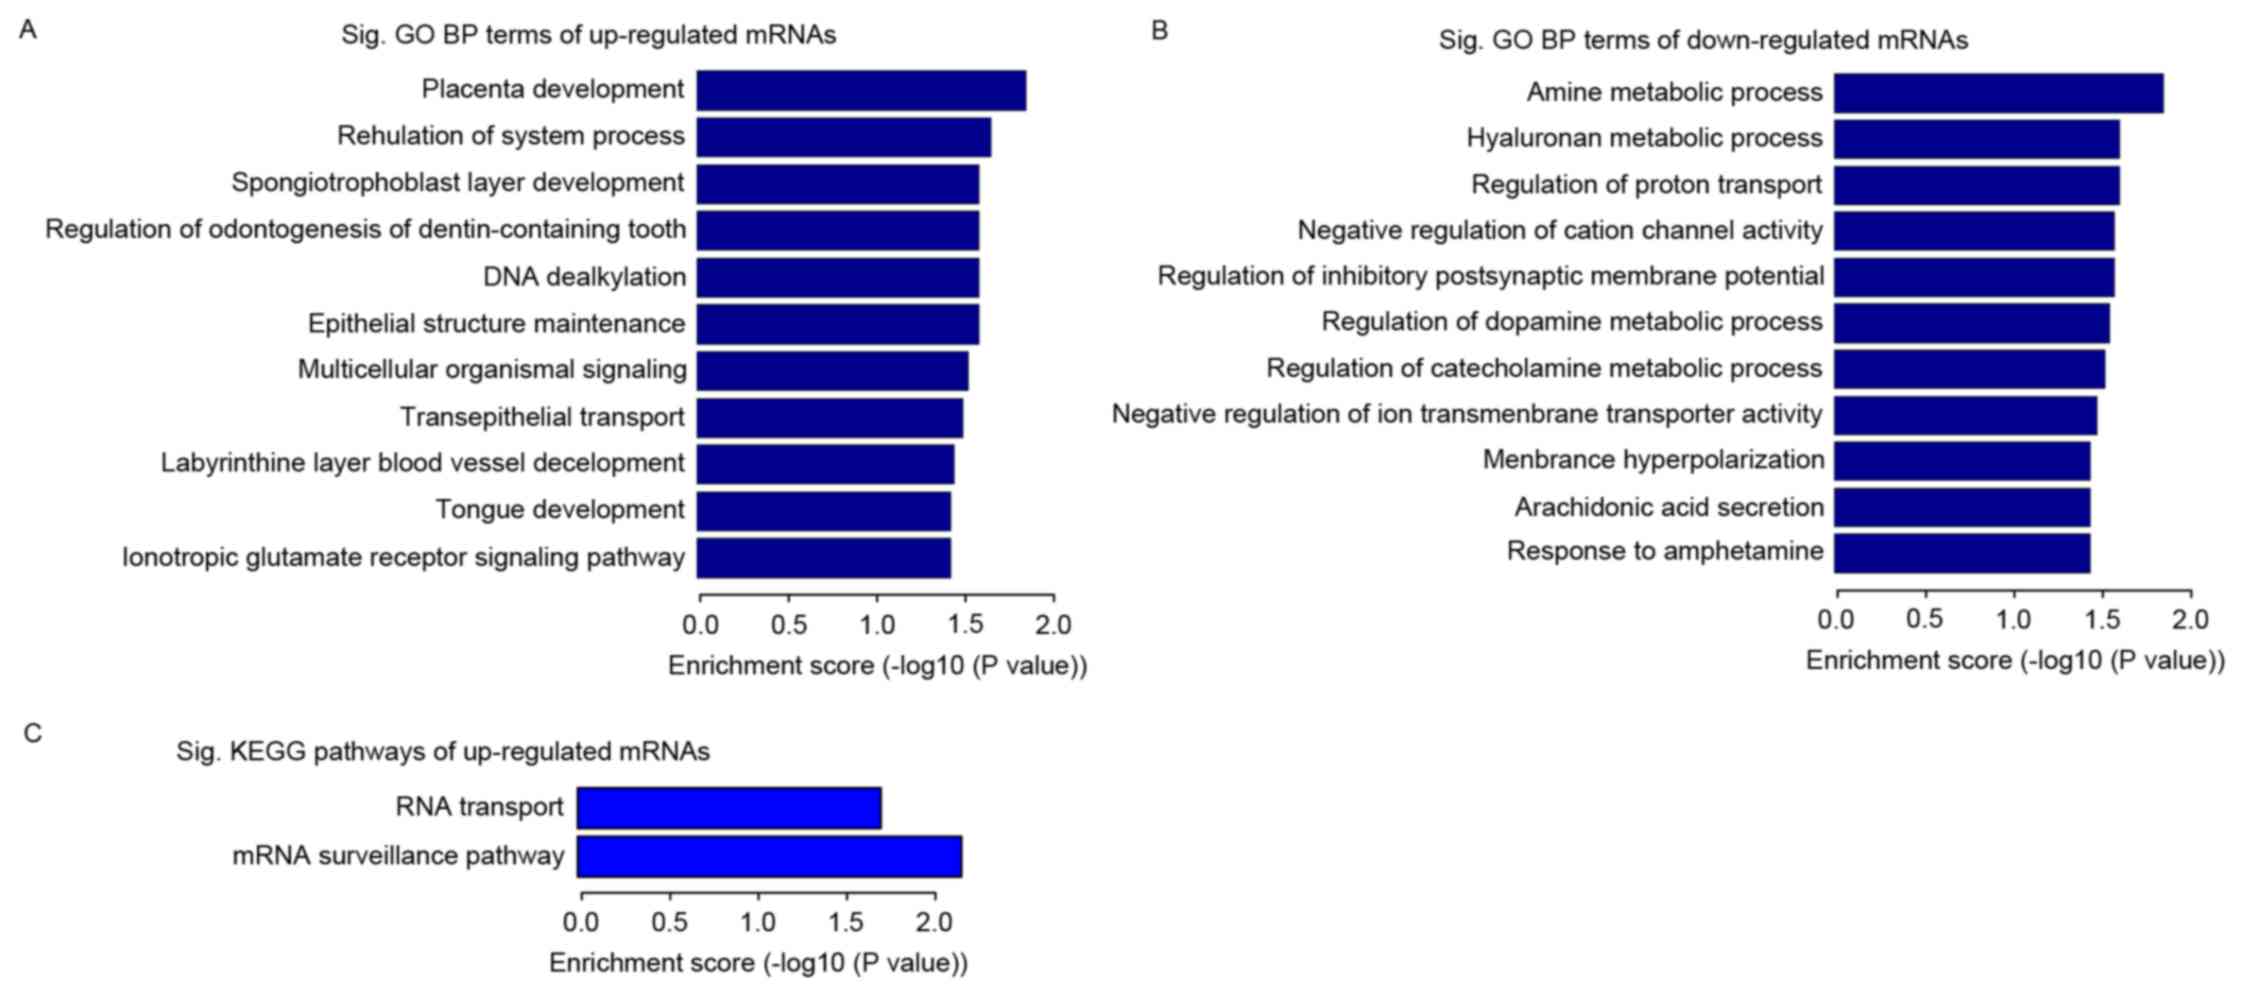
Among the differentially expressed mRNAs, the number
of the upregulated mRNAs (25/40) was almost twice that of the
downregulated mRNAs (15/40). The upregulated mRNAs were enriched in
several GO terms with statistical significance, with the two most
prominent BP terms being placenta development and regulation of
system process (Fig. 3A). The
downregulated mRNAs were also enriched in several GO terms,
including the amine metabolic and glycosaminoglycan biosynthetic
processes in BP (Fig. 3B). The
analysis performed by mapping genes of the KEGG pathway showed that
the upregulated mRNAs were enriched in two KEGG pathways, mRNA
surveillance pathways and RNA transport (Fig. 3C), whereas no enriched KEGG
pathways were identified for the downregulated mRNAs. These two
KEGG pathways contained the two upregulated mRNAs, apoptotic
chromatin condensation inducer 1 and nuclear RNA export factor
7.
Determination of the lncRNA and mRNA
coexpression network
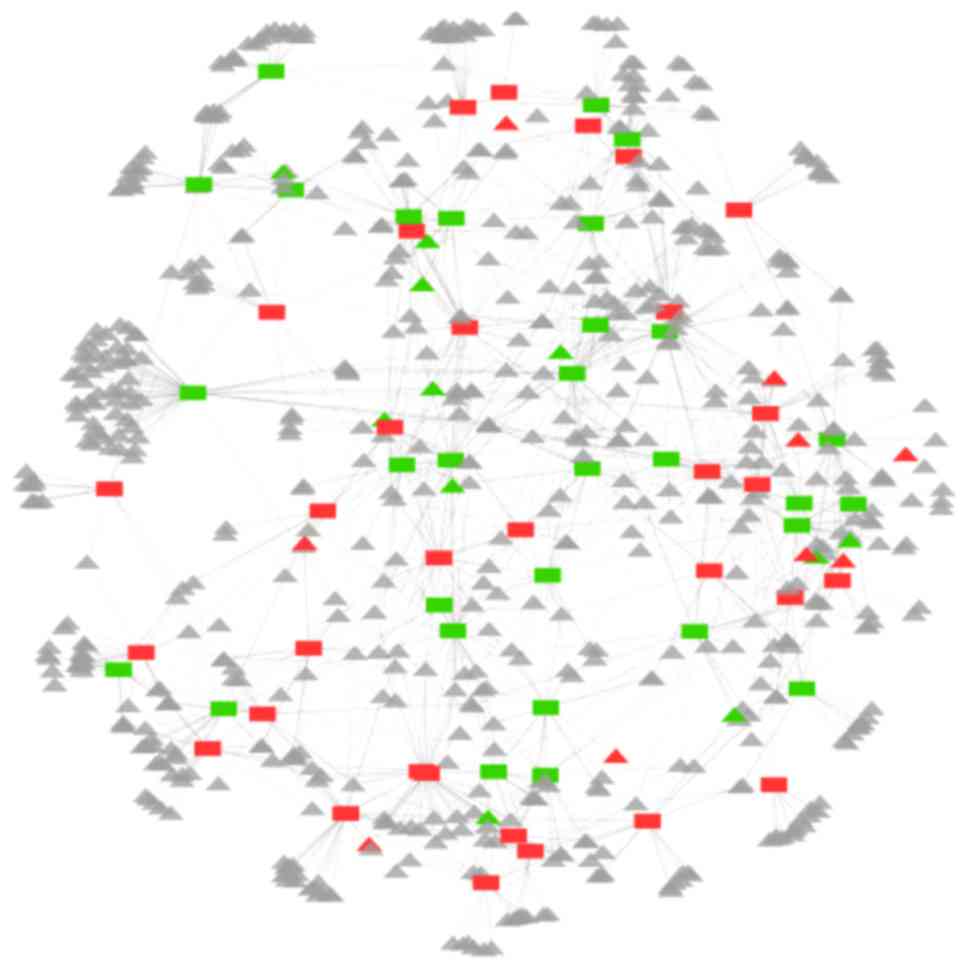
Coexpression network analysis was performed between
the lncRNAs and mRNAs (Fig. 4).
The correlation between the 69 differentially expressed lncRNAs and
all mRNAs were determined, which revealed 1,670 connections above
the threshold, including the lncRNA-lncRNA and lncRNA-mRNA pairs.
The network contained 719 nodes with 62 differentially expressed
lncRNAs, comprising 32 downregulated and 30 upregulated lncRNAs,
and 656 mRNAs involved in the coexpression network. For the 656
mRNAs in the network, there were nine downregulated mRNAs (Bcdin3d,
creatine kinase muscle, dopamine receptor D4, enamelin, flavin
containing monooxygenase 9, hyaluronan synthase 1, ring finger
protein 128, spindlin family member 4 and WAS/WASL-interacting
protein family member 2) and 11 upregulated mRNAs (4933411K20Rik,
butyrylcholinesterase, F-Box and WD repeat domain containing 8,
killer cell lectin-like receptor subfamily A, leucine zipper and
EF-hand containing transmembrane protein 2, mohawk homeobox, Nxf7,
olfactory receptor 1138, PHD finger protein 7, Svop-like and zinc
finger protein 451) among the 40 differentially expressed mRNAs in
the microarray. These deregulated mRNAs were connected with 38
differentially expressed lncRNAs.
Prediction of differentially expressed
lncRNA functions through the associated mRNA
The analysis of the 69 differentially expressed
lncRNAs revealed a set of eight lncRNAs associated with distinct
and diverse GO BP terms with statistical significance
(ASMM10P055228, ASMM10P040128, ASMM10P056450, ASMM10P040313,
ASMM10P044918, ASMM10P039329, ASMM10P024421 and ASMM10P037946). The
set of annotated lncRNAs contained six downregulated and two
upregulated lncRNAs (Table
II).
| Table II.GO biological process prediction of
the differentially expressed long non-coding RNAs by gene set
enrichment analysis. |
Table II.
GO biological process prediction of
the differentially expressed long non-coding RNAs by gene set
enrichment analysis.
| Probe ID | GO name | GO ID | Enrichment
direction | NES | FWER P-value |
|---|
| ASMM10P055228 | NEGATIVE REGULATION
OF OXIDATIVE | GO:1903202 | Negative | −2.019 | 0.017 |
|
| STRESS-INDUCED CELL
DEATH |
|
|
|
|
| ASMM10P040128 | REGULATION OF
EXECUTION | GO:1900117 | Negative | −1.988 | 0.031 |
|
| PHASE OF
APOPTOSIS |
|
|
|
|
| ASMM10P056450 | PYRIMIDINE-CONTAINING
COMPOUND | GO:0072528 | Positive | 2.019 | 0.044 |
|
| BIOSYNTHETIC
PROCESS |
|
|
|
|
| ASMM10P056450 | PYRIMIDINE
NUCLEOTIDE | GO:0006221 | Positive | 2.019 | 0.044 |
|
| BIOSYNTHETIC
PROCESS |
|
|
|
|
| ASMM10P040313 | MYELINATION IN
PERIPHERAL | GO:0022011 | Positive | 1.997 | 0.021 |
|
| NERVOUS SYSTEM |
|
|
|
|
| ASMM10P040313 | PERIPHERAL NERVOUS
SYSTEM | GO:0032292 | Positive | 1.997 | 0.021 |
|
| AXON
ENSHEATHMENT |
|
|
|
|
| ASMM10P040313 | REGULATION OF
EXECUTION | GO:1900117 | Positive | 1.983 | 0.032 |
|
| PHASE OF
APOPTOSIS |
|
|
|
|
| ASMM10P044918 | MYELINATION IN
PERIPHERAL | GO:0022011 | Positive | 2.053 | 0.010 |
|
| NERVOUS SYSTEM |
|
|
|
|
| ASMM10P044918 | PERIPHERAL NERVOUS
SYSTEM | GO:0032292 | Positive | 2.053 | 0.010 |
|
| AXON
ENSHEATHMENT |
|
|
|
|
| ASMM10P039329 | PROTEIN
AUTOUBIQUITINATION | GO:0051865 | Positive | 2.033 | 0.022 |
| ASMM10P039329 | REGULATION OF
DNA-TEMPLATED | GO:0043620 | Positive | 2.029 | 0.022 |
|
| TRANSCRIPTION IN
RESPONSE TO STRESS |
|
|
|
|
| ASMM10P024421 | MYELINATION IN
PERIPHERAL | GO:0022011 | Positive | 2.115 | 0.007 |
|
| NERVOUS SYSTEM |
|
|
|
|
| ASMM10P024421 | PERIPHERAL NERVOUS
SYSTEM | GO:0032292 | Positive | 2.115 | 0.007 |
|
| AXON
ENSHEATHMENT |
|
|
|
|
| ASMM10P037946 | PYRIMIDINE-CONTAINING
COMPOUND | GO:0072528 | Positive | 2.025 | 0.037 |
|
| BIOSYNTHETIC
PROCESS |
|
|
|
|
| ASMM10P037946 | PYRIMIDINE
NUCLEOTIDE | GO:0006221 | Positive | 2.025 | 0.037 |
|
| BIOSYNTHETIC
PROCESS |
|
|
|
|
Discussion
At present, the OPTN (E50K) mutation of is the only
mutation to be identified as one of the origins of NTG pathogenesis
(12). The overexpression of OPTN
(E50K) in transgenic mice provides a model system to investigate
the molecular mechanisms causing POAG (8). The deregulation of lncRNAs has been
associated with the susceptibility to certain human diseases,
including cancer, neurological disease, cardiovascular disease and
glaucoma (13). However, the role
of lncRNAs in OPTN (E50K) transgenic mice has not been
investigated. The results of the present study are the first, to
the best of our knowledge, to reported the expression profile of
lncRNAs in OPTN (E50K) transgenic mice and show that the function
of lncRNAs may be novel biomarkers for POAG.
In comparing the expression profiles of lncRNAs and
mRNAs, the lncRNAs had a smaller percentage of significantly
expressed signals above background expression. However, the number
of differentially expressed lncRNAs was higher, compared with the
number of differentially expressed mRNAs; and it was revealed that
the lncRNAs may perform more important functions in the mutant
mice, compared with mRNAs. It was found that lncRNAs exhibited
increased spatially and temporally-regulated expression patterns,
compared with protein-coding genes.
In terms of the chromosome distribution of the
mRNAs, the ratio of expressed probes/total probes for each
chromosome was similar, with a range of 20–30%, with the exception
of the Y chromosome with a ratio of only 4.6%. The chromosome
distribution of the lncRNA profile was similar with these findings,
with a marginally higher range of 30–40%, with the exception of the
Y chromosome with a higher ratio, compared with that in the mRNA
profile. These results suggested that the lncRNAs of the Y
chromosome may have had a relatively important role in the mutant
mice.
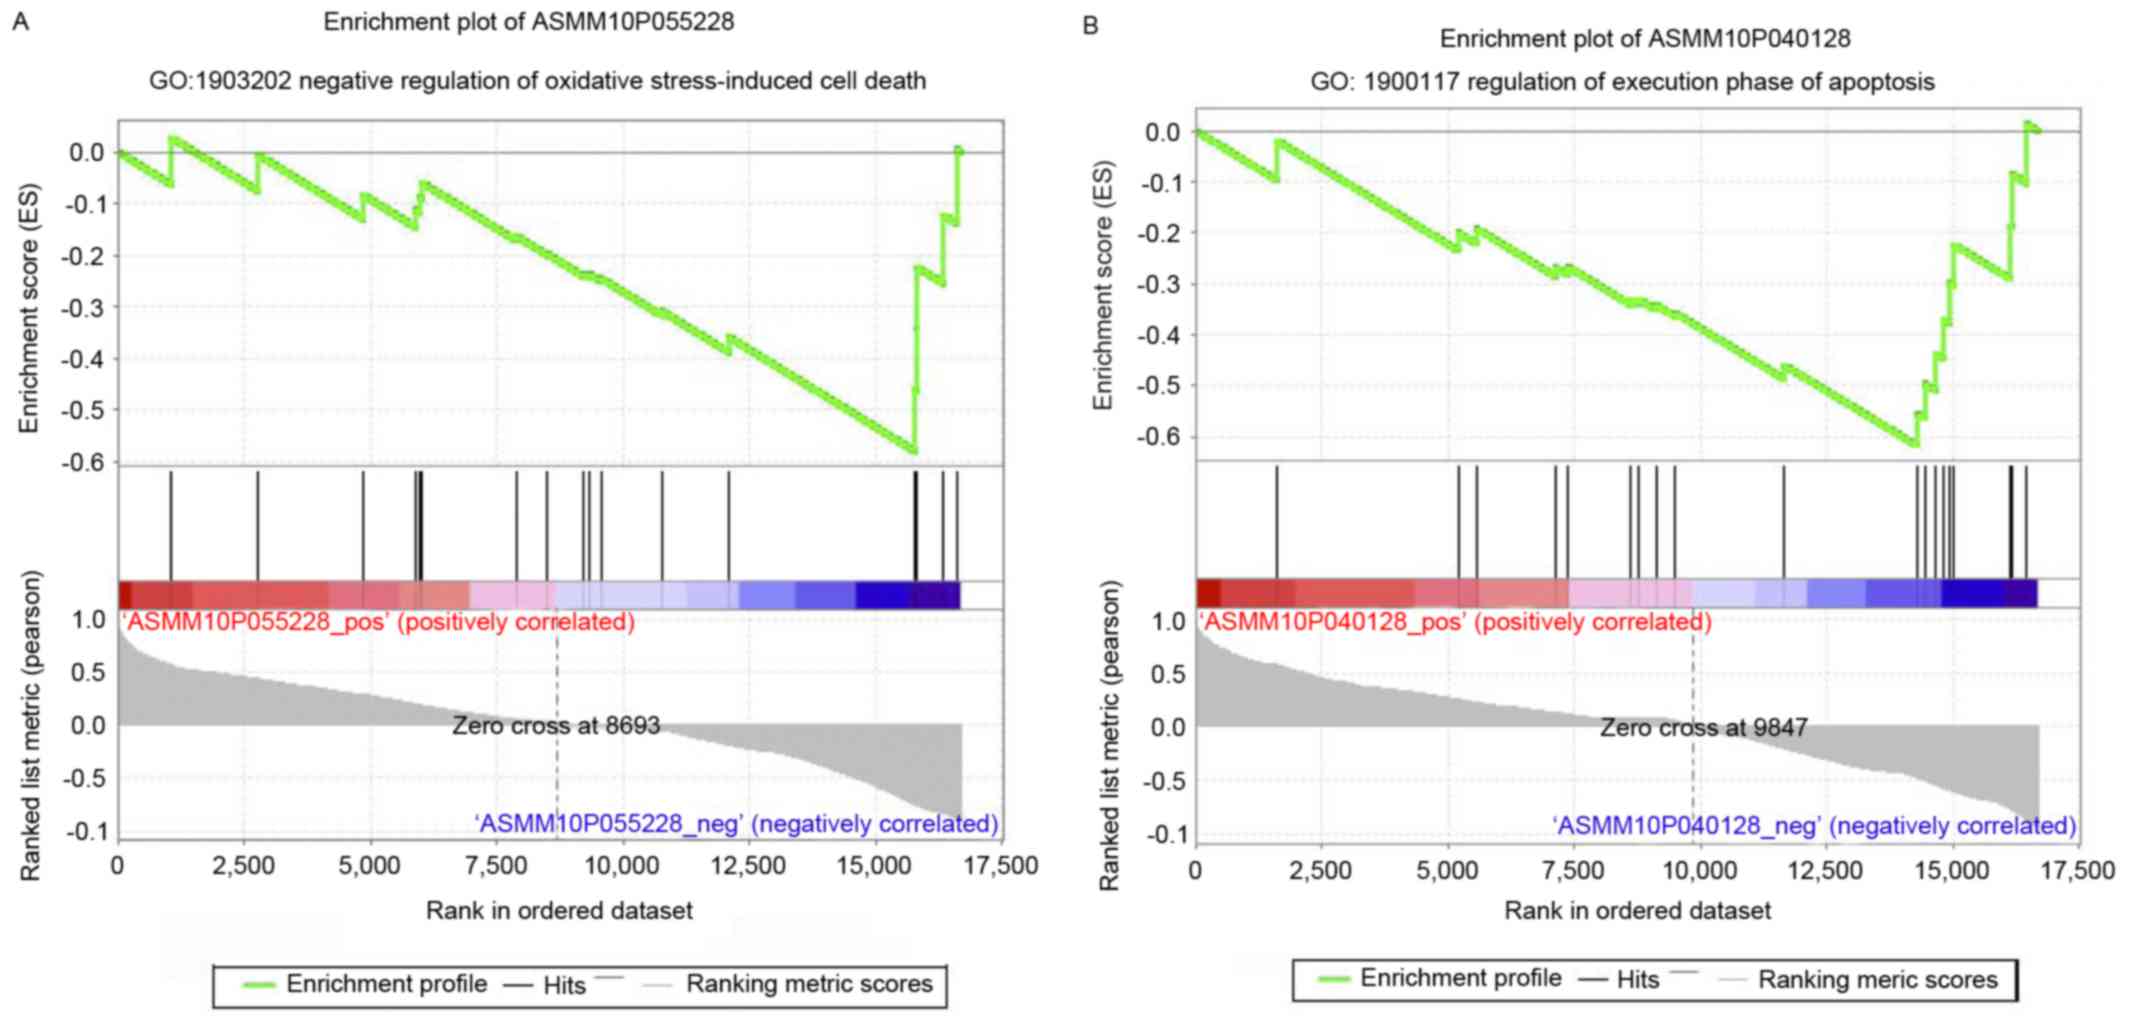
In the present study, prediction of differentially
expressed lncRNA functions among the eight annotated lncRNAs,
revealed two in subset 1 (ASMM10P055228 and ASMM10P040128), which
were annotated with the GO BP, negative regulation of oxidative
stress-induced cell death, and regulation of execution phase of
apoptosis, respectively (Fig. 5A and
B). These two GO terms are associated with cell death or
apoptosis. The other six lncRNAs were included in subset 2, and
were annotated with seven GO BP terms. Among the six lncRNAs in
subset 2, three lncRNAs were annotated with BPs relevant to the
nervous system, corresponding with three GO BP terms. The patterns
may be involved in similar BPs. Therefore, based on the above, the
differentially expressed lncRNAs in the same subset may have the
similar biological functions with similar expression patterns. The
annotation of ASMM10P055228 and ASMM10P040128 with the negative
regulation of oxidative stress-induced cell death and regulation of
execution phase of apoptosis, indicate this may be the mechanism
underlying POAG.
Investigations are ongoing following those of the
present study, and the potential mechanism underlying the
observations remains preliminary. Therefore, future investigations
are required, focusing on the functional evaluations, to further
clarify the pathogenetic molecular pathways, and analyze the effect
of different lncRNAs on POAG. The findings of the present study may
increase knowledge regarding the function of lncRNAs for detecting
the pathogenesis of POAG.
Acknowledgements
The present study was supported by the State Natural
Sciences Foundation (grant nos. 81271000 and 81470634).
References
|
1
|
Quigley HA and Broman AT: The number of
people with glaucoma worldwide in 2010 and 2020. Br J Ophthalmol.
90:262–267. 2006. View Article : Google Scholar : PubMed/NCBI
|
|
2
|
Fingert JH: Primary open-angle glaucoma
genes. Eye (Lond). 25:587–595. 2011. View Article : Google Scholar : PubMed/NCBI
|
|
3
|
Fuse N: Genetic bases for glaucoma. Tohoku
J Exp Med. 221:1–10. 2010. View Article : Google Scholar : PubMed/NCBI
|
|
4
|
Rezaie T, Child A, Hitchings R, Brice G,
Miller L, Coca-Prados M, Héon E, Krupin T, Ritch R, Kreutzer D, et
al: Adult-onset primary open-angle glaucoma caused by mutations in
optineurin. Science. 295:1077–1079. 2002. View Article : Google Scholar : PubMed/NCBI
|
|
5
|
Aung T, Rezaie T, Okada K, Viswanathan AC,
Child AH, Brice G, Bhattacharya SS, Lehmann OJ, Sarfarazi M and
Hitchings RA: Clinical features and course of patients with
glaucoma with the E50K mutation in the optineurin gene. Invest
Ophthalmol Vis Sci:. 46:2816–2822. 2005. View Article : Google Scholar : PubMed/NCBI
|
|
6
|
Leung YF, Fan BJ, Lam DS, Lee WS, Tam PO,
Chua JK, Tham CC, Lai JS, Fan DS and Pang CP: Different optineurin
mutation pattern in primary open-angle glaucoma. Invest Ophthalmol
Vis Sci:. 44:3880–3884. 2003. View Article : Google Scholar : PubMed/NCBI
|
|
7
|
Fuse N, Takahashi K, Akiyama H, Nakazawa
T, Seimiya M, Kuwahara S and Tamai M: Molecular genetic analysis of
optineurin gene for primary open-angle and normal tension glaucoma
in the Japanese population. J Glaucoma. 13:299–303. 2004.
View Article : Google Scholar : PubMed/NCBI
|
|
8
|
Chi ZL, Akahori M, Obazawa M, Minami M,
Noda T, Nakaya N, Tomarev S, Kawase K, Yamamoto T, Noda S, et al:
Overexpression of optineurin E50K disrupts Rab8 interaction and
leads to a progressive retinal degeneration in mice. Hum Mol Genet.
19:2606–2615. 2010. View Article : Google Scholar : PubMed/NCBI
|
|
9
|
Ponting CP, Oliver PL and Reik W:
Evolution and functions of long non-coding RNAs. Cell. 136:629–641.
2009. View Article : Google Scholar : PubMed/NCBI
|
|
10
|
Shannon P, Markiel A, Ozier O, Baliga NS,
Wang JT, Ramage D, Amin N, Schwikowski B and Ideker T: Cytoscape: A
software environment for integrated models of biomolecular
interaction networks. Genome Res. 13:2498–2504. 2003. View Article : Google Scholar : PubMed/NCBI
|
|
11
|
Subramanian A, Tamayo P, Mootha VK,
Mukherjee S, Ebert BL, Gillette MA, Paulovich A, Pomeroy SL, Golub
TR, Lander ES and Mesirov JP: Gene set enrichment analysis: A
knowledge-based approach for interpreting genome-wide expression
profiles. Proc Natl Acad Sci USA. 102:15545–15550. 2005. View Article : Google Scholar : PubMed/NCBI
|
|
12
|
Iwase A, Suzuki Y, Araie M, Yamamoto T,
Abe H, Shirato S, Kuwayama Y, Mishima HK, Shimizu H, Tomita G, et
al: The prevalence of primary open-angle glaucoma in Japanese: The
Tajimi Study. Ophthalmology. 111:1641–1648. 2004. View Article : Google Scholar : PubMed/NCBI
|
|
13
|
Wapinski O and Chang HY: Long noncoding
RNAs and human disease. Trends Cell Biol. 21:354–361. 2011.
View Article : Google Scholar : PubMed/NCBI
|