Introduction
Among all breast cancer types, 15–20% are
pathologically diagnosed as triple negative breast cancer (TNBC). A
typical immunohistochemical feature of TNBC tumors is that they are
negative for the estrogen, progesterone and human epidermal growth
factor 2 receptors (1). TNBC is
highly invasive with common symptoms including breast lumps and
nipple discharge. Epidemiological studies indicate that TNBC
generally develops among pre-menopausal women, and particularly
among young African-American women (2). It has been reported that TNBC is
frequently diagnosed at stage III, and is usually correlated with
increased metastasis, disease recurrence and cancer cell
proliferation and invasion (3). To
date, no specific treatment guidelines have been developed for
TNBC. At present, the common methods for the treatment of breast
cancer include surgery, radiotherapy, chemotherapy and traditional
Chinese medicine. Therefore, patients with TNBC are currently
treated with methods common to all breast cancer types. However,
the rapid development of metastases and high recurrence rates lead
to poor patient prognoses and high mortality rates (4,5).
MicroRNAs (miRNA/miR) are endogenous non-coding
small RNA sequences that are 20–24 nucleotides in length. miRNAs
regulate tumor cell metabolism, proliferation, invasion and
metastasis (3). Each miRNA is able
to regulate multiple target genes, while different miRNAs are able
to regulate the same target gene. It is thought that approximately
one-third of human genes are regulated by miRNAs (6). Previous studies indicate that ~70% of
miRNAs in mammalian cells are located in miRNA transcription units
(7). In addition, the majority of
miRNAs are located in introns, which are highly conserved in
different species (8). The high
conservation of miRNAs among different species suggests common and
important functions. Therefore, investigating the mechanisms and
functions of miRNAs may be useful for the diagnosis and treatment
of human cancers. To date, a number of previous studies have
attempted to elucidate the mechanisms and functions of miRNAs in
the diagnosis and treatment of human cancer; however, only a
limited number have focused on understanding the function of miRNAs
in the pathogenesis of TNBC (9,10).
In addition, the mechanisms and signaling pathways regulated by
miRNAs and their associated target genes require further
investigation. With the development of gene expression microarrays
and bioinformatics analysis technologies, an integrated and
detailed investigation of the aberrant expression of miRNA and mRNA
sequences in patients with TNBC was performed in the current study.
The aim was to identify differentially expressed miRNA and mRNA
sequences in TNBC tissues compared with paired normal adjacent
tissues using published data from the Gene Expression Omnibus
(GEO). In addition, bioinformatics analysis was performed to
investigate the function and signaling pathways of the identified
miRNA and target mRNA sequences.
Materials and methods
Microarray data
Two expression microarrays, which included miRNAs
and mRNAs, were obtained from the GEO database (www.ncbi.nlm.nih.gov/geo). The accession numbers
of these arrays were GSE61723 and GSE61724, which were based on the
GPL16686 [HuGene-2_0-st, Affymetrix Human Gene 2.0 ST Array,
transcript (gene) version] and GPL6244 [HuGene-1_0-st, Affymetrix
Human Gene 1.0 ST Array, transcript (gene) version] platforms,
respectively. The GSE61723 test dataset consisted of 33 TNBC tissue
samples and 17 normal adjacent tissue samples. The GSE61724
validation dataset consisted of 16 TNBC tissue samples and 4 normal
adjacent tissue samples. More detailed information regarding the
tumor samples have been reported in a previous study (11).
Data processing and differential
expression analysis
Series matrix files were employed and analyzed in
the present study. As all microarray data consisted of preprocessed
normalized data, a fold-change of ≥2.0 and a p-value of ≤0.05 were
used as the thresholds for screening differentially-expressed
miRNAs and mRNAs, using R software (version 3.3.2; www.r-project.org) and the edgeR package. Hierarchical
clustering analysis was performed using Multiple Experiment Viewer
software (version, 4.90; www.mev.tm4.org), and the Pearson correlation distance
metric and average linkage method.
Prediction of miRNA target genes
The target genes of differentially expressed miRNAs
were predicted using TargetScan software (version 7.0; www.targetscan.org) (12). In order to reduce the probability
of identifying incorrect target genes, potential target mRNAs were
selected using the intersection set for the differentially
expressed mRNAs identified from the GSE61723 dataset, and the
predicted target genes were identified using TargetScan software.
The intersection set signifies that the genes existed in multiple
data sets. The miRNA-mRNA interaction regulatory network was
constructed using Cytoscape software (version 3.3.0; www.cytoscape.org) (13).
Gene ontology (GO) and Kyoto
Encyclopedia of Genes and Genomes (KEGG) pathway analysis
Enrichment analyses for GO processes and KEGG
signaling pathways were performed using the Database for
Annotation, Visualization, and Integrated Discovery (DAVID; version
6.8) software program (www.david.ncifcrf.gov) (14,15).
Biological processes, cellular components and molecular functions
were the main GO terms used for functional analysis of the
potential targets of miRNAs (16).
GO terms and KEGG pathways were selected using a threshold of
P≤0.05 and a count of ≥2.
Results
Identification of differentially
expressed miRNAs and mRNAs
In order to gain an improved understanding of the
regulatory mechanisms underlying miRNA-mRNA interactions in TNBC,
comprehensive microarray expression profiles were employed to
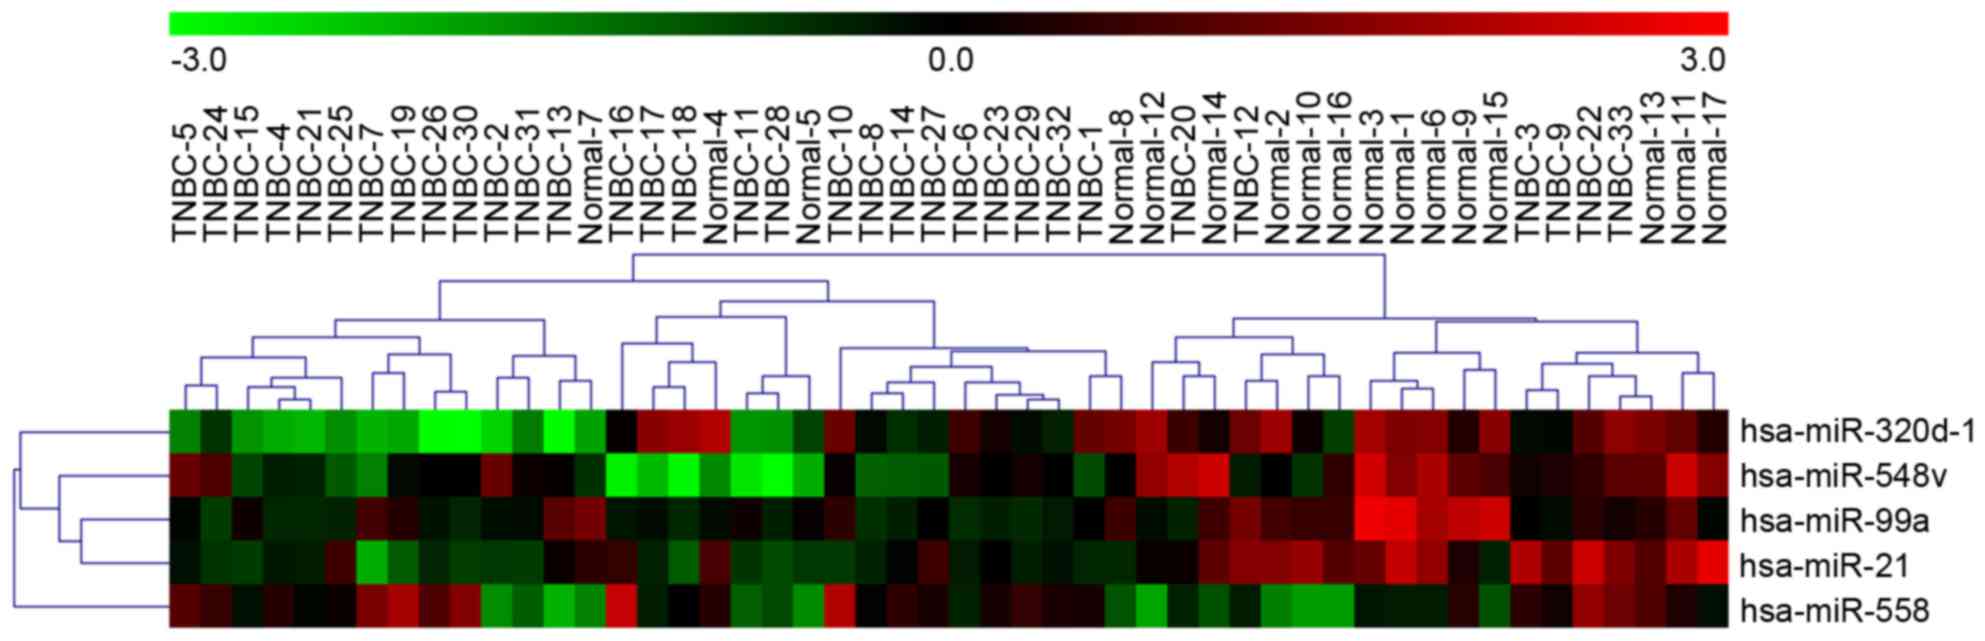
identify differentially expressed miRNAs and mRNAs. By comparing
TNBC tissues with normal adjacent tissues, five miRNAs (upregulated
miR-558 and downregulated miR-320d-1, miR-548v, miR-99a and miR-21
expression) and 97 mRNAs were identified with a threshold of P≤0.05
and a fold-change of ≥2.0 (Tables
I and II). According to the
GenBank database (www.ncbi.nlm.nih.gov/genbank), LOC100507381 was
removed due to inconsistencies with standard genome annotation
processing. In addition, the gene UBE2C was permanently removed
from the NCBI database, as there is not enough evidence to prove
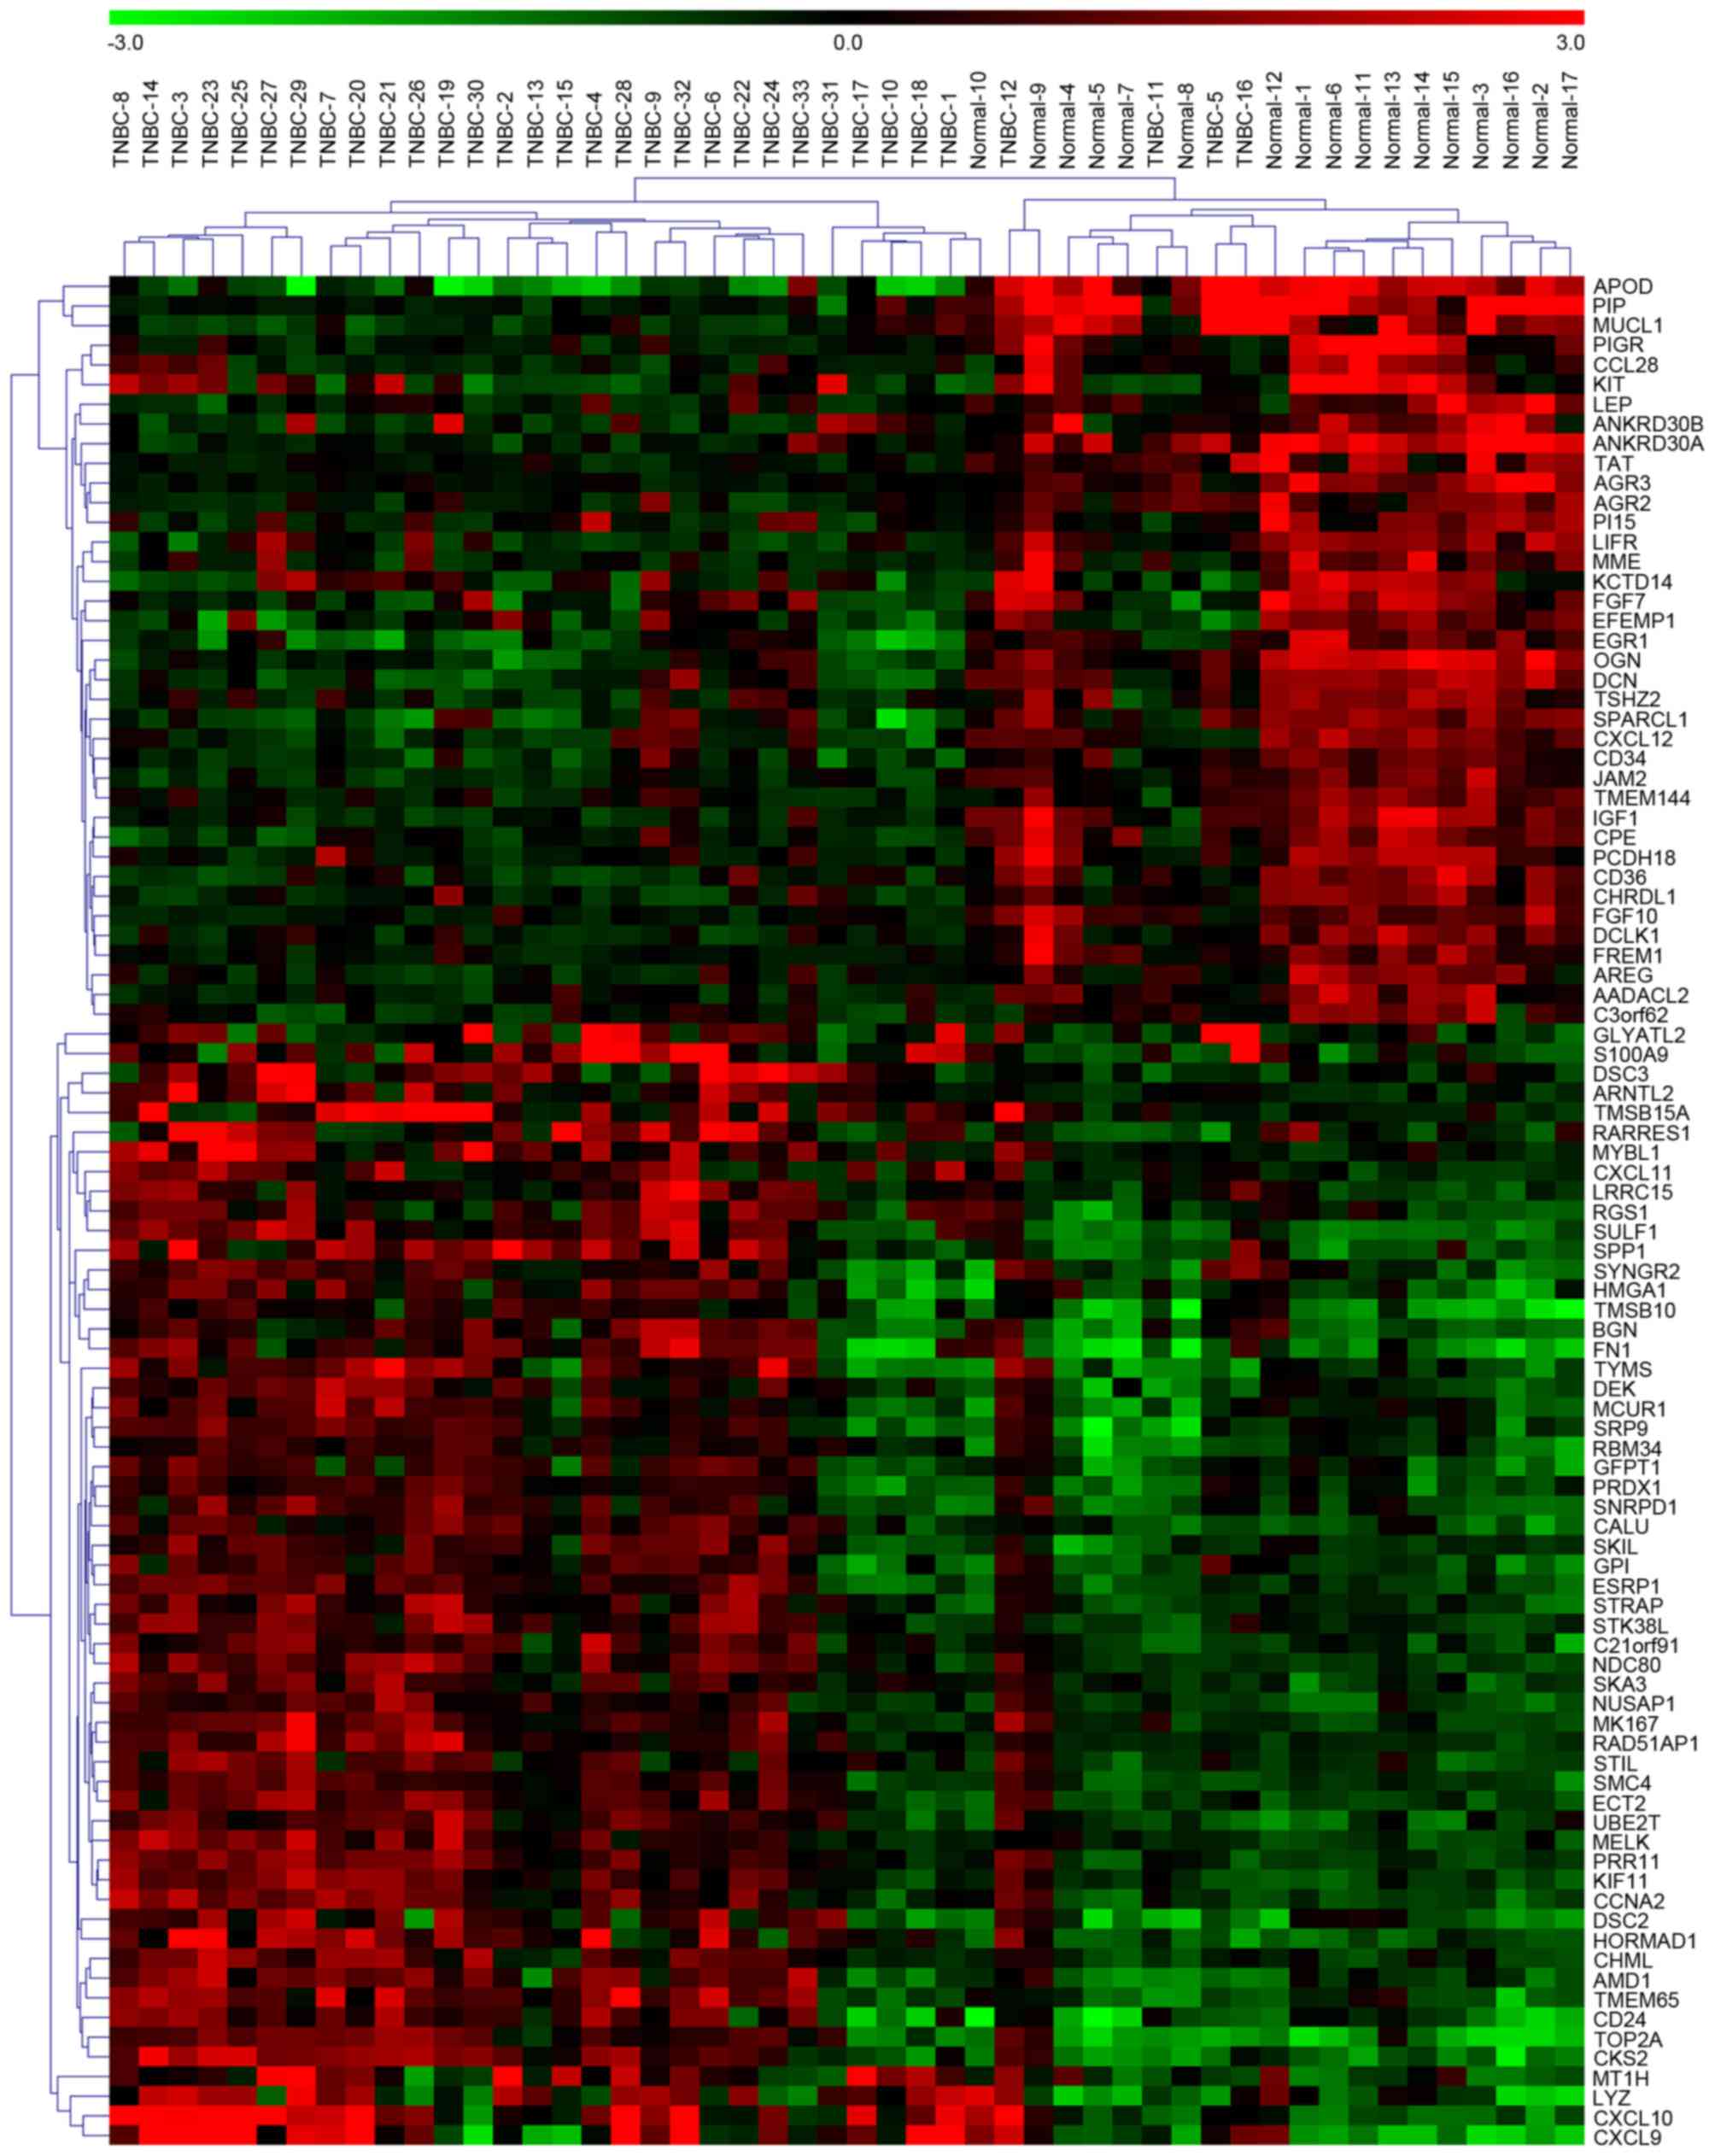
its presence in subsequent studies. Therefore, 95 differentially
expressed mRNAs were identified between the 33 TNBC tissue and 17
normal adjacent tissue samples. Unsupervised hierarchical
clustering analyses were performed using a fold-change threshold of
≥2.0. The results identified five differentially expressed miRNAs
and 95 differentially expressed mRNAs (Figs. 1 and 2).
 | Table I.miRNAs displaying significantly
altered expression levels in triple negative breast cancer samples
from GSE61723. |
Table I.
miRNAs displaying significantly
altered expression levels in triple negative breast cancer samples
from GSE61723.
| A, Downregulated |
|---|
|
|---|
| miRNA | Fold change | P-value |
|---|
| hsa-miR-320d-1 | −2.78 |
9.66×10⁻⁴ |
| hsa-miR-548v | −2.28 | 3.80×10⁻³ |
| hsa-miR-99a | −2.22 |
1.41×10⁻⁶ |
| .hsa-miR-21 | −2.07 | 6.26×10⁻⁴ |
|
| B, Upregulated |
|
| hsa-miR-558 | 2.01 |
1.47×10⁻³ |
| Table II.mRNAs displaying significantly altered
expression patterns in triple negative breast cancer samples from
GSE61723. |
Table II.
mRNAs displaying significantly altered
expression patterns in triple negative breast cancer samples from
GSE61723.
| A, Upregulated |
|---|
|
|---|
| mRNA | Fold change | P-value |
|---|
| SKA3 | 2.00 |
8.80×10⁻⁶ |
| PRDX1 | 2.00 |
2.67×10⁻⁵ |
| DEK | 2.01 |
2.76×10⁻⁴ |
| SMC4 | 2.01 |
1.56×10⁻⁵ |
| SYNGR2 | 2.02 |
7.77×10⁻⁴ |
| SKIL | 2.02 |
9.45×10⁻⁵ |
| RARRES1 | 2.02 |
9.01×10⁻³ |
| CXCL11 | 2.03 |
6.14×10⁻⁵ |
| GFPT1 | 2.03 |
1.74×10⁻⁴ |
| LRRC15 | 2.04 |
1.22×10⁻⁴ |
| C21orf91 | 2.05 |
4.29×10⁻⁵ |
| SNRPD1a | 2.06 |
1.18×10⁻⁴ |
| DSC3 | 2.10 |
6.24×10⁻³ |
| MCUR1 | 2.11 |
1.89×10⁻⁴ |
| SRP9 | 2.11 |
4.66×10⁻⁴ |
| CHML | 2.12 |
2.98×10⁻⁵ |
| ARNTL2 | 2.12 |
2.27×10⁻⁴ |
| STRAP | 2.13 |
3.37×10⁻⁵ |
| MELK | 2.13 |
2.71×10⁻⁵ |
| STIL | 2.14 |
7.21×10⁻⁶ |
| NUSAP1 | 2.14 |
7.03×10⁻⁷ |
| TYMS | 2.15 |
4.99×10⁻³ |
| GLYATL2 | 2.15 |
9.02×10⁻³ |
| HMGA1 | 2.17 |
4.52×10⁻⁴ |
| MKI67 | 2.18 |
9.96×10⁻⁶ |
| UBE2T | 2.18 |
2.82×10⁻⁵ |
| CALU | 2.19 |
3.88×10⁻⁶ |
| RAD51AP1 | 2.20 |
7.80×10⁻⁶ |
| RGS1 | 2.20 |
1.13×10⁻⁴ |
| RBM34 | 2.21 |
7.94×10⁻⁷ |
| GPI | 2.23 |
9.43×10⁻⁶ |
| ESRP1 | 2.23 |
8.75×10⁻⁶ |
| MYBL1 | 2.24 |
7.28×10⁻⁴ |
| STK38L | 2.25 |
3.86×10⁻⁶ |
| PRR11 | 2.30 |
1.58×10⁻⁶ |
| AMD1 | 2.32 |
3.92×10⁻⁴ |
| DSC2 | 2.38 |
9.00×10⁻⁴ |
| KIF11 | 2.40 |
1.92×10⁻⁶ |
| NDC80 | 2.42 |
8.30×10⁻⁷ |
| TMSB15A | 2.48 |
8.05×10⁻⁴ |
| BGN | 2.48 |
1.21×10⁻⁵ |
| MT1H | 2.51 |
7.29×10⁻³ |
| ECT2 | 2.52 |
4.48×10⁻⁷ |
| CCNA2 | 2.55 |
1.79×10⁻⁶ |
| S100A9 | 2.76 |
9.01×10⁻⁴ |
| LYZ | 2.77 |
1.03×10⁻³ |
| TMEM65 | 2.79 |
7.64×10⁻⁵ |
| CD24 | 3.24 |
1.45×10⁻⁵ |
| HORMAD1 | 3.28 |
4.46×10⁻⁶ |
| TMSB10 | 3.31 |
1.09×10⁻⁸ |
| SULF1 | 3.38 |
7.50×10⁻⁸ |
| SPP1 | 3.40 |
2.30×10⁻⁶ |
| FN1 | 3.94 |
1.26×10⁻⁶ |
| TOP2A | 4.13 |
6.26×10⁻⁸ |
| CKS2 | 4.20 |
6.45×10⁻⁸ |
| CXCL10 | 4.48 |
1.19×10⁻⁵ |
| CXCL9 | 5.14 |
1.96×10⁻⁵ |
|
LOC100507381a | 2.16 |
4.06×10⁻⁴ |
| UBE2Ca | 2.22 |
1.53×10⁻⁷ |
|
| B,
Downregulated |
|
| PIP | −8.96 |
1.08×10⁻⁶ |
| APOD | −7.77 |
9.23×10⁻⁹ |
| ANKRD30A | −4.91 |
9.08×10⁻¹² |
| OGN | −4.13 |
7.52×10⁻¹¹ |
| DCN | −3.29 |
8.40×10⁻¹⁰ |
| PIGR | −3.19 |
5.37×10⁻⁷ |
| MUCL1 | −3.17 |
1.34×10⁻³ |
| EGR1 | −3.09 |
3.01×10⁻⁸ |
| AGR3 | −3.01 |
8.72×10⁻¹² |
| IGF1 | −2.96 |
1.21×10⁻⁸ |
| CPEa | −2.74 |
6.18×10⁻⁹ |
| LIFR | −2.67 |
3.25×10⁻⁷ |
| SPARCL1 | −2.65 |
9.09×10⁻⁶ |
| CXCL12 | −2.60 |
8.37×10⁻⁹ |
| LEP | −2.53 |
1.77×10⁻⁶ |
| FGF7 | −2.53 |
1.47×10⁻⁴ |
| CD36 | −2.48 |
4.12×10⁻⁷ |
| DCLK1 | −2.46 |
1.27×10⁻⁸ |
| FGF10 | −2.34 |
7.78×10⁻¹¹ |
| PCDH18 | −2.29 |
6.78×10⁻⁶ |
| TSHZ2 | −2.28 |
2.10×10⁻⁶ |
| TAT | −2.27 |
6.83×10⁻⁶ |
| ANKRD30B | −2.24 |
4.58×10⁻⁴ |
| CHRDL1 | −2.21 |
3.71×10⁻⁷ |
| FREM1 | −2.18 |
9.51×10⁻⁹ |
| CCL28 | −2.14 |
9.17×10⁻⁵ |
| KIT | −2.14 |
1.47×10⁻² |
| EFEMP1 | −2.13 |
2.58×10⁻⁴ |
| AGR2 | −2.10 |
3.56×10⁻⁶ |
| JAM2 | −2.08 |
6.94×10⁻⁸ |
| MME | −2.08 |
6.00×10⁻⁵ |
| CD34 | −2.07 |
1.14×10⁻⁶ |
| PI15 | −2.07 |
1.23×10⁻⁴ |
| AREG | −2.06 |
2.80×10⁻⁶ |
| AADACL2 | −2.06 |
3.20×10⁻⁶ |
| KCTD14 | −2.05 |
4.39×10⁻³ |
| TMEM144 | −2.04 |
5.22×10⁻⁷ |
| C3orf62 | −2.02 |
4.69×10⁻⁶ |
Validation of miRNA expression
To confirm the five differentially expressed miRNAs
identified in TNBC samples from the GSE61723 array, microarray data
from the GSE61724 array was obtained from the GEO database, which
included 16 TNBC tissues and 4 normal adjacent tissue samples. Two
miRNAs (miRNA-99a and miRNA-21) were selected for further
validation from the five significantly dysregulated miRNAs.
miRNA-99a (P=1.91×10⁻⁶) and miRNA-21 (P=1.84×10⁻⁴) were observed to
be differentially expressed in TNBC samples when compared with
normal adjacent samples in the GSE61723 array. Therefore, the
results were consistent with the miRNA expression levels in the
GSE61723 dataset, which demonstrated that the five dysregulated
miRNAs were able to accurately distinguish between TNBC tissues and
normal tissues. Data from GSE61723 and GSE61724 are not identical
and certain miRNAs in GSE61723 were unable to be found in GSE61724;
therefore, validation was only performed in two miRNAs.
Prediction of miRNA target genes and
functional analysis
In order to determine the putative functions and
target genes of the five dysregulated miRNAs identified in TNBC
samples, the intersection set of sequences from the 95
differentially expressed mRNAs and the predicted target genes were
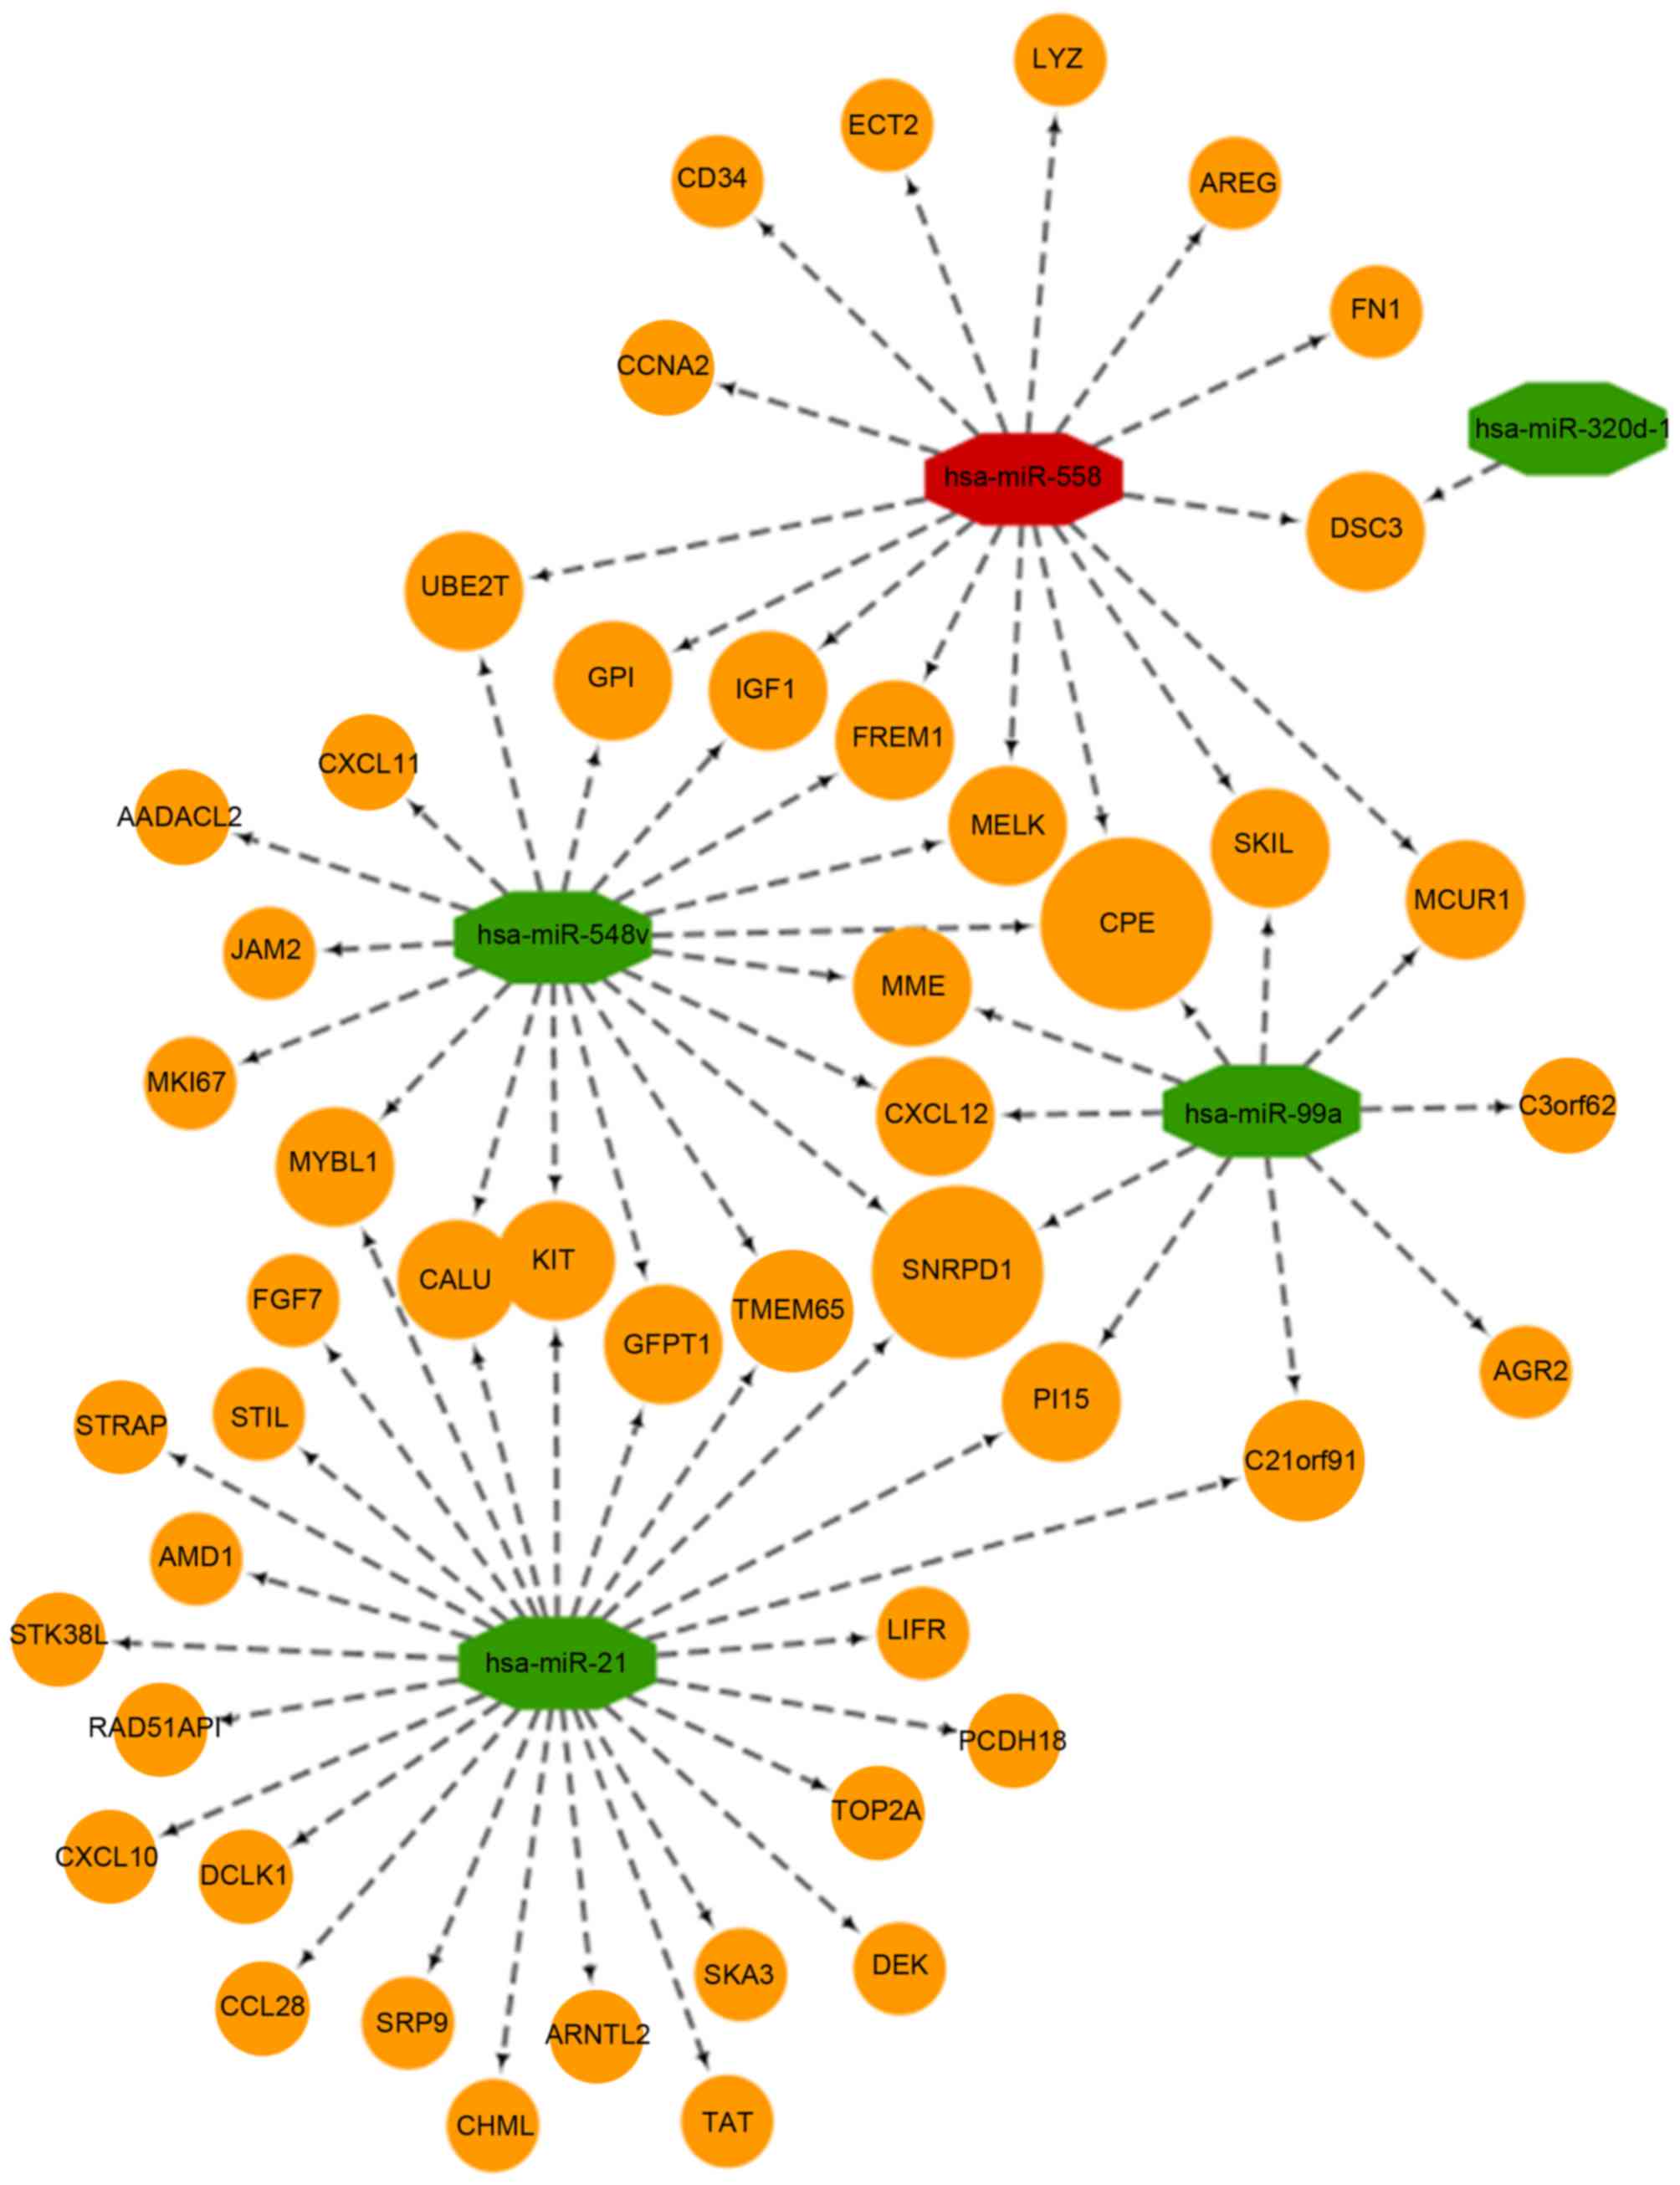
identified using TargetScan software. A total of 49 target mRNAs
were included for further analysis. The of miRNA-mRNA interaction
regulatory network is shown in Fig.
3. The results indicated that miRNA-320d-1 targeted the
smallest number of genes, whereas the remaining four miRNAs
targeted at least 10 (Fig. 3). In
addition, carboxypeptidase and the small nuclear ribonucleoprotein
D1 polypeptide were identified as the hub nodes connected to three
miRNAs, which suggests that they may serve a key role in cancer
pathogenesis (Fig. 3). Analysis of
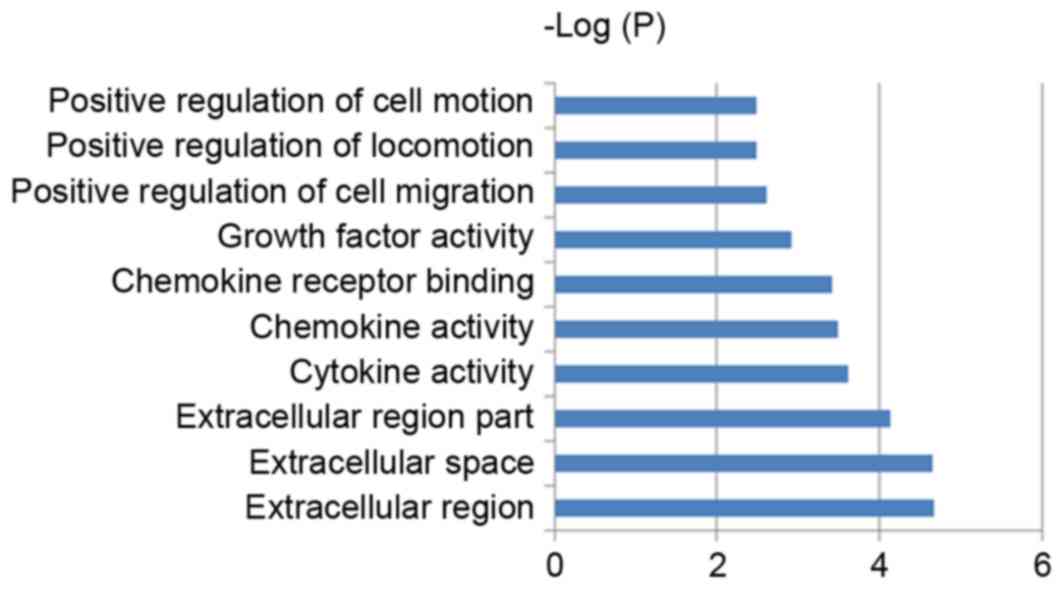
the GO processes and KEGG pathways involving the intersectional 49
target genes was performed using the DAVID tool, with thresholds of
≥2 gene counts and P-values of ≤0.05. The results identified 31 GO
terms and three signaling pathways (Table III). The 10 most significant GO
terms of the predicted target genes are indicated in Fig. 4. According to the biological
function analysis of GO processes, a large proportion of the
predicted targets of differentially expressed miRNAs encode
cellular components in extracellular regions, and are involved in
cell migration, proliferation, motion, adhesion and regeneration
(Table III and Fig. 4). These biological functions are
considered to be crucial for human tumorigenesis and metastasis
(17). In addition, KEGG pathway
analysis demonstrated that cytokine-cytokine receptor interactions,
chemokine signaling and hematopoietic cell lineage pathways, which
are associated with cell growth, proliferation and transformation,
might be regulated by the predicted target genes (Table III).
| Table III.Significantly enriched GO processes
and KEGG pathways with P≤0.05 and a gene count of ≥2. |
Table III.
Significantly enriched GO processes
and KEGG pathways with P≤0.05 and a gene count of ≥2.
| A, GO
processes |
|---|
|
|---|
| Category | Function | Gene count | P-value |
|---|
| GO:0005576 | Extracellular
region (CC) | 18 |
2.14×10⁻⁵ |
| GO:0005615 | Extracellular space
(CC) | 11 |
2.20×10⁻⁵ |
| GO:0044421 | Extracellular
region part (CC) | 12 |
7.38×10⁻⁵ |
| GO:0005125 | Cytokine activity
(MF) | 6 |
2.44×10⁻⁴ |
| GO:0008009 | Chemokine activity
(MF) | 4 |
3.22×10⁻⁴ |
| GO:0042379 | Chemokine receptor
binding (MF) | 4 |
3.88×10⁻⁴ |
| GO:0008083 | Growth factor
activity (MF) | 5 |
1.21×10⁻³ |
| GO:0030335 | Positive regulation
of cell migration (BP) | 4 |
2.45×10⁻³ |
| GO:0040017 | Positive regulation
of locomotion (BP) | 4 |
3.22×10⁻³ |
| GO:0051272 | Positive regulation
of cell motion (BP) | 4 |
3.22×10⁻³ |
| GO:0008284 | Positive regulation
of cell proliferation (BP) | 6 |
7.93×10⁻³ |
| GO:0016477 | Cell migration
(BP) | 5 |
9.49×10⁻³ |
| GO:0008283 | Cell proliferation
(BP) | 6 |
9.80×10⁻³ |
| GO:0042330 | Taxis (BP) | 4 |
1.25×10⁻² |
| GO:0006935 | Chemotaxis
(BP) | 4 |
1.25×10⁻² |
| GO:0051674 | Localization of
cell (BP) | 5 |
1.36×10⁻² |
| GO:0048870 | Cell motility
(BP) | 5 |
1.36×10⁻² |
| GO:0006928 | Cell motion
(BP) | 6 |
1.38×10⁻² |
| GO:0030334 | Regulation of cell
migration (BP) | 4 |
1.44×10⁻² |
| GO:0007155 | Cell adhesion
(BP) | 7 |
1.80×10⁻² |
| GO:0022610 | Biological adhesion
(BP) | 7 |
1.81×10⁻² |
| GO:0031099 | Regeneration
(BP) | 3 |
1.85×10⁻² |
| GO:0030246 | Carbohydrate
binding (MF) | 5 |
1.93×10⁻² |
| GO:0040012 | Regulation of
locomotion (BP) | 4 |
2.02×10⁻² |
| GO:0051270 | Regulation of cell
motion (BP) | 4 |
2.05×10⁻² |
| GO:0009611 | Response to
wounding (BP) | 6 |
2.12×10⁻² |
| GO:0000902 | Cell morphogenesis
(BP) | 5 |
2.22×10⁻² |
| GO:0035019 | Somatic stem cell
maintenance (BP) | 2 |
2.70×10⁻² |
| GO:0032989 | Cellular component
morphogenesis (BP) | 5 |
3.15×10⁻² |
| GO:0008354 | Germ cell migration
(BP) | 2 |
3.58×10⁻² |
| GO:0007626 | Locomotory behavior
(BP) | 4 |
4.98×10⁻² |
|
| B, KEGG
pathways |
|
| KEGG: 04060 | Cytokine-cytokine
receptor interaction | 6 |
2.86×10⁻² |
| KEGG: 04062 | Chemokine signaling
pathway | 4 |
3.52×10⁻² |
| KEGG: 04640 | Hematopoietic cell
lineage | 3 |
4.41×10⁻² |
Discussion
The mortality rates of patients with TNBC are high,
as the vast majority of TNBC tumors are infiltrating ductal
carcinomas, which often lead to visceral metastases (18). TNBC displays characteristic
biological and clinical pathologic features, including rapid
progression, poor prognosis and high recurrence rates (19). Surgery and chemotherapy are the
major therapeutic strategies used to treat patients with TNBC.
However, few studies have investigated the pathogenesis of TNBC.
Therefore, there is an urgent need to identify novel therapeutic
targets and treatments for patients with TNBC.
Expression microarrays have been widely applied for
the diagnosis of various cancers (20,21).
An important application of microarray experiments is the analysis
of differentially expressed miRNAs or mRNAs between normal and
tumor samples. The differentially expressed miRNA or mRNA sequences
may be used for further functional, pathway or bioinformatics
analyses. Microarray analysis is generally expensive; however, it
produces a large quantity of data. Therefore, integrated mining of
microarray data from public databases, such as the GEO database, is
popular among researchers (22–24).
In the present study, five differentially expressed
miRNAs (upregulated miR-558 and downregulated miR-320d-1, miR-548v,
miR-99a and miR-21 expression), and 97 mRNAs were identified in
TNBC tissue samples when compared with normal adjacent tissues
using the GSE61723 array. GSE61724 microarray data was subsequently
used to validate the five differentially expressed miRNAs, and the
results demonstrated that two of the identified miRNA sequences
(miRNA-99a and miRNA-21) were differentially expressed in the
GSE61724 dataset. A total of 49 predicted target mRNAs of the 5
miRNAs were selected for further analysis according to the
intersection set of the 97 differentially expressed mRNAs and the
predicted target genes using TargetScan software. In addition,
bioinformatics analyses were employed to investigate the functions
and signaling pathways of the miRNA-mRNA network, in order to
further investigate the possible mechanisms underlying the
development of TNBC. This may provide relevant targets for the
early diagnosis and treatment of patients with TNBC.
GO analysis is divided into three sections
(molecular function, biological process and cellular component),
which are widely used in the organizational and functional
annotation of genes (25).
Previous studies have primarily focused on applying GO analysis for
miRNA or mRNA microarray results (26–28).
In the current study, 31 GO terms were identified using the DAVID
software tool with threshold values of ≥2 counts and P≤0.05. The
results revealed that the predicted target genes encode regulatory
factors and proteins located in extracellular regions, and may be
involved in a number of biological processes, including regulation
of cell migration, cell motion, cell proliferation, and cell
adhesion. These processes are closely associated with the
occurrence and metastasis of human tumor cells (29).
Signaling pathways are the way of facilitating the
effect of extracellular signaling molecules within cells. In the
present study, three main signaling pathways were demonstrated to
be regulated by 49 target genes of the five differentially
expressed miRNAs. These pathways included cytokine-cytokine
receptor interaction, chemokine and hematopoietic cell lineage
pathways. This suggests that these pathways may serve a significant
role in tumor progression, prevention and survival rates (30–32).
These identified signaling pathways, may provide promising novel
therapeutic targets for the treatment of patients with TNBC.
The present study has a number of limitations.
Firstly, due to the lack of microarray data comparing TNBC tumor
tissues with normal adjacent control tissues, the results of only
two GSE series were employed in the current study. Secondly, due to
the small number of differentially expressed miRNAs identified,
analysis of the associated functions and signaling pathways may be
incomplete. In future studies, a more comprehensive analysis will
be performed using a greater number of microarray datasets.
In conclusion, five differentially expressed miRNAs
and 49 potential target genes were identified in TNBC samples when
compared with normal adjacent control tissues. The results of
integrated GO function and KEGG signaling pathway analyses
suggested that the differentially expressed miRNAs and their
potential target mRNAs may influence the pathogenesis of TNBC. In
addition, the results suggest that these sequences may be promising
biomarkers for the early diagnosis and targeted therapy of patients
with TNBC.
References
|
1
|
Perou CM, Sørlie T, Eisen MB, van de Rijn
M, Jeffrey SS, Rees CA, Pollack JR, Ross DT, Johnsen H, Akslen LA,
et al: Molecular portraits of human breast tumours. Nature.
406:747–752. 2000. View
Article : Google Scholar : PubMed/NCBI
|
|
2
|
Pierobon M and Frankenfeld CL: Obesity as
a risk factor for triple-negative breast cancers: A systematic
review and meta-analysis. Breast Cancer Res Treat. 137:307–314.
2013. View Article : Google Scholar : PubMed/NCBI
|
|
3
|
Foulkes WD, Smith IE and Reis-Filho JS:
Triple-negative breast cancer. N Engl J Med. 363:1938–1948. 2010.
View Article : Google Scholar : PubMed/NCBI
|
|
4
|
Lehmann BD, Bauer JA, Chen X, Sanders ME,
Chakravarthy AB, Shyr Y and Pietenpol JA: Identification of human
triple-negative breast cancer subtypes and preclinical models for
selection of targeted therapies. J Clin Invest. 121:2750–2767.
2011. View
Article : Google Scholar : PubMed/NCBI
|
|
5
|
Blows FM, Driver KE, Schmidt MK, Broeks A,
van Leeuwen FE, Wesseling J, Cheang MC, Gelmon K, Nielsen TO,
Blomqvist C, et al: Subtyping of breast cancer by
immunohistochemistry to investigate a relationship between subtype
and short and long term survival: A collaborative analysis of data
for 10,159 cases from 12 studies. PLoS Med. 7:e10002792010.
View Article : Google Scholar : PubMed/NCBI
|
|
6
|
Cui Q, Yu Z, Pan Y, Purisima EO and Wang
E: MicroRNAs preferentially target the genes with high
transcriptional regulation complexity. Biochem Biophys Res Commun.
352:733–738. 2007. View Article : Google Scholar : PubMed/NCBI
|
|
7
|
Kim VN and Nam JW: Genomics of microRNA.
Trends Genet. 22:165–173. 2006. View Article : Google Scholar : PubMed/NCBI
|
|
8
|
Rodriguez A, Griffiths-Jones S, Ashurst JL
and Bradley A: Identification of mammalian microRNA host genes and
transcription units. Genome Res. 14:1902–1910. 2004. View Article : Google Scholar : PubMed/NCBI
|
|
9
|
Yang L, Feng Y, Qi P, Xu S and Zhou Y:
Mechanism of serum miR-21 in the pathogenesis of familial and
triple negative breast cancer. J Biol Regul Homeost Agents.
30:1041–1045. 2016.PubMed/NCBI
|
|
10
|
Zhang G, Liu Z, Han Y, Wang X and Yang Z:
Overexpression of miR-509 increases apoptosis and inhibits invasion
via suppression of tumor necrosis factor-α in triple-negative
breast cancer Hs578T cells. Oncol Res. 24:233–238. 2016. View Article : Google Scholar : PubMed/NCBI
|
|
11
|
Mathe A, Wong-Brown M, Morten B, Forbes
JF, Braye SG, Avery-Kiejda KA and Scott RJ: Novel genes associated
with lymph node metastasis in triple negative breast cancer. Sci
Rep. 5:158322015. View Article : Google Scholar : PubMed/NCBI
|
|
12
|
Agarwal V, Bell GW, Nam JW and Bartel DP:
Predicting effective microRNA target sites in mammalian mRNAs.
Elife. 4:2015. View Article : Google Scholar :
|
|
13
|
Shannon P, Markiel A, Ozier O, Baliga NS,
Wang JT, Ramage D, Amin N, Schwikowski B and Ideker T: Cytoscape: A
software environment for integrated models of biomolecular
interaction networks. Genome Res. 13:2498–2504. 2003. View Article : Google Scholar : PubMed/NCBI
|
|
14
|
da W Huang, Sherman BT and Lempicki RA:
Systematic and integrative analysis of large gene lists using DAVID
bioinformatics resources. Nat Protoc. 4:44–57. 2009.PubMed/NCBI
|
|
15
|
da W Huang, Sherman BT and Lempicki RA:
Bioinformatics enrichment tools: Paths toward the comprehensive
functional analysis of large gene lists. Nucleic Acids Res.
37:1–13. 2009. View Article : Google Scholar : PubMed/NCBI
|
|
16
|
Sam LT, Mendonca EA, Li J, Blake J,
Friedman C and Lussier YA: PhenoGO: An integrated resource for the
multiscale mining of clinical and biological data. BMC
bioinformatics. 10 Suppl 2:S82009. View Article : Google Scholar : PubMed/NCBI
|
|
17
|
Labi V and Erlacher M: How cell death
shapes cancer. Cell Death Dis. 6:e16752015. View Article : Google Scholar : PubMed/NCBI
|
|
18
|
Zhang C, Wang S, Israel HP, Yan SX,
Horowitz DP, Crockford S, Gidea-Addeo D, Chao KS Clifford, Kalinsky
K and Connolly EP: Higher locoregional recurrence rate for
triple-negative breast cancer following neoadjuvant chemotherapy,
surgery and radiotherapy. Springerplus. 4:3862015. View Article : Google Scholar : PubMed/NCBI
|
|
19
|
Kim S, Park HS, Kim JY, Ryu J, Park S and
Kim SI: Comparisons of oncologic outcomes between triple-negative
breast cancer (TNBC) and Non-TNBC among patients treated with
breast-conserving therapy. Yonsei Med J. 57:1192–1198. 2016.
View Article : Google Scholar : PubMed/NCBI
|
|
20
|
Shi KQ, Lin Z, Chen XJ, Song M, Wang YQ,
Cai YJ, Yang NB, Zheng MH, Dong JZ, Zhang L and Chen YP:
Hepatocellular carcinoma associated microRNA expression signature:
Integrated bioinformatics analysis, experimental validation and
clinical significance. Oncotarget. 6:25093–25108. 2015. View Article : Google Scholar : PubMed/NCBI
|
|
21
|
Dai M, Chen X, Mo S, Li J, Huang Z, Huang
S, Xu J, He B, Zou Y, Chen J and Dai S: Meta-signature LncRNAs
serve as novel biomarkers for colorectal cancer: Integrated
bioinformatics analysis, experimental validation and diagnostic
evaluation. Sci Rep. 7:465722017. View Article : Google Scholar : PubMed/NCBI
|
|
22
|
An N, Shi X, Zhang Y, Lv N, Feng L, Di X,
Han N, Wang G, Cheng S and Zhang K: Discovery of a novel immune
gene signature with profound prognostic value in colorectal cancer:
A model of cooperativity disorientation created in the process from
development to cancer. PloS One. 10:e01371712015. View Article : Google Scholar : PubMed/NCBI
|
|
23
|
Volinia S and Croce CM: Prognostic
microRNA/mRNA signature from the integrated analysis of patients
with invasive breast cancer. Proc Natl Acad Sci USA. 110:7413–7417.
2013. View Article : Google Scholar : PubMed/NCBI
|
|
24
|
Zhang X, Peng Y, Jin Z, Huang W, Cheng Y,
Liu Y, Feng X, Yang M, Huang Y, Zhao Z, et al: Integrated miRNA
profiling and bioinformatics analyses reveal potential causative
miRNAs in gastric adenocarcinoma. Oncotarget. 6:32878–32889.
2015.PubMed/NCBI
|
|
25
|
Lovering RC, Camon EB, Blake JA and Diehl
AD: Access to immunology through the gene ontology. Immunology.
125:154–160. 2008. View Article : Google Scholar : PubMed/NCBI
|
|
26
|
Xiong H, Li Q, Liu S, Wang F, Xiong Z,
Chen J, Chen H, Yang Y, Tan X, Luo Q, et al: Integrated microRNA
and mRNA transcriptome sequencing reveals the potential roles of
miRNAs in stage I endometrioid endometrial carcinoma. PLoS One.
9:e1101632014. View Article : Google Scholar : PubMed/NCBI
|
|
27
|
Li C, Nong Q, Solanki MK, Liang Q, Xie J,
Liu X and Li Y, Wang W, Yang L and Li Y: Differential expression
profiles and pathways of genes in sugarcane leaf at elongation
stage in response to drought stress. Sci Rep. 6:256982016.
View Article : Google Scholar : PubMed/NCBI
|
|
28
|
Ma G, Luo Y, Zhu H, Luo Y, Korhonen PK,
Young ND, Gasser RB and Zhou R: MicroRNAs of Toxocara canis and
their predicted functional roles. Parasit Vectors. 9:2292016.
View Article : Google Scholar : PubMed/NCBI
|
|
29
|
Ha M and Kim VN: Regulation of microRNA
biogenesis. Nat Rev Mol Cell Biol. 15:509–524. 2014. View Article : Google Scholar : PubMed/NCBI
|
|
30
|
Lapkina-Gendler L, Rotem I, Pasmanik-Chor
M, Gurwitz D, Sarfstein R, Laron Z and Werner H: Identification of
signaling pathways associated with cancer protection in Laron
syndrome. Endocr Relat Cancer. 23:399–410. 2016. View Article : Google Scholar : PubMed/NCBI
|
|
31
|
Shi KQ, Lin Z, Chen XJ, Song M, Wang YQ,
Cai YJ, Yang NB, Zheng MH, Dong JZ, Zhang L and Chen YP:
Hepatocellular carcinoma associated microRNA expression signature:
Integrated bioinformatics analysis, experimental validation and
clinical significance. Oncotarget. 6:25093–25108. 2015. View Article : Google Scholar : PubMed/NCBI
|
|
32
|
Geraldo MV and Kimura ET: Integrated
analysis of thyroid cancer public datasets reveals role of
post-transcriptional regulation on tumor progression by targeting
of immune system mediators. PLoS One. 10:e01417262015. View Article : Google Scholar : PubMed/NCBI
|