Introduction
Nephrotic syndrome is characterized by extensive
proteinuria and hypoalbuminemia. It is not a single disease;
rather, it is a term for numerous diseases and pathological types.
Renal biopsy is of use in determining the diagnosis and prognosis,
and for guiding treatment; however, its use is limited due to its
invasive nature.
Proteomic analysis exhibits the advantage of being
high-throughput, and it has been used to identify nephrotic
syndrome biomarkers. However, the presence of abundant plasma
proteins in the urine of patients with nephrotic syndrome makes
proteomic identification of novel biomarkers difficult (1). Various attempts have been made
towards improving biomarker identification, including
two-dimensional electrophoresis mass spectrometry, surface enhanced
laser-desorption ionization mass spectrometry and capillary
electrophoresis combined with mass spectrometry (2–7).
However, only a few highly abundant proteins, including albumin and
α2-antitrypsin, have been identified. A comprehensive profile of
the urine proteome of patients with nephrotic syndrome, with
practical biomarkers, which reflects pathological type, prognosis
and the underlying pathological process in nephrotic syndrome,
remains lacking.
Antibody columns may be used to deplete
high-abundance plasma proteins from urine samples to allow for the
detection of lower abundance proteins (8–14).
Two-dimensional liquid chromatography (2D-LC) separation decreases
sample complexity by using two columns prior to tandem mass
spectrometry (MS/MS) and exhibits increased power in detecting
low-abundance proteins (15,16).
A method that combines antibody depletion with 2D-LC-MS/MS may
facilitate the identification of biomarkers (17), although such a method has not
previously been used to analyze nephrotic syndrome urine
samples.
The ‘black box’ theory considers the kidney to be a
black box with unique input and output proteomes (18). The plasma proteome represents the
input proteome, and the urinary proteome represents the output
proteome. According to this theory, proteins present in the urine
may be derived from the plasma or kidney. Abnormal kidney-derived
proteins in patient urine may provide information about numerous
pathological processes occurring in the kidneys, and may be
considered potential non-invasive biomarkers for kidney
disease.
Due to the progression of proteomic technology and
the development of bioinformatics, proteomic databases, including
PeptideAtlas and the Human Protein Atlas, have been constructed for
various tissues and body fluids; these databases provide the
possibility of comparative studies to search kidney-derived
proteins in the urine. As an important component of the Human
Proteome Project, PeptideAtlas collects and processes published
MS/MS-based proteomic data and classifies them into three proteomic
databases: Normal human plasma, normal human urine and normal human
kidney (19). The Human Protein
Atlas is an antibody-based proteome database, which is focused on
systemic examination of the human proteome by profiling cells and
tissues using immunohistochemistry (20). Compared with PeptideAtlas, the
Human Protein Atlas is less comprehensive, but more accurate.
In the present study, albumin/immunoglobulin (Ig) G
antibody depletion was used in combination with 2D-LC-MS/MS to
analyze urine samples from patients with nephrotic syndrome. The
resulting data were compared to proteomic data from normal human
plasma, normal human urine and normal human kidney in PeptideAtlas,
and from normal human kidney in the Human Protein Atlas to identify
potential biomarkers (19,20).
Patients and methods
Patients
The present study was approved by the Ethics
Committee of Jinling Hospital (Nanjing, China), and informed
consent was obtained from all patients. A total of 5 patients with
nephrotic syndrome (proteinuria >3.5 g/24 h and serum albumin
<30 g/l) were included in the initial phase (Table I). A total of 30 biopsy-confirmed
patients with primary focal segmental glomerulosclerosis (FSGS), 30
biopsy-confirmed patients with minimal change disease (MCD), and 30
healthy controls were included in the validation phase (Table II).
 | Table I.Clinical and laboratory
characteristics of the patients with nephrotic syndrome in the
initial phase. |
Table I.
Clinical and laboratory
characteristics of the patients with nephrotic syndrome in the
initial phase.
|
| Patient ID |
|---|
|
|
|
|---|
| Characteristic | 1 | 2 | 3 | 4 | 5 |
|---|
| Age, years | 23 | 27 | 19 | 21 | 17 |
| Sex | M | F | M | M | M |
| 24-h urine protein,
g/24 h | 6.75 | 8.68 | 8.99 | 6.25 | 6.68 |
| Serum albumin,
g/l | 24.1 | 24.2 | 18.6 | 20.2 | 28.6 |
| Serum cholesterol,
mmol/l | 17.3 | 14 | 11.4 | 15.5 | 15 |
| Serum creatinine,
mg/dl | 1.03 | 0.6 | 5.19 | 1.52 | 1.23 |
| Table II.Clinical and laboratory
characteristics of patients with FSGS and MCD, and healthy controls
in the validation stage. |
Table II.
Clinical and laboratory
characteristics of patients with FSGS and MCD, and healthy controls
in the validation stage.
| Characteristic | FSGS (n=30) | MCD (n=30) | Healthy controls
(n=30) | P-value |
|---|
| Age, years | 30±15 | 22±7 | 26±8 | 0.01 |
| Sex, M/F | 20/10 | 19/11 | 18/12 | 0.79 |
| 24-h urine protein,
g/24 h | 8.34±3.75 | 7.09±2.80 | – | 0.15 |
| Serum albumin,
g/l | 23.8±4.0 | 22.1±3.38 | – | 0.08 |
| Serum cholesterol,
mmol/l | 11.6±3.8 | 10.8±2.8 | – | 0.34 |
| Serum creatinine,
mg/dl | 1.07±0.41 | 0.78±0.19 | – | 0.001 |
Sample preparation
Fresh urine was collected in the morning under
sterile conditions and stored at 4°C, prior to centrifugation at
5,000 × g for 30 min at 4°C on the same day. The supernatant was
precipitated with 3X (v/v) cold acetone for 2.5 h at 4°C, followed
by centrifugation at 14,000 × g for 35 min at 4°C. The precipitate
was resuspended in 25 mM NH4HCO3 and
subjected to protein quantitation using the Bradford method. The
protein samples from 5 patients were mixed together, and the pooled
sample was subsequently processed using a ProteoPrep Immunoaffinity
Albumin and IgG Depletion kit (cat no. PROTIA; Sigma-Aldrich; Merck
KGaA, Darmstadt, Germany) (21). A
low-abundance fraction was collected, and protein quantitation was
performed using the Bradford method.
Protein digestion
Protein digestion was performed as described
previously (22). Briefly, the
sample was reduced with 20 mM dithiothreitol at 37°C for 1 h, and
alkylated with 50 mM iodoacetamide at room temperature in the dark
for 45 min. The sample was subsequently loaded into a 10 kDa
filtration unit (Pall Life Sciences, Port Washington, NY, USA)
prior to the addition of 200 µl UA buffer (8 M urea in 0.1 M
Tris-HCl; pH 8.5). The UA wash was repeated once following
centrifugation at 14,000 × g for 45 min at 4°C. A volume of 200 µl
50 mM NH4HCO3 was added, and the sample was
centrifuged at 14,000 × g for 45 min at 4°C. The wash was repeated
once with NH4HCO3. Trypsin (Promega
Corporation, Madison, WI, USA) was added at a final concentration
of 1:20 for protein digestion at 37°C overnight. The peptides were
collected by centrifugation of the filtration unit at 14,000 × g
for 40 min at 4°C, and were subsequently desalted, dried and stored
for future use.
Off-line LC
The digested peptides were fractionated using a
high-pH reversed phase column (Waters Corporation, Milford, MA,
USA; 4.6×250 mm; C18; 3 µm). For each fraction the injection volume
was 8 µl. The samples were loaded onto the column in buffer A (1‰
aqueous ammonia and 99.9% water, pH 10), and eluted by buffer B1
(1‰ aqueous ammonia in 10% water and 90% acetonitrile; pH 10; flow
rate, 1 ml/min). The gradient of buffer B1 was increased from 5 to
90% for 60 min. The eluted peptides were collected at a rate of 1
fraction per minute. Following drying of each fraction, the
fractions were combined at an interval of 2 components into 20
copies. LC-MS/MS was subsequently performed.
LC-MS/MS analysis
Samples were analyzed by LC-MS/MS using a
reversed-phase C18 self-packing capillary LC column (100×0.075 mm;
3 µm; Bruker Corporation, Billerica, MA, USA) and SCIEX
Triple-TOF5600 mass spectrometer (SCIEX, Framingham, MA, US). For
reverse phase separation, the samples were loaded onto the column
in buffer A (1‰ aqueous ammonia and 99.9% water, pH 10), the
elution solution was 5–30% buffer B2 (0.1% formic acid and 99%
acetonitrile; flow speed, 300 nl/min) and the elution time was 2 h.
For MS/MS analysis the following conditions were used: Ion spray
voltage, 220 V; curtain gas, 25 psi; nebulizer gas, 5 psi;
auxiliary gas, 0 psi; temperature, 150°C; declustering potential,
100 V; mass range, 350–1,250 amu for MS and 100–1,800 amu for
MS/MS; collision energy, 35 V; and resolution (full width at
half-maximum), 40,000 for MS and 20,000 for MS/MS. Analysis was
conducted using the data-dependent approach. Following each full
scan, 30 tandem scans were performed. The width of the
mass-to-charge ratio peak of the parent ion was 0.7 amu with 35% of
the standard collision energy. The dynamic exclusion time was 15
sec.
Bioinformatic analyses
The MS/MS spectra were retrieved using Mascot
software (version 2.3.02; Matrix Science, Ltd., London, UK) and
searched against the human subset of the UniProt database
(http://www.uniprot.org). The following parameters
were used: Enzyme, trypsin; no. error cutting sites, 2; error range
of peptides and daughter ion mass, 0.05 Da; and
carbamidomethylation was set as the fixed modification. All MS
detection results used the reverse database retrieval method to
evaluate the false positive rate of the data [false positive rate =
(number of peptide fragments identified by reverse database/number
of peptide fragments identified by positive database) ×100]. The
retrieved results were analyzed using Scaffold software (version
4.0.1; Proteome Software Inc., Portland, OR, USA). The false
positive rate of proteins and polypeptides was <1%. Each protein
exhibited ≥2 unique peptides.
Databases
The urine proteomic profile data from patients with
nephrotic syndrome were compared to proteomic data from normal
human plasma, normal human urine and normal human kidney using
PeptideAtlas (http://www.peptideatlas.org/), and from normal human
kidney using the Human Protein Atlas (http://www.proteinatlas.org/).
ELISA
The first-voided urine samples of patients were
obtained on the morning of renal biopsy. A volume of 50 ml urine
was collected directly from the patients into sterile plastic tubes
and was centrifuged at 3,000 × g for 10 min at 4°C to remove cell
debris and particulate matter. The samples were stored at −80°C for
subsequent analysis and were brought to room temperature prior to
use. Repeated freeze-thaw cycles were avoided. ELISA was performed
according to the manufacturer's protocol, using a Ubiquitin-60S
ribosomal protein L40 (UBA52) Human ELISA kit (cat. no.
DL-UBA52-Hu; Gentaur Europe BVBA, Kampenhout, Belgium). Samples
were assayed in duplicate. The urinary UBA52 level was normalized
to the urinary creatinine level to correct for differences in
dilution. The final concentration of urinary UBA52 was calculated
as the ratio of the urinary UBA52 level to the creatinine level
(ng/mg creatinine).
Statistical analysis
GraphPad Prism software (version 5.0; GraphPad
Software, Inc., La Jolla, CA, USA) was used for statistical
analyses and graphical representations of the data in the
validation stage. Descriptive statistical analysis was performed to
assess all of the studied variables. Data that followed a normal
distribution were analyzed using the Kolmogorov-Smirnov test. Data
are expressed as the mean ± standard deviation, or medians and
interquartile ranges (25th and 75th percentiles), or as the number
of patients for categorical variables. Differences among the means
with normal distribution were compared using Student's t-test, and
differences with non-normal distributions were compared using
Fisher's exact test or the χ2 test for categorical
variables, as presented in Table
II. Quantitative data exhibiting non-normal distributions were
analyzed by Kruskal-Wallis test, followed by Dunn's multiple
comparisons test. Two-tailed P<0.05 was considered to indicate a
statistically significant difference.
Results
Protein identification
Proteomic analysis identified 809 proteins (≥2
unique peptides). The top 14 most abundant proteins as revealed by
spectral counting are presented in Table III. These 14 proteins accounted
for 47.6% of the total protein spectra (Fig. 1).
| Table III.Top 14 abundant proteins in the urine
proteome of patients with nephrotic syndrome. |
Table III.
Top 14 abundant proteins in the urine
proteome of patients with nephrotic syndrome.
| Rank | UniProt | Description | Spectral
counting | Molecular weight,
kDa | Unique peptides |
|---|
| 1 | P02787 | Serotransferrin | 3,923 | 77 | 117 |
| 2 | P02763 | Alpha-1-acid
glycoprotein 1 | 3,882 | 24 | 40 |
| 3 | P19652 | Alpha-1-acid
glycoprotein 2 | 1,893 | 24 | 16 |
| 4 | P00450 | Ceruloplasmin | 1,744 | 122 | 94 |
| 5 | P25311 |
Zinc-alpha-2-glycoprotein | 1,661 | 34 | 53 |
| 6 | P01009 |
Alpha-1-antitrypsin | 1,623 | 47 | 63 |
| 7 | P00738 | Haptoglobin | 1,121 | 45 | 58 |
| 8 | P04217 |
Alpha-1B-glycoprotein | 977 | 54 | 31 |
| 9 | P02768 | Albumin | 908 | 69 | 102 |
| 10 | P02760 | Protein AMBP | 821 | 39 | 30 |
| 11 | P01834 | Ig kappa chain C
region | 766 | 12 | 13 |
| 12 | P02766 | Transthyretin | 611 | 16 | 20 |
| 13 | P01008 |
Antithrombin-III | 610 | 53 | 61 |
| 14 | P0CG05 | Ig lambda-2 chain C
regions | 495 | 11 | 15 |
Comparison of the urine proteome of
patients with nephrotic syndrome and the normal human urine
proteome
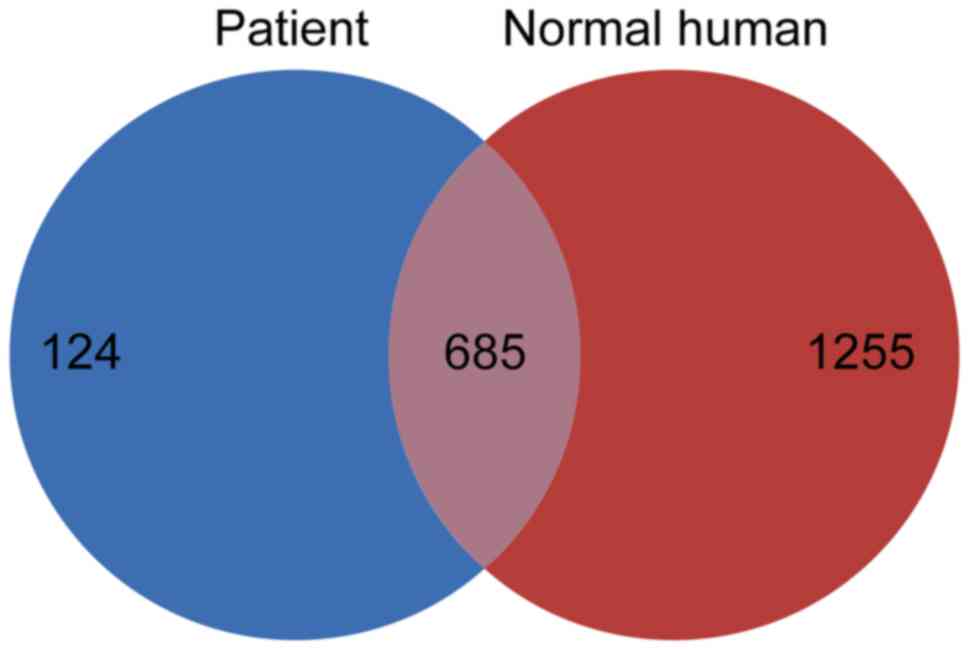
The data collected from nephrotic syndrome urine
samples were compared with the normal human urine data in
PeptideAtlas (19). In order to
ensure comparability, only compared proteins exhibiting hits
against ≥2 unique peptides in the normal human urine proteome were
analyzed (n=1,940 in normal urine proteome). The results of the
present study identified a total of 124 proteins that were present
in the patient sample and not in the normal human urine proteome
(Fig. 2). The levels of these 124
proteins may be increased in the urine of patients with nephrotic
syndrome compared with in normal human urine. These 124 proteins
are subsequently referred to as ‘disease-associated proteins’.
Comparison of the urine proteome of
patients with nephrotic syndrome and the normal human kidney
proteome and normal human plasma proteome in PeptideAtlas, and the
normal human kidney proteome in the Human Protein Atlas
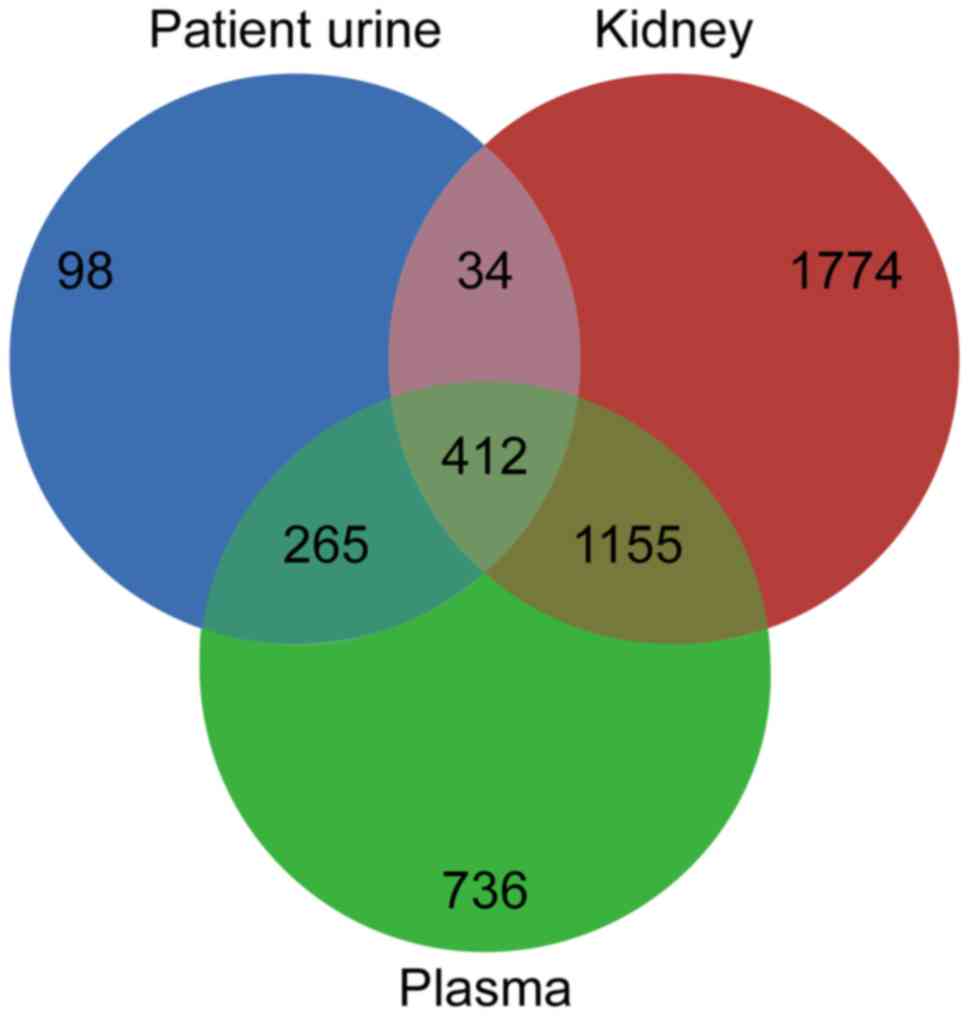
Comparison of the present results with the normal
human kidney (n=3,375) and plasma (n=2,568) data from PeptideAtlas
(19) revealed 34 proteins (≥2
unique peptides) that were present in the nephrotic syndrome urine
proteome and the normal human kidney proteome, but not in the
normal human plasma proteome (Fig.
3). Mapping of these 34 proteins against the Human Protein
Atlas (20) confirmed the
expression of 29 proteins in the kidney. These 29 proteins present
in the nephrotic syndrome urine proteome (Table IV) may originate from kidney
tissue and are subsequently referred to as ‘kidney-derived
proteins’.
| Table IV.Kidney-derived proteins. |
Table IV.
Kidney-derived proteins.
| Protein name | Protein accession
number | Protein molecular
weight, Da | Unique
peptides | Total
peptides/protein analyzed | Percentage sequence
coverage, % | Protein
identification probability, % |
|---|
|
Maltase-glucoamylase, intestinal
OS=Homo sapiens GN=MGAM PE=1 SV=5 | O43451 |
209,855.50 | 52 | 97 | 13.50 | 100.00 |
| N(G),
N(G)-dimethylarginine dimethylaminohydrolase 1 OS=Homo
sapiens GN=DDAH1 PE=1 SV=3 | O94760 |
31,121.80 | 3 | 3 |
11.90 | 100.00 |
| HLA class II
histocompatibility antigen gamma chain OS=Homo sapiens
GN=CD74 PE=1 SV=3 | P04233 |
33,515.90 | 5 | 11 |
13.90 | 100.00 |
| Calbindin
OS=Homo sapiens GN=CALB1 PE=1 SV=2 | P05937 |
30,027.10 | 13 | 16 |
18.80 | 100.00 |
| Parvalbumin alpha
OS=Homo sapiens GN=PVALB PE=1 SV=2 | P20472 |
12,059.50 | 5 | 5 |
18.20 |
99.90 |
| Nuclear autoantigen
Sp-100 OS=Homo sapiens GN=SP100 PE=1 SV=3 | P23497 |
100,418.80 | 3 | 3 |
2.39 |
99.80 |
|
Dihydrolipoyllysine-residue
succinyltransferase component of 2-oxoglutarate dehydrogenase
complex, mitochondrial OS=Homo sapiens GN=DLST PE=1
SV=4 | P36957 |
48,755.20 | 9 | 17 |
15.00 | 100.00 |
| Alpha-aminoadipic
semialdehyde dehydrogenase OS=Homo sapiens GN=ALDH7A1 PE=1
SV=5 | P49419 |
58,487.60 | 5 | 5 |
2.78 |
93.70 |
|
Lipopolysaccharide-responsive and
beige-like anchor protein OS=Homo sapiens GN=LRBA PE=1
SV=4 | P50851 |
319,109.50 | 2 | 2 |
0.70 |
99.00 |
| N-sulphoglucosamine
sulphohydrolase OS=Homo sapiens GN=SGSH PE=1 SV=1 | P51688 |
56,696.20 | 8 | 8 |
8.76 | 100.00 |
| Heat shock-related
70 kDa protein 2 OS=Homo sapiens GN=HSPA2 PE=1 SV=1 | P54652 |
70,023.00 | 3 | 22 |
16.70 |
99.70 |
| Ubiquitin-60S
ribosomal protein L40 OS=Homo sapiens GN=UBA52 PE=1
SV=2 | P62987 |
14,728.90 | 14 |
169 |
46.10 | 100.00 |
| S-phase
kinase-associated protein 1 OS=Homo sapiens GN=SKP1 PE=1
SV=2 | P63208 |
18,658.40 | 7 | 8 |
20.90 | 100.00 |
| Coxsackievirus and
adenovirus receptor OS=Homo sapiens GN=CXADR PE=1 SV=1 | P78310 |
40,030.90 | 5 | 6 |
5.75 |
99.90 |
| Retinol-binding
protein 5 OS=Homo sapiens GN=RBP5 PE=1 SV=3 | P82980 |
15,930.90 | 4 | 4 |
17.80 | 100.00 |
| Disabled homolog 2
OS=Homo sapiens GN=DAB2 PE=1 SV=3 | P98082 |
82,449.10 | 2 | 2 |
3.12 |
99.90 |
| Low-density
lipoprotein receptor-related protein 2 OS=Homo sapiens GN=LRP2 PE=1
SV=3 | P98164 |
521,942.70 | 15 | 16 |
1.12 | 100.00 |
| Malectin OS=Homo
sapiens GN=MLEC PE=1 SV=1 | Q14165 |
32,234.10 | 4 | 4 |
9.93 | 100.00 |
| Glutathione
S-transferase A3 OS=Homo sapiens GN=GSTA3 PE=1 SV=3 | Q16772 |
25,303.60 | 3 | 4 |
3.15 |
94.60 |
| Na(+)/H(+) exchange
regulatory cofactor NHE-RF3 OS=Homo sapiens GN=PDZK1 PE=1
SV=2 | Q5T2W1 |
57,128.90 | 3 | 3 |
2.70 |
99.70 |
| Protein furry
homolog OS=Homo sapiens GN=FRY PE=1 SV=1 | Q5TBA9 |
338,881.20 | 4 | 5 |
0.56 |
98.80 |
| Rootletin
OS=Homo sapiens GN=CROCC PE=1 SV=1 | Q5TZA2 |
228,524.80 | 2 | 4 |
1.09 |
99.00 |
| Nesprin-1
OS=Homo sapiens GN=SYNE1 PE=1 SV=3 | Q8NF91 | 1,011,042.50 | 3 | 6 |
0.19 |
99.60 |
| Nicastrin
OS=Homo sapiens GN=NCSTN PE=1 SV=2 | Q92542 |
78,411.90 | 8 | 8 |
5.36 | 100.00 |
| Protein S100-A13
OS=Homo sapiens GN=S100A13 PE=1 SV=1 | Q99584 |
11,471.70 | 5 | 6 |
11.20 |
98.60 |
| Calcineurin-like
phosphoesterase domain-containing protein 1 OS=Homo sapiens
GN=CPPED1 PE=1 SV=3 | Q9BRF8 |
35,548.70 | 4 | 4 |
3.50 |
94.90 |
| Migration and
invasion enhancer 1 OS=Homo sapiens GN=MIEN1 PE=1 SV=1 | Q9BRT3 |
12,403.00 | 6 | 9 |
24.30 | 100.00 |
| Junctional adhesion
molecule C OS=Homo sapiens GN=JAM3 PE=1 SV=1 | Q9BX67 |
35,020.30 | 10 | 11 |
20.60 | 100.00 |
| Transmembrane emp24
domain-containing protein 7 OS=Homo sapiens GN=TMED7 PE=1
SV=2 | Q9Y3B3 |
25,171.80 | 5 | 8 |
10.30 | 100.00 |
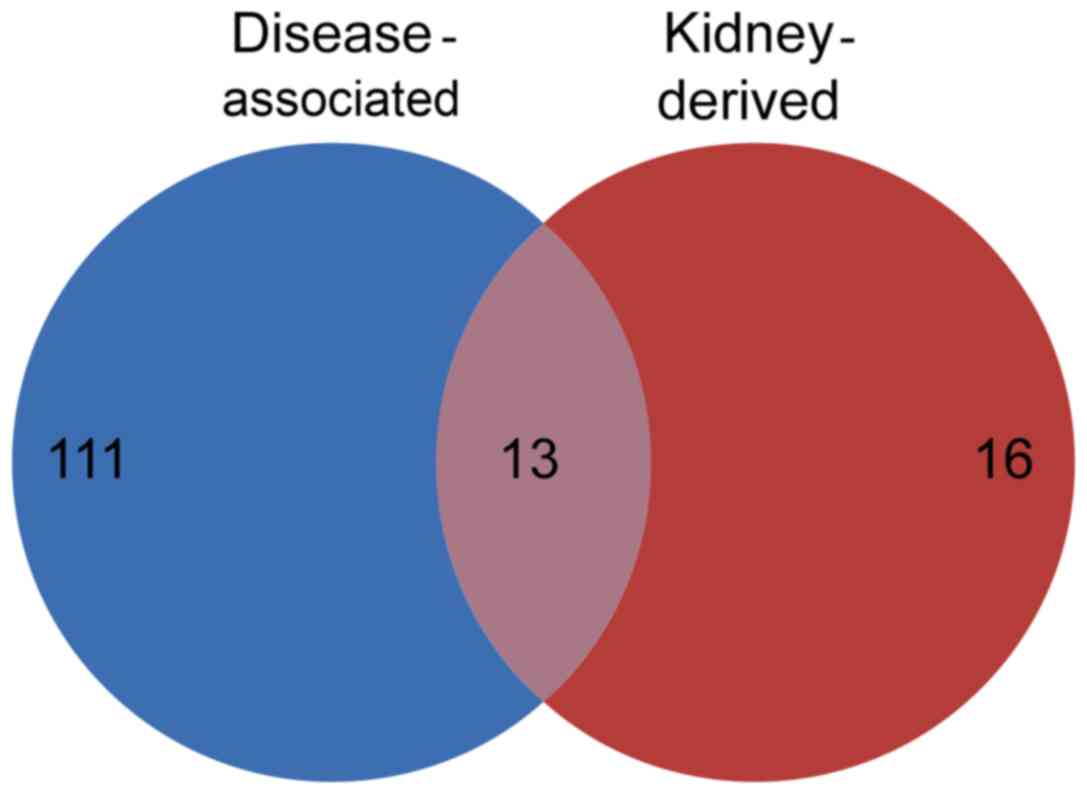
Comparison of disease-associated
proteins and kidney-derived proteins
A total of 13 low-abundance proteins were present in
the categories of disease-associated proteins and kidney-derived
proteins. These 13 proteins represented kidney-derived proteins,
which were increased in the urine collected from patients with
nephrotic syndrome and not in healthy human urine. The presence of
these proteins in the patient urine samples may be a result of
injury to the kidney, and they are subsequently referred to as
‘kidney-derived disease-associated proteins’ (Fig. 4; Table
V).
| Table V.Kidney-derived disease-associated
proteins. |
Table V.
Kidney-derived disease-associated
proteins.
| UniProt | Description | Spectral
counting | Molecular weight,
kDa | Unique
peptides |
|---|
| P62987 | Ubiquitin-60S
ribosomal protein L40 | 169 |
15 | 14 |
| P04233 | HLA class II
histocompatibility antigen gamma chain | 11 |
34 | 5 |
| P63208 | S-phase
kinase-associated protein 1 |
8 |
19 | 7 |
| P78310 | Coxsackievirus and
adenovirus receptor |
6 |
40 | 5 |
| Q99584 | Protein
S100-A13 |
6 |
11 | 5 |
| Q8NF91 | Nesprin-1 |
6 | 1,011 | 3 |
| P20472 | Parvalbumin
alpha |
5 |
12 | 5 |
| Q5TBA9 | Protein furry
homolog |
5 |
339 | 4 |
| Q16772 | Glutathione
S-transferase A3 |
4 |
25 | 3 |
| Q5TZA2 | Rootletin |
4 |
229 | 2 |
| P23497 | Nuclear autoantigen
Sp-100 |
3 |
100 | 3 |
| P50851 |
Lipopolysaccharide-responsive and
beige-like anchor protein |
2 |
319 | 2 |
| P98082 | Disabled homolog
2 |
2 |
82 | 2 |
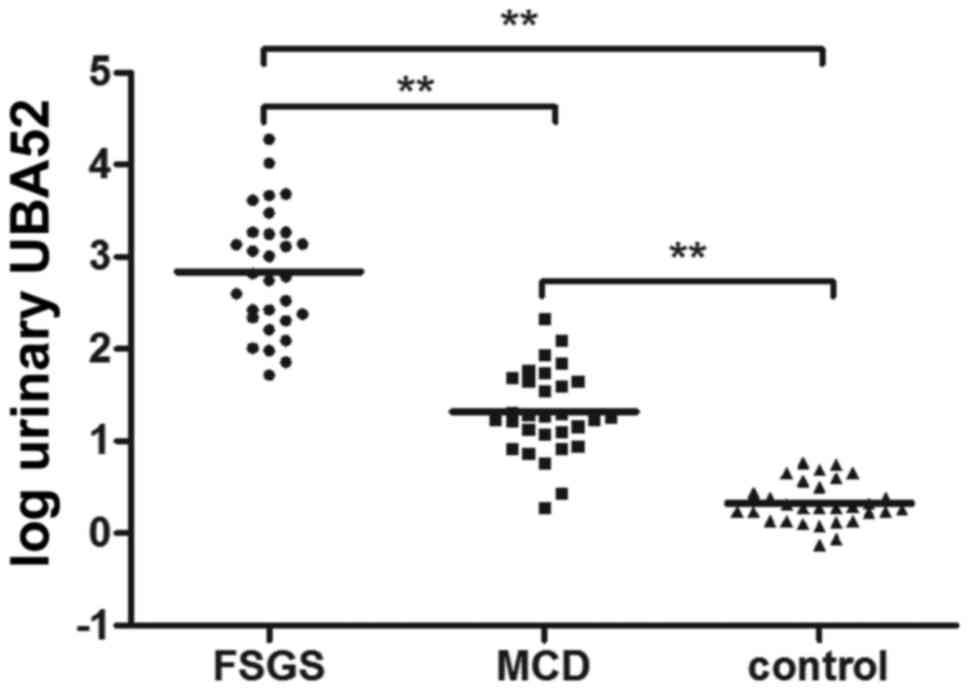
Validation of kidney-derived
disease-associated proteins
Samples from 30 patients with FSGS, 30 patients with
MCD and 30 healthy controls were analyzed using ELISA. The clinical
and laboratory characteristics of the patients are summarized in
Table II. The patients with FSGS
were older compared with the patients with MCD (P=0.01). In
addition, the patients with FSGS exhibited increased serum
creatinine levels compared with the patients with MCD (P=0.001).
There were no significant differences in the sex ratios, 24-h urine
protein levels, serum albumin levels or serum cholesterol levels
between the two groups. The measured urinary UBA52 levels are
presented in Fig. 5. Urinary UBA52
was barely detectable in the urine of healthy control subjects. The
urinary UBA52 levels were increased in patients with FSGS and MCD
compared with the healthy controls [Creatinine, 637 ng/mg
(216–1,851) vs. 1.89 ng/mg (1.37–3.33), P<0.001; and 18.58 ng/mg
(11.11–46.25) vs. 1.89 ng/mg (1.37–3.33), P<0.001)], and were
significantly increased in the patients with FSGS compared with in
the patients with MCD.
Discussion
The present study identified a large number of
proteins (n=807) in the urine samples of patients with nephrotic
syndrome. To the best of our knowledge, this result represents the
largest urine proteomic profile of nephrotic syndrome to date.
Urinary proteins were enriched using acetone precipitation. It has
previously been reported that acetone precipitation exhibits the
best performance among organic solvents according to enriched total
protein, protein types and separation efficiency (23). The application of albumin/IgG
antibody depletion decreased the abundance of albumins and other
highly abundant proteins in the urine sample. The top 14 identified
proteins still accounted for <50% of the total amount of
protein, suggesting that there remains the possibility of further
improvement. In addition, the use of 2D-LC and high performance
mass spectrometry in the present study facilitated the
identification of low-abundance proteins.
The aim of the present study was to identify
disease-specific kidney-derived proteins via a number of
experimental stages. By comparing the urine proteome of patients
with the normal human urine proteome, disease-associated proteins
were identified. By eliminating protein overlap between normal
human plasma and the urine proteome of patients, urinary protein
derived from plasma were excluded. Among the remaining proteins in
the urine proteome of the patients, the proteins that overlapped
with the kidney proteome in PeptideAtlas were regarded as putative
kidney-derived proteins; among these, the proteins that were
detected in the kidney proteome of Protein Atlas were referred to
as kidney-derived proteins. Comparison of kidney-derived proteins
and disease-associated proteins revealed 13 kidney-derived
disease-associated proteins in the urine proteome of patients with
nephrotic syndrome.
UBA52 was the most abundant protein among the 13
low-abundance proteins. A component of the ubiquitin-proteasome
system (UPS), UBA52 is a fusion protein composed of ubiquitin and
the 60S ribosomal protein L40, which labels proteins for
degradation. To the best of our knowledge, UBA52 has not previously
been reported to be present in the urine of patients with nephrotic
syndrome, and has not been associated with nephrotic syndrome in
the literature. A previous study reported that the proteolytic
activity of UPS was increased in FSGS kidney tissue, although not
in MCD, which may be associated with the different prognosis and
therapeutic response of patients with FSGS and MCD (24). FSGS and MCD are prevalent forms of
nephrotic syndrome. It is difficult to differentiate between FSGS
and MCD clinically, even using renal biopsy. In the present study,
validation experiments were performed to confirm the increased
UBA52 levels in the urine of patients with nephrotic syndrome
compared with healthy controls. It was additionally observed that
UBA52 levels were increased in the urine of patients with FSGS
compared with MCD, which is consistent with an increase in UPS
activity in the kidney, suggesting that the 13 identified proteins
(including UBA52) may be used to differentiate between pathological
types of nephrotic disease, as they reflect pathological
alterations in the kidney.
One of the primary limitations of analysis of the
urine proteome in nephrotic syndrome is the difficulty in detecting
low-medium abundance proteins, due to interference from filtered
highly abundant plasma proteins. Further studies are required to
ameliorate this limitation, which may facilitate the identification
of biomarkers that reflect certain pathological types, injury sites
and underlying pathological processes. In conclusion, the present
study identified numerous potential novel urinary protein
biomarkers for nephrotic syndrome. In addition, to the best of our
knowledge, the present study obtained the largest urinary proteomic
profile of patients with nephrotic syndrome to date.
References
|
1
|
Sancho-Martínez SM, Prieto-García L,
Blanco-Gozalo V, Fontecha-Barriuso M, López-Novoa JM and
López-Hernández FJ: Urinary proteomics in renal pathophysiology:
Impact of proteinuria. Proteomics Clin Appl. 9:636–640. 2015.
View Article : Google Scholar : PubMed/NCBI
|
|
2
|
Somparn P, Hirankarn N, Leelahavanichkul
A, Khovidhunkit W, Thongboonkerd V and Avihingsanon Y: Urinary
proteomics revealed prostaglandin H(2)D-isomerase, not
Zn-α2-glycoprotein, as a biomarker for active lupus nephritis. J
Proteomics. 75:3240–3247. 2012. View Article : Google Scholar : PubMed/NCBI
|
|
3
|
Zhang X, Jin M, Wu H, Nadasdy T, Nadasdy
G, Harris N, Green-Church K, Nagaraja H, Birmingham DJ, Yu CY, et
al: Biomarkers of lupus nephritis determined by serial urine
proteomics. Kidney Int. 74:799–807. 2008. View Article : Google Scholar : PubMed/NCBI
|
|
4
|
Rossing K, Mischak H, Dakna M, Zürbig P,
Novak J, Julian BA, Good DM, Coon JJ, Tarnow L and Rossing P:
PREDICTIONS Network: Urinary proteomics in diabetes and CKD. J Am
Soc Nephrol. 19:1283–1290. 2008. View Article : Google Scholar : PubMed/NCBI
|
|
5
|
Candiano G, Musante L, Bruschi M, Petretto
A, Santucci L, Del Boccio P, Pavone B, Perfumo F, Urbani A, Scolari
F and Ghiggeri GM: Repetitive fragmentation products of albumin and
alpha1-antitrypsin in glomerular diseases associated with nephrotic
syndrome. J Am Soc Nephrol. 17:3139–3148. 2006. View Article : Google Scholar : PubMed/NCBI
|
|
6
|
Varghese SA, Powell TB, Budisavljevic MN,
Oates JC, Raymond JR, Almeida JS and Arthur JM: Urine biomarkers
predict the cause of glomerular disease. J Am Soc Nephrol.
18:913–922. 2007. View Article : Google Scholar : PubMed/NCBI
|
|
7
|
Siwy J, Zoja C, Klein J, Benigni A, Mullen
W, Mayer B, Mischak H, Jankowski J, Stevens R, Vlahou A, et al:
Evaluation of the zucker diabetic fatty (ZDF) rat as a model for
human disease based on urinary peptidomic profiles. PLoS One.
7:e513342012. View Article : Google Scholar : PubMed/NCBI
|
|
8
|
Pieper R, Su Q, Gatlin CL, Huang ST,
Anderson NL and Steiner S: Multi-component immunoaffinity
subtraction chromatography: An innovative step towards a
comprehensive survey of the human plasma proteome. Proteomics.
3:422–432. 2003. View Article : Google Scholar : PubMed/NCBI
|
|
9
|
Pernemalm M, Lewensohn R and Lehtiö J:
Affinity prefractionation for MS-based plasma proteomics.
Proteomics. 9:1420–1427. 2009. View Article : Google Scholar : PubMed/NCBI
|
|
10
|
Björhall K, Miliotis T and Davidsson P:
Comparison of different depletion strategies for improved
resolution in proteomic analysis of human serum samples.
Proteomics. 5:307–317. 2005. View Article : Google Scholar : PubMed/NCBI
|
|
11
|
Desrosiers RR, Beaulieu E, Buchanan M and
Béliveau R: Proteomic analysis of human plasma proteins by
two-dimensional gel electrophoresis and by antibody arrays
following depletion of high-abundance proteins. Cell Biochem
Biophys. 49:182–195. 2007. View Article : Google Scholar : PubMed/NCBI
|
|
12
|
Echan LA, Tang HY, Ali-Khan N, Lee K and
Speicher DW: Depletion of multiple high-abundance proteins improves
protein profiling capacities of human serum and plasma. Proteomics.
5:3292–3303. 2005. View Article : Google Scholar : PubMed/NCBI
|
|
13
|
Roche S, Tiers L, Provansal M, Seveno M,
Piva MT, Jouin P and Lehmann S: Depletion of one, six, twelve or
twenty major blood proteins before proteomic analysis: The more the
better? J Proteomics. 72:945–951. 2009. View Article : Google Scholar : PubMed/NCBI
|
|
14
|
Mebazaa A, Vanpoucke G, Thomas G,
Verleysen K, Cohen-Solal A, Vanderheyden M, Bartunek J, Mueller C,
Launay JM, Van Landuyt N, et al: Unbiased plasma proteomics for
novel diagnostic biomarkers in cardiovascular disease:
Identification of quiescin Q6 as a candidate biomarker of acutely
decompensated heart failure. Eur Heart J. 33:2317–2324. 2012.
View Article : Google Scholar : PubMed/NCBI
|
|
15
|
Wang C, Wei LL, Shi LY, Pan ZF, Yu XM, Li
TY, Liu CM, Ping ZP, Jiang TT, Chen ZL, et al: Screening and
identification of five serum proteins as novel potential biomarkers
for cured pulmonary tuberculosis. Sci Rep. 5:156152015. View Article : Google Scholar : PubMed/NCBI
|
|
16
|
Kurono S, Kaneko Y, Matsuura N, Oishi H,
Noguchi S, Kim SJ, Tamaki Y, Aikawa T, Kotsuma Y, Inaji H and
Matsuura S: Identification of potential breast cancer markers in
nipple discharge by protein profile analysis using two-dimensional
nano-liquid chromatography/nanoelectrospray ionization-mass
spectrometry. Proteomics Clin Appl. 10:605–613. 2016. View Article : Google Scholar : PubMed/NCBI
|
|
17
|
Cao TH, Quinn PA, Sandhu JK, Voors AA,
Lang CC, Parry HM, Mohan M, Jones DJ and Ng LL: Identification of
novel biomarkers in plasma for prediction of treatment response in
patients with heart failure. Lancet. 385 Suppl 1:S262015.
View Article : Google Scholar : PubMed/NCBI
|
|
18
|
Jia L, Zhang L, Shao C, Song E, Sun W, Li
M and Gao Y: An attempt to understand kidney's protein handling
function by comparing plasma and urine proteomes. PLoS One.
4:e51462009. View Article : Google Scholar : PubMed/NCBI
|
|
19
|
Farrah T, Deutsch EW, Omenn GS, Sun Z,
Watts JD, Yamamoto T, Shteynberg D, Harris MM and Moritz RL: State
of the human proteome in 2013 as viewed through peptideatlas:
Comparing the kidney, urine, and plasma proteomes for the biology-
and disease-driven human proteome project. J Proteome Res.
13:60–75. 2014. View Article : Google Scholar : PubMed/NCBI
|
|
20
|
Uhlen M, Oksvold P, Fagerberg L, Lundberg
E, Jonasson K, Forsberg M, Zwahlen M, Kampf C, Wester K, Hober S,
et al: Towards a knowledge-based human protein atlas. Nat
Biotechnol. 28:1248–1250. 2010. View Article : Google Scholar : PubMed/NCBI
|
|
21
|
Zhang L, Wen Q, Mao HP, Luo N, Rong R, Fan
JJ and Yu XQ: Developing a reproducible method for the
high-resolution separation of peritoneal dialysate proteins on 2-D
gels. Protein Expr Purif. 89:196–202. 2013. View Article : Google Scholar : PubMed/NCBI
|
|
22
|
Wiśniewski JR, Zougman A, Nagaraj N and
Mann M: Universal sample preparation method for proteome analysis.
Nat Methods. 6:359–362. 2009. View Article : Google Scholar : PubMed/NCBI
|
|
23
|
Thongboonkerd V, Chutipongtanate S and
Kanlaya R: Systematic evaluation of sample preparation methods for
gel-based human urinary proteomics: Quantity, quality, and
variability. J Proteome Res. 5:183–191. 2006. View Article : Google Scholar : PubMed/NCBI
|
|
24
|
Beeken M, Lindenmeyer MT, Blattner SM,
Radón V, Oh J, Meyer TN, Hildebrand D, Schlüter H, Reinicke AT,
Knop JH, et al: Alterations in the ubiquitin proteasome system in
persistent but not reversible proteinuric diseases. J Am Soc
Nephrol. 25:2511–2525. 2014. View Article : Google Scholar : PubMed/NCBI
|