Introduction
In 2011, the National Institute on Aging and the
Alzheimer's Association (NIA-AA) workgroups divided Alzheimer's
disease (AD) into three phases: i) Preclinical stages of AD
(1), ii) mild cognitive impairment
(MCI) (2), and iii) dementia due
to AD (3). MCI is the symptomatic
predementia phase of dementia, which presents clinically with mild
cognition decline, but activities of daily living have not been
significantly affected (4). An
epidemiologic survey shows that ~12–15% of cases evolve to dementia
each year, and 2/3 of AD originate from MCI (5). The existing diagnosis of MCI relies
mainly on subjective symptoms and neuropsychological scales, which
lack objective clinical biomarkers. Therefore, exploring objective
biomarkers and developing effective treatment for MCI are the key
to prevention of AD.
Cognitive impairment is closely related to excessive
iron accumulation in the brain. As early as 1953, some pathologists
found that brain iron content in senile plaques (SPs) of AD
patients increased comparatively (6,7).
However, due to potential problems with patient compliance, no
pathological studies have estimated the concentration of brain iron
deposition in MCI patients. Therefore, a non-invasive and effective
test for the detection of brain iron content is an urgent
requirement. Susceptibility weighted imaging (SWI) is a new
magnetic resonance imaging (MRI) technique based on T2WI, which is
superior to conventional MRI in its ability to demonstrate
paramagnetic signals. It can quantitatively analyze iron content
indirectly by measuring the magnitude and phase data of this
element (8,9). This study aimed to investigate the
concentration of brain iron deposition in MCI patients, provide
objective biomarkers for early detection of dementia, especially
AD, and ultimately, aid the field in moving toward interventions at
earlier stages of AD when some disease modifying therapies may be
most efficacious.
Some studies have reported that patients with MCI
and AD have body iron metabolism disorder (10), but others have considered this a
highly debatable point. The relationship between brain iron
deposition and body iron levels, or if the brain iron comes from
body iron, remains unclear. In this study, we detected multiple
serum iron indices of the study participants to identify whether
patients with MCI or AD have abnormal body iron stores (low or
high), to look for a new serum biomarker, and to simplify the early
diagnosis of MCI. We also performed regression analyses on the
brain iron content measured using SWI and explored the relationship
between body iron homeostasis and brain iron content in patients
with MCI and AD.
Materials and methods
Participants
Ninety participants [30 MCI, 30 AD, and 30 normal
control (NC)] were admitted at the Affiliated Zhongshan Hospital of
Dalian University from October 2015 to November 2016. The MCI group
inclusion criteria were in accordance with those set by Petersen
et al (11) and were as
follows: i) Complaint of defective memory, ii) normal activities of
daily living, iii) normal general cognitive function, iv) abnormal
memory function for age, and v) absence of dementia, with scores of
19–30 on the Mini-Mental State Examination (MMSE) and 0.5 on
clinical dementia rating (CDR). The AD group inclusion criteria
were as follows: i) Met the Diagnostic and Statistical Manual of
Disorders, 4th edition (DSM-IV) guidelines for AD; ii) met the
National Institute of Neurological and Communicative Disorders and
Stroke-Alzheimer's Diseases and Related Disorders Associations
(NINCDS-ADRDA) guidelines for probable AD (12); iii) MMSE score is abnormal,
illiterate group ≤19 points, primary school group ≤22 points,
middle school and above group ≤24 points, and CDR score ≥1; and iv)
Hachinski ischemic scale (HIS) score <4 points, except for
vascular dementia and mixed dementia. The control group inclusion
criteria were as follows: i) Age, sex, and educational level
matched with patient groups; and ii) no cognitive impairment, which
was determined with an MMSE score ≥28 points. Exclusion criteria
included structural abnormalities that could produce dementia, such
as cerebrovascular disease, tumors, brain trauma, epilepsy,
alcoholism, psychiatric illness, or other systemic diseases that
affect brain function. This study was conducted in accordance with
the declaration of Helsinki. This study was conducted with approval
from the Ethics Committee of Affiliated Zhongshan Hospital of
Dalian University (MEC-ZSYY-2015-10). Written informed consent was
obtained from all participants.
MRI procedure and data
acquisition
All participants underwent clinical brain MRI on a
Siemens Magnetom Verio 3.0T MR with a 12-channel phased array head
coil. The conventional MRI sequences including axial T1WI, T2WI,
T2WI-FLAIR, and DWI were first acquired to exclude stroke, trauma,
tumor, and other intracranial lesions. SWI images were taken
through axial and oblique coronal scan using three-dimensional
gradient echo sequence, which is used for visualization of the HP
and other regions of interest (ROIs). The image parameters for SWI
were: Echo time (TE) 20 ms, repetition time (TR) 28 ms, slice
thickness 1.8 mm, flip angle 15°, average 1, field of view (FOV)
230 mm, voxel size (VS) 0.5×0.5×1.2 mm. The original images taken
using SWI were processed using the post-processing software of the
Siemens 3.0T MR, which generated four images: Magnitude image,
filtered phase image, minimum intensity projection (mIP) image, and
susceptibility-weighted image. The phase values of ROIs were
measured on the filtered phase images using signal processing in
MRI (SPIN) software. First, the ROIs were drawn on magnitude images
according to the anatomical structures and pixel size, including
bilateral hippocampus (HP), substantia nigra (SN), RN, dentate
nucleus (DN), caudate nucleus (CN), globus pallidus (GP), putamen
(PUT), frontal white matter (FWM), temporal cortex (TC), and
parietal cortex (PC). Through the ‘copy boundary to all other
views’ function of the SPIN software, the boundaries of the ROIs on
the magnitude images were copied to the corresponding positions in
the filtered phase images. Then, the software automatically
calculated the phase value of each ROI (Fig. 1). Data for each ROI were taken from
the largest sections and measured three times to obtain the mean.
The cerebrospinal fluid (CSF), skull, and large blood vessels were
avoided when creating the outlines of the ROIs so that the accuracy
is not affected. According to the formula provided by Siemens,
φ=2,048 (Φ + π)/π, the phase value (φ) was converted to the radian
angle value (Φ).
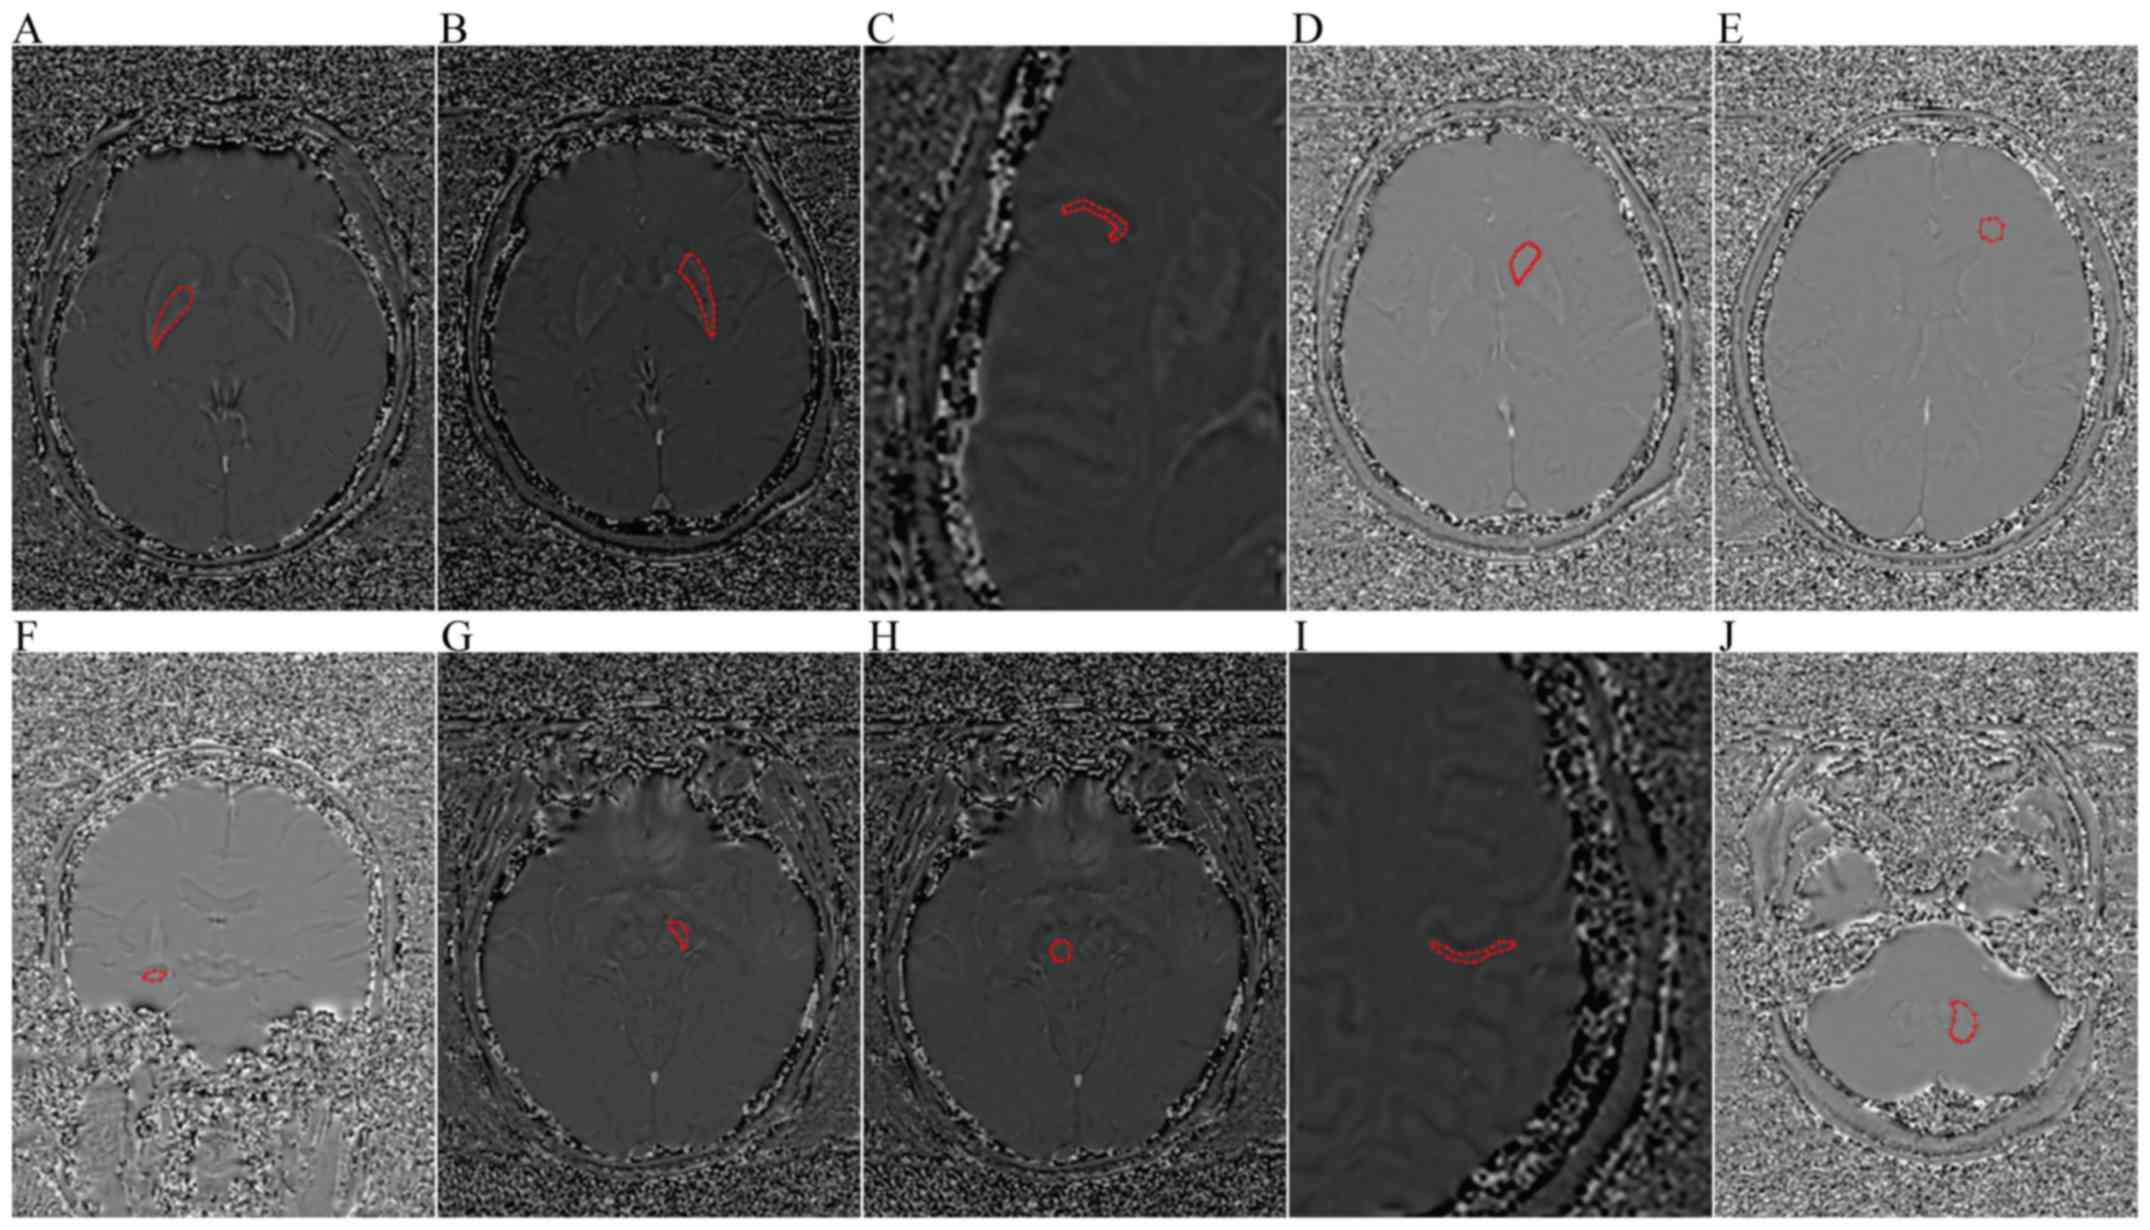 | Figure 1.Axial and coronal filtered phase image
showing the ROIs. (A) GP, (B) PUT, (C) TC, (D) CN, (E) FWM, (F) HP,
(G) SN, (H) RN, (I) PC, and (J) DN. ROIs, regions of interest; GP,
globus pallidus; PUT, putamen; TC, temporal cortex; CN, caudate
nucleus; FWM, frontal white matter; HP, hippocampus; SN, substantia
nigra; RN, red nucleus; PC, parietal cortex; DN, dentate
nucleus. |
We correlated the radian angle values for the
bilateral SN, red nucleus, DN, CN, GP, putamen, FWM, TC, and PC in
the NC group with the postmortem brain non-hemoglobin iron content
reported by Hallgren and Sourander (13) to verify our data. We also
calculated a formula between radian angle values and brain iron
content to depict their relationship. Using this formula, the phase
value was converted to the brain iron content of the corresponding
region, which could be used for the following data analysis.
Serum iron indices evaluation
After a 12-h fast, 5 ml venous blood samples were
collected and centrifuged within 10 min at 3,000 rpm. The serum
supernatant was stored at −80°C for the measurement of serum iron
parameters. Serum iron was evaluated using direct colorimetric
methods (Meikang Chemical Industries, Ningbo, China). Serum
transferrin levels were quantitatively detected using an
immunoturbidimetric assay (Siemens Healthcare Diagnostics Products
Gmb, Marburg, Germany). Serum ferritin was determined using
Chemiflex (Abbott Ireland Diagnostic Dvision, Longford, Ireland)
and total iron binding capacity was measured using ADVIA Chemistry
XPT (Siemens Healthcare Diagnostics Inc., Deerfield, IL, USA). All
levels were quantified following the manufacturer's instructions to
avoid artificial errors.
Statistical analysis
For statistical analysis, SPSS 17.0 was used. Data
were presented as mean value ± standard deviation (SD). Categorical
variables were analyzed using the Chi-square test. One-way analysis
of variance (ANOVA) model was used to compare values among three
groups using Fisher's least significant difference (LSD) test (two
sample t-test comparison). Pearson correlation coefficient was used
to analyze the relationship between quantitative variables. Because
of the large variance of serum ferritin, we used the logarithm
(base 10) of serum ferritin instead in the correlation analysis.
P-value <0.05 was considered to indicate a statistically
significant difference.
Results
Baseline characteristics of
participants
The demographics and neuropsychological data of
participants are summarized in Table
I. Sex and age among the three groups are matched. The MMSE and
Montreal Cognitive Assessment (MoCA) scores of the AD, MCI, and NC
groups increased gradually, and the difference was statistically
significant.
 | Table I.Demographics and neuropsychological
data of participants. |
Table I.
Demographics and neuropsychological
data of participants.
| Characteristics | AD | MCI | NC | F-value | P-value |
|---|
| Number | 30 | 30 | 30 |
|
|
| Sex
(female/male) | 18/12 | 13/17 | 17/13 | 1.87 | 0.39 |
| Age (years) | 74.83±4.52 | 75.2±5.75 | 72.86±5.75 | 1.74 | 0.18 |
| MMSE | 17.76±4.15 | 27.13±1.19 | 28.73±1.11 | 158.27 | <0.05a |
| MoCA | 10.86±3.62 | 20.13±3.02 | 25.40±2.01 | 184.91 | <0.05a |
Difference of phase values of ROIs
among three groups
The radian angle values of the ROIs are shown in
Table II and Fig. 2. Brain iron deposition compared
among the MCI, AD, and NC groups were as follows: The radian angle
values of the left DN, left CN, and bilateral PUT of the MCI group
were significantly lower than those of the NC group. The radian
angle values of the bilateral DN, right red nucleus, and bilateral
PUT of the AD group were significantly lower than those of the MCI
group. The radian angle values of the bilateral HP, bilateral DN,
bilateral red nucleus, bilateral CN, bilateral GP, bilateral
putamen, and left TC in the AD group were significantly lower than
those in the NC group.
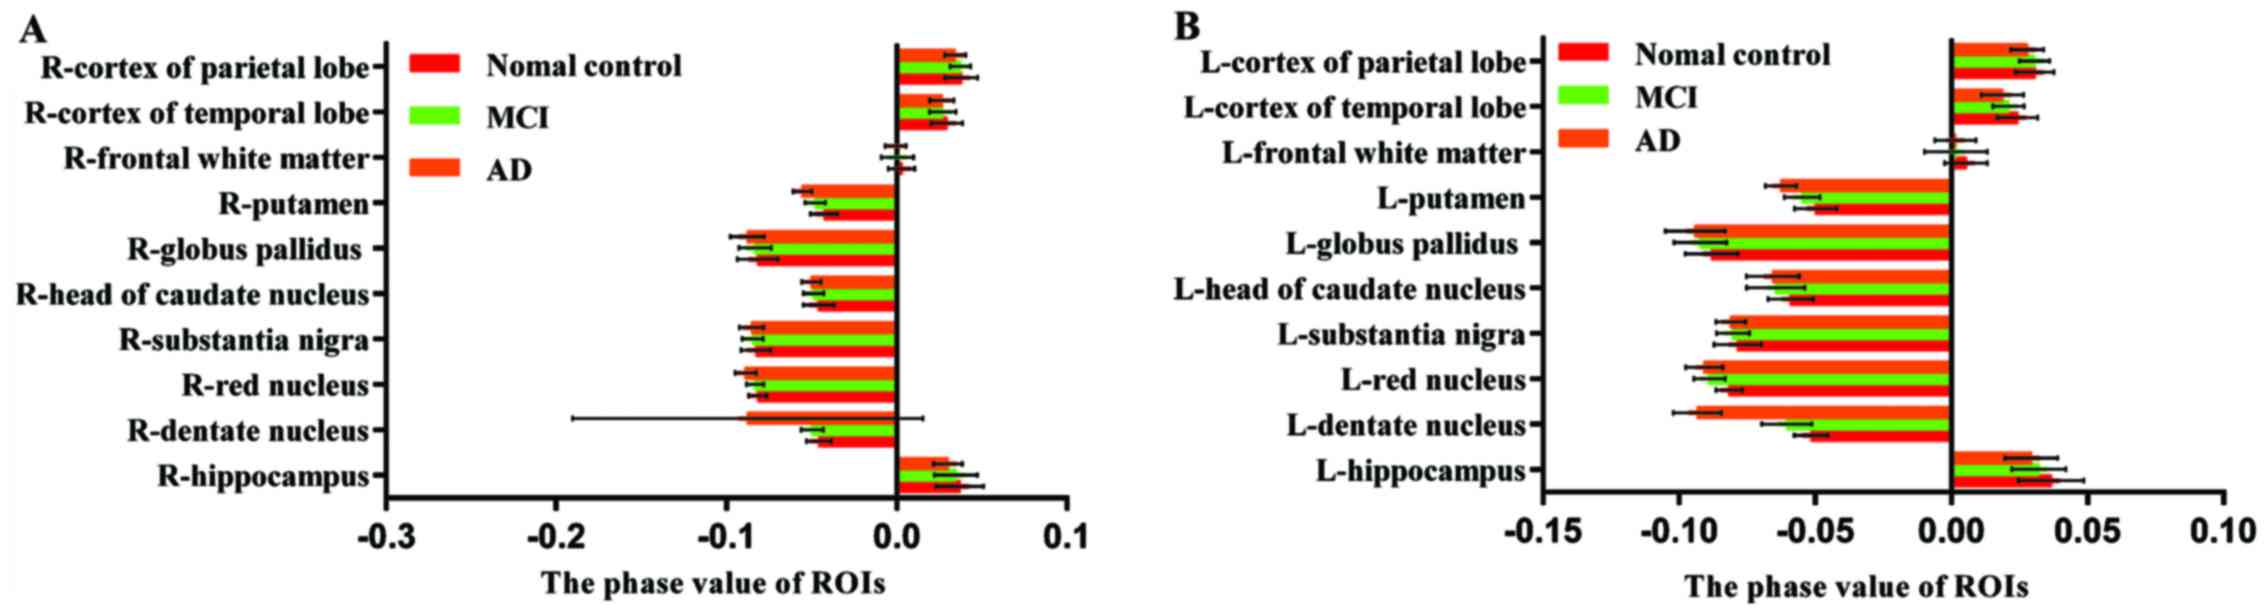 | Figure 2.(A) Radian angle values of the R-ROIs
in AD group, MCI group and NC group. (B) Radian angle values of the
L-ROIs in AD group, MCI group and NC group. The radian angle value
of L-dentate nucleus, L-caudate nucleus and bilateral putamen of
MCI group were significantly lower than those of NC group. The
radian angle value of bilateral dentate nucleus, R-red nucleus and
bilateral putamen of AD group were significantly lower than those
of MCI group. The radian angle value of bilateral HP, bilateral
dentate nucleus, bilateral red nucleus, bilateral head-caudate
nucleus, bilateral globus pallidus, bilateral putamen and L-cortex
of temporal lobe in AD group were significantly lower than those in
NC group. AD, Alzheimer's disease; MCI, mild cognitive impairment;
NC, normal control; HP, hippocampus. |
| Table II.Radian angle value of the ROIs in AD,
MCI and NC groups. |
Table II.
Radian angle value of the ROIs in AD,
MCI and NC groups.
|
|
|
|
| Comparison between
group (P) |
|---|
|
|
|
|
|
|
|---|
| ROIs | NC | MCI | AD | 12 | 23 | 13 |
|---|
| HP | R: 0.0372±0.0141 | 0.0348±0.0126 | 0.0301±0.0084 | 0.429 | 0.136 | 0.024a |
|
| L: 0.0366±0.0119 | 0.0321±0.0099 | 0.0294±0.0097 | 0.106 | 0.320 | 0.010a |
| DN | R:
−0.0456±0.0073 | −0.0497±0.0064 | −0.0876±0.0103 | 0.057 | <0.05a | <0.05a |
|
| L:
−0.0515±0.0062 | −0.0604±0.0092 | −0.0933±0.0088 | <0.05a | <0.05a | <0.05a |
| RN | R:
−0.0816±0.0053 | −0.0832±0.0051 | −0.0888±0.0063 | 0.272 | <0.05a | <0.05a |
|
| L:
−0.0868±0.0049 | −0.0889±0.0058 | −0.0907±0.0068 | 0.169 | 0.241 | 0.012a |
| SN | R:
−0.0826±0.0088 | −0.0846±0.0062 | −0.0853±0.0073 | 0.305 | 0.694 | 0.157 |
|
| L:
−0.0785±0.0087 | −0.0803±0.006 | −0.0810±0.0054 | 0.313 | 0.712 | 0.169 |
| CN | R:
−0.0459±0.0091 | −0.0488±0.0061 | −0.0501±0.0058 | 0.124 | 0.492 | 0.027a |
|
| L:
−0.0591±0.0084 | −0.0645±0.0107 | −0.0656±0.0097 | 0.032a | 0.672 | 0.011a |
| GP | R:
−0.0817±0.0119 | −0.0832±0.0095 | −0.0877±0.0099 | 0.578 | 0.100 | 0.029a |
|
| L:
−0.0881±0.0097 | −0.0922±0.0097 | −0.0941±0.0110 | 0.115 | 0.464 | 0.022a |
| PUT | R:
−0.0426±0.0079 | −0.0479±0.006 | −0.0555±0.0056 | 0.003a |
<0.05a |
<0.05a |
|
| L:
−0.0499±0.0077 | −0.0548±0.0066 | −0.0626±0.0058 | 0.006a |
<0.05a |
<0.05a |
| FWM | R:
0.0029±0.0077 | 0.0005±0.0094 | −0.0005±0.0062 | 0.242 | 0.618 | 0.097 |
|
| L:
0.0054±0.0079 | 0.0017±0.0116 | 0.0015±0.0076 | 0.122 | 0.940 | 0.106 |
| TC | R:
0.0294±0.0094 | 0.0271±0.0079 | 0.0265±0.0071 | 0.285 | 0.772 | 0.176 |
|
| L:
0.0242±0.0075 | 0.0210±0.0058 | 0.0188±0.0077 | 0.087 | 0.232 | 0.004a |
| PC | R:
0.0379±0.0098 | 0.0375±0.006 | 0.0343±0.0062 | 0.843 | 0.102 | 0.067 |
|
| L:
0.0306±0.0071 | 0.0305±0.0056 | 0.0278±0.0060 | 0.950 | 0.097 | 0.086 |
Correlations between phase values and
brain iron concentrations of NC
There is a significantly negative correlation
between the phase values of ROIs and the postmortem brain
non-hemoglobin iron content reported by Hallgren and Sourander
(13) (R=-0.9391,
P<0.05; Fig. 3A). The linear
formula is: y=-0.0063x+0.035, where y is the phase value, and × is
the brain iron concentration.
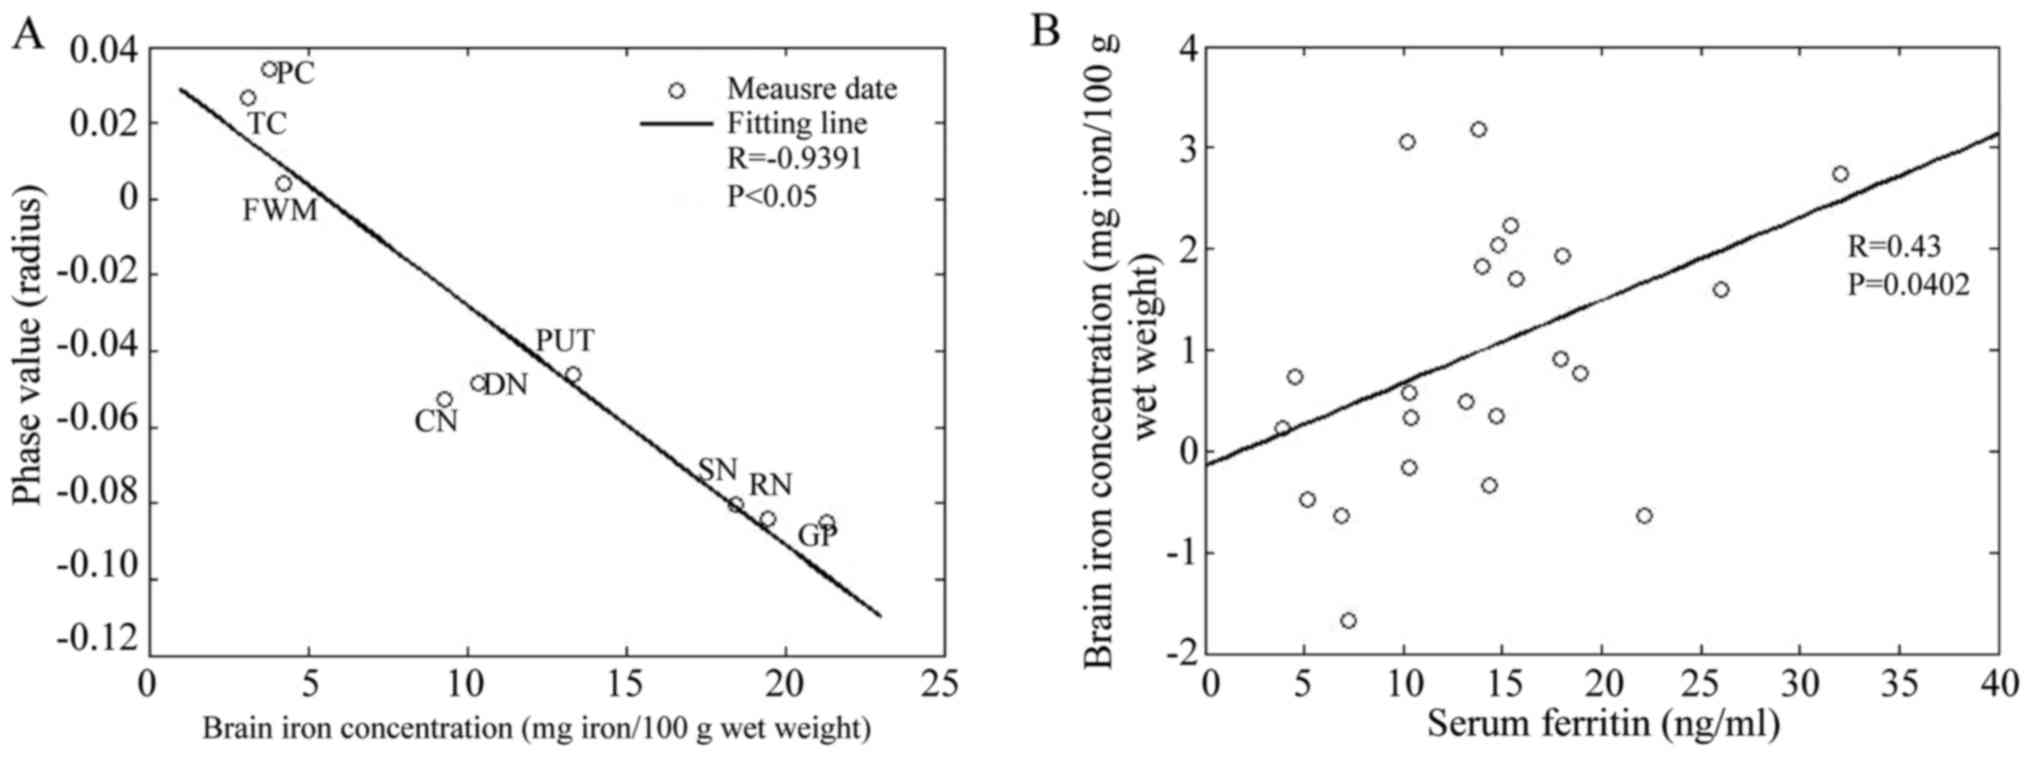 | Figure 3.(A) Correlation of phase value with
postmortem brain iron content in NC group. Plots of bilateral
average phase values for nine brain regions in NC group. (B)
Correlation of serum iron with iron of right HP in AD group. NC,
normal control; HP, hippocampus; AD, Alzheimer's disease; SN,
substantia nigra; RN, red nucleus; DN, dentate nucleus; CN, caudate
nucleus; GP, globus pallidus; PUT, putamen; FWM, frontal white
matter; TC, temporal cortex; and PC, parietal cortex. |
Difference of body iron indices among
the three groups
Table III
presents the body iron indices of the three groups. Compared with
the NC group, serum ferritin in MCI group and AD group were
significantly higher, suggesting that the patients with MCI and AD
may have body iron overload.
| Table III.Body iron indices of three
groups. |
Table III.
Body iron indices of three
groups.
|
|
|
|
| P-value |
|---|
|
|
|
|
|
|
|---|
| Body iron | NC | MCI | AD | NC vs. MCI | MCI vs. AD | NC vs. AD |
|---|
| Serum iron
(µmol/l) | 13.28±5.39 | 13.97±4.23 | 13.90±6.80 | 0.714 | 0.970 | 0.732 |
| Serum ferritin
(ng/ml) | 89.18±37.45 | 172.50±115.3 | 172.83±93.3 | 0.017a | 1.000 | 0.001a |
| Serum transferrin
(mg/ml) | 1.88±0.14 | 1.89±0.32 | 1.88±0.84 | 0.944 | 0.919 | 0.980 |
| TIBC (µmol/l) | 47.47±6.48 | 50.65±8.01 | 46.51±7.34 | 0.195 | 0.071 | 0.685 |
Correlation between body iron indices
with regional brain iron concentration in the MCI and AD
groups
The regression analyses show that only serum iron in
AD group is positively correlated with iron content in the right HP
(R=0.43, P=0.0402; Fig.
3B). No significant correlation was found between body iron
indices and iron content in the rest of the ROIs.
Discussion
An increasing number of studies are beginning to
focus on a neurotoxic role for excessive iron deposition in brain,
and their main findings include oxidative stress injury and lack of
antioxidant system induced by the accumulation of iron (14). Wu et al (15) found in 1894 that reactive oxygen
species (ROS), such as hydrogen peroxide
(H2O2), turns into the strongest oxidizing
agent, hydroxyl radical (OH), under the catalysis of free iron.
Many studies confirmed that the brain iron content of AD patients
increased, and concentrated near SPs (16,17).
Some scholars find that iron slows the progression of the amyloid
beta peptide from an unstructured conformation to the ordered
cross-β fibrils that are characteristic of amyloid, and these data
support the hypothesis that iron delays the formation of
well-ordered aggregates of Aβ and thus, promotes its toxicity in
Alzheimer disease (18). In
addition, ferric iron can bind to a particular target of Tau
protein in neurons and turn it into phosphorylated tau (P-tau),
leading to the formation of neurofibrillary tangles (NFT) (19). Ayton et al (20) analyzed CSF levels of Aβ1-42, tau,
apolipoprotein E (APOE), ferritin, factor H, and hemoglobin of
participants, and the scores for cognition were measured using the
longitudinal Rey Auditory-Visual Learning Task (RAVLT) and the AD
Assessment Scale-cognitive subset (ADAS-Cog13). They found that
ferritin levels for cognitively normal individuals were associated
with cognitive deterioration. The categorization of cognitively
normal individuals according to ε4 revealed that the ferritin level
was strongly associated with cognitive decline in ε4 carriers, and
the ε4 allele of APOE confers the greatest genetic risk for AD.
These findings demonstrate the potential for CSF ferritin as a
biomarker, especially for ε4 carriers, and provide new insight into
the pathophysiologic mechanisms of AD. In this study, we used the
SWI technique to quantitatively assess iron accumulation of ROIs in
the MCI, AD, and NC groups. The results indicated that multiple
brain areas of AD patients have brain iron overload, which is
consistent with previous studies. In addition, we found that the
iron content of the left DN, left CN, and bilateral PUT in patients
with MCI were more than those in the NC group, suggesting that
metabolic disorder of brain iron is involved in the initial stage
of dementia and may be risk factors for MCI and AD. However,
whether brain iron levels serve as a pathophysiological biomarker
for MCI and AD still need further and repeatable histological
experiments to verify.
In the brain, iron is stored in the form of
ferritin, a strong paramagnetic element that aligns along the main
magnetic field, which can cause a phase shift in the plaque voxel.
The region of the object where there is a phase difference will
then change its signal susceptibility inhomogeneities. At a given
echo time, the more iron content in the tissue, the more the phase
differs from zero. Therefore, any changes in the amount of iron
will lead to changes in the phase of the tissue relative to its
surroundings (21). There is a
high correlation between phase value of SWI and the brain iron
concentration. Previous studies have shown that there is a
significant negative correlation between the average phase values
of each ROI measured by SWI and the postmortem brain non-hemoglobin
iron content in adults reported by Hallgren and Sourander, which
was also validated by this study. SWI has been shown to be very
sensitive to iron, offering the ability to measure it on brain
tissue in vivo.
In a previous study, serum iron parameters were
determined in 818 older individuals who participated in a 3-year
randomized, placebo-controlled double blind trial; cross-sectional
linear regression analyses indicated that higher serum ferritin
levels were significantly associated with decreased cognitive
function, such as complex speed, and information-processing speed
(22). However, some scholars have
a different view. Milward et al (23) have examined the longitudinal
relationship between serum ferritin and cognition in 800
community-dwelling Australians 60 years or older. All participants
completed the Cambridge Cognitive Examination (CAMCOG) and CDR, and
no relationships were observed between serum iron or transferrin
saturation and the presence or absence of dementia. A meta-analysis
of serum metal mineral metabolism in patients with AD also showed
no change in serum iron levels in AD patients (24). The reason for this inconsistency
may be because the above studies use different neuropsychological
tests, and the cognitive domain emphasized in each test is not
consistent. Some studies revealed that, differences in body iron
levels could also be due to the different mean ages and different
sex ratios. The present study observed that compared to the NC
group, the serum ferritin levels of the MCI group and AD group were
significantly higher. Although the total iron binding capacity and
serum transferrin of MCI and AD patients were not significantly
different from those in the NC group, there was a decreasing
tendency. The serum iron levels showed an increasing tendency in
all the three groups, indicating that MCI and AD patients maybe
have systemic iron overload. The results were not statistically
significant mainly because the sample size was too small; hence, we
cannot completely reject the above conclusions. This conclusion was
not robust and constitute an important part for study, particularly
from the aspect of therapeutic interventions, such as the use of
desferrioxamine in AD patients.
Iron deposition in localized brain areas increased
abnormally in patients with MCI and AD. This was confirmed both by
this study and a previous experiment. However, the pathological
mechanisms by which brain iron accumulates are not thoroughly
explained. House et al (25) compared brain R2 values with serum
iron indices, and the results suggested that iron levels in
specific gray matter brain regions are influenced by systemic iron
status in elderly men. Some studies found that decreased serum
hepcidin levels were correlated with excessive iron accumulation in
the basal ganglia in patients with HBV-related cirrhosis (26). Other studies suggest that brain
iron concentrations in specific regions may be related to body iron
status. In this study, to investigate the possible causes of
excessive brain iron deposition in the MCI and AD groups, we
correlated the brain iron content of each ROI with serum iron,
serum ferritin, transferrin, and total iron binding capacity. The
results show that only the iron content of the right HP in the AD
group was positively correlated with serum iron level, and the iron
content of the rest of ROIs in the AD group and all ROIs in the MCI
group have no significant correlation with body iron indices. Since
only one ROI in the AD group was found to be correlated with body
iron indices, even the correlation is not very significant. Whether
brain iron deposition is determined by the system iron metabolism
in MCI and AD patients remains unclear, and requires confirmation
from further studies with large sample sizes.
References
|
1
|
Sperling RA, Aisen PS, Beckett LA, Bennett
DA, Craft S, Fagan AM, Iwatsubo T, Jack CR Jr, Kaye J, Montine TJ,
et al: Toward defining the reclinical stages of Alzheimer's
disease: Recommendations from the National Institute on
Aging-Alzhermer's Association workgroups on diagnostic guidelines
for Alzheimer's disease. Alzheimers Dement. 7:280–292. 2011.
View Article : Google Scholar : PubMed/NCBI
|
|
2
|
Albert MS, DeKosky ST, Dickson D, Dubois
B, Feldman HH, Fox NC, Gamst A, Holtzman DM, Jagust WJ, Petersen
RC, et al: The diagnosis of mild cognitive impairment due to
Alzheimer's disease: Recommendations from the National Institute on
Aging-Alzheimer's Association workgroups on diagnostic guidelines
for Alzheimer's disease. Alzheimers Dement. 7:270–279. 2011.
View Article : Google Scholar : PubMed/NCBI
|
|
3
|
McKhann GM, Knopman DS, Chertkow H, Hyman
BT, Jack CR Jr, Kawas CH, Klunk WE, Koroshetz WJ, Manly JJ, Mayeux
R, et al: The diagnosis of dementia due to Alzheimer's disease:
Recommendations from the National Institute on Aging-Alzheimer's
Association workgroups on diagnostic guidelines for Alzheimer's
disease. Alzheimers Dement. 7:263–269. 2011. View Article : Google Scholar : PubMed/NCBI
|
|
4
|
Petersen RC: Mild cognitive impairment.
Continuum (Minneap Minn). 22:404–418. 2016.PubMed/NCBI
|
|
5
|
Ota K, Oishi N, Ito K and Fukuyama H;
SEAD-J Study Group, : Alzheimer's Disease Neuroimaging Initiative:
Effects of imaging modalities, brain atlases and feature selection
on prediction of Alzheimer's disease. J Neurosci Methods.
256:168–183. 2015. View Article : Google Scholar : PubMed/NCBI
|
|
6
|
Goodman L: Alzheimer's disease; a
clinico-pathologic analysis of twenty-three cases with a theory on
pathogenesis. J Nerv Ment Dis. 118:97–130. 1953. View Article : Google Scholar : PubMed/NCBI
|
|
7
|
Honda K, Casadesus G, Petersen RB, Perry G
and Smith MA: Oxidative stress and redox-active iron in Alzheimer's
disease. Ann N Y Acad Sci. 1012:179–182. 2004. View Article : Google Scholar : PubMed/NCBI
|
|
8
|
Chamberlain R, Reyes D, Curran GL,
Marjanska M, Wengenack TM, Poduslo JF, Garwood M and Jack CR Jr:
Comparison of amyloid plaque contrast generated by T2-weighted,
T2*-weighted, and susceptibility-weighted imaging methods in
transgenic mouse models of Alzheimer's disease. Magn Reson Med.
61:1158–1164. 2009. View Article : Google Scholar : PubMed/NCBI
|
|
9
|
Zhou XX, Qin HL, Li XH, Huang HW, Liang
YY, Liang XL and Pu XY: Characterizing brain mineral deposition in
patients with Wilson disease using susceptibility-weighted imaging.
Neurol India. 62:362–366. 2014. View Article : Google Scholar : PubMed/NCBI
|
|
10
|
Crespo ÂC, Silva B, Marques L, Marcelino
E, Maruta C, Costa S, Timóteo A, Vilares A, Couto FS, Faustino P,
et al: Genetic and biochemical markers in patients with Alzheimer's
disease support a concerted systemic iron homeostasis
dysregulation. Neurobiol Aging. 35:777–785. 2014. View Article : Google Scholar : PubMed/NCBI
|
|
11
|
Petersen RC, Smith GE, Waring SC, Ivnik
RJ, Tangalos EG and Kokmen E: Mild cognitive impairment: Clinical
characterization and outcome. Arch Neurol. 56:303–308. 1999.
View Article : Google Scholar : PubMed/NCBI
|
|
12
|
Dubois B, Feldman HH, Jacova C, Dekosky
ST, Barberger-Gateau P, Cummings J, Delacourte A, Galasko D,
Gauthier S, Jicha G, et al: Research criteria for the diagnosis of
Alzheimer's disease: Revising the NINCDS-ADRDA criteria. Lancet
Neurol. 6:734–746. 2007. View Article : Google Scholar : PubMed/NCBI
|
|
13
|
Hallgren B and Sourander P: The effect of
age on the non-haemin iron in the human brain. J Neurochem.
3:41–51. 1958. View Article : Google Scholar : PubMed/NCBI
|
|
14
|
Lan AP, Chen J, Chai ZF and Hu Y: The
neurotoxicity of iron, copper and cobalt in Parkinson's disease
through ROS-mediated mechanisms. Biometals. 29:665–678. 2016.
View Article : Google Scholar : PubMed/NCBI
|
|
15
|
Wu Y, Passananti M, Brigante M, Dong W and
Mailhot G: Fe(III)-EDDS complex in Fenton and photo-Fenton
processes: From the radical formation to the degradation of a
target compound. Environ Sci Pollut Res Int. 21:12154–12162. 2014.
View Article : Google Scholar : PubMed/NCBI
|
|
16
|
Connor JR, Menzies SL, St Martin SM and
Mufson EJ: A histochemical study of iron, transferrin, and ferritin
in Alzheimer's diseased brains. J Neurosci Res. 31:75–83. 1992.
View Article : Google Scholar : PubMed/NCBI
|
|
17
|
Grundke-Iqbal I, Fleming J, Tung YC,
Lassmann H, Iqbal K and Joshi JG: Ferritin is a component of the
neuritic (senile) plaque in Alzheimer dementia. Acta Neuropathol.
81:105–110. 1990. View Article : Google Scholar : PubMed/NCBI
|
|
18
|
Liu B, Moloney A, Meehan S, Morris K,
Thomas SE, Serpell LC, Hider R, Marciniak SJ, Lomas DA and Crowther
DC: Iron promotes the toxicity of amyloid beta peptide by impeding
its ordered aggregation. J Biol Chem. 286:4248–4256. 2011.
View Article : Google Scholar : PubMed/NCBI
|
|
19
|
Egaña JT, Zambrano C, Nuñez MT,
Gonzalez-Billault C and Maccioni RB: Iron-induced oxidative stress
modify tau phosphorylation patterns in hippocampal cell cultures.
Biometals. 16:215–223. 2003. View Article : Google Scholar : PubMed/NCBI
|
|
20
|
Ayton S, Faux NG and Bush AI: Association
of cerebrospinal fluid ferritin level with preclinical cognitive
decline in APOE-ε4 carriers. JAMA Neurol. 74:122–125. 2017.
View Article : Google Scholar : PubMed/NCBI
|
|
21
|
Haacke EM, Makki M, Ge Y, Maheshwari M,
Sehgal V, Hu J, Selvan M, Wu Z, Latif Z, Xuan Y, et al:
Characterizing iron deposition in multiple sclerosis lesions using
susceptibility weighted imaging. J Magn Reson Imaging. 29:537–544.
2009. View Article : Google Scholar : PubMed/NCBI
|
|
22
|
Schiepers OJ, van Boxtel MP, de Groot RH,
Jolles J, de Kort WL, Swinkels DW, Kok FJ, Verhoef P and Durga J:
Serum iron parameters, HFE C282Y genotype, and cognitive
performance in older adults: Results from the FACIT study. J
Gerontol A Biol Med Sci. 65:1312–1321. 2010. View Article : Google Scholar
|
|
23
|
Milward EA, Bruce DG, Knuiman MW, Divitini
ML, Cole M, Inderjeeth CA, Clarnette RM, Maier G, Jablensky A and
Olynyk JK: A cross-sectional community study of serum iron measures
and cognitive status in older adults. J Alzheimers Dis. 20:617–623.
2010. View Article : Google Scholar : PubMed/NCBI
|
|
24
|
Wang ZX, Tan L, Wang HF, Ma J, Liu J, Tan
MS, Sun JH, Zhu XC, Jiang T and Yu JT: Serum iron, zinc, and copper
levels in patients with Alzheimer's disease: A replication study
and meta-analyses. J Alzheimers Dis. 47:565–581. 2015. View Article : Google Scholar : PubMed/NCBI
|
|
25
|
House MJ, St Pierre TG, Milward EA, Bruce
DG and Olynyk JK: Relationship between brain R(2) and liver and
serum iron concentrations in elder men. Magn Reson Med. 63:275–281.
2010. View Article : Google Scholar : PubMed/NCBI
|
|
26
|
Lin D, Ding J, Liu JY, He YF, Dai Z, Chen
CZ, Cheng WZ, Zhou J and Wang X: Decreased serum hepcidin
concentration correlates with brain iron deposition in patients
with HBV-related cirrhosis. PLoS One. 8:e655512013. View Article : Google Scholar : PubMed/NCBI
|


