Introduction
Pancreatic cancer is one of the most common causes
of malignancy-associated morbidities and mortalities worldwide
(1). Despite recent developments
in surgical treatments and the efficacy of chemotherapeutic agents,
the overall prognosis for patients with advanced pancreatic cancer
remains poor, whereas the survival rate has not improved in the
past few decades. This may be attributed to the asymptomatic nature
of pancreatic cancer until the advanced stages of the disease,
which constitutes a challenge for early diagnosis (2). The 5-year overall survival rate for
patients with advanced pancreatic cancer is <10% (1). In China, the 5-year survival rate in
patients with pancreatic cancer is 4.1% and the median survival
time is limited to 3.9 months (3).
Therefore, the need to identify novel prognostic biomarkers for the
detection of pancreatic cancer at an early stage is of primary
concern.
The special AT-rich sequence-binding protein 1
(SATB1) is a nuclear matrix-associated protein which is involved in
higher-order chromatin organization and in the regulation of
tissue-specific gene expression (4,5).
SATB1 is primarily expressed in thymocytes and facilitates
thymocyte development through its interaction with the
Wnt-β-catenin signaling pathway (5,6).
SATB1 has been associated with the development of several types of
cancer, including glioma, colorectal, breast, lung and kidney
cancers (7–11). Various genes that are regulated by
SATB1 have been implicated in carcinogenesis, including erbB-2,
Abelson murine leukemia viral oncogene homolog 1, matrix
metalloproteinase 2, E-cadherin, vascular endothelial growth factor
B, transforming growth factor-β1 and kisspeptin (12,13).
In addition, upregulation of SATB1 expression has been associated
with unfavorable clinicopathological features and poor patient
survival (8,10,14),
whereas SATB1 depletion has been reported to suppress the
proliferation, growth and invasion of breast cancer cells, through
the modulation of gene expression (15). Furthermore, silencing of SATB1
expression has been demonstrated to prevent tumor growth and
metastasis, whereas transduction of SATB1 into non-metastatic cells
promotes tumor invasion in mice (16). However, the effects of SATB1 on the
development and progression of pancreatic cancer have yet to be
elucidated.
In the present study, the effects of SATB1
downregulation on pancreatic cancer cell proliferation and
tumorigenic properties were investigated in vitro and in
vivo. In addition, the expression levels of SATB1 in tumor
tissue samples from patients with pancreatic cancer were detected
and association with patient survival was investigated.
Materials and methods
Cell culture and treatment
The human BxPC-3 pancreatic adenocarcinoma cell line
was purchased from American Type Culture Collection (Manassas, VA,
USA). Cells were cultured in Dulbecco's modified Eagle's medium
(DMEM; Thermo Fisher Scientific, Inc., Waltham, MA, USA)
supplemented with 10% fetal bovine serum (FBS; Thermo Fisher
Scientific, Inc.), and maintained at 37°C in a 5% CO2
atmosphere.
Patient samples
The present study was approved by the Institutional
Research Ethics Committee of the People's Hospital of Xinjiang
(Urumqi, China). Written informed consent was obtained from
patients prior to enrollment in the present study. A total of 48
patients who were admitted in People's Hospital of Xinjiang between
2013 and 2015 were included in the present study. Patient
characteristics are presented in Table
I. Patients were diagnosed with pancreatic cancer based on
histopathological examination. No patients received chemotherapy or
radiotherapy prior to surgery. Cancer tissue and adjacent normal
tissue (distance >10 cm from the primary tumor) samples were
isolated from patients who underwent tumor resection, and were
immediately frozen in liquid nitrogen and stored at −80°C. Tissue
samples were fixed in 10% neutral-buffered formalin at room
temperature for 24 h. Following fixation, tissue samples were
dehydrated by immersion in increasing concentrations of alcohol.
Alcohol was cleared with xylene and tissues were embedded in
paraffin by heating to 60°C and allowed to harden at room
temperature overnight.
 | Table I.Characteristics of patients enrolled
in the present study. |
Table I.
Characteristics of patients enrolled
in the present study.
| Characteristics | Patients |
|---|
| Age at diagnosis,
median (range) | 59 (34–77) |
| Age at time of study,
median (range) | 61 (36–79) |
| Gender |
|
| Male, n
(%) | 22 (45.8) |
| Female, n
(%) | 26 (54.2) |
| Total,
n | 48 |
| Pathology |
|
| Ductal
adenocarcinoma, n (%) | 43 (89.5) |
|
Adenocarcinoma associated with
intraductal papillary mucinous neoplasm, n (%) | 5 (10.5) |
Lentiviral transduction and stable
colony selection
For the production of the lentivirus, 1 µg control
short hairpin (sh)RNA (cat no. sc-108060; Santa Cruz Biotechnology,
Inc., Dallas, TX, USA) or SATB1-targeting shRNAs (cat no. sc-36460;
Santa Cruz Biotechnology, Inc.) were co-transfected with 1 µg
packaging plasmids (0.4 µg pMD2G and 0.6 µg psPAX2; Santa Cruz
Biotechnology, Inc.) into human 293FT cells (80% confluent) in DMEM
supplemented with 10% FBS, using Effectene transfection reagent
(Qiagen, Inc., Valencia, CA, USA) according to the manufacturer's
protocol. Lentiviral supernatants were collected 48 h
post-transfection and filtered through a 0.45 µm filter to remove
debris. BxPC-3 cells cultured in DMEM supplemented with 10% FBS
(80% confluent) were transduced at room temperature with 500 µl of
viral supernatants at a multiplicity of infection of 10, containing
4 µg/ml Polybrene transfection reagent (Sigma-Aldrich; Merck KGaA,
Darmstadt, Germany) for 18 h, and resistant colonies were selected
with 2 µg/ml puromycin (Sigma-Aldrich; Merck KGaA) for 7 days.
Successful transduction was confirmed by western blotting. Control
cells were transduced with control shRNA.
Western blot analysis
Total proteins were extracted from 200,000 BxPC-3
cells following shRNA transduction, using Laemmli SDS reducing
buffer (50 mM Tris-HCl pH 6.8, 2% SDS and 10% glycerol) at 4°C,
boiled and quantified using a bicinchoninic acid protein assay.
Equal amounts (30 µg) of extracted protein samples were resolved by
8–10% PAGE and transferred onto polyvinylidene difluoride
membranes. The membranes were blocked with 3% milk at room
temperature for 1 h, incubated with primary antibodies against
SATB1 (cat no. ab92307; 1:1,000; Abcam, Cambridge, UK) and GAPDH
(cat no. 2118; 1:2,000; Cell Signaling Technology, Inc., Danvers,
MA, USA) for 1 h at room temperature, followed by incubation with
horseradish peroxidase-conjugated goat anti-rabbit secondary
antibody (cat no. sc-2030, Santa Cruz Biotechnology, Inc.) at a
dilution of 1:5,000 at room temperature for 1 h. Protein bands were
visualized by enhanced chemiluminescence using the SuperSignal West
Pico or Femto Chemiluminescent Substrate kits (Thermo Fisher
Scientific, Inc.). Blots were semi-quantified using ImageJ software
version 1.41 (National Institutes of Health, Bethesda, MD, USA)
(17).
Cell proliferation assay
BxPC-3 cells stably expressing control shRNA or
SATB1 shRNA were seeded in DMEM supplemented with 10% FBS at a
density of 10,000 cells/well in 6-well plates in triplicate on day
0. Cells were trypsinized and counted using a TC20 Automated Cell
Counter (Bio-Rad Laboratories, Inc., Hercules, CA, USA) on days 0,
1, 2 and 3. Each experiment was performed twice using cells from
different suspensions.
Colony formation assay
BxPC-3 cells stably expressing control shRNA or
SATB1 shRNA were seeded in 6-well plates at a density of 1,000
cells/well and cultured in DMEM supplemented with 10% FBS at 37°C.
Cells were cultured for 1 week and then washed three times with
PBS, fixed in 4% paraformaldehyde for 15 min, and stained with 0.1%
crystal violet for 30 min at room temperature. Subsequently, the
colonies (diameter, >1 mm) were carefully washed with PBS until
the background was clear and visualized under an optical
microscope. Colony formation efficiency was calculated as the
number of colonies divided by 1,000 and normalized to control shRNA
infected cells using ImageJ software verson 1.41.
Soft agar assay
BxPC-3 cells (1,000 cells) stably expressing control
shRNA or SATB1 shRNA were suspended in 0.375% Noble agar (Difco; BD
Biosciences, Franklin Lakes, NJ, USA) in DMEM supplemented with 10%
FBS and overlaid on 0.75% Noble agar in 24-well plates. Colonies
were allowed to grow for 7–10 days in the growth medium. Colony
formation efficiency was calculated according to the following
formula: Colony formation efficiency=(mean number of
colonies/well)/(number of seeded cells/well). Colonies with a
diameter >0.1 mm were measured and counted, and the mean was
used. Data was expressed as fold-change compared to cells
expressing the control vector. GraphPad Prism software version 5
(GraphPad Software, Inc., La Jolla, CA, USA) was used for
analysis.
Matrigel invasion assay
A total of 105 BxPC-3 cells stably
expressing control shRNA or SATB1 shRNA were serum-starved
overnight, suspended in DMEM and plated into the upper chambers of
8.0-µm pore Transwell inserts which were coated with 400 µg/ml
Matrigel (BD Biosciences). A total of 500 µl medium supplemented
with 10% FBS was added to the lower chambers as a chemoattractant.
Cells were incubated at 37°C for 24 h. Non-migrated cells on the
top of the membrane were removed using cotton swabs, and cells that
had migrated to the lower membrane were stained with 6%
glutaraldehyde/0.5% crystal violet solution at room temperature for
30 min. Experiments were performed in triplicate. Invaded cells
were visualized under an optical microscope, and counted using
ImageJ software (17), by
averaging the number of stained cells/field of view in 5 random
fields/chamber.
IHC
Paraffin-embedded tumor and adjacent normal 5-µm
thick tissue sections were subjected to antigen retrieval by
heating in a microwave at 100°C for 10 min in 0.1 M citric acid
buffer (pH 6.0), deparaffinized in xylene and rehydrated in graded
ethanol. Endogenous peroxidase activity was blocked with 3%
hydrogen peroxide for 1 h at room temperature, following
permeabilization with ice-cold 100% methanol for 10 min at −20°C
and rinsed in PBS for 5 min. Sections were then incubated with an
anti-SATB1 antibody (1:200; cat no. ab92307; Abcam) at 4°C
overnight. Following incubation with HRP-conjugated secondary
antibodies (cat no. BA-1000; 1:200; Vector Laboratories, Inc.,
Burlingame, CA, USA) at room temperature for 1 h, the slides were
developed in 0.05% 3,3′-diaminobenzidine (Vector Laboratories,
Inc.) containing 0.01% hydrogen peroxide at room temperature for 1
min. As a negative control, sections were incubated with normal
goat serum (Invitrogen; Thermo Fisher Scientific, Inc.), instead of
primary antibodies, at 4°C overnight. The density of the staining
was ranked as follows: 0, no staining; 1, mild staining; 2,
moderate staining; and 3, intense staining. The extent of staining
was scored as follows: 0, no positive cells; 1, positive cells
cover <10% of total area; 2, positive cells cover 10–50% of
total area; and 3, positive cells cover >50% of total area. The
final staining score was obtained by multiplying the intensity
score with the extent score. The samples were classified into 2
groups according to the final score: Low (0–4) and high (5–9).
Mouse xenografts
Animal experiments were approved by the
Institutional Animal Care and Use Committee of the National Cancer
Center (Urumqi, China). BXPC-3 cells expressing control shRNA or
SATB1 shRNA (3×10⁶ cells/injection) were subcutaneously
injected into both flanks of 10 female nude mice (age, 6 weeks;
weight, ~25 g). The mice were purchased from the Chinese University
of Hong Kong (Hong Kong, China) and maintained in individually
ventilated cages under a 12-h light/dark cycle at 20–22°C and
40–60% relative humidity with free access to food and water.
Between days 8 to 26 post-implantation, tumor volumes were measured
using a caliper according to the following formula: Tumor volume
(mm3)=tumor length × (tumor width)2/2]. Data
were expressed as the mean tumor volume ± standard deviation. Mice
were sacrificed 26 days post-implantation by CO2
inhalation.
RNA isolation and reverse
transcription-quantitative polymerase chain reaction (RT-qPCR)
Total RNA was extracted from cancer tissue and
paired normal mucosal tissue samples isolated from 48 patients with
pancreatic cancer using TRIzol® (Invitrogen; Thermo
Fisher Scientific, Inc.), according to the manufacturer's protocol.
Total RNA (1 µg) was reverse transcribed into cDNA using RevertAid™
First Strand cDNA Synthesis kit (Thermo Fisher Scientific, Inc.).
The reaction volume was 20 µl and contained 1 µg RNA and 1 µl dT
primer, 4 µl reaction buffer, 2 µl dNTP, 0.5 µl inhibitor and 0.5
µl reverse transcriptase. The temperature protocol was as follows:
At 65°C for 10 min, at 25°C for 10 min, at 55°C for 30 min, and
then at 85°C for 5 min. PCR was performed on cDNA using a ViiA™ 7
Real-Time PCR system (Applied Biosystems; Thermo Fisher Scientific,
Inc.) with SYBR® Premix DimerEraser™ (Takara Bio, Inc.,
Otsu, Japan) according to the manufacturer's protocol. Each
experiment was performed in triplicate. Primer sequences were as
follows: SABT1, forward 5′-AAAAGAAATCGGACCACCAAGC-3′, reverse
5′-TGTGGTACGGAGCTGATCG-3′; and GAPDH, forward
5′-GGCCAAGGTCATCCATGACAA-3′ and reverse
5′-TCTTCTGACACCTACCGGGGA-3′. Thermocycling conditions were as
follows: Initial denaturation at 95°C for 2 min, followed by 40
cycles at 95°C for 10 sec, and at 60°C for 30 sec, with an
extension at 72°C for 30 sec. The specificity of the amplification
products was confirmed by the exhibition of a singlet in the
melting curve and gene expression was quantified according to the
comparative Cq method (18).
Statistical analysis
Data are expressed as the mean ± standard deviation
of 3 independent experiments. Data were analyzed using one-way
analysis of variance (ANOVA) or mixed-factorial ANOVA, where
appropriate. Multiple comparisons were then further investigated
using Tukey post hoc test. P<0.05 was considered to indicate a
statistically significant difference. Survival curves were
constructed using the Kaplan-Meier method and compared using
log-rank test. Statistical analyses were performed using SPSS
software version 16 (SPSS, Inc., Chicago, IL, USA) and GraphPad
Prism software version 5.0 (GraphPad Software, Inc., La Jolla, CA,
USA).
Results
SATB1 knockdown inhibits the
proliferation and suppresses the clonogenicity of pancreatic cancer
cells
To examine the functions of SATB1 on pancreatic
cancer cell growth, stable SATB1-knockdown BxPC-3 cells were
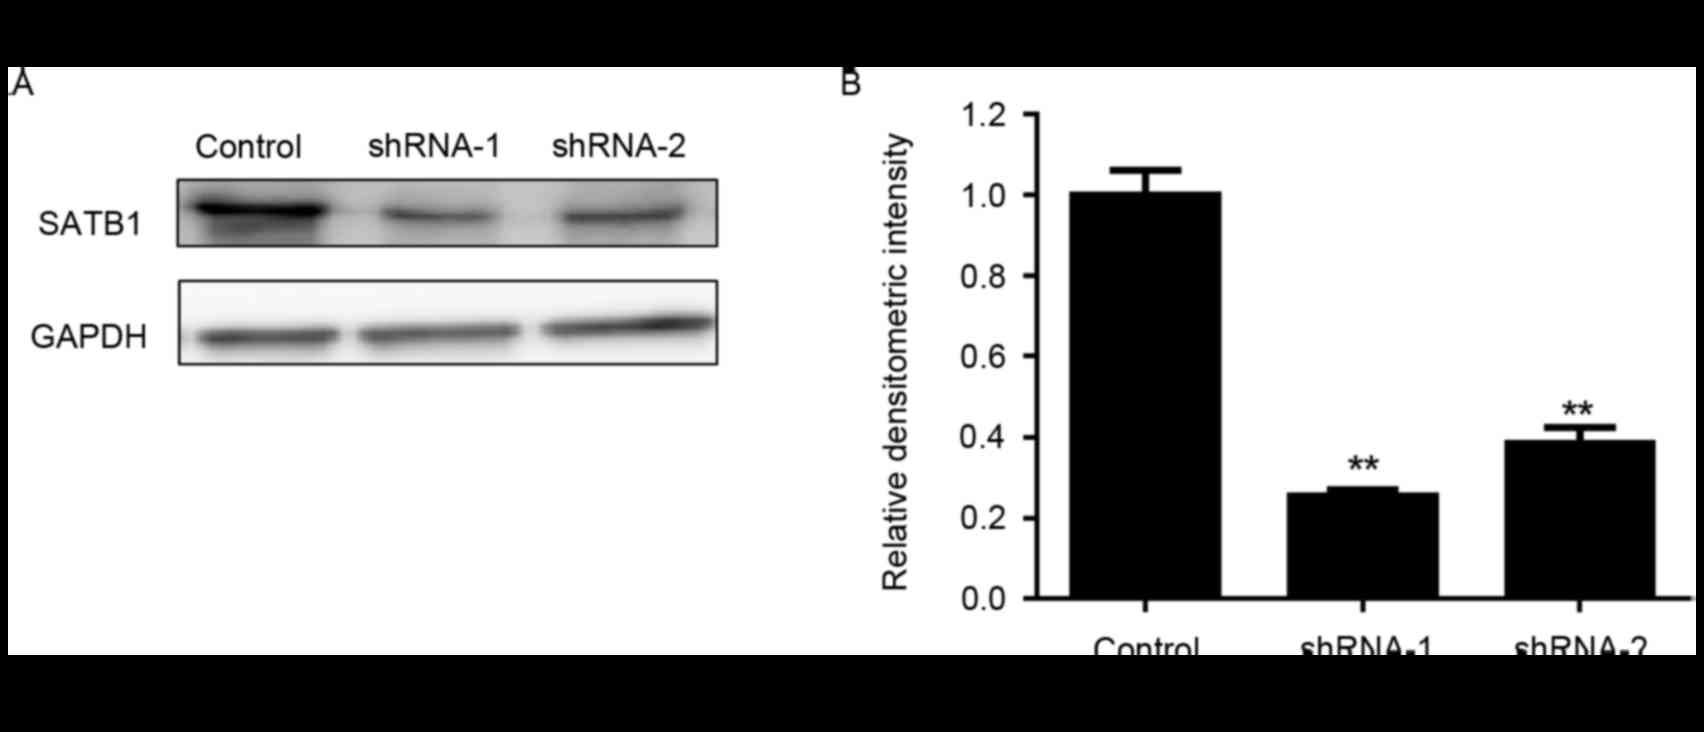
established using RNA interference. As presented in Fig. 1, following transduction with 2
independent shRNAs targeting SATB1, the protein expression levels
of SATB1 in BxPC-3 cells were significantly downregulated.
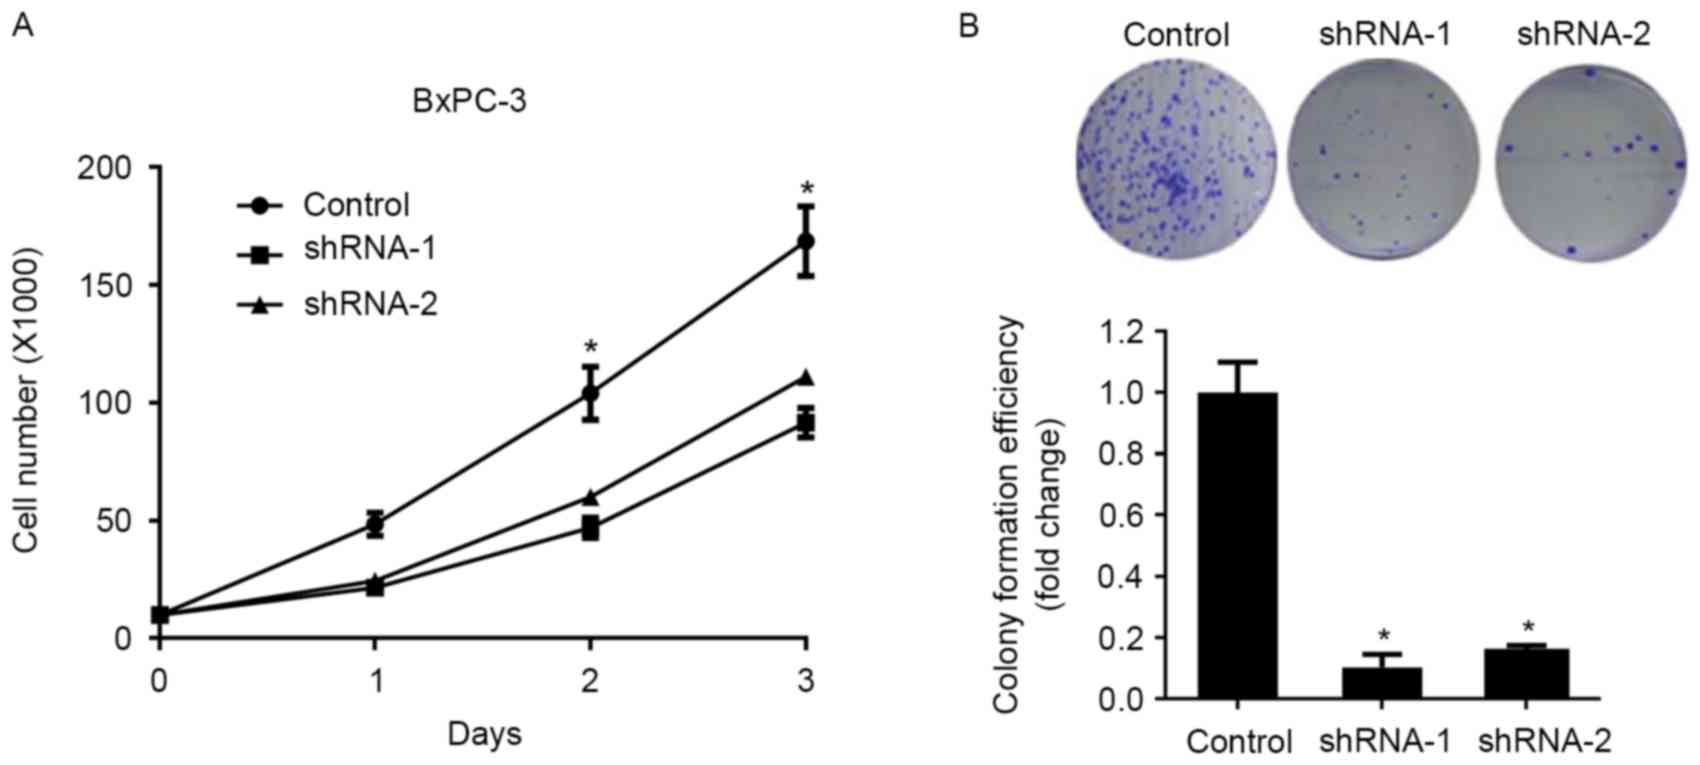
Knockdown of SATB1 expression significantly inhibited the
proliferation of BxPC-3 cells compared with control cells, as
demonstrated by a cellular proliferation assay (Fig. 2A). In addition, BxPC-3 cells
transduced with SATB1-specific shRNAs exhibited significantly
suppressed colony formation capabilities (Fig. 2B), thus suggesting that SATB1 may
enhance the proliferation and clonogenicity of pancreatic cancer
cells.
SATB1 knockdown suppresses the
anchorage-independent growth and invasion of pancreatic cancer
cells
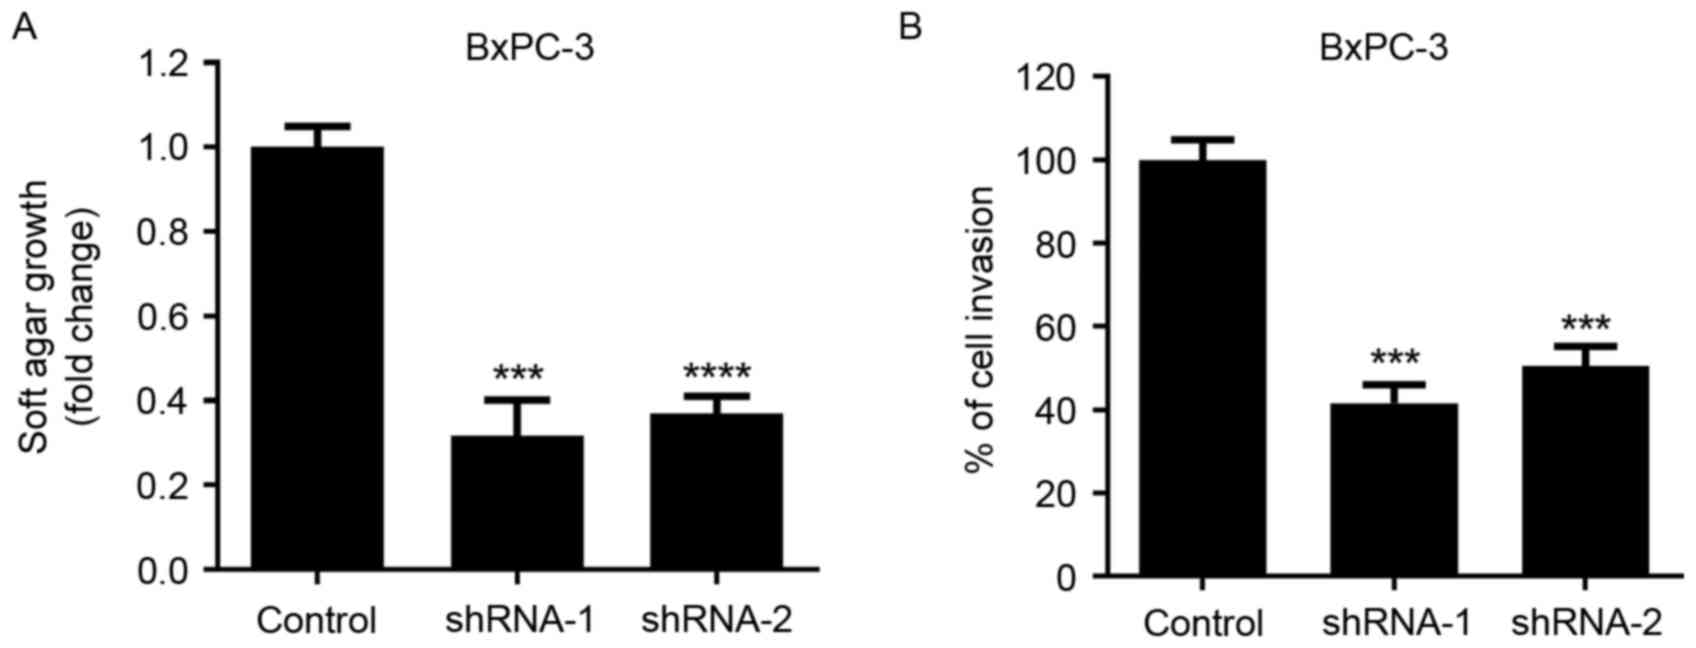
Soft agar growth and Matrigel invasion assays were
performed to evaluate the effects of SATB1 knockdown on the
tumorigenic properties of pancreatic cancer cells. As presented in
Fig. 3, following the
downregulation of SATB1 expression, the anchorage-independent
growth of BxPC-3 cells was significantly inhibited. In addition,
the invasive capabilities of cancer cells were significantly
reduced following SATB1 shRNA transduction, as demonstrated by the
Matrigel invasion assay.
SATB1 knockdown inhibits tumor growth
in a pancreatic cancer xenograft mouse model
To investigate the effects of SATB1 on pancreatic
cancer cell growth in vivo, a mouse xenograft model was
established following the subcutaneous injection of BxPC-3 cells
expressing control shRNA or SATB1 shRNA-1 into nude mice. Tumor
growth was monitored for 26 days post-xenotransplantation. As
demonstrated in Fig. 4, SATB1
downregulation significantly reduced the weight and growth rate of
tumor xenografts in vivo. These findings suggested that
SATB1 may serve a role in promoting tumor growth in
vivo.
SATB1 expression is upregulated in
pancreatic cancer tissues and is associated with poor
prognosis
Pancreatic cancer tissue and matched non-cancerous
adjacent tissue samples were isolated from 48 patients with
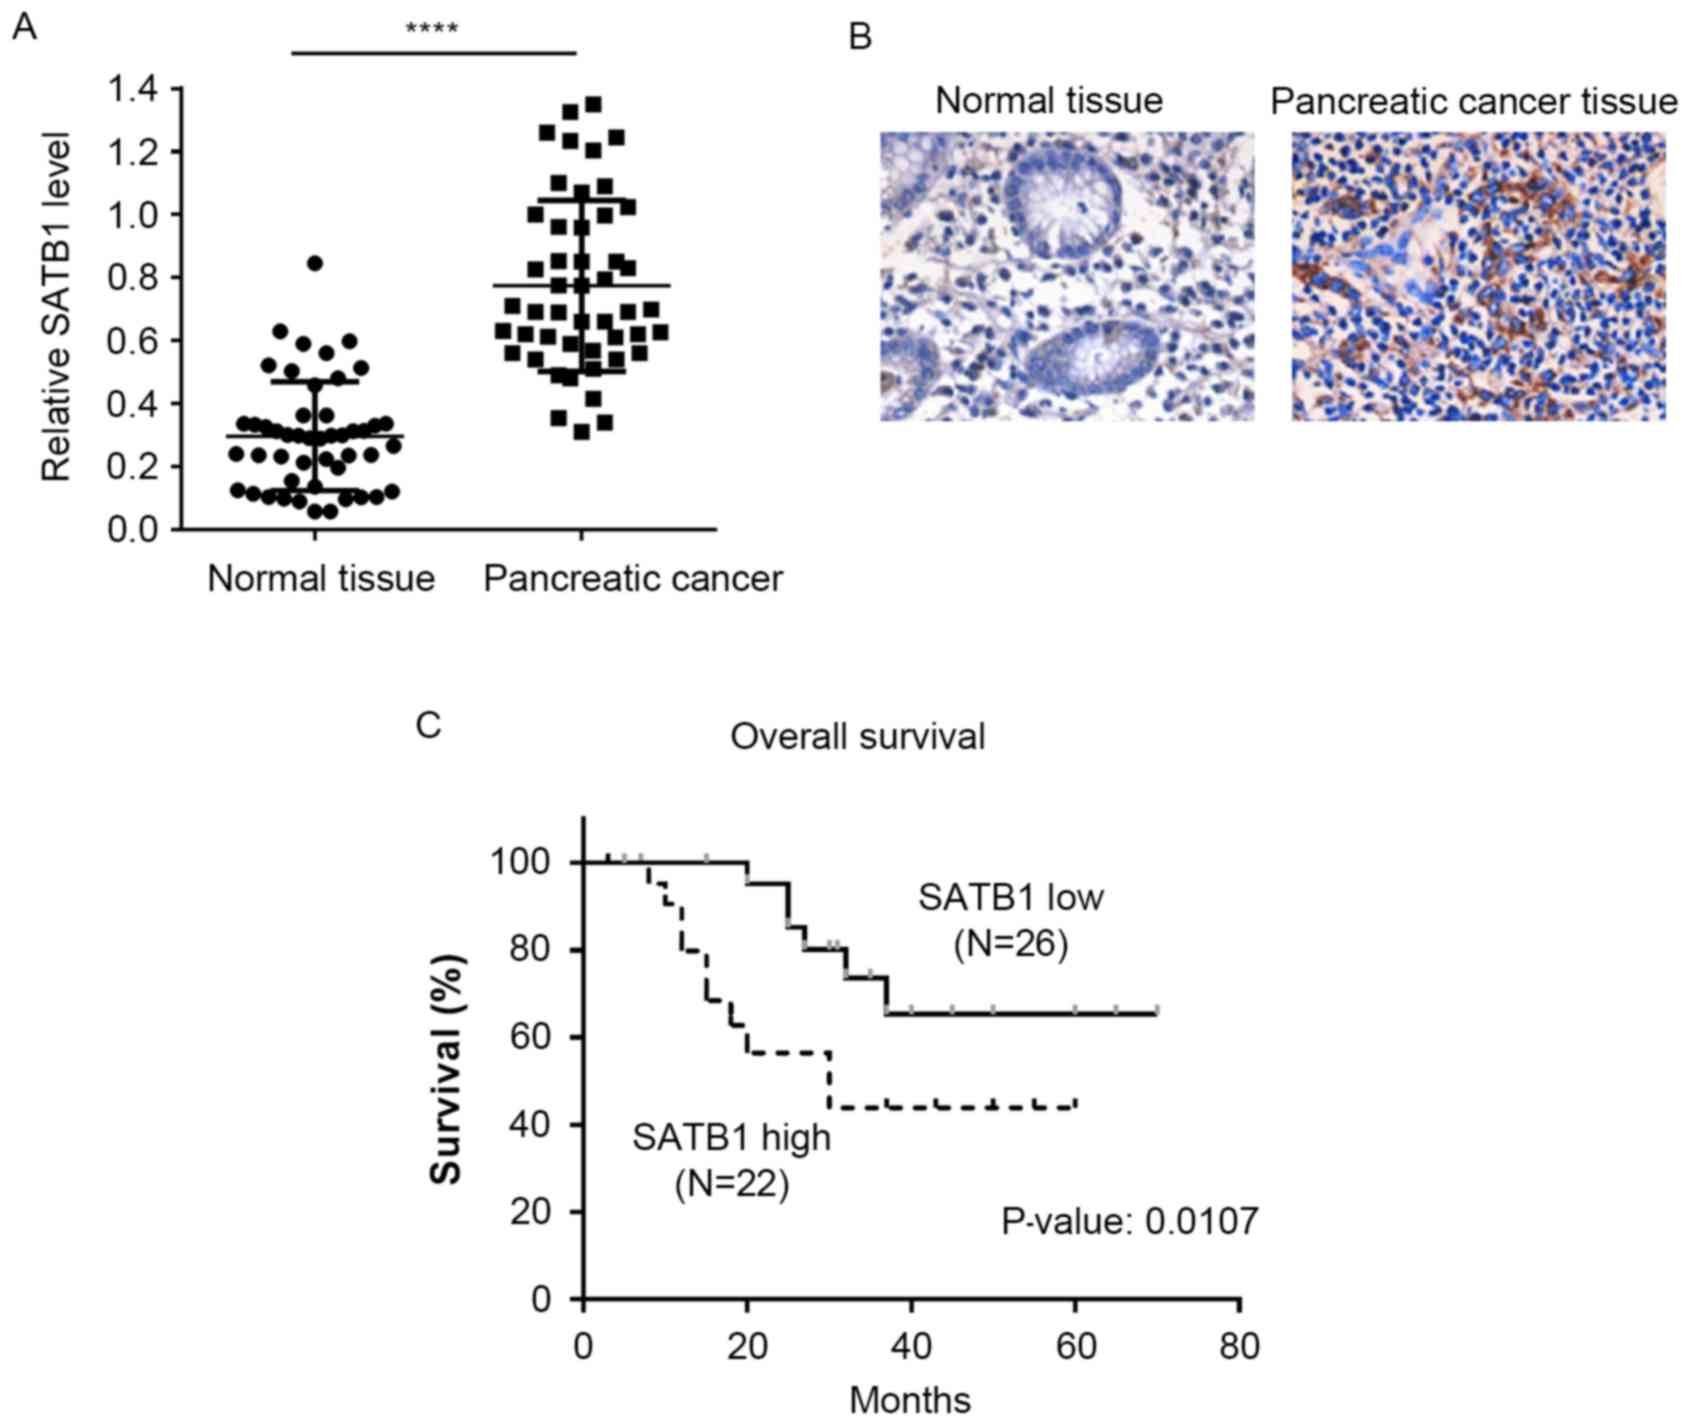
pancreatic cancer. Semi-quantitative RT-PCR demonstrated that the
mRNA expression levels of SATB1 were significantly upregulated in
pancreatic cancer tissues compared with in matched control samples
(Fig. 5A). In addition, IHC
results revealed that pancreatic cancer tissues exhibited stronger
SATB1 staining compared with non-cancerous tissue samples (Fig. 5B). The patient cohort was divided
into low and high SATB1 expression groups according to the IHC
scoring, and a Kaplan-Meier survival analysis was performed. As
presented in Fig. 5C, patients
with high SATB1 expression had significantly shorter overall
survival times compared with patients with low SATB1 expression
scores.
Discussion
Pancreatic cancer is one of the most malignant types
of cancer, and is characterized by a high incidence of metastasis
and a low 5-year survival rate. Platinum-based antineoplastic drugs
or paclitaxel combination chemotherapy are the standard regimens
used for the treatment of pancreatic cancer; however, the
recurrence rate of the disease remains as high as 85% (2) Therefore, the need to identify novel
therapeutic targets for the treatment of pancreatic cancer is of
primary concern.
SATB1 has been suggested to regulate gene expression
by selectively tethering far-distal specialized DNA sequences to
its cage-like network, and scaffolding them with
chromatin-modifying and transcription factors in order to
accurately modulate gene expression (19,20).
Previous studies have reported that SATB1 is overexpressed in
metastatic breast cancer cell lines and in tissue specimens
isolated from patients with metastatic breast carcinoma (21,22).
Depletion of SATB1 has been demonstrated to suppress cancer cell
growth and inhibit tumor metastasis, whereas its overexpression
promotes tumor growth and lung colonization in breast cancer
(15). A previous study reported
that transient silencing of SATB1 expression inhibits the
proliferation and invasion of small cell lung cancer cells
(23). However, the effects of
SATB1 downregulation on pancreatic cancer tumorigenesis have yet to
be elucidated.
In the present study, stable downregulation of SATB1
expression using RNA interference significantly inhibited the
proliferative, colony formation and invasive capabilities of BxPC-3
cells, and suppressed soft agar growth. In addition, SATB1
knockdown repressed tumor growth in a xenograft mouse model. SATB1
may be implicated in pancreatic tumorigenesis through the
regulation of several genes known to be involved in carcinogenesis;
however, further studies are required to investigate the molecular
mechanisms and downstream effectors of SATB1 that are involved in
the development of pancreatic cancer. Pan et al (24) reported that high SATB1 expression
is significantly correlated with the progression and metastasis of
breast cancer, and thus with poor disease prognosis. Similarly, in
the present study, SATB1 expression was revealed to be
significantly upregulated in pancreatic cancer tissues compared
with in matched non-cancerous adjacent tissues. Notably,
Kaplan-Meier survival analysis revealed that high SATB1 expression
was significantly associated with decreased patient survival, thus
suggesting that SATB1 may have potential as a prognostic biomarker
for patients with pancreatic cancer.
In conclusion, the results of the present study
suggested that SATB1 may be implicated in pancreatic tumorigenesis.
SATB1 was revealed to be significantly upregulated in pancreatic
cancer tissues and was associated with poor survival of patients
with pancreatic cancer. Therefore, SATB1 may have potential as a
novel therapeutic target for the treatment of patients with
pancreatic cancer, and as a biomarker for disease prognosis.
However, further studies are required to fully elucidate the
molecular mechanisms that underlie the implication of SATB1 in
promoting pancreatic cancer progression.
Acknowledgements
The present study was supported by the People's
Hospital of Xinjiang, Urumqi, China (grant no. 829020801).
References
|
1
|
Siegel RL, Miller KD and Jemal A: Cancer
statistics, 2016. CA Cancer J Clin. 66:7–30. 2016. View Article : Google Scholar : PubMed/NCBI
|
|
2
|
Kaur S, Baine MJ, Jain M, Sasson AR and
Batra SK: Early diagnosis of pancreatic cancer: Challenges and new
developments. Biomark Med. 6:597–612. 2012. View Article : Google Scholar : PubMed/NCBI
|
|
3
|
Luo J, Xiao L, Wu C, Zheng Y and Zhao N:
The incidence and survival rate of population-based pancreatic
cancer patients: Shanghai cancer registry 2004–2009. PLoS One.
8:e760522013. View Article : Google Scholar : PubMed/NCBI
|
|
4
|
Nakayama Y, Mian IS, Kohwi-Shigematsu T
and Ogawa T: A nuclear targeting determinant for SATB1, a genome
organizer in the T cell lineage. Cell Cycle. 4:1099–1106. 2005.
View Article : Google Scholar : PubMed/NCBI
|
|
5
|
Cai S, Han HJ and Kohwi-Shigematsu T:
Tissue-specific nuclear architecture and gene expression regulated
by SATB1. Nat Genet. 34:42–51. 2003. View
Article : Google Scholar : PubMed/NCBI
|
|
6
|
Notani D, Gottimukkala KP, Jayani RS,
Limaye AS, Damle MV, Mehta S, Purbey PK, Joseph J and Galande S:
Global regulator SATB1 recruits beta-catenin and regulates T(H)2
differentiation in Wnt-dependent manner. PLoS Biol. 8:e10002962010.
View Article : Google Scholar : PubMed/NCBI
|
|
7
|
Nodin B, Johannesson H, Wangefjord S,
O'Connor DP, Lindquist KE, Uhlén M, Jirström K and Eberhard J:
Molecular correlates and prognostic significance of SATB1
expression in colorectal cancer. Diagn Pathol. 7:1152012.
View Article : Google Scholar : PubMed/NCBI
|
|
8
|
Zheng J: Is SATB1 a master regulator in
breast cancer growth and metastasis? Womens Health (Lond).
4:329–332. 2008. View Article : Google Scholar : PubMed/NCBI
|
|
9
|
Selinger CI, Cooper WA, Al-Sohaily S,
Mladenova DN, Pangon L, Kennedy CW, McCaughan BC, Stirzaker C and
Kohonen-Corish MR: Loss of special AT-rich binding protein 1
expression is a marker of poor survival in lung cancer. J Thorac
Oncol. 6:1179–1189. 2011. View Article : Google Scholar : PubMed/NCBI
|
|
10
|
Chu SH, Ma YB, Feng DF, Zhang H, Zhu ZA,
Li ZQ and Jiang PC: Upregulation of SATB1 is associated with the
development and progression of glioma. J Transl Med. 10:1492012.
View Article : Google Scholar : PubMed/NCBI
|
|
11
|
Cheng C, Wan F, Liu L, Zeng F, Xing S, Wu
X, Chen X and Zhu Z: Overexpression of SATB1 is associated with
biologic behavior in human renal cell carcinoma. PLoS One.
9:e974062014. View Article : Google Scholar : PubMed/NCBI
|
|
12
|
Kohwi-Shigematsu T, Poterlowicz K,
Ordinario E, Han HJ, Botchkarev VA and Kohwi Y: Genome organizing
function of SATB1 in tumor progression. Semin Cancer Biol.
23:72–79. 2013. View Article : Google Scholar : PubMed/NCBI
|
|
13
|
Mir R, Pradhan SJ and Galande S: Chromatin
organizer SATB1 as a novel molecular target for cancer therapy.
Semin Cancer Biol. 13:1603–1615. 2012.
|
|
14
|
Deng YF, Zhou DN, Pan ZY and Yin P:
Aberrant SATB1 expression is associated with Epstein-Barr virus
infection, metastasis and survival in human nasopharyngeal cells
and endemic nasopharyngeal carcinoma. Int J Clin Exp Pathol.
7:2454–2461. 2014.PubMed/NCBI
|
|
15
|
Han HJ, Russo J, Kohwi Y and
Kohwi-Shigematsu T: SATB1 reprogrammes gene expression to promote
breast tumour growth and metastasis. Nature. 452:187–193. 2008.
View Article : Google Scholar : PubMed/NCBI
|
|
16
|
Neznanov N, Kohwi-Shigematsu T and Oshima
RG: Contrasting effects of the SATB1 core nuclear matrix attachment
region and flanking sequences of the keratin 18 gene in transgenic
mice. Mol Biol Cell. 7:541–552. 1996. View Article : Google Scholar : PubMed/NCBI
|
|
17
|
Schneider CA, Rasband WS and Eliceiri KW:
NIH Image to ImageJ: 25 years of image analysis. Nat Methods.
9:671–675. 2012. View Article : Google Scholar : PubMed/NCBI
|
|
18
|
Livak KJ and Schmittgen TD: Analysis of
relative gene expression data using real-time quantitative PCR and
the 2(-Delta Delta C(T)) method. Methods. 25:402–408. 2001.
View Article : Google Scholar : PubMed/NCBI
|
|
19
|
Cai S, Lee CC and Kohwi-Shigematsu T:
SATB1 packages densely looped, transcriptionally active chromatin
for coordinated expression of cytokine genes. Nat Genet.
38:1278–1288. 2006. View
Article : Google Scholar : PubMed/NCBI
|
|
20
|
Yamaguchi H, Tateno M and Yamasaki K:
Solution structure and DNA-binding mode of the matrix attachment
region-binding domain of the transcription factor SATB1 that
regulates the T-cell maturation. J Biol Chem. 281:5319–5327. 2006.
View Article : Google Scholar : PubMed/NCBI
|
|
21
|
Hanker LC, Karn T, Mavrova-Risteska L,
Ruckhäberle E, Gaetje R, Holtrich U, Kaufmann M, Rody A and
Wiegratz I: SATB1 gene expression and breast cancer prognosis.
Breast. 20:309–313. 2011. View Article : Google Scholar : PubMed/NCBI
|
|
22
|
Patani N, Jiang W, Mansel R, Newbold R and
Mokbel K: The mRNA expression of SATB1 and SATB2 in human breast
cancer. Cancer Cell Int. 9:182009. View Article : Google Scholar : PubMed/NCBI
|
|
23
|
Huang B, Zhou H, Wang X and Liu Z:
Silencing SATB1 with siRNA inhibits the proliferation and invasion
of small cell lung cancer cells. Cancer Cell Int. 13:82013.
View Article : Google Scholar : PubMed/NCBI
|
|
24
|
Pan Z, Jing W, He K, Zhang L and Long X:
SATB1 is correlated with progression and metastasis of breast
cancers: A meta-analysis. Cell Physiol Biochem. 38:1975–1983. 2016.
View Article : Google Scholar : PubMed/NCBI
|


