Introduction
Osteoporosis (OP) is a common metabolic skeletal
disease that is characterized by microarchitectural deterioration
of bone tissues and reduced bone mineral density (1). An imbalance in the regulation of bone
remodeling results in increased bone fragility and enhanced
fracture risk (2). Postmenopausal
bone loss is a major determining factor of OP and is a worldwide
health problem. In addition, advanced age, sex and immobilization
are also main risk factors for developing OP (3). Postmenopausal OP (PMOP) is one of the
two types of OP, and may develop as a direct result from the
reduced endogenous estrogen levels in menopausal women (4,5).
Worldwide, PMOP affects thousands of women >50 years old and
costs healthcare systems large sums of money, which may lead to an
increase in economic and social burdens (6,7).
Therefore, studies on PMOP-related mechanisms are urgently needed
and relevant.
Numerous factors serve important roles in the
etiology of PMOP. In addition to calcium, estrogen and
environmental factors, previous studies have reported that there
are strong genetic effects on the pathogenesis of OP in
postmenopausal women (8–10). For example, certain polymorphisms
in a set of genes have been revealed to be associated with Chinese
women with PMOP, such as estrogen receptor 2 (11), osteoprotegerin (OPG) (12). In addition, several pathways have
been identified to be related with PMOP development. Wnt/β-catenin
pathway serves an important role in PMOP by changing the ratio of
receptor activator of nuclear factor-κB (NF-κB) ligand/OPG and
altering bone turnover (13). One
study demonstrated the therapeutic potential of resveratrol
treatment against PMOP through osteoblast differentiation via
sirtuin 1/NF-κB signaling (14).
However, the molecular mechanisms underlying PMOP remain
unclear.
Gene expression profiles in DNA microarrays have
provided key biosignatures of PMOP. Therefore, an increasing number
of investigators use bioinformatics approaches to study the
microarray profiles of PMOP to explore molecular mechanism
underlying PMOP. A microarray profile of PMOP (E-MEXP-1618) was
deposited by Reppe et al (15), who detected a set of genes that
were highly associated with bone mineral density in relation to
PMOP. A 2015 study that used this same data identified 482
differentially expressed genes (DEGs) that exhibited a close
relationship with PMOP, such as SMAD family member 4, calcium
channel voltage-dependent γ1 and tripartite motif containing 63
(16). Many of the previous
studies related to the genetics of PMOP have focused on a single
gene or a single pathway; however, different pathways have
crosstalk with each other, and the deregulation of one pathway may
affect the activity of another. Understanding the interactions
among and between pathways may provide information for the further
exploration of the pathogenesis of PMOP.
Therefore, the present study aimed to explore the
pathogenesis of PMOP using the microarray data of PMOP to detect
significant pathways, with consideration of the functional
dependency among pathways. These results may offer theoretical
guidance for future experiments and may aid in our understanding of
the pathogenesis of PMOP.
Materials and methods
Brief outline of the proposed
method
Based on gene expression data, cellular pathways and
protein-protein interactions (PPIs) information, the identification
of dysregulated pathways using the pathway-interaction network
(PIN) included three steps. In the first step, the microarray genes
were mapped to the pathways and the principal component analysis
(PCA) method (17) was used to
compute the pathway activity for each pathway according to the sum
of the expression values of all genes of this given pathway, and
seed pathway was selected based on the pathway activities (the
pathway of activity score with the maximum change between PMOP and
normal groups was regarded as the seed pathway). In the second
step, a PIN was constructed that relied on gene expression data,
PPIs and cellular pathways, in which each node represented a
cellular pathway. In the third step, dysregulated pathways were
extracted from the PIN based on the seed pathway and increased
classification accuracy, which was measured using area under the
curve (AUC) indexing based on five-fold cross validation.
Data availability
Raw gene expression data were downloaded from the
ArrayExpress database offered by European Bioinformatics Institute
(http://www.ebi.ac.uk/arrayexpress;
accession no. E-MEXP-1618) (15),
which was based on the A-AFFY-44 Affymetrix GeneChip Human Genome
U133 Plus 2.0 (HG-U133_Plus_2) platform. This data set included 84
iliac bone biopsy samples, comprising 45 patients with OP and 39
healthy patients, which were obtained from postmenopausal women.
The inclusion criteria were an average spine T-score >-1 for the
normal group, and an average spine T-score <-1 for the PMOP
group.
Affymetrix CEL files and probe annotation files were
downloaded, and the gene expression profile of E-MEXP-1618 was
pre-treated using the Affy package of Bioconductor (18). Briefly, primary data in the CEL
format was converted into expression measures, followed by
background correction using robust multiarray average (19). Next, quartile data normalization
was conducted through quantiles (20), and median polish was used to
summarize the expression measures. Finally, a gene expression
matrix that included 20,545 genes was obtained following the probes
were mapped to gene symbols. Subsequently, expression scores of all
genes were standardized.
Biological pathways and PPI data
A total of 1,675 predefined biological pathways were
obtained from the REACTOME database (http://www.reactome.org), which is a manually curated
open-source database of cellular pathways (21). Pathways comprising too few genes
may not have sufficient biological information, whereas pathways
having too many genes may be too generic (22). Therefore, the present study
extracted a set of pathways by excluding the pathways with <5
genes or >100 genes. Following removal of these pathways, 1,189
background pathways were identified for further analysis. PPIs were
downloaded from the STRING database (version 9.1; http://string-db.org) (23). The original PPI data set included
787,896 interactions among 16,730 genes. The STRING database uses
confidence scores to measure how likely an association will appear.
As a result, with the goal of minimizing the ambiguity, only the
interactions with confidence score >0.2 were selected to
construct the original PPI network. Taking the intersection of the
original PPI network and the microarray data, a background PPI data
set containing 14,917 proteins and 449,833 PPIs was identified and
used for further analysis.
PIN construction
Using gene expression profiles, PPI information and
pathway data, a PIN was constructed, in which each node represented
a pathway and an edge was laid between two pathways when they met
one of two conditions; if not, then the edges were discarded. The
first condition was that these two pathways had to share at least
one gene, and at least one of the common genes between two pathways
had to be a DEG between the PMOP and normal groups. In the present
study, DEGs were identified using Student's t-test with a cutoff of
P<0.01. The second condition was that the two genes that coded
interacting proteins used to lay an edge between the two pathways
had to be highly co-expressed, with an absolute value of Pearson's
correlation coefficient (|PCC|) >0.8; if not, then the edge
between two pathways would be rejected. Based on these
requirements, a PIN was constructed. It is considered that if a
network is too big that a considerable number of key genes and
interactions are probably ignored (24). As a result, to reduce the
complicated network, the scores of a pair of pathways in the PIN
were calculated; defined as the summation of the absolute values of
PCC for the PPIs in every two pathways. The top 5% pathway
interactions were chosen to construct an informative PIN for the
detection of dysregulated pathways.
PCA analysis and selection of seed
pathway
PCA is a dimension reduction approach that has been
widely used in gene expression analysis (17); it is able to efficiently depict the
internal structure of high-dimension data by preserving the
variance within the data while converting the data into
low-dimension space (25). In the
present study, PCA was used to calculate pathway activity according
to gene expression data from each pathway. Notably, all the genes
were mapped to background pathways, and only those genes that
aligned to the background pathways were kept for PCA analysis. The
activity of each pathway (that is, the summary of the expression
values of all genes in the given pathway) was calculated using the
PCA method. The activity score for the corresponding pathway was
determined as the first principal component from PCA. The activity
score for a pathway between the experimental and the control groups
was different, and the difference may demonstrate its correlation
to the disease; that is, the greater the difference was, the more
relevant this pathway was to the disease. Therefore, in the present
study, the pathway with the maximum change of activity score
between PMOP and control groups was selected as the seed
pathway.
Detecting dysregulated pathways from
the informative PIN
Support vector machines (SVMs) were used to extract
the dysregulated pathways. Briefly, an individual pathway that best
distinguished disease from normal state was identified as the first
pathway biosignature (hereafter called the seed pathway), and the
second pathway that was able to integrate with the seed pathway to
obtain better classification accuracy was extracted from the
pathways that interacted with the seed pathway in the PIN. The
process was repeated, and new pathways were added to the obtained
pathway set until no more pathways could be assembled into the
pathway set to enhance classification results. Classification
accuracy was measured using the AUC index, based on five-fold cross
validation. In an attempt to obtain robust biomarkers, five-fold
cross-validation was repeated 100 times. The mean value was
collected as the final result.
Results
Informative PIN construction
Based on the cutoff criteria of P<0.01, a total
of 544 DEGs between the PMOP group and the normal group were
identified. The top 20 DEGs, in ascending order of P-values, are
provided in Table I. The
identified DEGs were used to select the interactions for
establishing the PIN, as only the interactions in the background
PPI data were able to meet at least one of the two conditions and
were kept to build the PIN.
 | Table I.List of the top 20 differentially
expressed genes. |
Table I.
List of the top 20 differentially
expressed genes.
| Gene | P-value |
|---|
| KTN1 |
1.51×10−05 |
| DKK1 |
1.62×10−05 |
| ARHGAP42 |
1.93×10−05 |
| ACSL3 |
2.23×10−05 |
| GOLGA4 |
3.43×10−05 |
| IFITM2 |
3.94×10−05 |
| NNT-AS1 |
6.45×10−05 |
| ABRA |
7.67×10−05 |
| PRKAA2 |
9.22×10−05 |
| DLEU2 |
1.10×10−04 |
| SOST |
1.15×10−04 |
| PDZRN3 |
1.39×10−04 |
| KALRN |
1.56×10−04 |
| FSTL3 |
1.68×10−04 |
| WWP1 |
1.70×10−04 |
| MUC17 |
2.17×10−04 |
| ZAK |
2.41×10−04 |
| ITM2A |
2.79×10−04 |
| IPO7 |
2.87×10−04 |
| ZNF787 |
2.99×10−04 |
Based on the pre-defined threshold, a PIN that was
involved in 54,517 pathway-pathway interactions was constructed. As
very large networks may easily neglect a few significant
interactions (23) they should be
reduced in size. In the present study, the interactions with low
|PCC| scores were removed, and the top 5% of all interactions were
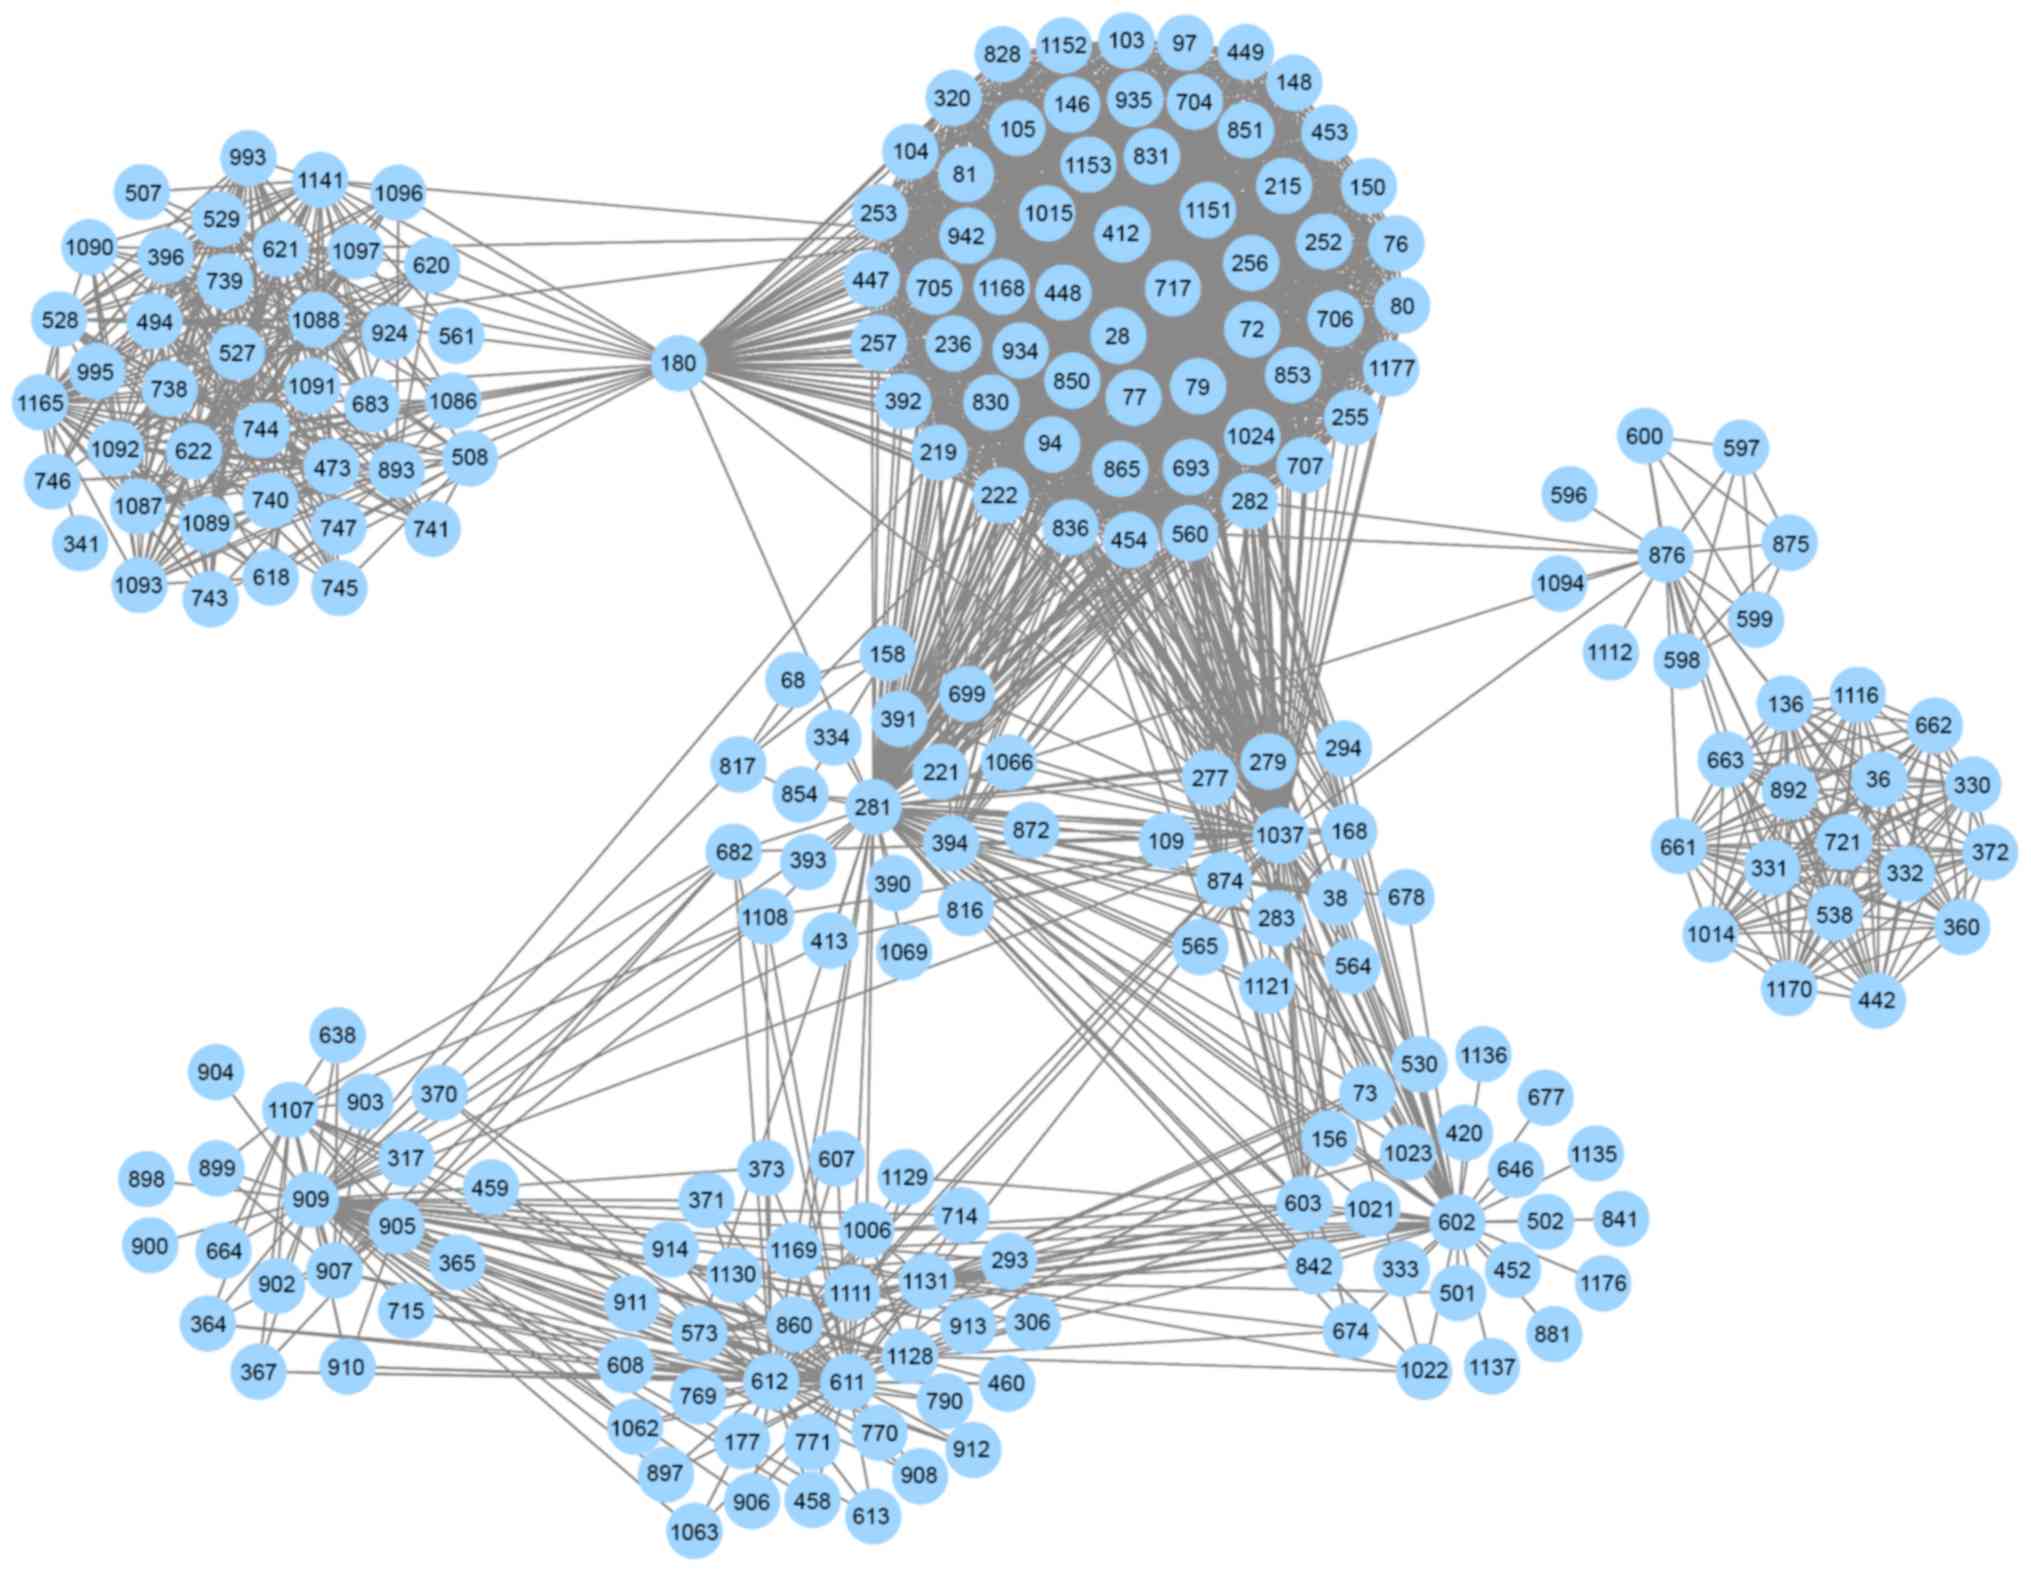
adopted for further analysis. A network comprising the top 5% of
interactions was defined as the informative PIN (Fig. 1). The informative PIN included
2,725 interactions between 1,189 pathways and was used to identify
dysregulated pathways; specific information about the 1,189
pathways is not provided here. Based on the informative PIN, the
strengths among the pathways were distinguishable. The weight of a
pathway-pathway interaction was defined as the summation of |PCC|
scores of all genes, and interactions having greater weight scores
may be more important for PMOP compared with other interactions.
The weight scores of the 2,725 interactions ranged between 95 and
323. Notably, in the informative PIN, there were only 11 pairs of
pathway interactions with weight scores >300.
Selection of the seed pathway
As there were differences between pathways in the
informative PIN, how to assess the significance of each pathway and
extract the significant pathway in the PIN was a challenge. The
activity score for the 1,189 pathways was calculated using the PCA
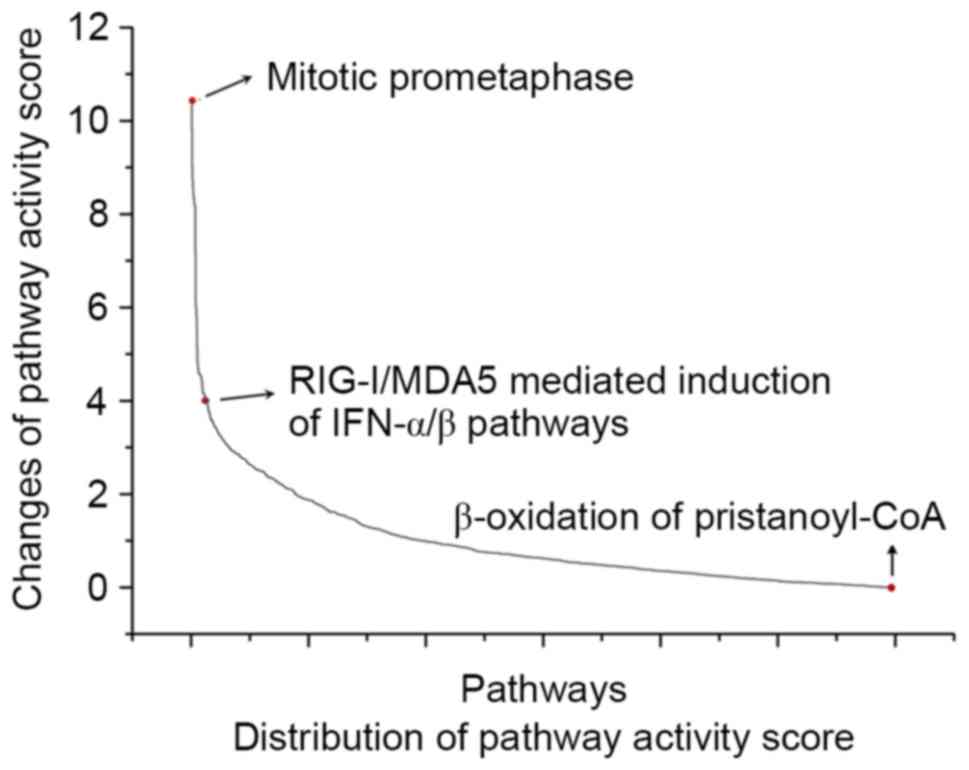
method to evaluate the significance. It was revealed that the
pathways had different changes to their activity score between PMOP
and normal groups (Fig. 2). The
pathway with the maximum change in activity score between PMOP and
normal groups was regarded as the seed pathway, which, in the
present study, was identified as ‘mitotic prometaphase’.
Detection of dysregulated pathways for
PMOP
Starting with the seed pathway, a pathway set was
identified by adding pathways to increase the classification
accuracy, and this procedure continued until the AUC index
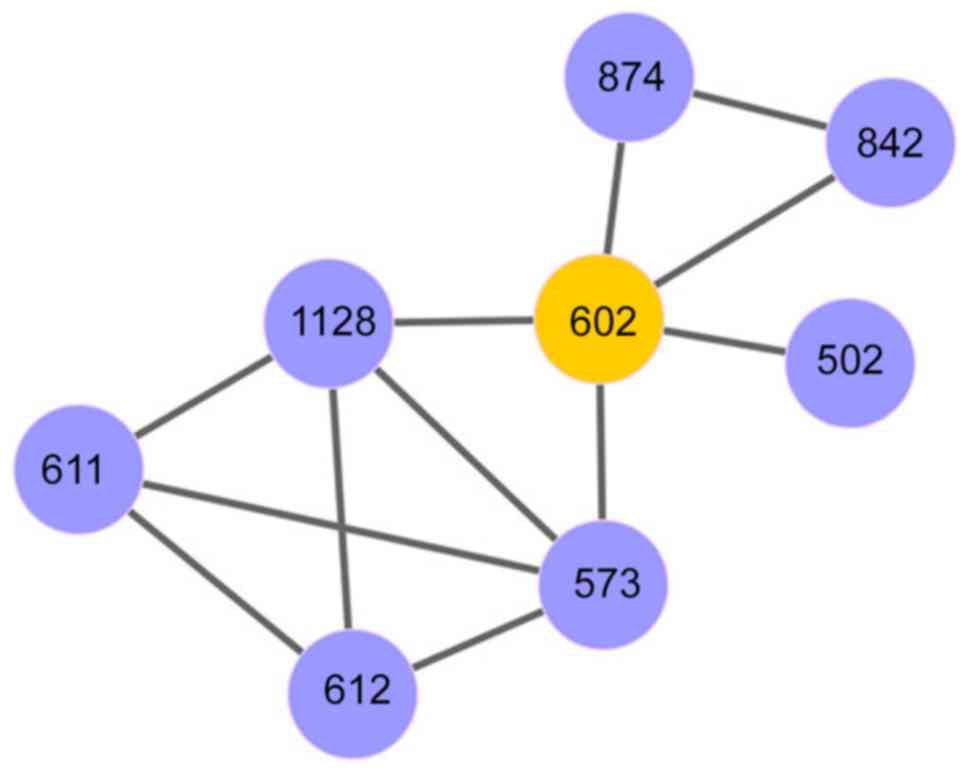
decreased. Using ‘mitotic prometaphase’ as the seed, a pathway set
was identified that was involved in 8 dysregulated pathways with
and AUC score of 0.85. This pathway set included ‘mitotic
prometaphase’, ‘resolution of sister chromatid cohesion’,
‘transport of mature mRNA derived from an intron-containing
transcript’, ‘interactions of Vpr with host cellular proteins’,
‘metabolism of non-coding RNA’, ‘regulation of HSF1-mediated heat
shock response’, ‘mRNA splicing’ and ‘mRNA splicing-major pathway’.
The effective classification ability of this method indicated that
the detected dysregulated pathways may be utilized as robust
signatures. A network of these eight dysregulated pathways is
provided in Fig. 3.
In addition, the genes enriched in the detected
dysregulated pathways were compared with the identified DEGs
(Table II). It was observed that
only a small fraction, between 8.4 and 21.2%, of the genes in the
extracted dysregulated pathways overlapped with the DEGs. This
phenomenon further demonstrated that a pathway as an entity may be
better than a single gene at diagnosing complicated diseases, even
if the genes enriched in the pathway were not differentially
expressed.
| Table II.Dysregulated pathways extracted from
the informative pathway-interaction network, and the DEGs involved
in the dysregulated pathways. |
Table II.
Dysregulated pathways extracted from
the informative pathway-interaction network, and the DEGs involved
in the dysregulated pathways.
| Index | Pathway | Genes (n) | DEGs (n) | DEGs |
|---|
|
602 | Mitotic
prometaphase | 105 | 11 | PPP1CC, CLIP1,
PLK1, CDC20, PPP2R5E, RCC2, SKA2, PPP2CA, INCENP, CDCA8 and
NUF2 |
|
874 | Resolution of
sister chromatid cohesion | 97 | 11 | PPP1CC, CLIP1,
PLK1, CDC20, PPP2R5E, NUF2, RCC2, SKA2, PPP2CA, INCENP and
CDCA8 |
| 1,128 | Transport of mature
mRNA derived from an intron-containing transcript | 47 | 6 | SRSF11, NUP62,
SRSF6, NUP54, AAAS and ALYREF |
|
502 | Interactions of Vpr
with host cellular proteins | 33 | 7 | NUP62, SLC25A4,
HMGA1, BANF1, SLC25A6, NUP54 and AAAS |
|
573 | Metabolism of
non-coding RNA | 47 | 6 | NUP62, SNRPD3,
SNRPF, NUP54, AAAS and PHAX |
|
842 | Regulation of
HSF1-mediated heat shock response | 74 | 11 | HSPA6, DNAJB1,
RPA2, NUP62, HSPA2, BAG3, AAAS, SIRT1, RPS19BP1, DNAJC2 and
NUP54 |
|
611 | mRNA splicing | 107 | 9 | SRSF11, GTF2F1,
SNRPD3, POLR2A, SNRPF, ALYREF, SRSF6, SF3B4 and LSM2 |
|
612 | mRNA splicing-major
pathway | 107 | 9 | SRSF11, GTF2F1,
SNRPD3, POLR2A, SNRPF, ALYREF, SRSF6, SF3B4 and LSM2 |
Discussion
A number of previous studies suggested that
pathway-based analyses may provide more reproducible results,
relative to individual gene-based methods (26–28).
For example, one previous study used pathways to compare different
brain regions of patients with Alzheimer's disease and observed
dysregulated pathways that cooperated in the different brain
regions (29). However, the
statistical significance of the pathway was evaluated using
hypergeometric distribution and pathways were analyzed
individually; the crosstalk among pathways was not considered.
Notably, the identification of pathway crosstalk in specific
conditions may benefit studies on pathway functions and the
molecular mechanisms of biological processes (30). Collectively, PPI data may provide
valuable information regarding the interactions among
functionalities that are vital to cell survival and growth. Network
biology provides new opportunities to analyze the interaction data
and gain insights into the mechanisms by which biological systems
operate (31). For example, the
characteristic sub-pathway network method was used to identify
disease-specific pathway crosstalk by counting ‘active PPIs’
(32). From a systematic
perspective, analysis of disease-related interaction networks may
improve our understanding of the complexity of biological pathways
and may aid in the identification of the molecular processes of
disease progression. Therefore, the present study used PINs to
identify dysregulated pathways based on the crosstalk among
pathways by integrating protein interaction data and cellular
pathways. An advantage of this method is that, in cases in which
pathways have only marginally enriched P-values, there may still be
a strong signal if the pathways collectively form a compact module
in the PIN.
With the goal of extracting dysregulated pathways in
PMOP, and to further exploring the molecular mechanisms of PMOP,
the present study constructed a PIN comprising 2,725 interactions
between 1,189 pathways, based on gene expression profiles, pathway
data and PPI information, and subsequently identified dysregulated
pathways in the PIN according to classification accuracy using
SVMs. The activity score for each pathway was calculated using the
PCA approach, and the mitotic prometaphase pathway was identified
and defined as the seed pathway. The selected pathway set included
eight pathways, and among these eight dysregulated pathways, two
pathways were related to mitotic activities and two pathways were
associated with mRNA splicing.
As previously reported, the pre-mRNA splicing
factor, cell division cycle 5-like, regulates mitotic progression
(33). In addition, mitotic
dysregulation may result in chromosomal pathology, which leads to
further dysregulation of genes involved in the aging process, such
as in OP and arthritis (34).
Therefore, the present study hypothesized that dysregulated mRNA
splicing and mitosis may serve important roles in the development
of PMOP.
In eukaryotic cells, sister chromatid cohesion is
required for the proper transmission of the replicated genome from
generation to generation, and is dependent on cohesin proteins
(35). The pre-mRNA-processing
factor 19 (Prp19) complex serves important roles in pre-mRNA
splicing (36), and inhibition of
Prp19 has been demonstrated to affect the splicing of pre-mRNAs
that encode proteins that are essential to sister chromatid
cohesion, and thus indirectly cause defects in cohesion (37,38).
Another study also reported that the Prp19 splicing complex was
necessary for sister chromatid cohesion during mitosis and
maintenance of genome stability (39); genomic instability is considered to
be associated with the aging process (40). OP is a common age-related disease;
that the identified dysregulated pathways ‘mRNA splicing’ and
‘resolution of sister chromatid cohesion’ exhibited a close
interaction suggested that this type of correlation may serve
important roles in the development and progression of PMOP.
In conclusion, the present study identified a
dysregulated pathway set for PMOP, which may shed light on the
molecular mechanism of PMOP, and may present candidate signatures
for targeted therapy for PMOP. However, several limitations of the
present study must be taken into consideration. First, the sample
size was relatively small. Second, how these pathways
synergistically regulate PMOP progression at the molecular level
remains unclear, and further investigations are required. Finally,
analysis was based on existing data and only used a bioinformatics
approach, with no experimental verification. Therefore, additional
experimental investigations using animal or patient tissues are
warranted to discover the potential alterations of these pathways
and to further our understanding of the pathogenic mechanisms of
PMOP.
References
|
1
|
Manolagas SC: Birth and death of bone
cells: Basic regulatory mechanisms and implications for the
pathogenesis and treatment of osteoporosis. Endocr Rev. 21:115–137.
2000. View Article : Google Scholar : PubMed/NCBI
|
|
2
|
Riggs BL: Involutional osteoporosis. N
Engl J Med. 314:1676–1686. 1986. View Article : Google Scholar : PubMed/NCBI
|
|
3
|
Seeman E: Bone quality: The material and
structural basis of bone strength. J Bone Miner Metab. 26:1–8.
2008. View Article : Google Scholar : PubMed/NCBI
|
|
4
|
Marcus R: Post-menopausal osteoporosis.
Best Pract Res Clin Obstet Gynaecol. 16:309–327. 2002. View Article : Google Scholar : PubMed/NCBI
|
|
5
|
Seibel MJ, Dunstan CR, Zhou H, Allan CM
and Handelsman DJ: Sex steroids, not FSH, influence bone mass.
Cell. 127:1079–1081. 2006. View Article : Google Scholar : PubMed/NCBI
|
|
6
|
Hernlund E, Svedbom A, Ivergård M,
Compston J, Cooper C, Stenmark J, McCloskey EV, Jönsson B and Kanis
JA: Osteoporosis in the European Union: Medical management,
epidemiology and economic burden. A report prepared in
collaboration with the International Osteoporosis Foundation (IOF)
and the European Federation of Pharmaceutical Industry Associations
(EFPIA). Arch Osteoporos. 8:1362013. View Article : Google Scholar : PubMed/NCBI
|
|
7
|
Burge R, Dawson-Hughes B, Solomon DH, Wong
JB, King A and Tosteson A: Incidence and economic burden of
osteoporosis-related fractures in the United States, 2005–2025. J
Bone Miner Res. 22:465–475. 2007. View Article : Google Scholar : PubMed/NCBI
|
|
8
|
Michaëlsson K, Melhus H, Ferm H, Ahlbom A
and Pedersen NL: Genetic liability to fractures in the elderly.
Arch Intern Med. 165:1825–1830. 2005. View Article : Google Scholar : PubMed/NCBI
|
|
9
|
Guo Y, Dong SS, Chen XF, Jing YA, Yang M,
Yan H, Shen H, Chen XD, Tan LJ, Tian Q, et al: Integrating
epigenomic elements and GWASs identifies BDNF gene affecting bone
mineral density and osteoporotic fracture risk. Sci Rep.
6:305582016. View Article : Google Scholar : PubMed/NCBI
|
|
10
|
Wang C, Zhang Z, Zhang H, He JW, Gu JM, Hu
WW, Hu YQ, Li M, Liu YJ, Fu WZ, et al: Susceptibility genes for
osteoporotic fracture in postmenopausal Chinese women. J Bone Miner
Res. 27:2582–2591. 2012. View Article : Google Scholar : PubMed/NCBI
|
|
11
|
Geng L, Yao Z, Yang H, Luo J, Han L and Lu
Q: Association of CA repeat polymorphism in estrogen receptor β
gene with postmenopausal osteoporosis in Chinese. J Genet Genomics.
34:868–876. 2007. View Article : Google Scholar : PubMed/NCBI
|
|
12
|
Song JF, Jing ZZ, Hu W and Su YX:
Association between single nucleotide polymorphisms of the
osteoprotegerin gene and postmenopausal osteoporosis in Chinese
women. Genet Mol Res. 12:3279–3285. 2013. View Article : Google Scholar : PubMed/NCBI
|
|
13
|
Xu XJ, Shen L, Yang YP, Zhu R, Shuai B, Li
CG and Wu MX: Serum β-catenin levels associated with the ratio of
RANKL/OPG in patients with postmenopausal osteoporosis. Int J
Endocrinol. 2013:5343522013. View Article : Google Scholar : PubMed/NCBI
|
|
14
|
Feng J, Liu S, Ma S, Zhao J, Zhang W, Qi
W, Cao P, Wang Z and Lei W: Protective effects of resveratrol on
postmenopausal osteoporosis: Regulation of SIRT1-NF-κB signaling
pathway. Acta Biochim Biophys Sin (Shanghai). 46:1024–1033. 2014.
View Article : Google Scholar : PubMed/NCBI
|
|
15
|
Reppe S, Sachse D, Olstad OK, Gautvik VT,
Sanderson P, Datta HK, Berg JP and Gautvik KM: Identification of
transcriptional macromolecular associations in human bone using
browser based in silico analysis in a giant correlation matrix.
Bone. 53:69–78. 2013. View Article : Google Scholar : PubMed/NCBI
|
|
16
|
Liu Y, Wang Y, Yang N, Wu S, Lv Y and Xu
L: In silico analysis of the molecular mechanism of postmenopausal
osteoporosis. Mol Med Rep. 12:6584–6590. 2015. View Article : Google Scholar : PubMed/NCBI
|
|
17
|
Hotelling H: Analysis of a complex of
statistical variables into principal components. J Edu Psychol.
24:4171933. View
Article : Google Scholar
|
|
18
|
Gautier L, Cope L, Bolstad BM and Irizarry
RA: Affy-analysis of Affymetrix GeneChip data at the probe level.
Bioinformatics. 20:307–315. 2004. View Article : Google Scholar : PubMed/NCBI
|
|
19
|
Irizarry RA, Hobbs B, Collin F,
Beazer-Barclay YD, Antonellis KJ, Scherf U and Speed TP:
Exploration, normalization, and summaries of high density
oligonucleotide array probe level data. Biostatistics. 4:249–264.
2003. View Article : Google Scholar : PubMed/NCBI
|
|
20
|
Bolstad BM, Irizarry RA, Astrand M and
Speed TP: A comparison of normalization methods for high density
oligonucleotide array data based on variance and bias.
Bioinformatics. 19:185–193. 2003. View Article : Google Scholar : PubMed/NCBI
|
|
21
|
Joshi-Tope G, Gillespie M, Vastrik I,
D'Eustachio P, Schmidt E, de Bono B, Jassal B, Gopinath GR, Wu GR,
Matthews L, et al: Reactome: A knowledgebase of biological
pathways. Nucleic Acids Res. 33(Database Issue): D428–D432. 2005.
View Article : Google Scholar : PubMed/NCBI
|
|
22
|
Ahn T, Lee E, Huh N and Park T:
Personalized identification of altered pathways in cancer using
accumulated normal tissue data. Bioinformatics. 30:i422–i429. 2014.
View Article : Google Scholar : PubMed/NCBI
|
|
23
|
Franceschini A, Szklarczyk D, Frankild S,
Kuhn M, Simonovic M, Roth A, Lin J, Minguez P, Bork P, von Mering C
and Jensen LJ: STRING v9.1: Protein-protein interaction networks,
with increased coverage and integration. Nucleic Acids Res.
41(Database Issue): D808–D815. 2013.PubMed/NCBI
|
|
24
|
Nibbe RK, Chowdhury SA, Koyutürk M, Ewing
R and Chance MR: Protein-protein interaction networks and
subnetworks in the biology of disease. Wiley Interdiscip Rev Syst
Biol Med. 3:357–367. 2011. View
Article : Google Scholar : PubMed/NCBI
|
|
25
|
Sharov AA, Dudekula DB and Ko MS: A
web-based tool for principal component and significance analysis of
microarray data. Bioinformatics. 21:2548–2549. 2005. View Article : Google Scholar : PubMed/NCBI
|
|
26
|
Segal E, Friedman N, Kaminski N, Regev A
and Koller D: From signatures to models: Understanding cancer using
microarrays. Nat Genet. 37 Suppl:S38–S45. 2005. View Article : Google Scholar : PubMed/NCBI
|
|
27
|
Wang X, Ding M, Yang Y, Feng Y, Shi Z, Qiu
F and Zhu M: Personalized discovery of altered pathways in clear
cell renal cell carcinoma using accumulated normal sample data. J
BUON. 21:390–398. 2016.PubMed/NCBI
|
|
28
|
Glazko GV and Emmert-Streib F: Unite and
conquer: Univariate and multivariate approaches for finding
differentially expressed gene sets. Bioinformatics. 25:2348–2354.
2009. View Article : Google Scholar : PubMed/NCBI
|
|
29
|
Liu ZP, Wang Y, Zhang XS and Chen L:
Identifying dysfunctional crosstalk of pathways in various regions
of Alzheimer's disease brains. BMC Syst Biol. 4 Suppl 2:S112010.
View Article : Google Scholar : PubMed/NCBI
|
|
30
|
Li Y and Agarwal P: A pathway-based view
of human diseases and disease relationships. PLoS One. 4:e43462009.
View Article : Google Scholar : PubMed/NCBI
|
|
31
|
Xia Y, Yu H, Jansen R, Seringhaus M,
Baxter S, Greenbaum D, Zhao H and Gerstein M: Analyzing cellular
biochemistry in terms of molecular networks. Biochemistry.
73:1051–1087. 2004. View Article : Google Scholar
|
|
32
|
Huang Y and Li S: Detection of
characteristic sub pathway network for angiogenesis based on the
comprehensive pathway network. BMC Bioinformatics. 11 Suppl
1:S322010. View Article : Google Scholar : PubMed/NCBI
|
|
33
|
Mu R, Wang YB, Wu M, Yang Y, Song W, Li T,
Zhang WN, Tan B, Li AL, Wang N, et al: Depletion of pre-mRNA
splicing factor Cdc5L inhibits mitotic progression and triggers
mitotic catastrophe. Cell Death Dis. 5:e11512014. View Article : Google Scholar : PubMed/NCBI
|
|
34
|
Ly DH, Lockhart DJ, Lerner RA and Schultz
PG: Mitotic misregulation and human aging. Science. 287:2486–2492.
2000. View Article : Google Scholar : PubMed/NCBI
|
|
35
|
Losada A, Hirano M and Hirano T:
Identification of Xenopus SMC protein complexes required for sister
chromatid cohesion. Genes Dev. 12:1986–1997. 1998. View Article : Google Scholar : PubMed/NCBI
|
|
36
|
Tarn WY, Lee KR and Cheng SC: The yeast
PRP19 protein is not tightly associated with small nuclear RNAs,
but appears to associate with the spliceosome after binding of U2
to the pre-mRNA and prior to formation of the functional
spliceosome. Mol Cell Biol. 13:1883–1891. 1993. View Article : Google Scholar : PubMed/NCBI
|
|
37
|
Neumann B, Walter T, Hériché JK,
Bulkescher J, Erfle H, Conrad C, Rogers P, Poser I, Held M, Liebel
U, et al: Phenotypic profiling of the human genome by time-lapse
microscopy reveals cell division genes. Nature. 464:721–727. 2010.
View Article : Google Scholar : PubMed/NCBI
|
|
38
|
Hofmann JC, Tegha-Dunghu J, Dräger S, Will
CL, Lührmann R and Gruss OJ: The Prp19 complex directly functions
in mitotic spindle assembly. PLoS One. 8:e748512013. View Article : Google Scholar : PubMed/NCBI
|
|
39
|
Watrin E, Demidova M, Watrin T, Hu Z and
Prigent C: Sororin pre-mRNA splicing is required for proper sister
chromatid cohesion in human cells. EMBO Rep. 15:948–955. 2014.
View Article : Google Scholar : PubMed/NCBI
|
|
40
|
Vijg J and Suh Y: Genome instability and
aging. Annu Rev Physiol. 75:645–668. 2013. View Article : Google Scholar : PubMed/NCBI
|