Introduction
Breast cancer is the most common cancer in women,
affecting ~12% of women worldwide (1). It is also the leading cause of
cancer-associated mortality in women (2,3). The
main cause of breast cancer mortality is metastasis, which accounts
for ~90% of breast cancer-associated mortality (4,5).
Therefore, research has focused on breast cancer metastasis. The
treatment methods of breast cancer include surgery, radiation,
chemotherapy, hormone blocking therapy (6), and monoclonal antibodies (7). The choice of treatment for breast
cancer depends on classification and special markers. Breast
cancers are classified by several grading systems, such as
histopathology, grade, stage, receptor status, and protein and gene
expression patterns (8).
Various signaling pathways have been implicated in
metastasis regulation, including transforming growth factor-β
signaling (9), Wnt signaling
(10), Notch signaling (11) and epidermal growth factor signaling
(12). Numerous
metastasis-associated biomarkers have also been revealed.
Parathyroid hormone-related protein (12–48)
is a plasma biomarker that is associated with breast cancer bone
metastasis (13). In addition, C-C
chemokine receptor type 7 and C-X-C chemokine receptor type 4 are
biomarkers that exhibit predictive value for axillary lymph node
metastasis in breast cancer (14).
MicroRNAs (miRNAs/miRs) serve important roles in the regulation of
metastasis, including miR-31 (15)
and miR-146 (16). Due to its
complexity and heterogeneity, the molecular mechanisms underlying
breast invasive carcinoma (BRCA) have yet to be completely
elucidated. The identification of critical genes is an essential
step toward fully understanding the metastatic mechanism of BRCA
and may also provide novel therapeutic targets against BRCA.
In the present study, BRCA gene expression data were
acquired from The Cancer Genome Atlas (TCGA). Differential
analysis, combined with network analysis, was performed to identify
the critical genes in BRCA. In addition, relevant miRNAs,
transcription factors (TFs) and associated small molecule drugs
were investigated, which may provide information that aids the
development of therapeutic strategies.
Materials and methods
Raw data and pretreatment
RNA-seq data for BRCA were downloaded from TCGA
(https://cancergenome.nih.gov/) using
TCGA-Assembler (17); the data
were then normalized with package TCC (http://www.bioconductor.org/packages/release/bioc/html/TCC.html).
Data from 1,073 BRCA samples and 99 normal samples, which were
downloaded from TCGA, were included for further analysis. The
RNA-seq data was acquired from the platform Illumina HiSeq 2000 RNA
Sequencing. The survival data were also collected from TCGA.
Missing values were filled with ‘1’ and a log2
transformation was applied. BRCA samples were clustered using
Algorithms and Framework for Nonnegative Matrix Factorization (NMF;
https://cran.r-project.org/web/packages/NMF/index.html)
(18) and k value was set to
generate optimal cophenetic correlation coefficient (19).
Screening of differentially expressed
genes (DEGs)
DEGs were identified using the significance analysis
of microarrays method (20), which
compensates for the false discovery rate in multiple testing.
Adjusted P<0.05 and |log (fold change) |<1 were set as the
cut-off criteria.
Functional enrichment analysis
Gene Ontology enrichment analysis and Kyoto
Encyclopedia of Genes and Genomes pathway enrichment analysis were
performed using the Database for Annotation, Visualization and
Integration Discovery (http://david.abcc.ncifcrf.gov/) (21). The P-value was adjusted by
Bonferroni correction (22).
Reactome analysis were performed using the Reactome Database
(http://reactome.org/) (23).
Screening of relevant miRNAs, TFs and
associated drugs
Regulatory relationships between miRNAs and target
genes, and between TFs and target genes were downloaded from
combinatorial Gene Regulatory Networks Builder (https://www.scbit.org/cgrnb/) (24,25).
A total of 197,906 miRNA-target gene relationships were acquired,
which included 699 mature miRNAs and 8,646 target genes.
Furthermore, 210,637 TF-target gene relationships were obtained,
which included 207 TFs and 16,862 target genes.
Relationships between small molecule drugs and
target genes were downloaded from DrugBank (http://www.drugbank.ca/). A total of 6,108
relationships were acquired, which included 348 small molecule
drugs and 1,353 target genes.
Relevant miRNAs, TFs and drugs were identified by
Fisher's exact test (26). For
specific miRNAs, TFs or drugs the associated target genes were
defined as M, whereas the DEGs were identified as N. The
significance of the overlap between M and N was
examined by Fisher's exact test: Where ‘a’ indicates genes included
in M and N, ‘d’ indicates genes included in neither
M nor N, ‘b’ indicates genes only included in
M, and ‘c’ indicates genes only included in N.
Relevant miRNAs, TFs and drugs with P<0.05 were selected for
each group of BRCA samples.
Construction of interaction
networks
Protein-protein interaction (PPI) information was
downloaded from the Human Protein Reference Database (http://www.hprd.org/) (27). A total of 39,240 PPI interactions
and 9,572 proteins were identified. Interactions with a Pearson's
correlation coefficient >0.5 were selected and PPI networks were
subsequently constructed.
Survival analysis
Difference in survival time among the various BRCA
groups was analyzed using the Kaplan-Meier (K-M) method in the
survival package (version 2.41–3; https://cran.r-project.org/web/packages/survival/index.html).
Results
Classification of BRCA samples
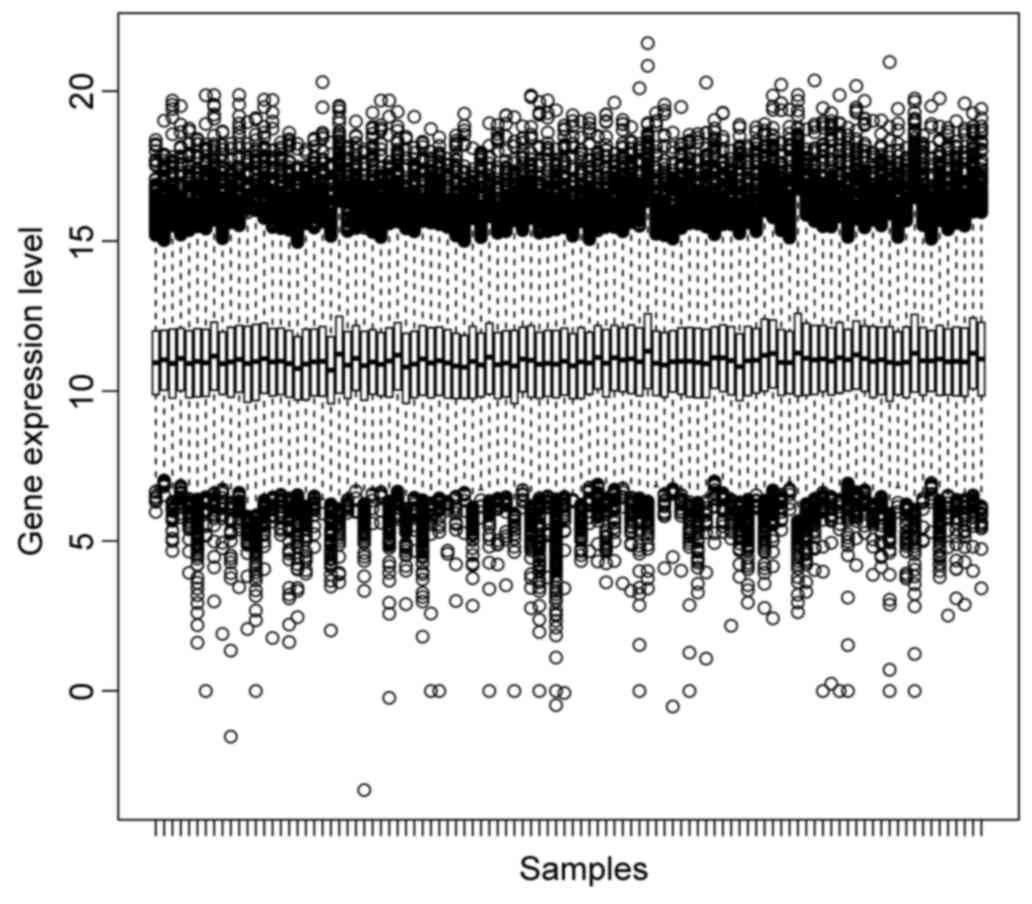
Box plots of normalized gene expression data are
presented in Fig. 1. A good
performance of normalization was achieved.
Coefficient of variation was calculated for the
expression levels of each gene in the BRCA samples and the top
1,500 genes, which were regarded as core genes, were selected for
classification. Maximum cophenetic correlation coefficient was
obtained while the k value was set as 7 (Fig. 2). Accordingly, seven BRCA groups
were identified from the 1,052 samples using the NMF package.
Group-1 included 53 samples, group-2 included 227 samples, group-3
included 124 samples, group-4 included 367 samples, group-5
included 134 samples, group-6 included 32 samples and group-7
included 115 samples.
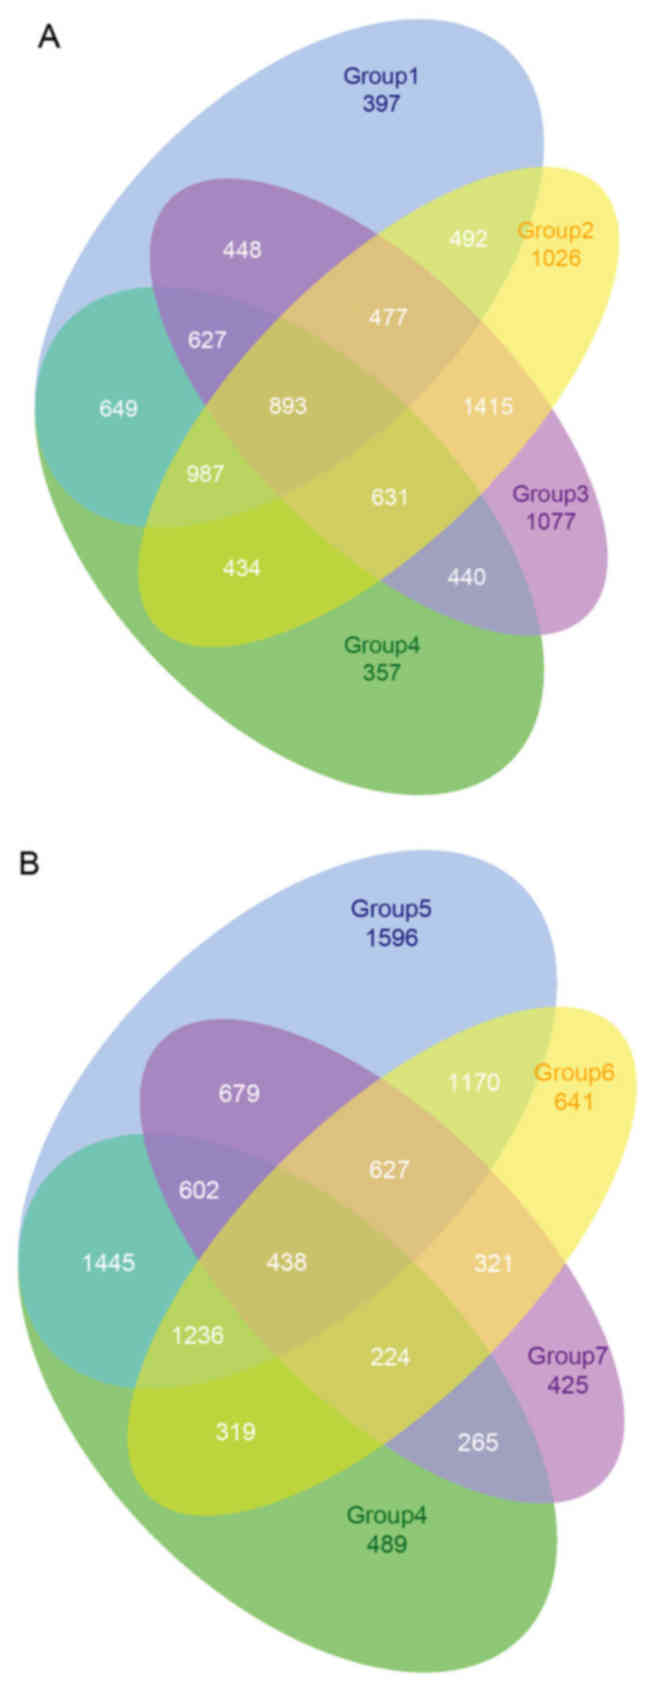
DEGs and biological functions
The DEGs were identified in the BRCA group samples
compared with the control samples. A total of 4,970 DEGs were
identified in group-1, 6,355 DEGs in group-2, 6,008 DEGs in
group-3, 5,018 DEGs in group-4, 7,793 DEGs in group-5, 4,976 DEGs
in group-6 and 3,581 DEGs in group-7 compared with the control
samples. A considerable number of overlapping genes were observed
among groups −1 to −4 and groups −4 to −7 (Fig. 3). A total of 5,394 DEGs were
identified in ≥4 groups and were selected and termed common DEGs.
Functional enrichment analysis demonstrated that these genes were
involved in the cell cycle, ubiquitin-mediated proteolysis,
oxidative phosphorylation and human immunodeficiency virus
infection (Table I).
 | Table I.Biological functions over-represented
in the 5,394 differentially expressed genes. |
Table I.
Biological functions over-represented
in the 5,394 differentially expressed genes.
| Source | Name | Bonferroni-adjusted
P-value |
|---|
| KEGG | Ubiquitin-mediated
proteolysis |
2.35×10⁻¹⁰ |
| KEGG | Non-alcoholic fatty
liver disease |
6.50×10⁻¹⁰ |
| KEGG | Oxidative
phosphorylation |
6.79×10⁻¹⁰ |
| KEGG | Cell cycle |
9.26×10⁻¹⁰ |
| KEGG | RNA transport |
1.69×10⁻⁹ |
| KEGG | Proteasome |
3.30×10⁻⁹ |
| KEGG | Spliceosome |
2.10×10⁻⁸ |
| KEGG | Protein processing
in endoplasmic reticulum |
9.19×10⁻⁸ |
| KEGG | Human T
lymphotropic virus type 1 infection |
9.34×10⁻⁸ |
| KEGG | Ribosome biogenesis
in eukaryotes |
9.34×10⁻⁸ |
| KEGG | DNA
replication |
1.06×10⁻⁷ |
| KEGG | Shigellosis |
3.96×10⁻⁷ |
| REACTOME | Cell cycle,
mitotic |
4.29×10⁻⁷ |
| REACTOME | Cell cycle |
5.01×10⁻⁷ |
| REACTOME | Human
immunodeficiency virus infection |
1.18×10⁻⁶ |
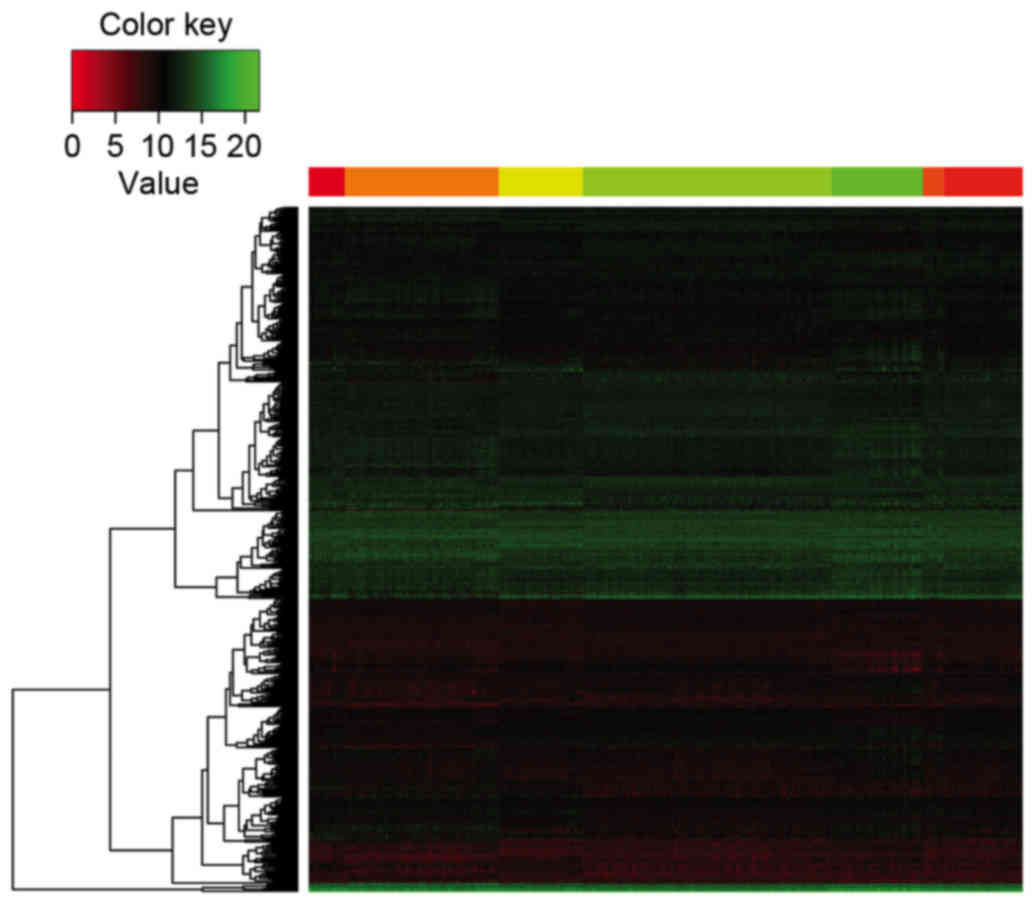
The top 500 DEGs ranked by adjusted P-value were
selected, which were used to generate a heatmap for the seven
groups. Different expression patterns were observed among the seven
groups (Fig. 4).
Relevant miRNAs, TFs and drugs
According to the threshold, 129, 153, 11, 77, 37, 71
and 202 miRNAs were obtained from groups-1 to −7, respectively. A
total of 48, 56, 46, 45, 56, 49 and 48 TFs were obtained from
groups-1 to −7, respectively. A total of 6, 1, 2, 1, 0, 1 and 2
small molecule drugs were unveiled in groups-1 to −7, respectively.
The top 5 miRNAs, TFs and small molecule drugs (ranked by P-value)
are listed in Table II. Numerous
TFs were observed in >1 group, including Sp1 transcription
factor and DAN domain BMP antagonist family member 5. In addition,
some TFs were unique to certain groups, including MYCN
proto-oncogene, bHLH transcription factor in group-7 and cAMP
responsive element binding protein 1 (CREB)1 in group-4.
Furthermore, different small molecule drugs were revealed between
the groups.
| Table II.Top five relevant microRNAs,
transcription factors and small molecule drugs in each group. |
Table II.
Top five relevant microRNAs,
transcription factors and small molecule drugs in each group.
| Group | MicroRNAs | Transcription
factors | Drugs |
|---|
| 1 | miR-936, miR-130a,
miR-26a, miR-30a, miR-301a | DAND5, PSG1, SP1,
Elk-1, EGR3 | Basiliximab,
Alemtuzumab, Efalizumab, Natalizumab, L-Isoleucine |
| 2 | miR-506, miR-1289,
miR-552, miR-590-3p, miR-214 | DAND5, PSG1, SP1,
E2F, E2F1 | Bortezomib |
| 3 | miR-1207-5p,
miR-1224-3p, miR-1275, miR-518e*, miR-765 | E2F, E2F1, Elk-1,
SP1, DAND5 | Bortezomib,
Sunitinib |
| 4 | miR-454, miR-1245,
miRr-659, miR-518a-5p, miR-340 | DAND5, PSG1, SP1,
Elk-1, CREB1 | Carfilzomib |
| 5 | miR-663, miR-519e,
miR-940, miR-339-5p, miR-125a-5p | DAND5, PSG1, SP1,
Elk-1, PAX5 | N/A |
| 6 | miR-214, miR-1290,
miR-142-3p, miR-607, miR-134 | SP1, DAND5, PSG1,
PAX5, Pax-5 | Biotin |
| 7 | miR-590-3p,
miR-376b, miR-568, miR-1200, miR-302c* | SP1, DAND5, PSG1,
MYCN, E2F | Spermine,
L-Glutamine |
PPI network
PPIs were identified among the 5,394 DEGs; PPIs with
a Pearson's correlation coefficient >0.5 were selected and seven
PPI networks were constructed. The PPI network for group-1
contained 711 interactions and 748 genes. The PPI network for
group-2 included 197 interactions and 256 genes. The PPI network
for group-3 included 473 interactions and 533 genes. The PPI
network for group-4 included 207 interactions and 258 genes. The
PPI network for group-5 included 382 interactions and 453 genes.
The PPI network for group-6 included 774 interactions and 830
genes. The PPI network for group-7 included 416 interactions and
463 genes.
Degree was calculated for each node and the top 10
hub genes of the seven PPI networks are listed in Table III. Some hub genes were unique to
certain groups, including RB transcriptional corepressor 1 (RB1)
from group-1, inhibitor of nuclear factor (NF)-κB kinase subunit γ
(IKBKG) from group-2, transporter 1, ATP binding cassette subfamily
B member from group-4, small nuclear ribonucleoprotein polypeptide
E from group-5, and CREB binding protein from group-6.
| Table III.Top 10 hub genes of the seven
groups. |
Table III.
Top 10 hub genes of the seven
groups.
| Group | Gene | Degree |
|---|
| 1 | TRAF2 | 11 |
|
| SYK | 10 |
|
| RB1 | 10 |
|
| CEBPB | 10 |
|
| CSNK2B | 9 |
|
| PCNA | 8 |
|
| STAT1 | 8 |
|
| MCM3 | 8 |
|
| COPS6 | 8 |
|
| MCM2 | 8 |
| 2 | STAT1 | 6 |
|
| MCM3 | 6 |
|
| MCM7 | 6 |
|
| MCM2 | 6 |
|
| PCNA | 5 |
|
| IKBKG | 5 |
|
| PTBP1 | 5 |
|
| SNRPG | 5 |
|
| NFKB2 | 5 |
|
| TAP2 | 4 |
| 3 | ACTB | 14 |
|
| COPS6 | 9 |
|
| LYN | 7 |
|
| NFKB2 | 7 |
|
| MCM3 | 7 |
|
| ARPC4 | 7 |
|
| FYN | 7 |
|
| PSMB5 | 7 |
|
| SYK | 6 |
|
| PCNA | 6 |
| 4 | FYN | 10 |
|
| LYN | 7 |
|
| PCNA | 7 |
|
| MCM6 | 7 |
|
| MCM2 | 7 |
|
| STAT1 | 6 |
|
| MCM3 | 6 |
|
| MCM7 | 6 |
|
| TAP1 | 4 |
|
| PSMA3 | 4 |
| 5 | PCNA | 8 |
|
| SNRPE | 8 |
|
| SNRPF | 7 |
|
| SNRPD2 | 7 |
|
| MCM2 | 7 |
|
| TAF1 | 6 |
|
| LSM2 | 6 |
|
| MCM3 | 6 |
|
| MCM6 | 6 |
|
| COPS6 | 6 |
| 6 | COPS6 | 14 |
|
| TRAF2 | 13 |
|
| ACTB | 11 |
|
| FYN | 11 |
|
| CREBBP | 10 |
|
| C14orf1 | 10 |
|
| STAT1 | 9 |
|
| CSNK2B | 9 |
|
| PRPF40A | 9 |
|
| LYN | 8 |
| 7 | FYN | 11 |
|
| COPS6 | 9 |
|
| ACTB | 9 |
|
| LYN | 8 |
|
| SNRPD2 | 8 |
|
| SNRPF | 7 |
|
| CSNK2B | 7 |
|
| MCM2 | 7 |
|
| PCNA | 6 |
|
| PSMA3 | 6 |
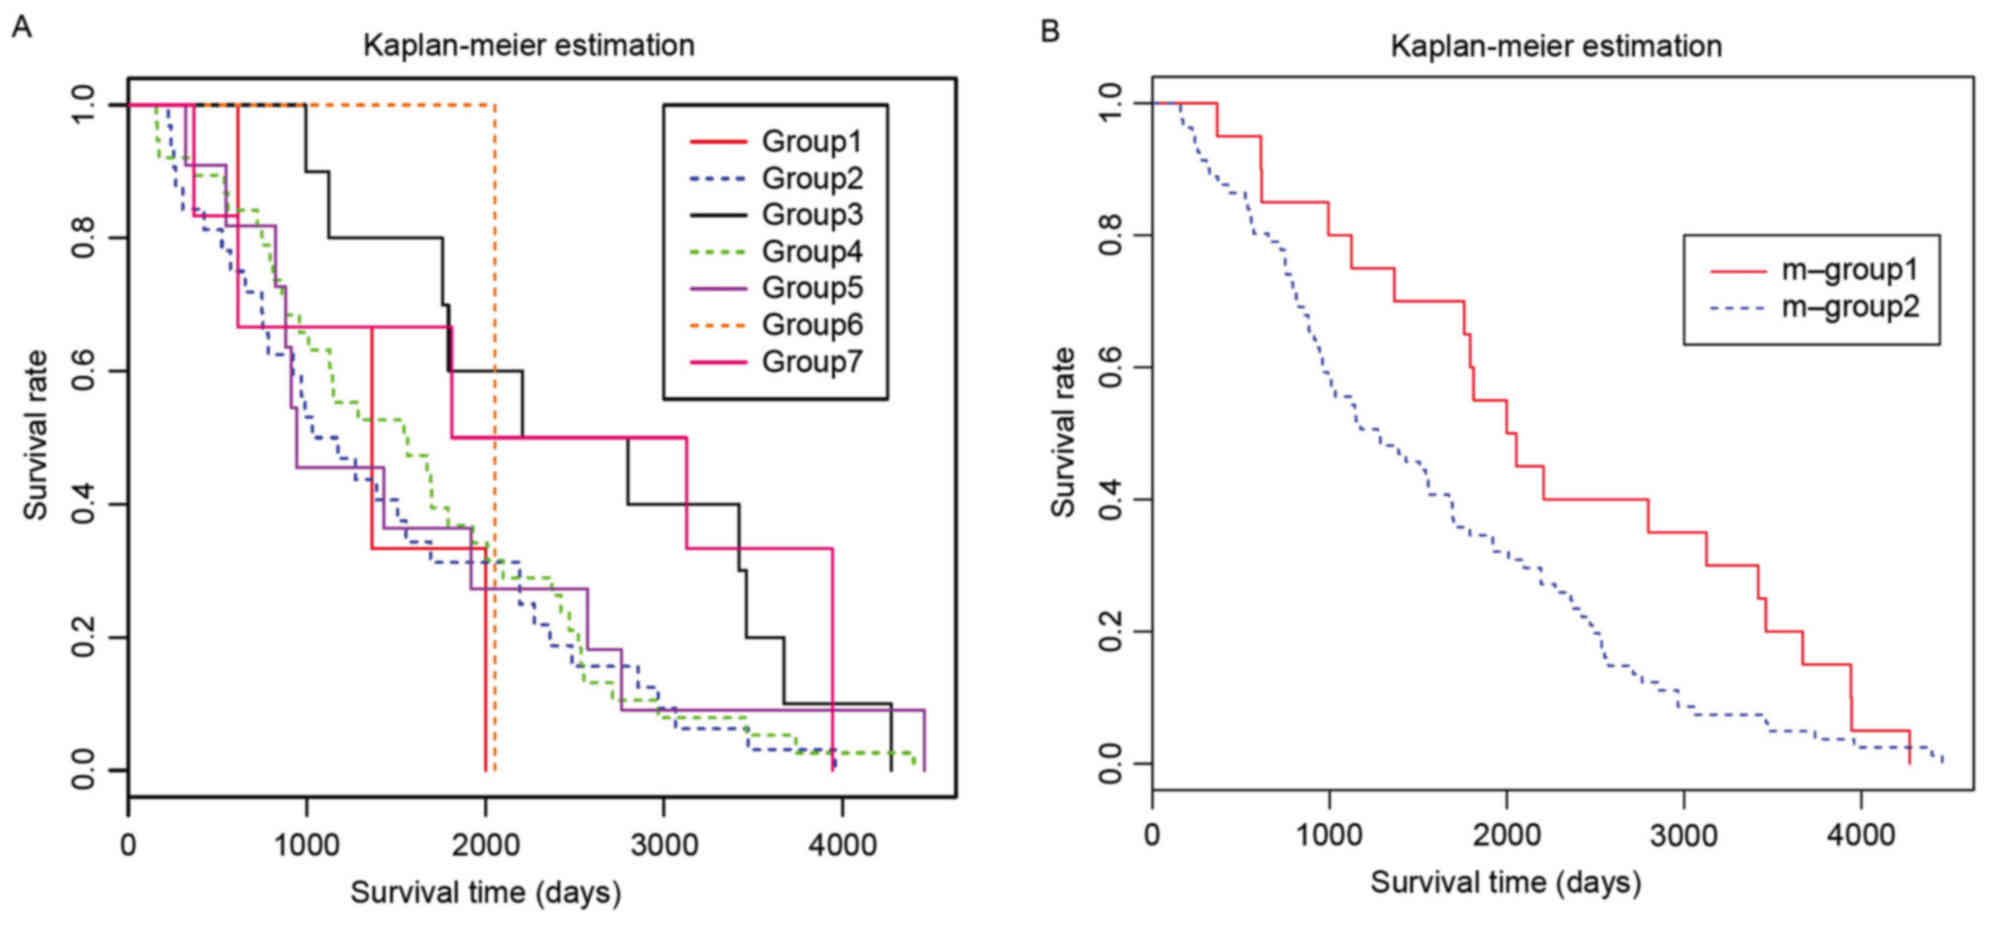
Survival analysis
A total of 101 cases succumbed to BRCA, as follows:
3 cases from group-1, 32 from group-2, 10 from group-3, 38 from
group-4, 11 from group-5, 1 from group-6 and 6 from group-7. The
survival analysis demonstrated that groups-2, −4 and −5 had similar
survival curves (Fig. 5A).
Therefore, these groups were combined into m-group-2, whereas the
remaining groups were combined into m-group-1. A significant
difference was observed between the combined two groups (P=0.0484;
Fig. 5B). According to the
available data, no common features in m-group-1 and m-group-2,
including gene expression patterns and clinical features, were
observed.
Discussion
Expression data from 1,073 BRCA samples and 99
normal samples were analyzed in the present study. The BRCA samples
were divided into seven groups, and a total of 5,394 common DEGs
were obtained. The identified DEGs were involved in the cell cycle,
ubiquitin-mediated proteolysis and oxidative phosphorylation.
Subsequently, PPI networks were constructed for the DEGs and hub
genes were selected.
A combination of differential and network analyses
was useful in identifying critical genes. Some of the identified
hub genes have previously been implicated in breast cancer. TNF
receptor-associated factor 2 mediates the signal transduction from
members of the TNF receptor superfamily and serves a role in
regulation of breast cancer cell invasion (28,29).
Spleen associated tyrosine kinase (SYK) is a tumor suppressor, the
expression of which is often absent or reduced in invasive breast
cancer tissues (30,31). SYK may exert its function through
integrin-mediated protein tyrosine phosphorylation (32). Proliferating cell nuclear antigen
is considered a potential biomarker of BRCA (33). Polypyrimidine tract-binding protein
1 (PTBP1) has been reported to serve a role in the maintenance of
breast cancer cell growth and malignant properties (34). The stability of PTBP1 is increased
in breast cancer cell lines compared with in matched controls
(35). FYN proto-oncogene, Src
family tyrosine kinase is a member of the protein-tyrosine kinase
oncogene family and is implicated in the control of cell growth. In
addition, it is considered an important molecule in drug resistance
in breast cancer (36), is induced
by Ras/phosphoinositide 3-kinase/Akt signaling and is required for
enhanced invasion (37). RB1 is a
negative regulator of the cell cycle and was the first identified
tumor suppressor gene. In addition, RB1 is associated with
epithelial-to-mesenchymal transition in triple-negative breast
cancer (38); therefore, it may be
used to predict drug response (39) and long-term survival (40). NFKB2 is a subunit of the
transcription factor complex NF-κB, whereas IKBKG is a regulatory
subunit of the IκB kinase complex, which activates NF-κB. Both
NFKB2 and IKBKG are upregulated in inflammatory breast cancer and
may serve important roles in the disease (41).
Relevant miRNAs, TFs and small molecule drugs were
also identified in the present study. miR-130a (42), miR-26a (43) and miR-30a (44) have been reported to suppress breast
cancer cell proliferation and migration. Furthermore, miR-340
inhibits breast cancer cell migration and invasion through
targeting the oncoprotein c-Met (45). Conversely, upregulated miR-301a in
breast cancer promotes tumor metastasis by targeting phosphatase
and tensin homolog and activating Wnt/β-catenin signaling (46). Furthermore, miR-506 has been
reported to regulate epithelial-mesenchymal transition in breast
cancer cell lines (47), whereas
miR-214 enhances the invasive ability of breast cancer cells by
targeting p53 (48). The TF early
growth response 3 is involved in the estrogen-signaling pathway in
breast cancer cells (49). E2F
transcription factor 1 is a proliferative marker of breast
neoplasia (50). In addition,
ELK1, ETS transcription factor, is a member of the ETS oncogene
family, and is implicated in breast cancer cell survival (51). These factors may be used to develop
novel therapies for the treatment of breast cancer. In addition,
two small molecule drugs that are currently used to treat BRCA,
were identified to be associated with the BRCA DEGs: Bortezomib
(52,53) and sunitinib (54), thus suggesting the reliability of
the DEGs.
In the present study, the two combined BRCA groups
exhibited a significant difference in survival rate. Therefore, a
comparative analysis of the two combined groups may disclose
prognostic genes associated with breast cancer.
In conclusion, numerous critical genes were
identified in BRCA. Further studies regarding these genes may
improve understanding regarding the complex molecular mechanisms
underlying BRCA and result in the identification of therapeutic
targets. The identified relevant miRNAs and TFs in the present
study may also provide information that aids future therapy
development.
References
|
1
|
McGuire A, Brown JA, Malone C, McLaughlin
R and Kerin MJ: Effects of age on the detection and management of
breast cancer. Cancers (Basel). 7:908–929. 2015. View Article : Google Scholar : PubMed/NCBI
|
|
2
|
DeSantis C, Ma J, Bryan L and Jemal A:
Breast cancer statistics, 2013. CA Cancer J Clin. 64:52–62. 2014.
View Article : Google Scholar : PubMed/NCBI
|
|
3
|
McGuire S: World Cancer Report 2014.
Geneva, Switzerland: World Health Organization, International
agency for research on cancer, WHO press, 2015. Adv Nutr.
7:418–419. 2016. View Article : Google Scholar : PubMed/NCBI
|
|
4
|
Byler S, Goldgar S, Heerboth S, Leary M,
Housman G, Moulton K and Sarkar S: Genetic and epigenetic aspects
of breast cancer progression and therapy. Anticancer Res.
34:1071–1077. 2014.PubMed/NCBI
|
|
5
|
Scully OJ, Bay BH, Yip G and Yu Y: Breast
cancer metastasis. Cancer Genomics Proteomics. 9:311–320.
2012.PubMed/NCBI
|
|
6
|
Petit T, Dufour P and Tannock I: A
critical evaluation of the role of aromatase inhibitors as adjuvant
therapy for postmenopausal women with breast cancer. Endocr Relat
Cancer. 18:R79–R89. 2011. View Article : Google Scholar : PubMed/NCBI
|
|
7
|
Fu M, Maresh EL, Helguera GF, Kiyohara M,
Qin Y, Ashki N, Daniels-Wells TR, Aziz N, Gordon LK, Braun J, et
al: Rationale and preclinical efficacy of a novel anti-EMP2
antibody for the treatment of invasive breast cancer. Mol Cancer
Ther. 13:902–915. 2014. View Article : Google Scholar : PubMed/NCBI
|
|
8
|
Taherian-Fard A, Srihari S and Ragan MA:
Breast cancer classification: Linking molecular mechanisms to
disease prognosis. Brief Bioinform. 16:461–474. 2015. View Article : Google Scholar : PubMed/NCBI
|
|
9
|
Drabsch Y and ten Dijke P: TGF-β signaling
in breast cancer cell invasion and bone metastasis. J Mammary Gland
Biol Neoplasia. 16:97–108. 2011. View Article : Google Scholar : PubMed/NCBI
|
|
10
|
Dimeo TA, Kristen A, Pushkar P, Fan C,
Perou CM, Naber S and Kuperwasser C: A novel lung metastasis
signature links Wnt signaling with cancer cell self-renewal and
epithelial-mesenchymal transition in basal-like breast cancer.
Cancer Res. 69:5364–5373. 2009. View Article : Google Scholar : PubMed/NCBI
|
|
11
|
Sethi N, Dai X, Winter CG and Kang Y:
Tumor-derived JAGGED1 promotes osteolytic bone metastasis of breast
cancer by engaging notch signaling in bone cells. Cancer Cell.
19:192–205. 2011. View Article : Google Scholar : PubMed/NCBI
|
|
12
|
Du WW, Fang L, Li M, Yang X, Liang Y, Peng
C, Qian W, O'Malley YQ, Askeland RW, Sugg SL, et al: MicroRNA
miR-24 enhances tumor invasion and metastasis by targeting PTPN9
and PTPRF to promote EGF signaling. J Cell Sci. 126:1440–1453.
2013. View Article : Google Scholar : PubMed/NCBI
|
|
13
|
Washam CL, Byrum SD, Leitzel K, Ali SM,
Tackett AJ, Gaddy D, Sundermann SE, Lipton A and Suva LJ:
Identification of PTHrP(12–48) as a plasma biomarker associated
with breast cancer bone metastasis. Cancer Epidemiol Biomarkers
Prev. 22:972–983. 2013. View Article : Google Scholar : PubMed/NCBI
|
|
14
|
Cabioglu N, Yazici MS, Arun B, Broglio KR,
Hortobagyi GN, Price JE and Sahin A: CCR7 and CXCR4 as novel
biomarkers predicting axillary lymph node metastasis in T1 breast
cancer. Clin Cancer Res. 11:5686–5693. 2005. View Article : Google Scholar : PubMed/NCBI
|
|
15
|
Valastyan S, Reinhardt F, Benaich N,
Calogrias D, Szász AM, Wang ZC, Brock JE, Richardson AL and
Weinberg RA: A pleiotropically acting microRNA, miR-31, inhibits
breast cancer metastasis. Cell. 137:1032–1046. 2009. View Article : Google Scholar : PubMed/NCBI
|
|
16
|
Hurst DR, Edmonds MD, Scott GK, Benz CC,
Vaidya KS and Welch DR: Breast cancer metastasis suppressor 1
up-regulates miR-146, which suppresses breast cancer metastasis.
Cancer Res. 69:1279–1283. 2009. View Article : Google Scholar : PubMed/NCBI
|
|
17
|
Zhu Y, Qiu P and Ji Y: TCGA-assembler:
Open-source software for retrieving and processing TCGA data. Nat
Methods. 11:599–600. 2014. View Article : Google Scholar : PubMed/NCBI
|
|
18
|
Rossini PM, Barker AT, Berardelli A,
Caramia MD, Caruso G, Cracco RQ, Dimitrijević MR, Hallett M,
Katayama Y, Lücking CH, et al: Non-invasive electrical and magnetic
stimulation of the brain, spinal cord and roots: Basic principles
and procedures for routine clinical application. Report of an IFCN
committee. Electroencephalogr Clin Neurophysiol. 91:79–92. 1994.
View Article : Google Scholar : PubMed/NCBI
|
|
19
|
Farris JS: On the cophenetic correlation
coefficient. Syst Biol. 18:279–285. 1969.
|
|
20
|
Larsson O, Wahlestedt C and Timmons JA:
Considerations when using the significance analysis of microarrays
(SAM) algorithm. BMC Bioinformatics. 6:1292005. View Article : Google Scholar : PubMed/NCBI
|
|
21
|
Dennis G Jr, Sherman BT, Hosack DA, Yang
J, Gao W, Lane HC and Lempicki RA: DAVID: Database for annotation,
visualization, and integrated discovery. Genome Biol. 4:P32003.
View Article : Google Scholar : PubMed/NCBI
|
|
22
|
Kim KI and van de Wiel MA: Effects of
dependence in high-dimensional multiple testing problems. BMC
Bioinformatics. 9:1142008. View Article : Google Scholar : PubMed/NCBI
|
|
23
|
Haw R and Stein L: Using the reactome
database. Curr Protoc Bioinformatics. 8:Unit8.72012.PubMed/NCBI
|
|
24
|
Tu K, Yu H, Hua YJ, Li YY, Liu L, Xie L
and Li YX: Combinatorial network of primary and secondary
microRNA-driven regulatory mechanisms. Nucleic Acids Res.
37:5969–5980. 2009. View Article : Google Scholar : PubMed/NCBI
|
|
25
|
Yu H, Tu K, Wang YJ, Mao JZ, Xie L, Li YY
and Li YX: Combinatorial network of transcriptional regulation and
microRNA regulation in human cancer. BMC Syst Biol. 6:612012.
View Article : Google Scholar : PubMed/NCBI
|
|
26
|
Liao YY, Lee TS and Lin YM: A Fisher exact
test will be more proper. Radiology. 239:300–301. 2006. View Article : Google Scholar : PubMed/NCBI
|
|
27
|
Prasad TS Keshava, Goel R, Kandasamy K,
Keerthikumar S, Kumar S, Mathivanan S, Telikicherla D, Raju R,
Shafreen B, Venugopal A, et al: Human protein reference
database-2009 update. Nucleic Acids Res. 37(Database issue):
D767–D772. 2009. View Article : Google Scholar : PubMed/NCBI
|
|
28
|
Jang KW, Lee KH, Kim SH, Jin T, Choi EY,
Jeon HJ, Kim E, Han YS and Chung JH: Ubiquitin ligase CHIP induces
TRAF2 proteasomal degradation and NF-κB inactivation to regulate
breast cancer cell invasion. J Cell Biochem. 112:3612–3620. 2011.
View Article : Google Scholar : PubMed/NCBI
|
|
29
|
Sun LL, Wang J, Zhao ZJ, Liu N, Wang AL,
Ren HY, Yang F, Diao KX, Fu WN, Wan EH and Mi XY: Suppressive role
of miR-502-5p in breast cancer via downregulation of TRAF2. Oncol
Rep. 31:2085–2092. 2014. View Article : Google Scholar : PubMed/NCBI
|
|
30
|
Moroni M, Soldatenkov V, Zhang L, Zhang Y,
Stoica G, Gehan E, Rashidi B, Singh B, Ozdemirli M and Mueller SC:
Progressive loss of Syk and abnormal proliferation in breast cancer
cells. Cancer Res. 64:7346–7354. 2004. View Article : Google Scholar : PubMed/NCBI
|
|
31
|
Toyama T, Iwase H, Yamashita H, Hara Y,
Omoto Y, Sugiura H, Zhang Z and Fujii Y: Reduced expression of the
Syk gene is correlated with poor prognosis in human breast cancer.
Cancer Lett. 189:97–102. 2003. View Article : Google Scholar : PubMed/NCBI
|
|
32
|
Zhang X, Shrikhande U, Alicie BM, Zhou Q
and Geahlen RL: Role of the protein tyrosine kinase Syk in
regulating cell-cell adhesion and motility in breast cancer cells.
Mol Cancer Res. 7:634–644. 2009. View Article : Google Scholar : PubMed/NCBI
|
|
33
|
Malkas LH, Herbert BS, Abdel-Aziz W,
Dobrolecki LE, Liu Y, Agarwal B, Hoelz D, Badve S, Schnaper L,
Arnold RJ, et al: A cancer-associated PCNA expressed in breast
cancer has implications as a potential biomarker. Proc Natl Acad
Sci USA. 103:pp. 19472–19477. 2006; View Article : Google Scholar : PubMed/NCBI
|
|
34
|
He X, Arslan AD, Ho TT, Yuan C, Stampfer
MR and Beck WT: Involvement of polypyrimidine tract-binding protein
(PTBP1) in maintaining breast cancer cell growth and malignant
properties. Oncogenesis. 3:e842014. View Article : Google Scholar : PubMed/NCBI
|
|
35
|
Arslan AD, Asztalos S, Stampfer M, Tonetti
D, He X and Beck WT: PTBP1 stability is increased in ovarian and
breast cancer cell lines compared to matched controls. Cancer Res.
73:32012013. View Article : Google Scholar
|
|
36
|
Elias D, Vever H, Lænkholm AV, Gjerstorff
MF, Yde CW, Lykkesfeldt AE and Ditzel HJ: Gene expression profiling
identifies FYN as an important molecule in tamoxifen resistance and
a predictor of early recurrence in patients treated with endocrine
therapy. Oncogene. 34:1919–1927. 2015. View Article : Google Scholar : PubMed/NCBI
|
|
37
|
Yadav V and Denning MF: Fyn is induced by
Ras/PI3K/Akt signaling and is required for enhanced
invasion/migration. Mol Carcinog. 50:346–352. 2011. View Article : Google Scholar : PubMed/NCBI
|
|
38
|
Jiang Z, Jones R, Liu JC, Deng T, Robinson
T, Chung PE, Wang S, Herschkowitz JI, Egan SE, Perou CM and
Zacksenhaus E: RB1 and p53 at the crossroad of EMT and
triple-negative breast cancer. Cell Cycle. 10:1563–1570. 2011.
View Article : Google Scholar : PubMed/NCBI
|
|
39
|
Robinson TJ, Liu JC, Vizeacoumar F, Sun T,
Maclean N, Egan SE, Schimmer AD, Datti A and Zacksenhaus E: RB1
status in triple negative breast cancer cells dictates response to
radiation treatment and selective therapeutic drugs. PLoS One.
8:e786412013. View Article : Google Scholar : PubMed/NCBI
|
|
40
|
Chano T, Ikebuchi K, Tomita Y, Jin Y,
Inaji H, Ishitobi M, Teramoto K, Ochi Y, Tameno H, Nishimura I, et
al: RB1CC1 together with RB1 and p53 predicts long-term survival in
Japanese breast cancer patients. PLoS One. 5:e157372010. View Article : Google Scholar : PubMed/NCBI
|
|
41
|
Lerebours F, Vacher S, Andrieu C, Espie M,
Marty M, Lidereau R and Bieche I: NF-kappa B genes have a major
role in inflammatory breast cancer. BMC Cancer. 8:412008.
View Article : Google Scholar : PubMed/NCBI
|
|
42
|
Pan Y, Wang R, Zhang F, Chen Y, Lv Q, Long
G and Yang K: MicroRNA-130a inhibits cell proliferation, invasion
and migration in human breast cancer by targeting the RAB5A. Int J
Clin Exp Pathol. 8:384–393. 2015.PubMed/NCBI
|
|
43
|
Liu P, Tang H, Chen B, He Z, Deng M, Wu M,
Liu X, Yang L, Ye F and Xie X: miR-26a suppresses tumour
proliferation and metastasis by targeting metadherin in triple
negative breast cancer. Cancer Lett. 357:384–392. 2015. View Article : Google Scholar : PubMed/NCBI
|
|
44
|
Fu J, Xu X, Kang L, Zhou L, Wang S, Lu J,
Cheng L, Fan Z, Yuan B, Tian P, et al: miR-30a suppresses breast
cancer cell proliferation and migration by targeting Eya2. Biochem
Biophys Res Commun. 445:314–319. 2014. View Article : Google Scholar : PubMed/NCBI
|
|
45
|
Wu ZS, Wu Q, Wang CQ, Wang XN, Huang J,
Zhao JJ, Mao SS, Zhang GH, Xu XC and Zhang N: miR-340 inhibition of
breast cancer cell migration and invasion through targeting of
oncoprotein c-Met. Cancer. 117:2842–2852. 2011. View Article : Google Scholar : PubMed/NCBI
|
|
46
|
Ma F, Zhang J, Zhong L, Wang L, Liu Y,
Wang Y, Peng L and Guo B: Upregulated microRNA-301a in breast
cancer promotes tumor metastasis by targeting PTEN and activating
Wnt/β-catenin signaling. Gene. 535:191–197. 2014. View Article : Google Scholar : PubMed/NCBI
|
|
47
|
Arora H, Qureshi R and Park WY: miR-506
regulates epithelial mesenchymal transition in breast cancer cell
lines. PLoS One. 8:e642732013. View Article : Google Scholar : PubMed/NCBI
|
|
48
|
Wang F, Lv P, Liu X, Zhu M and Qiu X:
MicroRNA-214 enhances the invasion ability of breast cancer cells
by targeting p53. Int J Mol Med. 35:1395–1402. 2015. View Article : Google Scholar : PubMed/NCBI
|
|
49
|
Inoue A, Omoto Y, Yamaguchi Y, Kiyama R
and Hayashi SI: Transcription factor EGR3 is involved in the
estrogen-signaling pathway in breast cancer cells. J Mol
Endocrinol. 32:649–661. 2004. View Article : Google Scholar : PubMed/NCBI
|
|
50
|
Zhang SY, Liu SC, Al-Saleem LF, Holloran
D, Babb J, Guo X and Klein-Szanto AJ: E2F-1: A proliferative marker
of breast neoplasia. Cancer Epidemiol Biomarkers Prev. 9:395–401.
2000.PubMed/NCBI
|
|
51
|
Booy EP, Henson ES and Gibson SB:
Epidermal growth factor regulates Mcl-1 expression through the
MAPK-Elk-1 signalling pathway contributing to cell survival in
breast cancer. Oncogene. 30:2367–2378. 2011. View Article : Google Scholar : PubMed/NCBI
|
|
52
|
Engel RH, Brown JA, Von Roenn JH, O'Regan
RM, Bergan R, Badve S, Rademaker A and Gradishar WJ: A phase II
study of single agent bortezomib in patients with metastatic breast
cancer: A single institution experience. Cancer Invest. 25:733–737.
2007. View Article : Google Scholar : PubMed/NCBI
|
|
53
|
Schmid P, Kühnhardt D, Kiewe P,
Lehenbauer-Dehm S, Schippinger W, Greil R, Lange W, Preiss J,
Niederle N, Brossart P, et al: A phase I/II study of bortezomib and
capecitabine in patients with metastatic breast cancer previously
treated with taxanes and/or anthracyclines. Ann Oncol. 19:871–876.
2008. View Article : Google Scholar : PubMed/NCBI
|
|
54
|
Burstein HJ, Elias AD, Rugo HS, Cobleigh
MA, Wolff AC, Eisenberg PD, Lehman M, Adams BJ, Bello CL, DePrimo
SE, et al: Phase II study of sunitinib malate, an oral
multitargeted tyrosine kinase inhibitor, in patients with
metastatic breast cancer previously treated with an anthracycline
and a taxane. J Clin Oncol. 26:1810–1816. 2008. View Article : Google Scholar : PubMed/NCBI
|