Introduction
Inflammatory bowel disease (IBD) refers to
idiopathic intestinal inflammatory diseases that involve the ileum,
rectum and colon. The most common forms of IBD are Crohn's disease
(CD) and ulcerative colitis (UC). IBD is a global disease, the
incidence and prevalence of which are increasing worldwide. Growing
evidence has suggested that the occurrence of IBD is closely
associated with immunological, genetic and modifiable environmental
factors in a genetically susceptible host, which results in
immunological reactions against a subset of gut commensal
microbiota (1–5).
CD involves any part of the gastrointestinal tract,
and usually affects the colon or terminal ileum. The most important
feature of CD is intestinal inflammation in a discontinuous
fashion. The pattern of inflammation for CD is associated with
pathophysiological complications, including intestinal fibrosis,
strictures, non-caseation granulomas, thickened submucosa and
fistulas (6). Conversely, UC
involves only the rectum and colon; the most important feature of
UC is superficial inflammation that is limited to the mucosa and
submucosa. Symptoms of UC include rectal bleeding, diarrhea,
abdominal pain and superficial mucosal ulceration (7). To specifically diagnose CD or UC,
radiological tests, biopsy histology, endoscopic features and
clinical symptoms are all taken into consideration (6). Unfortunately, there are no useful
diagnostic markers for CD and UC, and the majority of patients with
IBD present with serious disease, due to the lack of sensitive
biomarkers for early diagnosis. Therefore, the identification of
potential biomarkers for IBD is critical.
Noncoding RNAs (ncRNAs), which include microRNA
(miRNA), long noncoding RNA (lncRNA), circular RNA (circRNA),
transfer RNA, ribosomal RNA and small nucleolar RNA, affect every
stage of gene expression from transcription and mRNA stability to
mRNA translation. Previous studies have gradually uncovered the
critical roles for ncRNAs in disease pathogenesis (8–11).
Dysregulated expression or dysfunction of specific ncRNAs has been
reported to initiate inflammation in human disease. The three forms
of ncRNAs that are particularly important for the regulation of
gene expression in cells are miRNAs, lncRNAs and circRNAs (12). To date, an increasing number of
studies have demonstrated that ncRNAs may serve as novel biomarkers
for disease. lncRNAs, which are a type of ncRNA >200 nucleotides
in length, are able to regulate gene expression through
transcriptional regulation, post-transcriptional regulation,
chromatin modification and genomic imprinting (13,14).
Therefore, lncRNAs may be potential diagnostic biomarkers for
various diseases; however, the function and mechanism of lncRNAs
requires further investigation. A previous study reported that
there were 438 and 745 differentially expressed lncRNAs in inflamed
CD and UC respectively, compared with healthy individuals (15). A recent study indicated that
numerous lncRNAs were differentially expressed, including
ENST00000522970.1, LINC01272. ENST00000522970.1, KIF9-AS1, DIO3OS
in IBD (16). To the best of our
knowledge, KIF9-AS1, LINC01272 and DIO3OS have not been studied
yet. Therefore, the present study aimed to determine the expression
levels and diagnostic value of KIF9-AS1, LINC01272 and DIO3OS in
IBD.
The present study examined the expression levels of
KIF9-AS1, LINC01272 and DIO3OS, using reverse
transcription-quantitative polymerase chain reaction (RT-qPCR), in
tissue and plasma samples from patients with IBD and healthy
controls. The specificity and sensitivity of KIF9-AS1, LINC01272
and DIO3OS were determined using a receiver operating
characteristic (ROC) curve analysis. The potential diagnostic
values of KIF9-AS1, LINC01272 and DIO3OS in IBD were determined. In
addition, the correlations between IBD tissue and plasma expression
levels of KIF9-AS1, LINC01272 and DIO3OS were analyzed using the
Pearson Correlation Coefficient. The present study aimed to
identify the lncRNAs that may be considered potential diagnostic
biomarkers for IBD.
Materials and methods
Clinical specimens
The present study collected samples from patients
with CD or UC, and healthy controls, from The First Affiliated
Hospital of Anhui University of Traditional Chinese Medicine
(Hefei, China) between 2013 and 2016. This study was approved by
the Ethics Committee of The First Affiliated Hospital of Anhui
University of Traditional Chinese Medicine, and informed consent
was obtained from each individual. For CD or UC to be diagnosed,
symptoms were required to meet the Copenhagen criteria (17). Tissue and plasma samples were
collected from 252 individuals (84 patients with CD, 84 patients
with UC and 84 healthy controls). Healthy control individuals had
no symptoms of autoimmune diseases or IBD. For the extraction of
plasma samples, 5 ml peripheral blood was collected from all 252
individuals, plasma was separated by centrifugation (3,000 × g at
4°C for 10 min); the supernatant plasma was maintained at −80°C
until further analysis. According to the World Health Organization,
the histological diagnosis was evaluated (18). All tissue samples were frozen at
−80°C for the extraction of total RNA.
RNA preparation and RT
Total RNA was extracted from the tissue and plasma
samples using TRIzol reagent (Invitrogen; Thermo Fisher Scientific,
Inc., Waltham, MA, USA). Similarly, QIAamp Circulating Nucleic Acid
kit (Qiagen K.K., Tokyo, Japan) was used to extract total RNA from
800 µl plasma. RNA extraction was conducted according to
manufacturers' protocols. cDNA was synthesized from RNA with random
primers using a RevertAid First Strand cDNA Synthesis kit (cat. no.
K1622; Thermo Fisher Scientific, Inc.) according to the
manufacturer's protocol; each RT reaction consisted of 1.0 µg
RNA.
RT-qPCR
As described previously (19), RT-qPCR was performed using SYBR
Premix Ex Taq (Takara Bio, Inc., Otsu, Japan). qPCR was
performed on an ABI 7500 Real-Time PCR system (Applied Biosystems;
Thermo Fisher Scientific, Inc.). The mRNA expression levels of
various lncRNAs (KIF9-AS1, LINC01272 and DIO3OS) were detected by
RT-qPCR using the KAPA SYBR FAST qPCR Kit (KK4601, Kapa Biosystems,
Inc. Wilmington, MA, USA) on Applied Biosystems Real-Time PCR
system in tissue and plasma samples obtained from patients with IBD
and healthy controls The reaction system was in a 20 µl volume, and
the program of RT-qPCR was set as following: 95°C for 10 min, 95°C
for 10 sec, 60°C for 2 min, 72°C for 2 min, 72°C for 10 min, and 38
amplification cycles were performed from second step to fourth
step. The primer sequences were as follows: KIF9-AS1, forward
5′-AGTCCTTCCCATTCACAGGG-3′, reverse 5′-GCCCTCTTCTTCCTCCACAT-3′;
LINC01272, forward 5′-TGTTCACTGCTGTACACCCA-3′, reverse
5′-TGTGGAGAGGGGATTTCTGG-3′; DIO3OS, forward
5′-ATACCTACCCCTCCCCAACT-3′, reverse 5′-TACCTGCTCTGAGATGTGCC-3′; and
GAPDH, forward 5′-TGTTCGTCATGGGTGTGAAC-3′ and reverse
5′-ATGGCATGGACTGTGGTCAT-3′. The mRNA expression levels were
calculated using the 2−ΔΔCq method with GAPDH as the
control (20).
Statistical analysis
All experimental data were analyzed using SPSS
software 16.0 (SPSS, Inc., Chicago, IL, USA) and GraphPad Prism 5.0
(GraphPad Software, Inc., La Jolla, CA, USA). Association between
lncRNA expression and clinicopathological characteristics were
analyzed using Chi-squared test. Diagnostic value was detected
using a ROC curve analysis. The area under the curve was used to
assess the predictive power and to determine the cutoff scores for
the high-expression and low-expression of lncRNAs. The correlation
between lncRNA tissue and plasma expression in IBD was analyzed
using Pearson's correlation coefficient analysis. A Student's
t-test was used for comparisons between two groups, such as the
comparisons between healthy controls and CD or UC. All results are
presented as the mean ± standard deviation, experiments were
conducted in triplicate. P<0.05 was considered to indicate a
statistically significant difference.
Results
lncRNA-KIF9-AS1 is highly expressed in
IBD
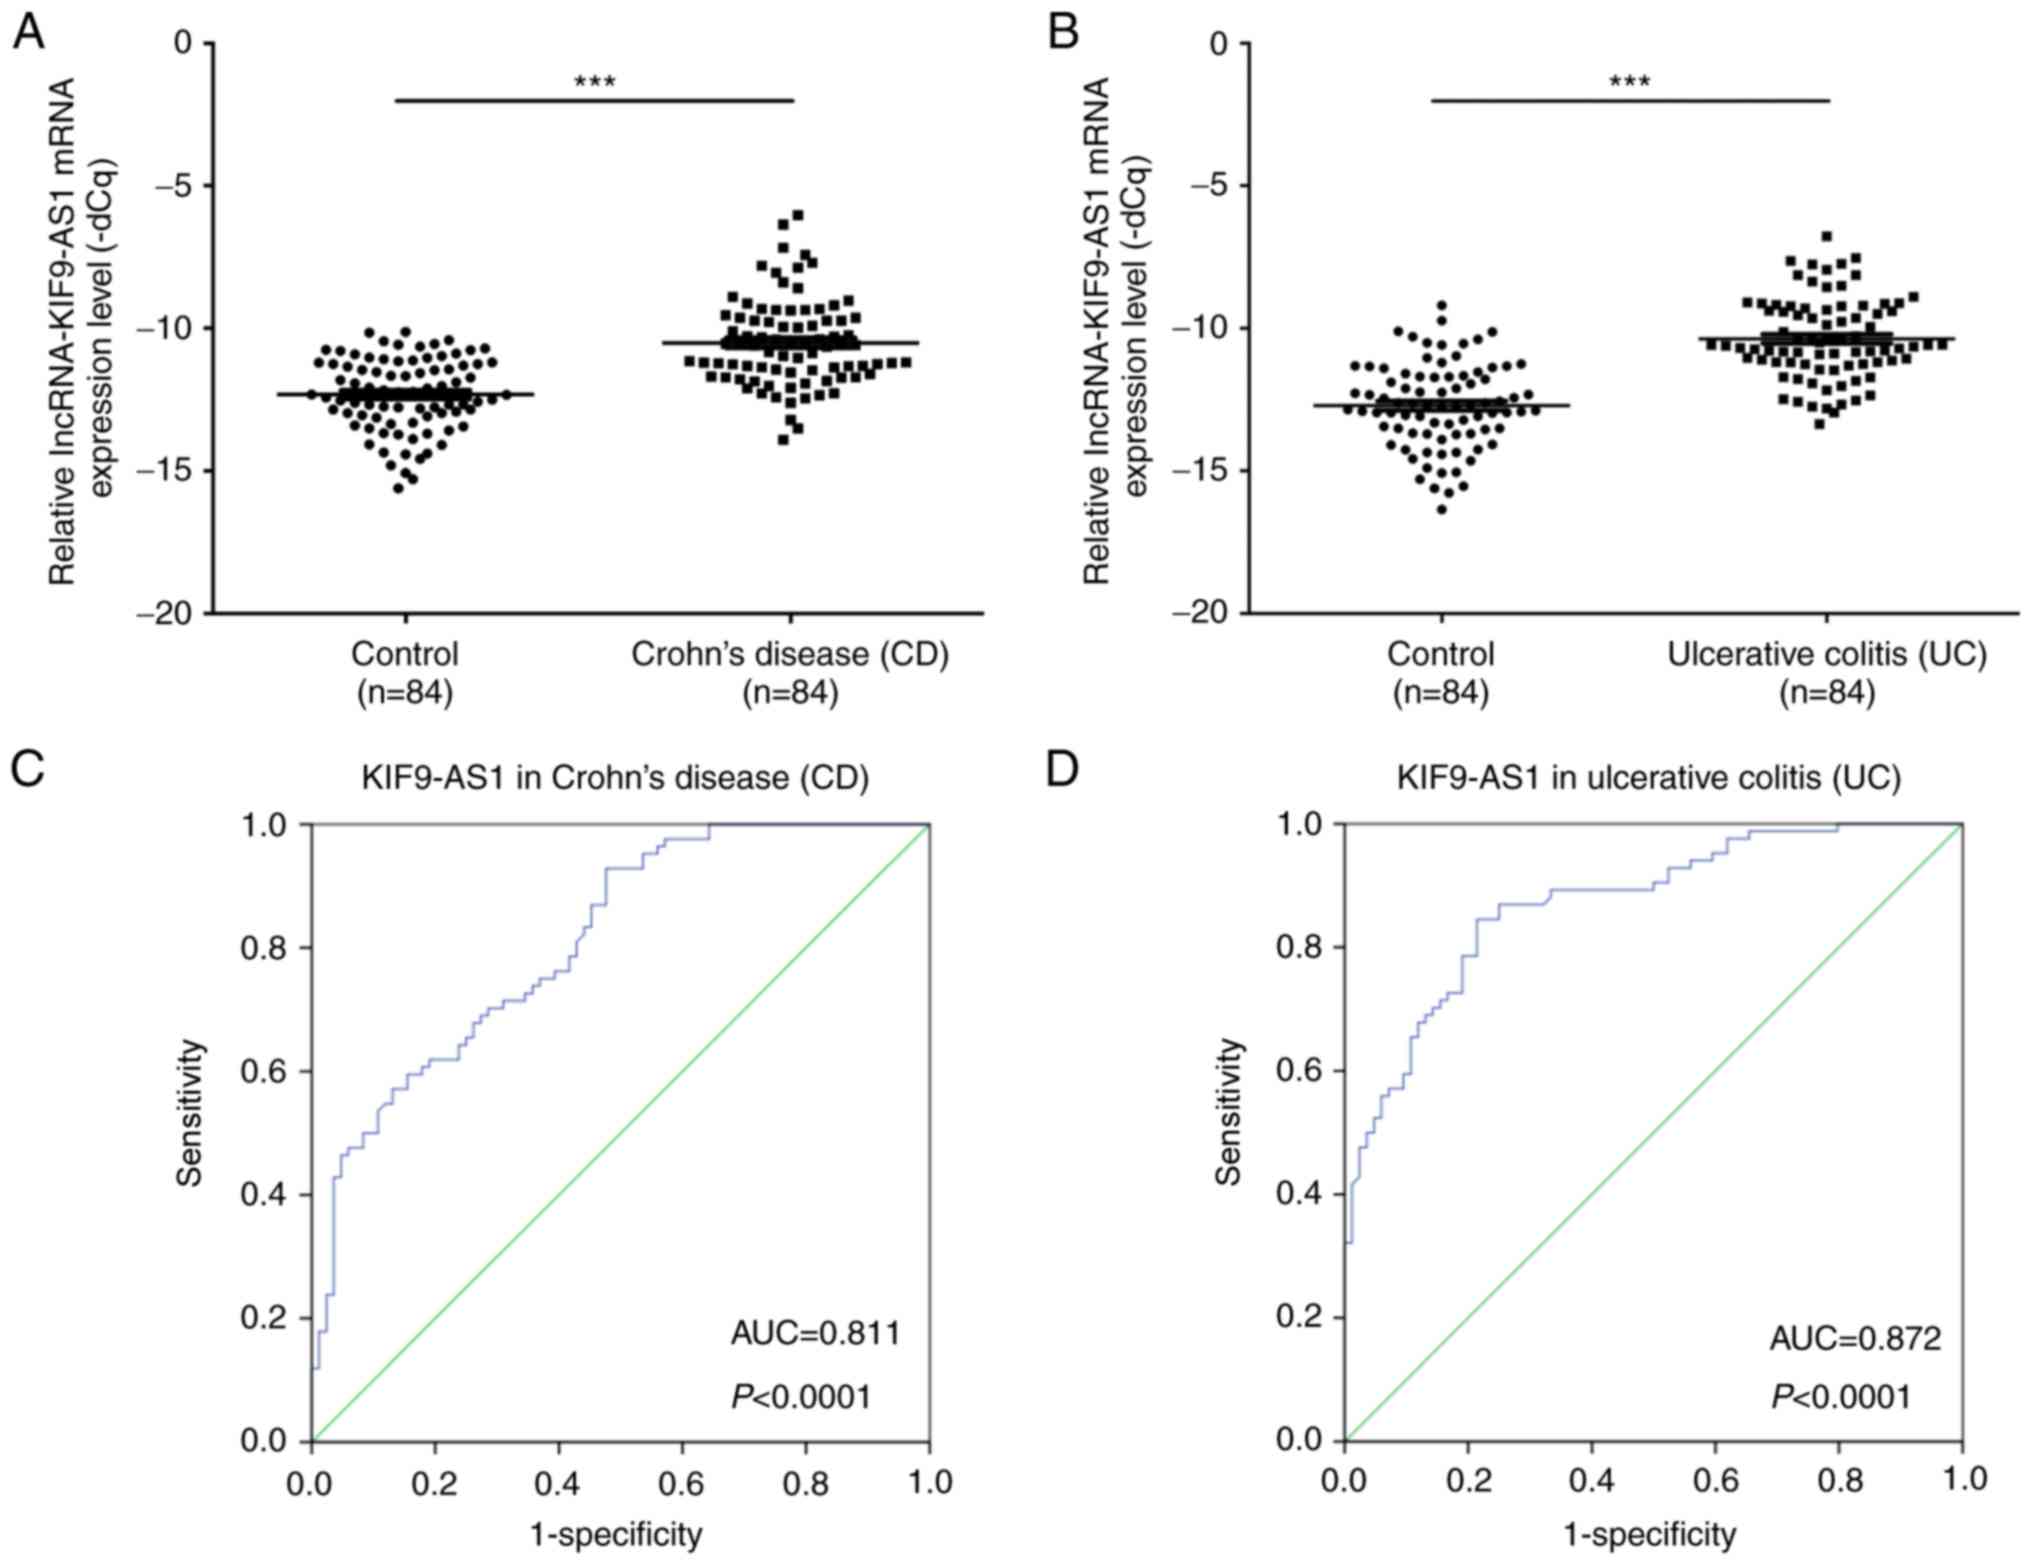
The expression levels of KIF9-AS1 in patients with
CD (n=84) and in healthy controls (n=84) were determined by
RT-qPCR. The results demonstrated that the mRNA expression levels
of KIF9-AS1 were significantly higher in patients with CD compared
with in the healthy controls (P<0.001; Fig. 1A). In addition, the mRNA expression
levels of KIF9-AS1 were significantly higher in patients with UC
(n=84) compared with in the healthy controls (P<0.001; Fig. 1B). Furthermore, the area under the
ROC curve between KIF9-AS1 expression in patients with CD and
healthy controls was 0.811 (P<0.0001; Fig. 1C). The area under the ROC curve
between KIF9-AS1 expression in patients with UC and healthy
controls was 0.872 (P<0.0001; Fig.
1D). The associations between KIF9-AS1 expression (ΔCq) and the
clinicopathological characteristics of patients with IBD are
presented in Table I. Patients
were separated into high and low expression groups according to a
cut off value (10.638 for CD; 11.313 for UC). A statistical
significance between KIF9-AS1 expression and alcohol history was
observed (P=0.023).
 | Table I.Association between KIF9-AS1
expression and clinicopathological characteristics. |
Table I.
Association between KIF9-AS1
expression and clinicopathological characteristics.
|
| CD | UC |
|---|
|
|
|
|
|---|
| Characteristic | High expression
(%) | Low expression
(%) | P-value | High expression
(%) | Low expression
(%) | P-value |
|---|
| Age (years) |
|
| 0.40 |
|
| 0.636 |
|
>60 | 36 (70.6) | 15 (29.4) |
| 19 (37.3) | 32 (62.7) |
|
|
≤60 | 26 (78.8) | 7
(21.2) |
| 14 (42.4) | 19 (57.6) |
|
| Gender |
|
| 0.356 |
|
| 0.141 |
|
Male | 38 (77.6) | 11 (22.4) |
| 16 (32.7) | 33 (67.3) |
|
|
Female | 24 (68.6) | 11 (31.4) |
| 17 (48.6) | 18 (51.4) |
|
| Tobacco
smoking |
|
| 0.12 |
|
| 0.505 |
|
Never | 17 (63.0) | 10 (37.0) |
| 12 (44.4) | 15 (55.6) |
|
| Past or
current use | 45 (78.9) | 12 (21.1) |
| 21 (36.8) | 36 (63.2) |
|
| Alcohol
history |
|
| 0.601 |
|
| 0.023a |
|
Never | 27 (71.1) | 11 (28.9) |
| 20 (52.6) | 18 (47.4) |
|
| Past or
current use | 35 (76.1) | 11 (23.9) |
| 13 (28.3) | 33 (71.7) |
|
lncRNA-LINC01272 is highly expressed
in IBD
The expression levels of LINC01272 in patients with
CD (n=84) and in healthy controls (n=84) were determined by
RT-qPCR. The results demonstrated that the mRNA expression levels
of LINC01272 were significantly higher in patients with CD compared
with in the healthy controls (P<0.001; Fig. 2A). In addition, the mRNA expression
levels of LINC01272 were significantly higher in patients with UC
(n=84) compared with in the healthy controls (P<0.001; Fig. 2B). Furthermore, the area under the
ROC curve between LINC01272 expression in patients with CD and the
healthy controls was 0.887 (P<0.0001; Fig. 2C). The area under the ROC curve
between LINC01272 expression in patients with UC and the healthy
controls was 0.777 (P<0.0001; Fig.
2D). The associations between LINC01272 expression levels (ΔCq)
and the clinicopathological characteristics of patients with IBD
are presented in Table II.
Patients were separated into high and low expression groups
according to a cut off value (10.355 for CD; 11.593 for UC). There
was a statistical significance between LINC01272 expression and
tobacco smoking (P=0.018) in CD. And there was a statistical
significance between LINC01272 expression and alcohol history
(P=0.044) in UC.
| Table II.Association between LINC01272
expression and clinicopathological characteristics. |
Table II.
Association between LINC01272
expression and clinicopathological characteristics.
|
| CD | UC |
|---|
|
|
|
|
|---|
| Characteristic | High expression
(%) | Low expression
(%) | P-value | High expression
(%) | Low expression
(%) | P-value |
|---|
| Age (years) |
|
| 0.225 |
|
| 1.00 |
|
>60 | 27 (52.9) | 24 (47.1) |
| 17 (33.3) | 34 (66.7) |
|
|
≤60 | 13 (39.4) | 20 (60.6) |
| 11 (33.3) | 22 (66.7) |
|
| Gender |
|
| 0.555 |
|
| 0.87 |
|
Male | 22 (44.9) | 27 (55.1) |
| 16 (32.7) | 33 (67.3) |
|
|
Female | 18 (51.4) | 17 (48.6) |
| 12 (34.3) | 23 (65.7) |
|
| Tobacco
smoking |
|
| 0.018a |
|
| 0.32 |
|
Never | 18 (66.7) | 9
(33.3) | | 11 (44.7) | 21 (55.3) |
|
| Past or
current use | 22 (38.6) | 35 (61.4) | | 17 (29.8) | 40 (70.2) |
|
| Alcohol
history |
|
| 0.087 |
|
| 0.044a |
|
Never | 22 (57.9) | 16 (42.1) |
| 17 (44.7) | 21 (55.3) |
|
| Past or
current use | 18 (39.1) | 28 (60.9) |
| 11 (23.9) | 35 (76.1) |
|
lncRNA-DIO3OS expression is reduced in
IBD
The expression levels of DIO3OS in patients with CD
(n=84) and in healthy controls (n=84) were determined by RT-qPCR.
The results demonstrated that the mRNA expression levels of DIO3OS
were significantly lower in patients with CD compared with in the
healthy controls (P<0.001; Fig.
3A). The mRNA expression levels of DIO3OS were also
significantly lower in patients with UC (n=84) compared with in the
healthy controls (P<0.001; Fig.
3B). Furthermore, the area under the ROC curve between DIO3OS
expression in patients with CD and the healthy controls was 0.794
(P<0.0001; Fig. 3C). The area
under the ROC curve between DIO3OS expression in patients with UC
and the healthy controls was 0.653 (P=0.001; Fig. 3D). The associations between DIO3OS
expression levels (ΔCq) and the clinicopathological characteristics
of patients with IBD are presented in Table III. Patients were separated into
high and low expression groups according to a cut off value (10.599
for CD; 12.069 for UC). A statistical significance between DIO3OS
expression and gender was observed (P=0.025) in CD.
| Table III.Association between DIO3OS expression
and clinicopathological characteristics. |
Table III.
Association between DIO3OS expression
and clinicopathological characteristics.
|
| CD | UC |
|---|
|
|
|
|
|---|
| Characteristic | High expression
(%) | Low expression
(%) | P-value | High expression
(%) | Low expression
(%) | P-value |
|---|
| Age (years) |
|
| 0.949 |
|
| 0.23 |
|
>60 | 22 (43.1) | 29 (56.9) |
| 17 (33.3) | 34 (66.7) |
|
|
≤60 | 14 (42.4) | 19 (57.6) |
| 7
(21.2) | 26 (78.8) |
|
| Gender |
|
| 0.025a |
|
| 0.62 |
|
Male | 26 (53.1) | 23 (46.9) | | 13 (26.5) | 36 (73.5) |
|
|
Female | 10 (28.6) | 25 (71.4) | | 11 (31.4) | 24 (68.6) |
|
| Tobacco
smoking |
|
| 0.225 |
|
| 0.09 |
|
Never | 9
(33.3) | 18 (66.7) |
| 11 (40.7) | 16 (59.3) |
|
| Past or
current use | 27 (47.4) | 30 (52.6) |
| 13 (22.8) | 44 (77.2) |
|
| Alcohol
history |
|
| 0.448 |
|
| 0.95 |
|
Never | 18 (47.4) | 20 (52.6) |
| 11 (28.9) | 27 (71.1) |
|
| Past or
current use | 18 (39.1) | 28 (60.9) |
| 13 (28.3) | 33 (71.7) |
|
KIF9-AS1, LINC01272 and DIO3OS
expression levels were validated in the plasma of patients with CD
and UC
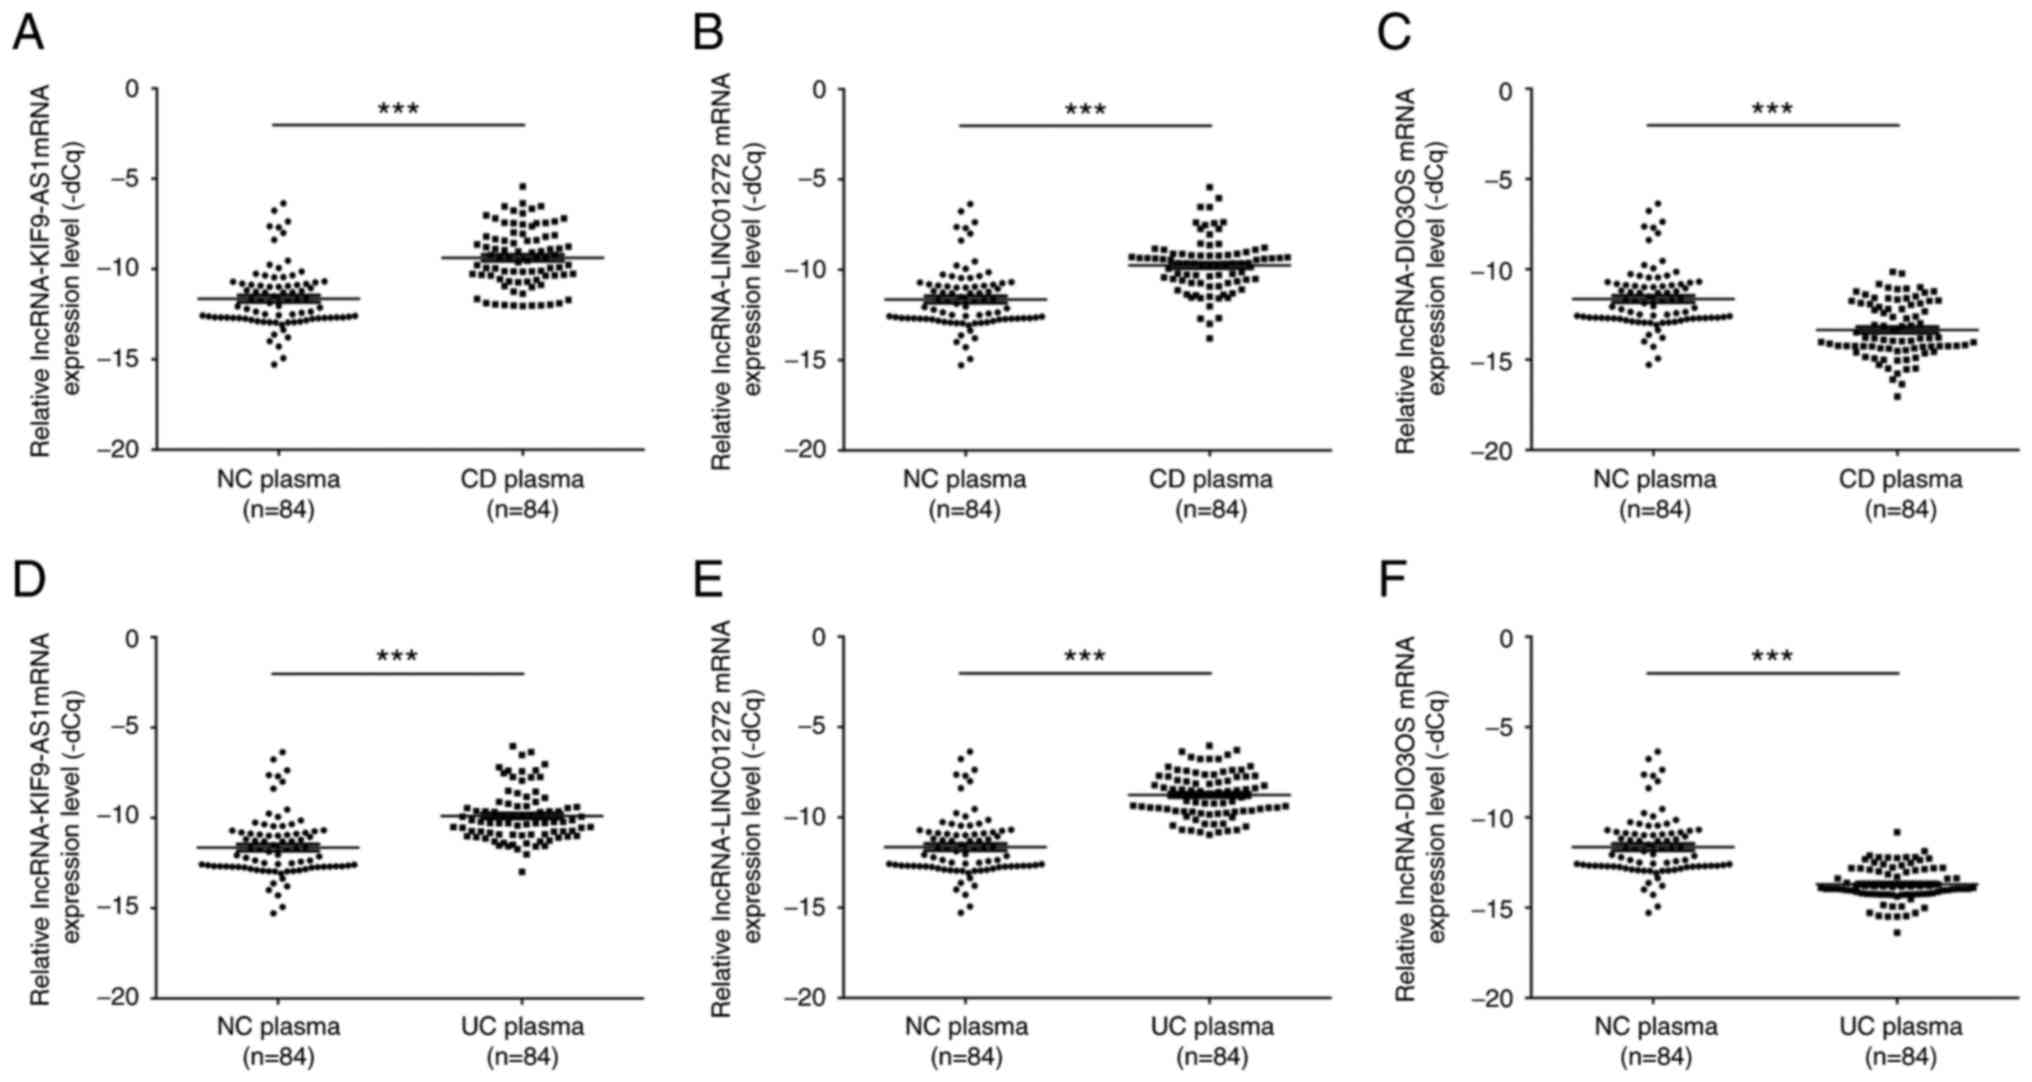
To further confirm the expression levels of
KIF9-AS1, LINC01272 and DIO3OS in patients with IBD, the mRNA
expression levels of KIF9-AS1, LINC01272 and DIO3OS were detected
in plasma samples from patients with IBD. The results indicated
that the mRNA expression levels of KIF9-AS1 were significantly
upregulated in plasma samples from patients with CD compared with
in the healthy controls (P<0.001; Fig. 4A). In addition, the mRNA expression
levels of LINC01272 were significantly upregulated in plasma
samples from patients with CD compared with in the healthy controls
(P<0.001; Fig. 4B). Conversely,
the mRNA expression levels of DIO3OS were significantly
downregulated in plasma samples from patients with CD compared with
in the healthy controls (P<0.001; Fig. 4C). Similarly, the mRNA expression
levels of KIF9-AS1 were significantly upregulated in plasma samples
from patients with UC compared with in the healthy controls
(P<0.001; Fig. 4D). The mRNA
expression levels of LINC01272 were also significantly upregulated
in plasma samples from patients with UC compared with in the
healthy controls (P<0.001; Fig.
4E). However, the mRNA expression levels of DIO3OS were
significantly downregulated in plasma samples from patients with UC
compared with in the healthy controls (P<0.001; Fig. 4F).
KIF9-AS1, LINC01272 and DIO3OS
expression is positively correlated between IBD tissue and plasma
samples
According to the present study, the mRNA expression
levels of KIF9-AS1 and KIF9-AS1 were increased in IBD tissue and
plasma samples, whereas the mRNA expression levels of DIO3OS were
decreased in IBD tissue and plasma samples. The present study
further analyzed the correlation between lncRNA expression in IBD
tissue and plasma samples. The results indicated that there was a
positive correlation between KIF9-AS1 expression in CD tissue and
plasma samples (R2=0.3788, P=0.0002; Fig. 5A), and UC tissue and plasma samples
(R2=0.3466, P=0.0012; Fig.
4B). In addition, a positive correlation was detected between
LINC01272 expression in CD tissue and plasma samples
(R2=0.7133; P<0.0001; Fig. 5C), and UC tissue and plasma samples
(R2=0.5326, P<0.0001; Fig. 5D). Furthermore, a positive
correlation was detected between DIO3OS expression in CD tissue and
plasma samples (R2=0.2524, P=0.0141; Fig. 5E), and UC tissue and plasma samples
(R2=0.2707, P=0.0083; Fig.
5F). Therefore, these results indicated that KIF9-AS1,
LINC01272 and DIO3OS were aberrantly expressed in IBD tissue and
plasma samples, and may be considered potential biomarkers for
IBD.
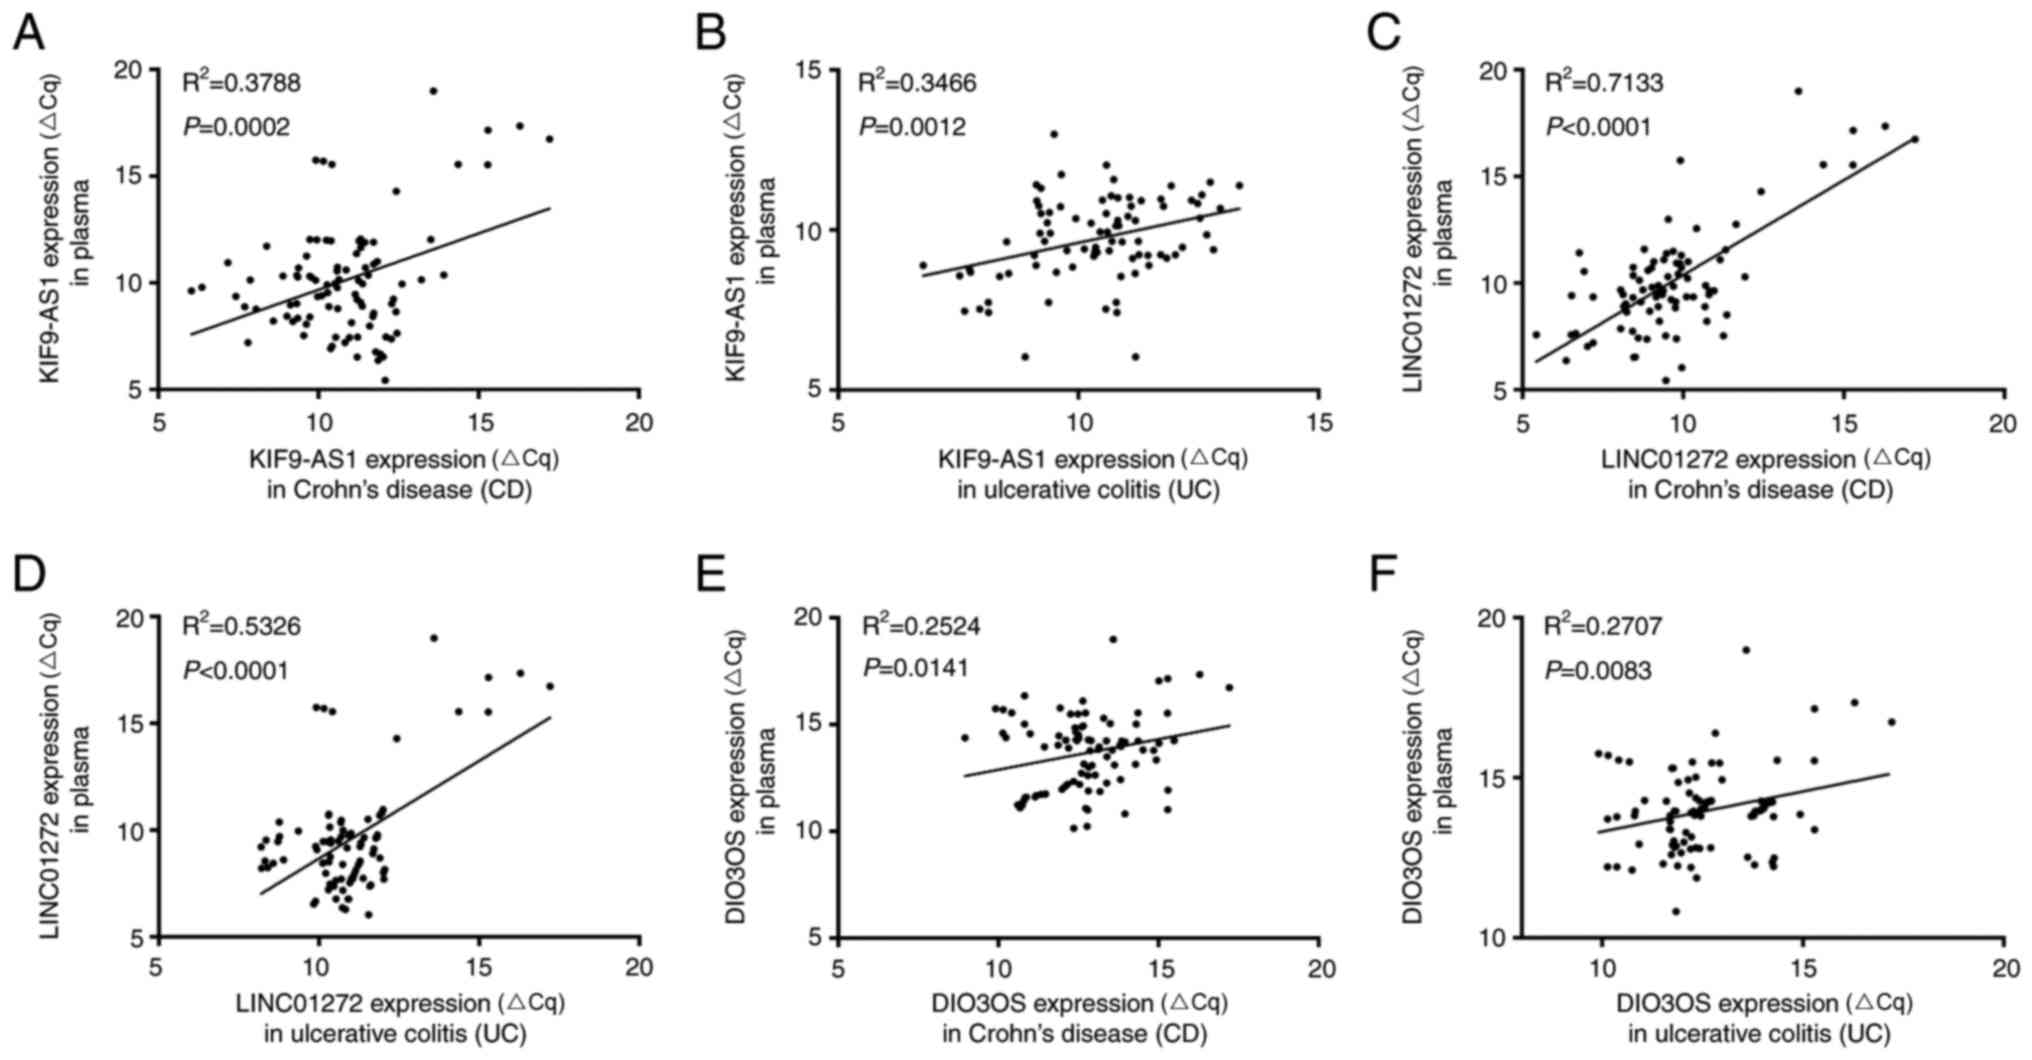 | Figure 5.Correlations in long non-coding RNA
expression between inflammatory bowel disease tissue and plasma
samples. Correlation analysis of KIF9-AS1 expression (A) between CD
tissue and plasma samples (R2=0.3788, P=0.0002, and (B)
between UC tissue and plasma samples (R2=0.3466,
P=0.0012). Correlation analysis of LINC01272 expression (C) between
CD tissue and plasma samples (R2=0.7133, P<0.0001),
and (D) between UC tissue and plasma samples (R2=0.5326,
P<0.0001). Correlation analysis of DIO3OS expression (E) between
CD tissue and plasma samples (R2=0.2524, P=0.0141, and
(F) between UC tissue and plasma samples (R2=0.2707,
P=0.0083). CD, Crohn's disease; UC, ulcerative colitis. |
Discussion
At present, research into the potential biomarkers
of IBD has focused on ncRNAs, particularly lncRNAs, most of which
are transcribed by RNA polymerase (Pol) II/Pol I, and some of which
are transcribed by RNA Pol III (21). lncRNAs are able to regulate the
expression of protein-coding genes at transcriptional and
post-transcriptional levels, and may affect physiological processes
(22,23). In addition, lncRNAs serve critical
roles in the regulation of gene expression (24–27),
and participate in cell cycle progression, cell differentiation
(28) and apoptosis (29,30).
A recent study indicated that lncRNAs are differentially expressed
in IBD (15). Furthermore,
associations among ncRNAs, cytokines and inflammation-associated
diseases have been noted (31).
Previous studies have also indicated that lncRNAs may regulate the
lipopolysaccharide-induced inflammatory response in human monocytes
(32,33), and that lncRNAs are associated with
transforming growth factor-β/Smad3-mediated renal inflammation and
fibrosis (34). lncRNA DQ786243
has been revealed to affect regulatory T cell-related cAMP response
element-binding protein and forkhead box P3 expression in CD
(34). However, the specific
functions of lncRNA are not entirely clear in inflammation. A
deeper understanding of the lncRNA regulatory network is required,
and the biological and molecular mechanisms underlying the effects
of lncRNAs require further investigation.
In a previous study (15), a microarray platform was used to
conduct genome-wide transcriptome profiling of lncRNAs in 96
inflamed and non-inflamed tissue samples extracted from numerous
colonic locations of 45 patients (CD=13, UC=20, controls=12). The
results indicated that there were 12 and 19 differentially
expressed lncRNAs associated with CD and UC, respectively. In
addition, the upregulated protein-coding genes included dual
oxidase maturation factor 2, chitinase 3 like 1, dystonin, matrix
metallopeptidase 12, lncRNAs RP11-731 F5.2 and AC007182.6, and the
downregulated protein-coding genes included phosphoenolpyruvate
carboxykinase 1, potassium two pore domain channel subfamily K
member 10, serpin family B member 3, DPP10 antisense RNA 1, CDKN2B
antisense RNA 1 and lncRNA AL928742.12 (15). The present study detected KIF9-AS1,
LINC01272 and DIO3OS expression in tissue samples from patients
with IBD and in healthy controls by RT-qPCR.
The present study demonstrated that KIF9-AS1 and
LINC01272 were significantly increased, and DIO3OS was
significantly decreased in IBD (n=168) compared with in the healthy
controls (n=168). Subsequently, the specificity and sensitivity of
KIF9-AS1, LINC01272 and DIO3OS were determined using a ROC curve
analysis. The results indicated that KIF9-AS1, LINC01272 and DIO3OS
had potential diagnostic value for the detection of IBD.
Furthermore, KIF9-AS1 and LINC01272 expression was significantly
increased, and DIO3OS was significantly decreased in plasma samples
from patients with IBD (n=168) compared with in the healthy
controls (n=168). In addition, KIF9-AS1, LINC01272 and DIO3OS
expression was significantly correlated between IBD tissue and
plasma samples. Therefore, these findings suggested that KIF9-AS1,
LINC01272 and DIO3OS may be promising candidates for the diagnosis
of IBD.
In conclusion, KIF9-AS1, LINC01272, and DIO3OS were
differentially expressed in tissue and plasma samples from patients
with IBD compared with in the healthy controls. In addition,
KIF9-AS1, LINC01272 and DIO3OS had potential diagnostic value for
the detection of IBD. Therefore, these findings indicated that
KIF9-AS1, LINC01272 and DIO3OS may be potential diagnostic
biomarkers for IBD.
References
|
1
|
Xavier RJ and Podolsky DK: Unravelling the
pathogenesis of inflammatory bowel disease. Nature. 448:427–434.
2007. View Article : Google Scholar : PubMed/NCBI
|
|
2
|
Morrison G, Headon B and Gibson P: Update
in inflammatory bowel disease. Aust Fam Physician. 38:956–961.
2009.PubMed/NCBI
|
|
3
|
Uslu N, Usta Y, Balamtekin N, Demir H,
Saltik-Temizel IN and Yüce A: Inflammatory bowel disease in
infancy. Indian J Gastroenterol. 28:224–225. 2009. View Article : Google Scholar : PubMed/NCBI
|
|
4
|
Van Limbergen J, Radford-Smith G and
Satsangi J: Advances in IBD genetics. Nat Rev Gastroenterol
Hepatol. 11:372–385. 2014. View Article : Google Scholar : PubMed/NCBI
|
|
5
|
Sartor RB: Genetics and environmental
interactions shape the intestinal microbiome to promote
inflammatory bowel disease versus mucosal homeostasis.
Gastroenterology. 139:1816–1819. 2010. View Article : Google Scholar : PubMed/NCBI
|
|
6
|
Abraham C and Cho JH: Inflammatory bowel
disease. N Engl J Med. 361:2066–2078. 2009. View Article : Google Scholar : PubMed/NCBI
|
|
7
|
Hanauer SB, Robinson M, Pruitt R, Lazenby
AJ, Persson T, Nilsson LG, Walton-Bowen K, Haskell LP and Levine
JG: Budesonide enema for the treatment of active, distal ulcerative
colitis and proctitis: A dose-ranging study. U.S. Budesonide enema
study group. Gastroenterology. 115:525–532. 1998. View Article : Google Scholar : PubMed/NCBI
|
|
8
|
Avitabile C, Cimmino A and Romanelli A:
Oligonucleotide analogues as modulators of the expression and
function of noncoding RNAs (ncRNAs): Emerging therapeutics
applications. J Med Chem. 57:10220–10240. 2014. View Article : Google Scholar : PubMed/NCBI
|
|
9
|
Bayoumi AS, Sayed A, Broskova Z, Teoh JP,
Wilson J, Su H, Tang YL and Kim IM: Crosstalk between Long
Noncoding RNAs and MicroRNAs in Health and Disease. Int J Mol Sci.
17:3562016. View Article : Google Scholar : PubMed/NCBI
|
|
10
|
Wang Y, Chen L, Chen B, Li X, Kang J, Fan
K, Hu Y, Xu J, Yi L, Yang J, et al: Mammalian ncRNA-disease
repository: A global view of ncRNA-mediated disease network. Cell
Death Dis. 4:e7652013. View Article : Google Scholar : PubMed/NCBI
|
|
11
|
Xie N and Liu G: ncRNA-regulated immune
response and its role in inflammatory lung diseases. Am J Physiol
Lung Cell Mol Physiol. 309:L1076–L1087. 2015.PubMed/NCBI
|
|
12
|
Hayes EL and Lewis-Wambi JS: Mechanisms of
endocrine resistance in breast cancer: An overview of the proposed
roles of noncoding RNA. Breast Cancer Res. 17:402015. View Article : Google Scholar : PubMed/NCBI
|
|
13
|
Guttman M and Rinn JL: Modular regulatory
principles of large non-coding RNAs. Nature. 482:339–346. 2012.
View Article : Google Scholar : PubMed/NCBI
|
|
14
|
Khalil AM, Guttman M, Huarte M, Garber M,
Raj A, Rivea Morales D, Thomas K, Presser A, Bernstein BE, van
Oudenaarden A, et al: Many human large intergenic noncoding RNAs
associate with chromatin-modifying complexes and affect gene
expression. Proc Natl Acad Sci USA. 106:pp. 11667–11672. 2009;
View Article : Google Scholar : PubMed/NCBI
|
|
15
|
Mirza AH, Berthelsen CH, Seemann SE, Pan
X, Frederiksen KS, Vilien M, Gorodkin J and Pociot F:
Transcriptomic landscape of lncRNAs in inflammatory bowel disease.
Genome Med. 7:392015. View Article : Google Scholar : PubMed/NCBI
|
|
16
|
Zacharopoulou E, Gazouli M, Tzouvala M,
Vezakis A and Karamanolis G: The contribution of long non-coding
RNAs in Inflammatory Bowel Diseases. Dig Liver Dis. 49:1067–1072.
2017. View Article : Google Scholar : PubMed/NCBI
|
|
17
|
Jakobsen C, Bartek J Jr, Wewer V, Vind I,
Munkholm P, Groen R and Paerregaard A: Differences in phenotype and
disease course in adult and paediatric inflammatory bowel disease-a
population-based study. Aliment Pharmacol Ther. 34:1217–1224. 2011.
View Article : Google Scholar : PubMed/NCBI
|
|
18
|
Peyrin-Biroulet L, Cieza A, Sandborn WJ,
Coenen M, Chowers Y, Hibi T, Kostanjsek N, Stucki G and Colombel
JF; International Programme to Develop New Indexes for Crohn's
Disease (IPNIC) group, : Development of the first disability index
for inflammatory bowel disease based on the international
classification of functioning, disability and health. Gut.
61:241–247. 2012. View Article : Google Scholar : PubMed/NCBI
|
|
19
|
Jiang L, Lai YK, Zhang J, Wang H, Lin MC,
He ML and Kung HF: Targeting S100P inhibits colon cancer growth and
metastasis by Lentivirus-mediated RNA interference and proteomic
analysis. Mol Med. 17:709–716. 2011. View Article : Google Scholar : PubMed/NCBI
|
|
20
|
Livak KJ and Schmittgen TD: Analysis of
relative gene expression data using real-time quantitative PCR and
the 2(-Delta Delta C(T)) method. Methods. 25:402–408. 2001.
View Article : Google Scholar : PubMed/NCBI
|
|
21
|
Bierhoff H, Schmitz K, Maass F, Ye J and
Grummt I: Noncoding transcripts in sense and antisense orientation
regulate the epigenetic state of ribosomal RNA genes. In: Cold
Spring Harbor symposia on quantitative biology. Cold Spring Harb
Symp Quant Biol. 2010:357–364. 2011.
|
|
22
|
Qiu MT, Hu JW, Yin R and Xu L: Long
noncoding RNA: An emerging paradigm of cancer research. Tumor Biol.
34:613–620. 2013. View Article : Google Scholar
|
|
23
|
Eades G, Zhang YS, Li QL, Xia JX, Yao Y
and Zhou Q: Long non-coding RNAs in stem cells and cancer. World J
Clin Oncol. 5:134–141. 2014. View Article : Google Scholar : PubMed/NCBI
|
|
24
|
Wang KC and Chang HY: Molecular mechanisms
of long noncoding RNAs. Mol Cell. 43:904–914. 2011. View Article : Google Scholar : PubMed/NCBI
|
|
25
|
Nagano T and Fraser P: No-nonsense
functions for long noncoding RNAs. Cell. 145:178–181. 2011.
View Article : Google Scholar : PubMed/NCBI
|
|
26
|
Mercer TR, Dinger ME and Mattick JS: Long
non-coding RNAs: Insights into functions. Nat Rev Genet.
10:155–159. 2009. View
Article : Google Scholar : PubMed/NCBI
|
|
27
|
Loewer S, Cabili MN, Guttman M, Loh YH,
Thomas K, Park IH, Garber M, Curran M, Onder T, Agarwal S, et al:
Large intergenic non-coding RNA-RoR modulates reprogramming of
human induced pluripotent stem cells. Nat Genet. 42:1113–1117.
2010. View
Article : Google Scholar : PubMed/NCBI
|
|
28
|
Liu X, Li D, Zhang W, Guo M and Zhan Q:
Long non-coding RNA gadd7 interacts with TDP-43 and regulates Cdk6
mRNA decay. EMBO J. 31:4415–4427. 2012. View Article : Google Scholar : PubMed/NCBI
|
|
29
|
Lakhotia SC: Long non-coding RNAs
coordinate cellular responses to stress. Wiley Interdiscip Rev.
3:779–796. 2012. View Article : Google Scholar
|
|
30
|
Paralkar VR and Weiss MJ: A new ‘Linc’
between noncoding RNAs and blood development. Genes Dev.
25:2555–2558. 2011. View Article : Google Scholar : PubMed/NCBI
|
|
31
|
Marques-Rocha JL, Samblas M, Milagro FI,
Bressan J, Martinez JA and Marti A: Noncoding RNAs, cytokines, and
inflammation-related diseases. FASEB J. 29:3595–3611. 2015.
View Article : Google Scholar : PubMed/NCBI
|
|
32
|
Ilott NE, Heward JA, Roux B, Tsitsiou E,
Fenwick PS, Lenzi L, Goodhead I, Hertz-Fowler C, Heger A, Hall N,
et al: Corrigendum: Long non-coding RNAs and enhancer RNAs regulate
the lipopolysaccharide-induced inflammatory response in human
monocytes. Nat Commun. 6:68142015. View Article : Google Scholar : PubMed/NCBI
|
|
33
|
IIott NE, Heward JA, Roux B, Tsitsiou E,
Fenwick PS, Lenzi L, Goodhead I, Hertz-Fowler C, Heger A, Hall N,
et al: Long non-coding RNAs and enhancer RNAs regulate the
lipopolysaccharide-induced inflammatory response in human
monocytes. Nat Commun. 5:39792014. View Article : Google Scholar : PubMed/NCBI
|
|
34
|
Zhou Q, Chung AC, Huang XR, Dong Y, Yu X
and Lan HY: Identification of novel long noncoding RNAs associated
with TGF-β/Smad3-mediated renal inflammation and fibrosis by RNA
sequencing. Am J Pathol. 184:409–417. 2014. View Article : Google Scholar : PubMed/NCBI
|
|
35
|
Qiao YQ, Huang ML, Xu AT, Zhao D, Ran ZH
and Shen J: LncRNA DQ786243 affects Treg related CREB and Foxp3
expression in Crohn's disease. J Biomed Sci. 20:872013. View Article : Google Scholar : PubMed/NCBI
|