Introduction
Benign lymphoepithelial lesion (BLEL), also termed
Mikulicz disease, is a systemic inflammatory disease of unknown
origin. It is characterized by bilateral and persistent enlargement
of lacrimal and salivary glands caused by infiltration of
immunoglobulin (Ig)G4-positive plasma cells in the gland tissues
(1,2). Initially assumed to be Sjögren's
syndrome due to their histopathological similarities, Mikulicz
disease has been established as a novel clinical entity. As a
result of the elevated IgG4 concentration in serum in addition to
the tumor-like swelling of involved organs and their variable
degrees of fibrosis, Mikulicz disease has been included among the
IgG4-associated diseases and recognized as immune-mediated
conditions (1−3).
A number of cases and types of lymphoma have been
reported in patients with BLEL however it is difficult to estimate
the exact rate of lymphoma occurrence because of the low prevalence
of malignant transformation. Nevertheless, a rate of 10.4% (11/106
patients) of malignancies was observed by Yamamoto et al
(4) in 2012, 12% (2/17) by Sato
et al (5) in 2008, and
14.3% (2/14) by Go et al (6) in 2012. Additionally, increasing
numbers of studies highlighting evidence of malignant lymphoma
among patients with Mikulicz disease and IgG4-associated disorders
are accumulating. In 1971, Azzopardi et al (7) reported on five patients who exhibited
signs of Mikulicz disease and malignant lymphoma at the same site;
years later, three cases of possible malignant transformation of
BLEL in human immunodeficiency virus-infected patients were
reported (8); three other cases of
malignant lymphoma, which arose in the parotid and the lacrimal
glands of patients with BLEL, were reported by Sato et al
(9) in 2002. More recently,
marginal zone B cell lymphoma-mimicking IgG4-associated
dacryoadenitis and sialoadenitis (10), or ocular adnexal marginal zone
lymphomas arising from association with IgG4-associated disease,
were reported (11). All these
observations suggested that patients with BLEL, in addition to
people suffering from IgG4-associated disease, exhibit a markedly
increased risk for developing malignant lymphoma. Although, the
risk of malignancy had been highlighted in BLEL and IgG4-associated
disorders, the mechanisms underlying this malignant transformation
remain unknown. The present study aimed to identify the molecular
mechanisms, which may be involved in this malignant transformation
by analyzing gene expression profiles between the two
conditions.
Materials and methods
Sampling and microarray data
processing
Following signed consent being obtained from all
patients, tissue biopsies were obtained at Beijing Tongren Hospital
between December 2011 and April 2012 from an adult population
(36−78 years old, with a male:female ratio of 1:1.25)
with the approval of the Local Ethics Committee of Beijing Tongren
Hospital, Capital Medical University (Beijing, China). Biopsies of
14 fresh orbital tissues of malignant lymphoepithelial lesions
(MLELs) composed of malignant B lymphoma patients (nine
mucosa-associated lymphoid tissue B lymphomas, two large B
lymphomas and three other B lymphomas) and 13 orbital tissues from
patients with BLEL were subjected to Phalanx Human
OneArray® Gene Expression Profiling (Phalanx Biotech
Group, Hsinchu, Taiwan), according to the manufacturer's protocol.
All the data were analyzed in duplicate. Following this, a robust
multi-array average algorithm in the Affy package (Bioconductor;
bioconductor.org/packages/release/bioc/html/affy.html) was used
with R software (R version 3.3.0; www.r-project.org) for background correction, quantile
normalization, and for summarization of the expression measure for
each probe set in each array.
Identification and clustering of
differentially expressed genes (DEGs)
A linear model for microarray data analysis provided
by Bioconductor was fitted to the obtained gene expression matrix,
which was used to identify the DEGs between BLEL and MLEL. The
Benjamini-Hochberg procedure for multiple testing correction was
used to control the false discovery rate (FDR) and significant DEGs
were selected with |log2FC|>1 and FDR<0.01. Clustering
analysis and heatmap creation for the DEGs were performed using
dChip software version 2011.01 (12,13).
Protein-protein interaction (PPI)
network construction for the DEGs
In living cells, molecular and biological processes
are regulated by PPIs. PPIs are useful resources to identify novel
pathways in order to gain a basic knowledge of diseases. Therefore,
PPI were assessed for down- and upregulated DEGs with the online
Search Tool for the Retrieval of Interacting Genes platform
(version 10.0; https://string-db.org/). The highest
confidence score ≥0.9 was used to predict links between proteins
involved in the network and visualization of the interaction
network was performed using Cytoscape (Cytoscape version 3.4.0;
http://www.cytoscape.org/).
Functional annotation and pathway
enrichment
Gene ontology (GO) functional annotation for
biological process and the Kyoto Encyclopedia of Genes and Genomes
(KEGG) pathways enrichment for the DEGs between MLEL and BLEL were
performed using version 6.8 of the Database for Annotation,
Visualization and Integrated Discovery (DAVID) online platform;
https://david.ncifcrf.gov/. The
Benjamini-Hochberg procedure for multiple testing correction was
used to control the FDR. Significantly enriched GO terms and KEGG
pathways were selected with an FDR<0.05.
Statistical analysis
Quantitative data were analyzed using GraphPad Prism
v.5 (GraphPad Software, Inc., La Jolla, CA, USA) and are plotted as
the mean ± standard error of the mean. For group comparisons,
one-way analysis of variance with Bonferroni's multiple comparison
test was used. P<0.05 was considered to indicate a statistically
significant difference.
Results
Differential gene expression and
expression pattern between BLEL and MLEL
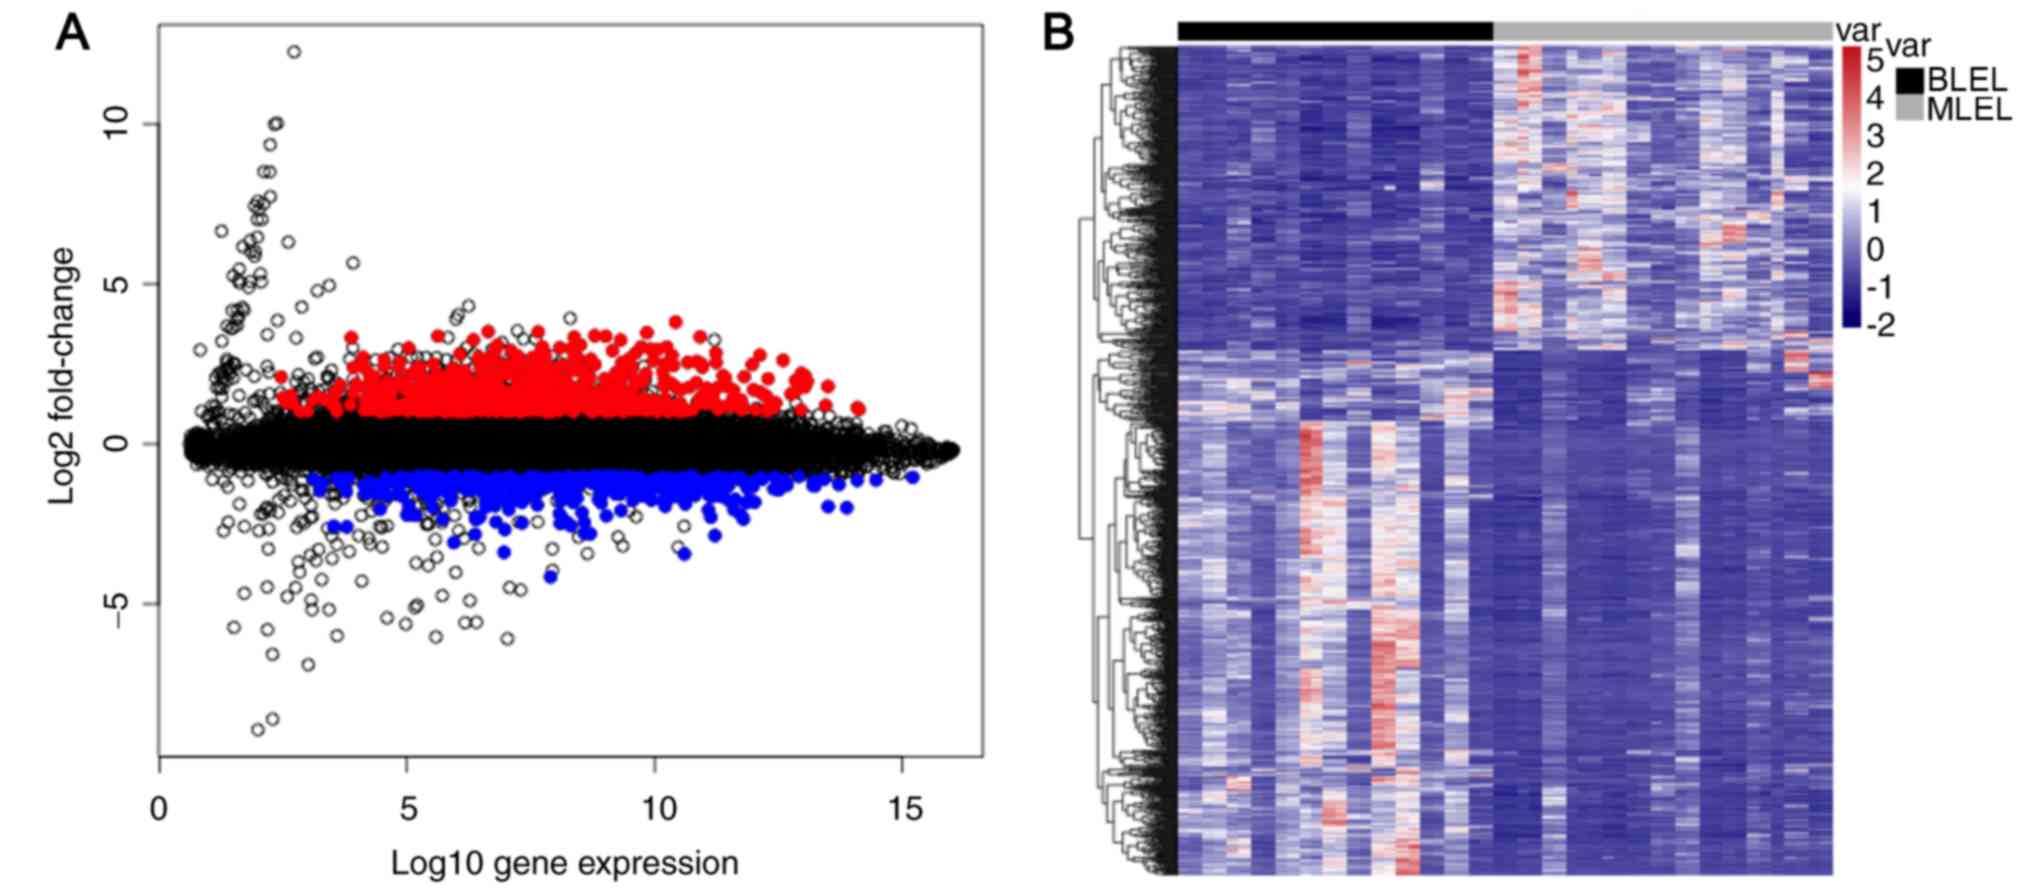
Gene expression profiling between BLEL (n=13) and
MLEL (n=14) biopsy tissues were performed for a total of 20,138
genes, and significant DEGs between the BLEL group and MLEL group
were selected with |log2FC|>1 and FDR<0.01. A total of 1,002
genes (4.98%) were identified to be differentially expressed.
Compared with the MLEL samples, 364 genes were downregulated and
638 genes upregulated in the BLEL group.
The results of the DEG visualization and selection,
and the hierarchical clustering of the DEGs between the BLEL and
MLEL groups, are exhibited for each replicate in Fig. 1.
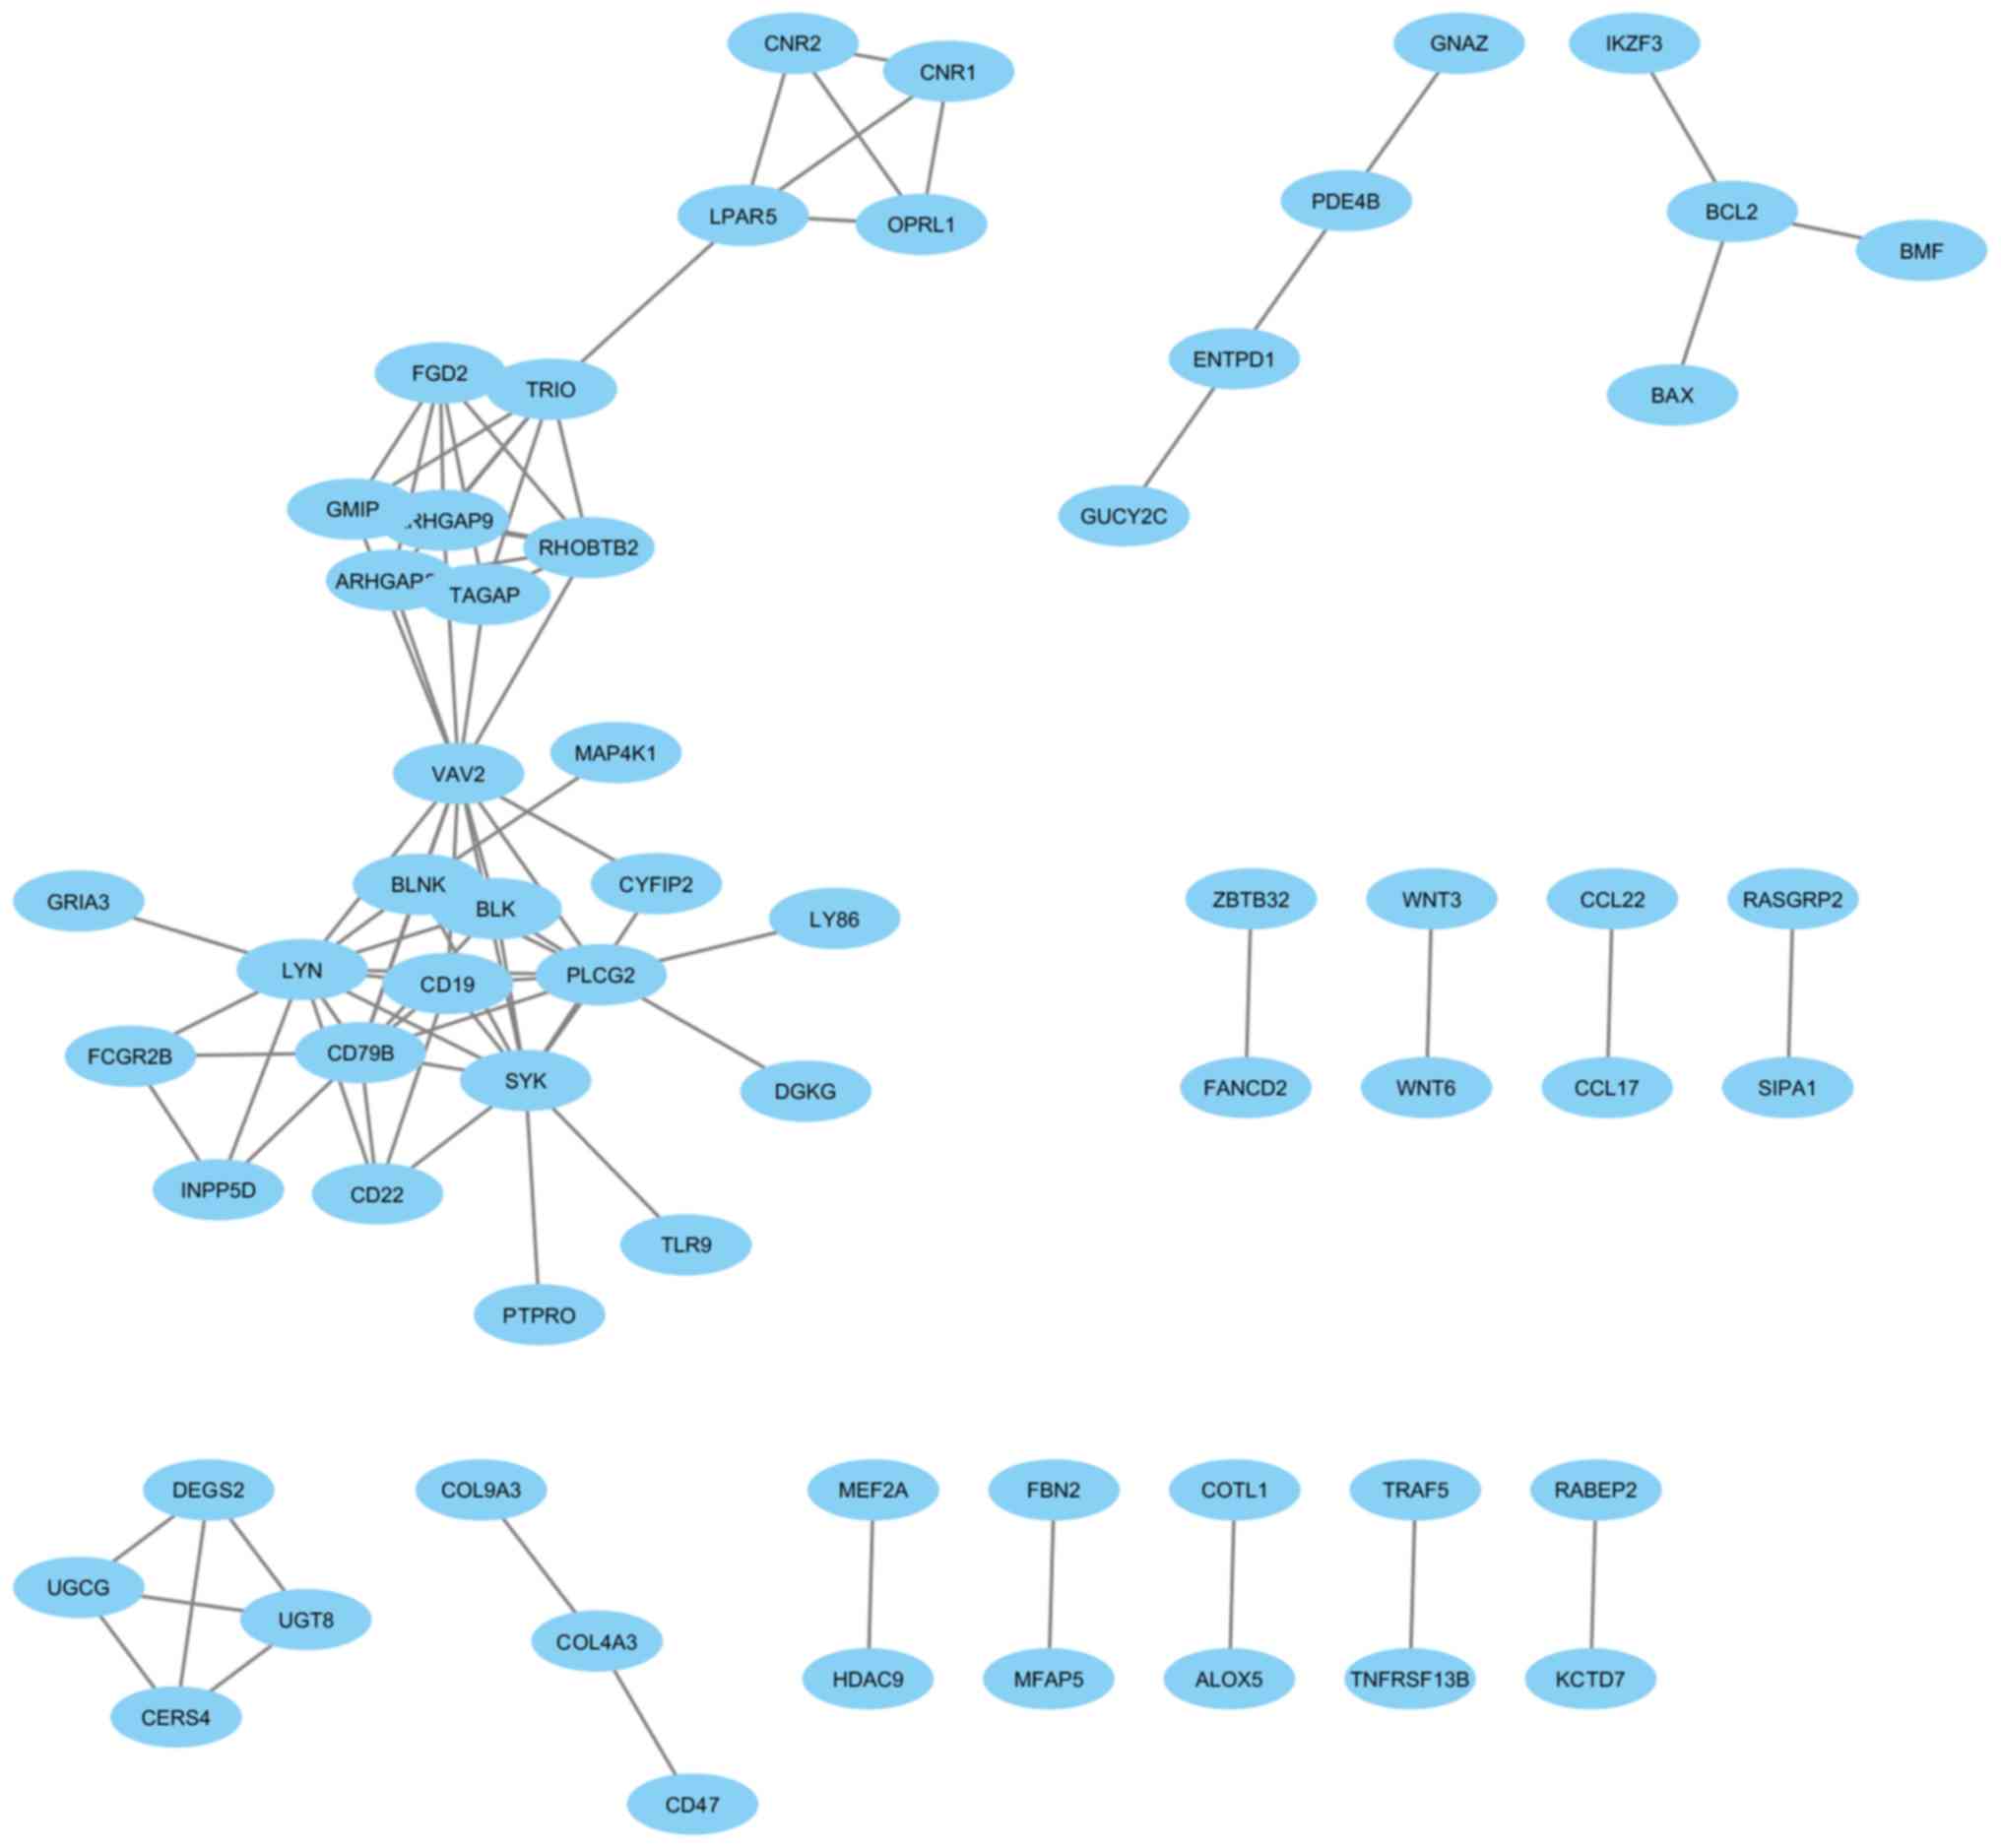
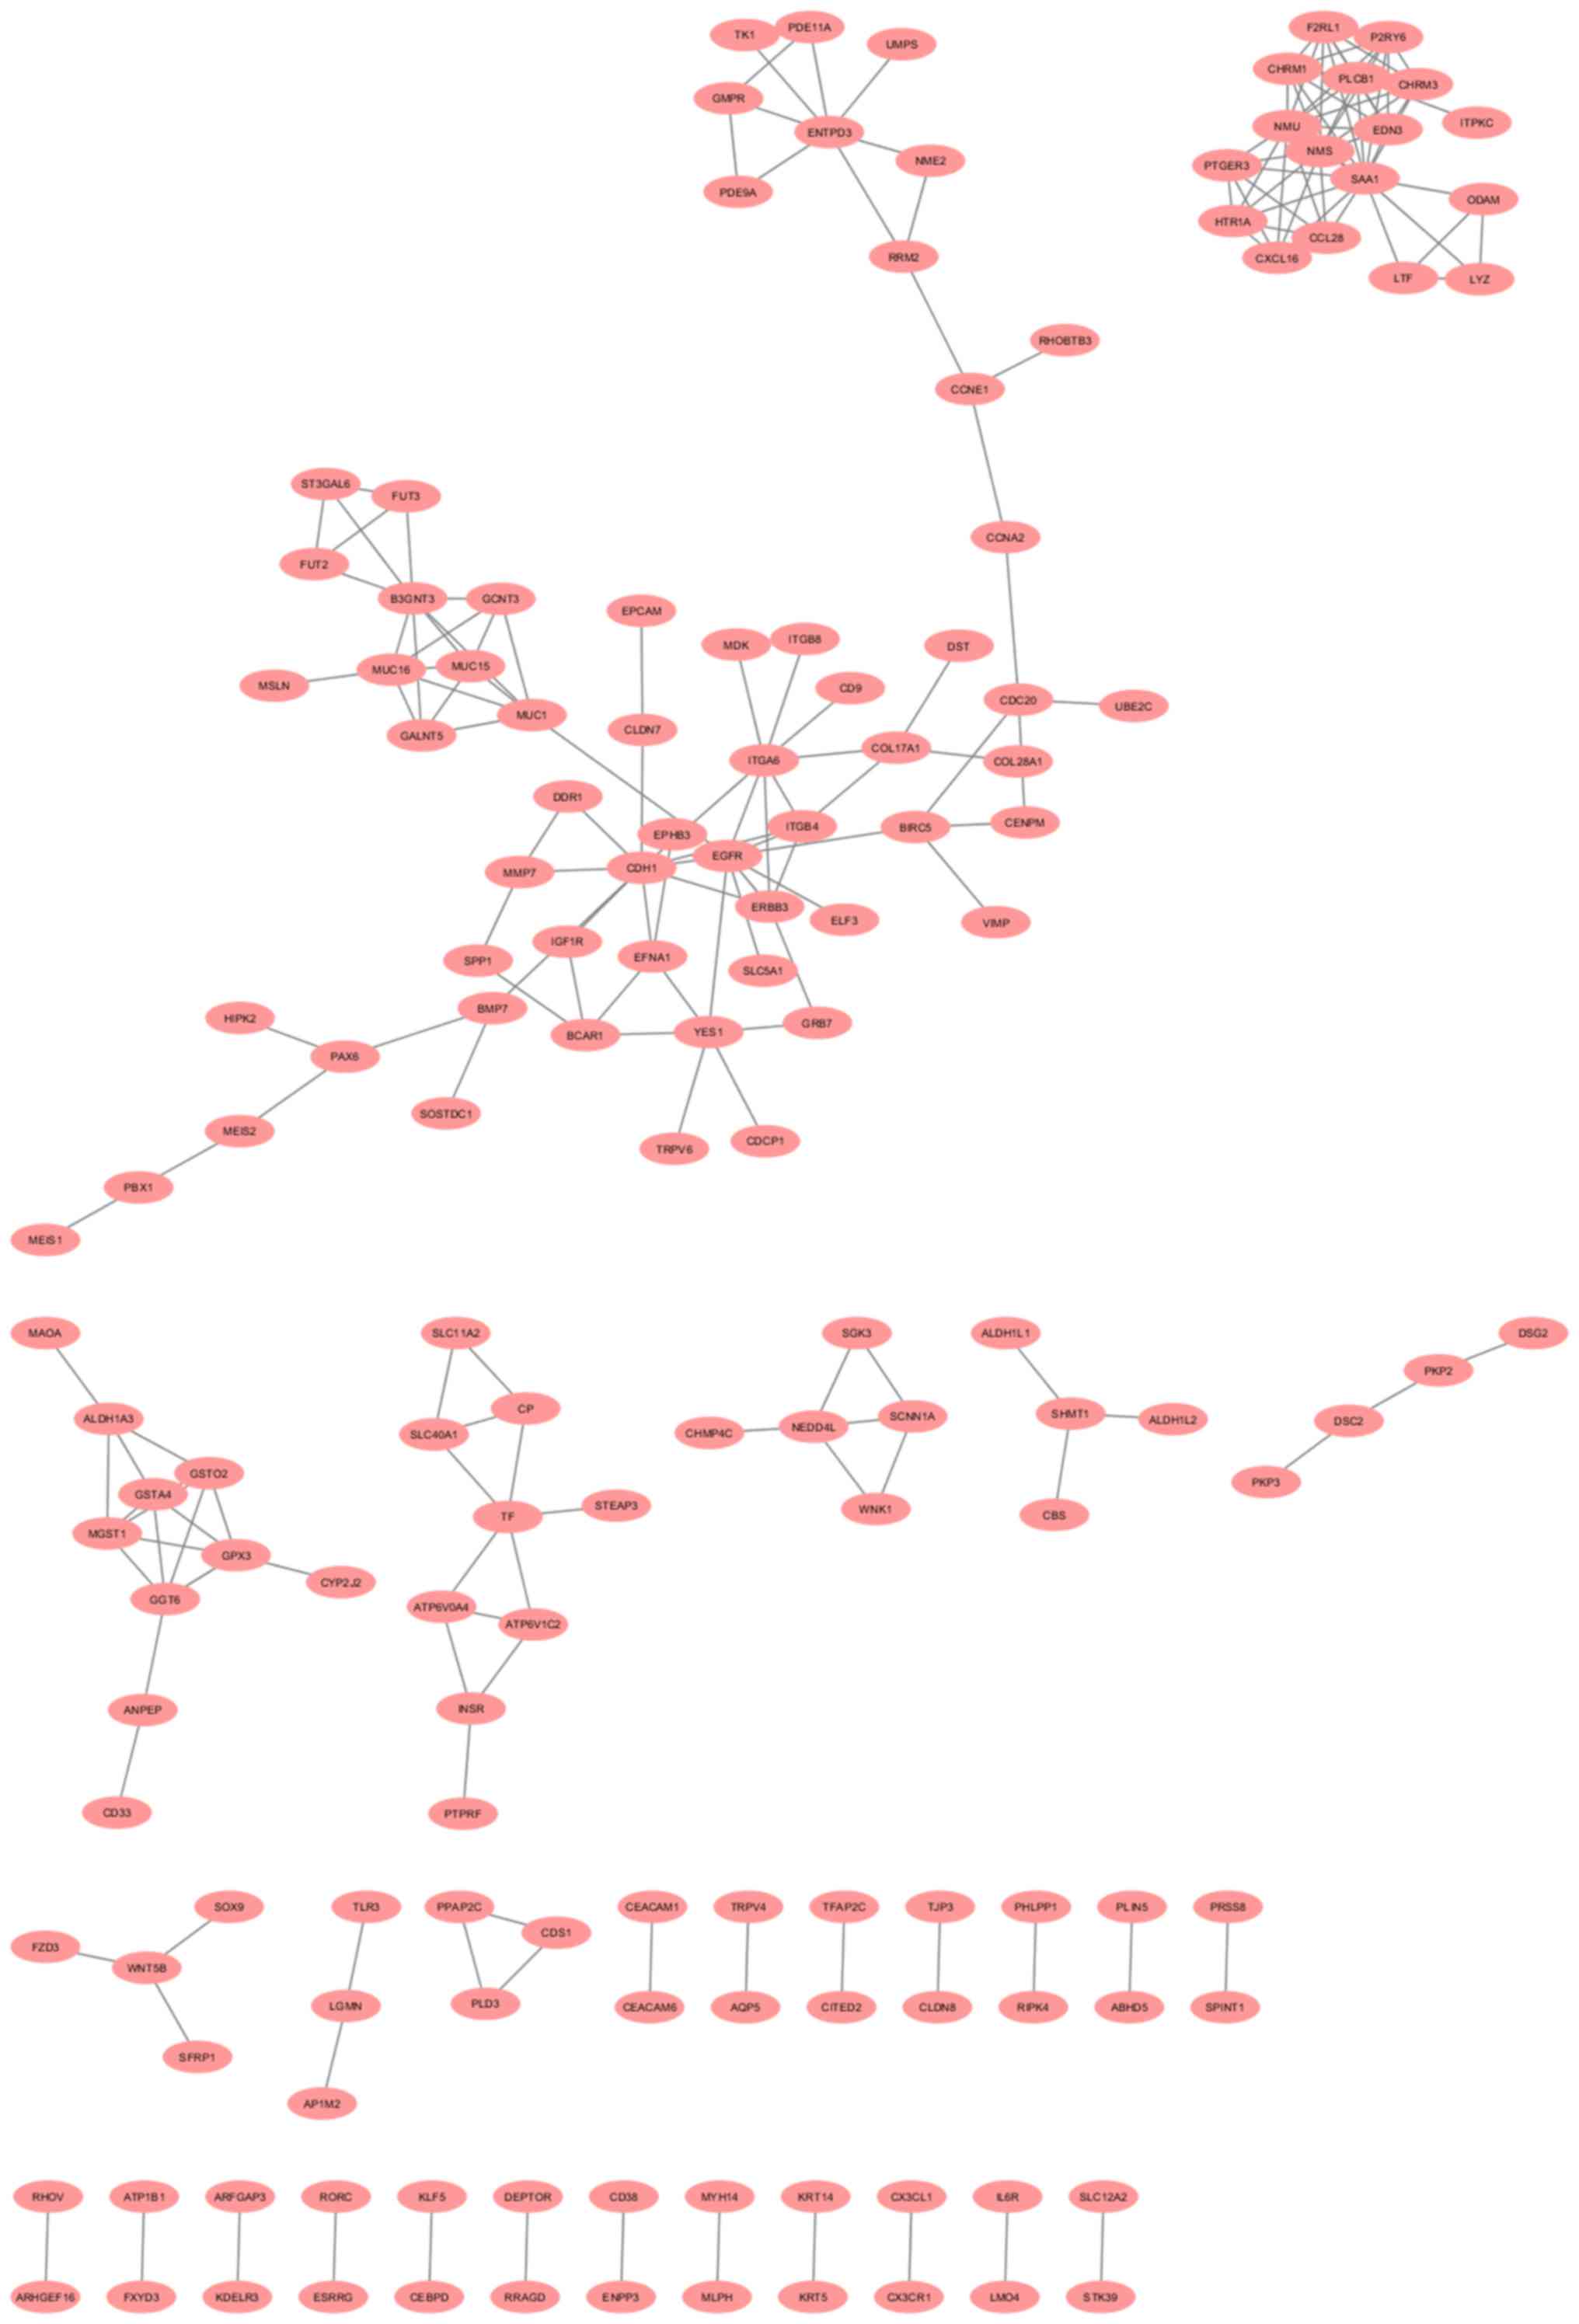
PPI network analysis of the DEGs
The analysis of the PPIs for up- and downregulated
DEGs with a confidence score ≥0.9 revealed that 62 proteins from
the downregulated DEGs in the BLEL samples were engaged in the PPI
networks, with a total of 91 interactions (Fig. 2). For the upregulated DEGs, 216
interactions were observed among the 156 proteins implicated in the
PPI network (Fig. 3).
Functional annotation of DEGs in the
PPI network
The downregulated DEGs in the BLEL group compared
with the MLEL group were primarily increased in biological
processes associated with immune signaling functions, including
signal transduction, B cell activation and differentiation,
response to stimulus and immune system process, while the
upregulated DEGs were primarily associated with
development-associated signaling processes, including cells and
cellular components movement, response to stimulus, gland and
tissues development, biological adhesion and cell migration
(Tables I and II).
 | Table I.Top enriched biological processes for
downregulated differential expressed genes in protein-protein
interactions. |
Table I.
Top enriched biological processes for
downregulated differential expressed genes in protein-protein
interactions.
| Term | Count | P-value | FDR |
|---|
| GO:0007165-signal
transduction | 47 |
6.99×10⁻¹¹ |
1.62×10⁻⁷ |
|
GO:0048583-regulation of response to
stimulus | 37 |
6.42×10⁻¹⁰ |
7.44×10⁻⁷ |
| GO:0007154-cell
communication | 47 |
1.61×10⁻⁹ |
7.45×10⁻⁷ |
| GO:0044700-single
organism signaling | 47 |
1.04×10⁻⁹ |
8.00×10⁻⁷ |
|
GO:0023052-signaling | 47 |
1.43×10⁻⁹ |
8.26×10⁻⁷ |
| GO:0050853-B cell
receptor signaling pathway | 8 |
2.77×10⁻⁹ |
1.07×10⁻⁶ |
| GO:0051716-cellular
response to stimulus | 49 |
4.89×10⁻⁹ |
1.62×10⁻⁶ |
| GO:0050896-response
to stimulus | 53 |
1.31×10⁻⁸ |
3.38×10⁻⁶ |
| GO:0002376-immune
system process | 29 |
1.24×10⁻⁸ |
3.61×10⁻⁶ |
| GO:0042113-B cell
activation | 11 |
1.71×10⁻⁸ |
3.97×10⁻⁶ |
| GO:0006955-immune
response | 22 |
4.83×10⁻⁸ |
9.32×10⁻⁶ |
| GO:0002429-immune
response-activating cell surface receptor signaling pathway | 12 |
4.43×10⁻⁸ |
9.32×10⁻⁶ |
| GO:0001775-cell
activation | 17 |
1.18×10⁻⁷ |
1.83×10⁻⁵ |
| GO:0002757-immune
response-activating signal transduction | 13 |
1.27×10⁻⁷ |
1.84×10⁻⁵ |
| GO:0050851-antigen
receptor-mediated signaling pathway | 10 |
1.36×10⁻⁷ |
1.85×10⁻⁵ |
| GO:0002768-immune
response-regulating cell surface receptor signaling pathway | 12 |
1.08×10⁻⁷ |
1.92×10⁻⁵ |
|
GO:0002682-regulation of immune system
process | 21 |
1.16×10⁻⁷ |
1.92×10⁻⁵ |
| GO:0030183-B cell
differentiation | 8 |
1.58×10⁻⁷ |
1.93×10⁻⁵ |
|
GO:0010646-regulation of cell
communication | 30 |
1.66×10⁻⁷ |
1.93×10⁻⁵ |
| Table II.Top enriched biological processes for
upregulated differentially expressed genes in the protein-protein
interaction network. |
Table II.
Top enriched biological processes for
upregulated differentially expressed genes in the protein-protein
interaction network.
| Term | Count | P-value | FDR |
|---|
| GO:0006928-movement
of cell or subcellular component | 49 |
1.51×10⁻¹² |
2.06×10⁻⁹ |
|
GO:0051270-regulation of cellular
component movement | 33 |
1.19×10⁻¹² |
2.43×10⁻⁹ |
|
GO:0040012-regulation of locomotion | 32 |
2.62×10⁻¹² |
2.68×10⁻⁹ |
|
GO:0044699-single-organism process | 150 |
9.74×10⁻¹³ |
3.98×10⁻⁹ |
|
GO:2000145-regulation of cell
motility | 31 |
5.04×10⁻¹² |
4.12×10⁻⁹ |
| GO:0048870-cell
motility | 41 |
6.94×10⁻¹² |
4.73×10⁻⁹ |
|
GO:0051674-localization of cell | 41 |
6.94×10⁻¹² |
4.73×10⁻⁹ |
|
GO:0040011-locomotion | 43 |
3.41×10⁻¹¹ |
1.74×10⁻⁸ |
|
GO:0044763-single-organism cellular
process | 143 |
3.24×10⁻¹¹ |
1.89×10⁻⁸ |
|
GO:0022610-biological adhesion | 45 |
6.99×10⁻¹¹ |
3.17×10⁻⁸ |
|
GO:0030334-regulation of cell
migration | 28 |
1.47×10⁻¹⁰ |
6.01×10⁻⁸ |
| GO:0007155-cell
adhesion | 44 |
2.31×10⁻¹⁰ |
8.57×10⁻⁸ |
|
GO:0032879-regulation of localization | 54 |
7.18×10⁻¹⁰ |
2.44×10⁻⁷ |
| GO:0016477-cell
migration | 35 |
1.26×10⁻⁹ |
3.95×10⁻⁷ |
| GO:0050896-response
to stimulus | 113 |
2.02×10⁻⁹ |
5.89×10⁻⁷ |
| GO:0048518-positive
regulation of biological process | 84 |
2.31×10⁻⁹ |
6.30×10⁻⁷ |
| GO:0070887-cellular
response to chemical stimulus | 55 |
2.82×10⁻⁹ |
7.21×10⁻⁷ |
| GO:0048513-animal
organ development | 59 |
2.46×10⁻⁸ |
5.59×10⁻⁶ |
| GO:0048732-gland
development | 20 |
2.37×10⁻⁸ |
5.70×10⁻⁶ |
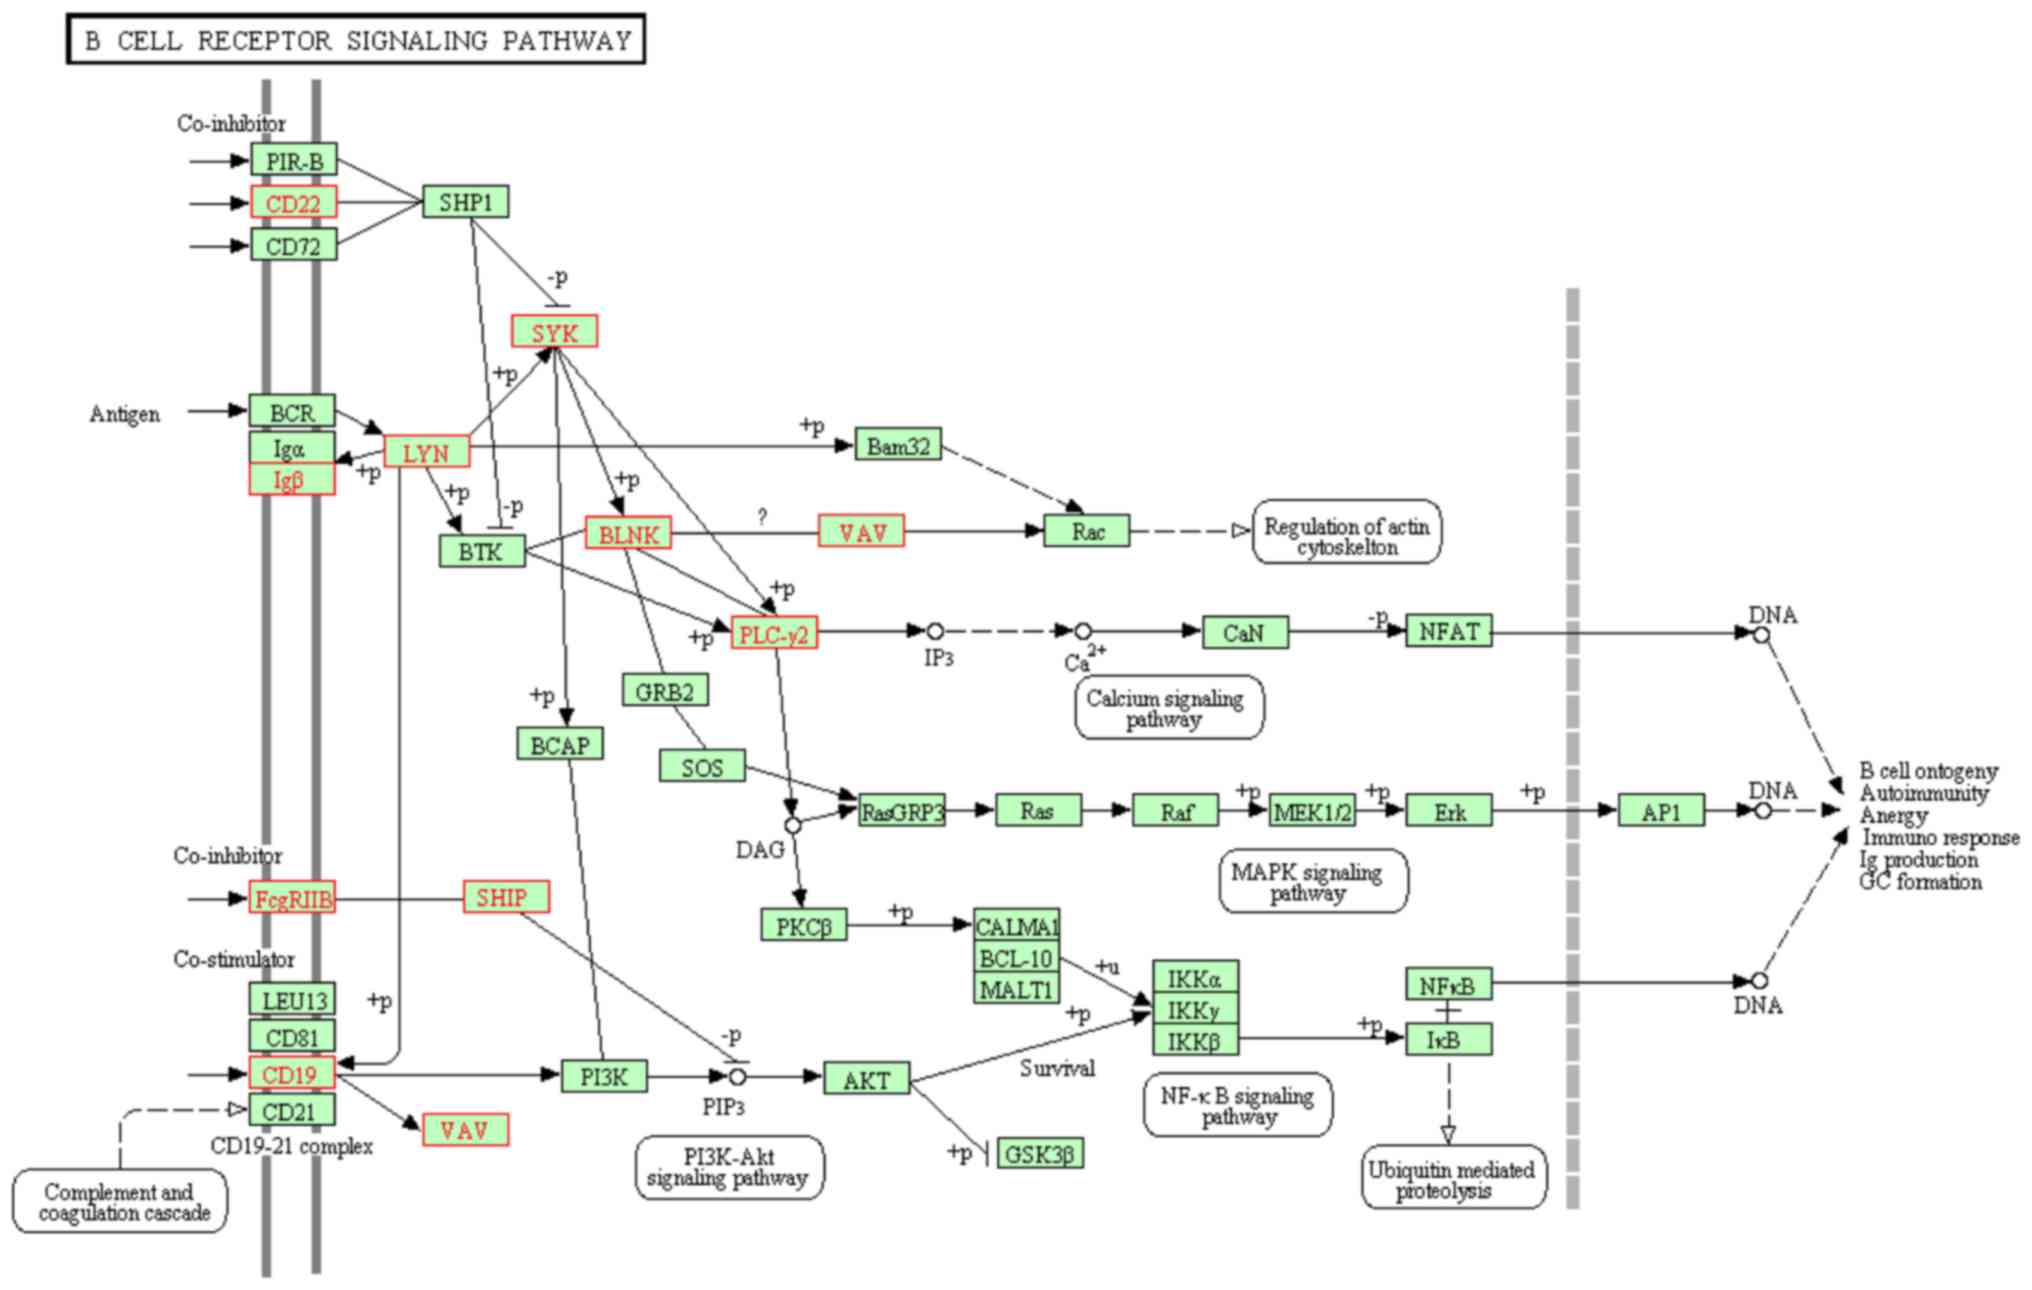
Pathway enrichment of the DEGs in the
PPI networks
KEGG pathways enrichment for the DEGs in the PPI
network was performed using the online functional annotation tool
DAVID. With a significant cut-off fixed at FDR<0.05, six KEGG
pathways were significantly enriched for the downregulated DEGs and
three for the upregulated DEGs (Table III). The downregulated DEGs in
BLEL were associated with the B cell receptor (BCR) signaling
pathway, transcription factor p65 signaling pathway, low affinity
immunoglobulin γ Fc region receptor II-mediated phagocytosis, high
affinity immunoglobulin ε receptor subunit γ signaling pathway,
Epstein-Barr virus infection pathway and pathways in cancer.
Glutathione metabolism, salivary secretion and the mineral
absorption pathway were the only notable pathways associated with
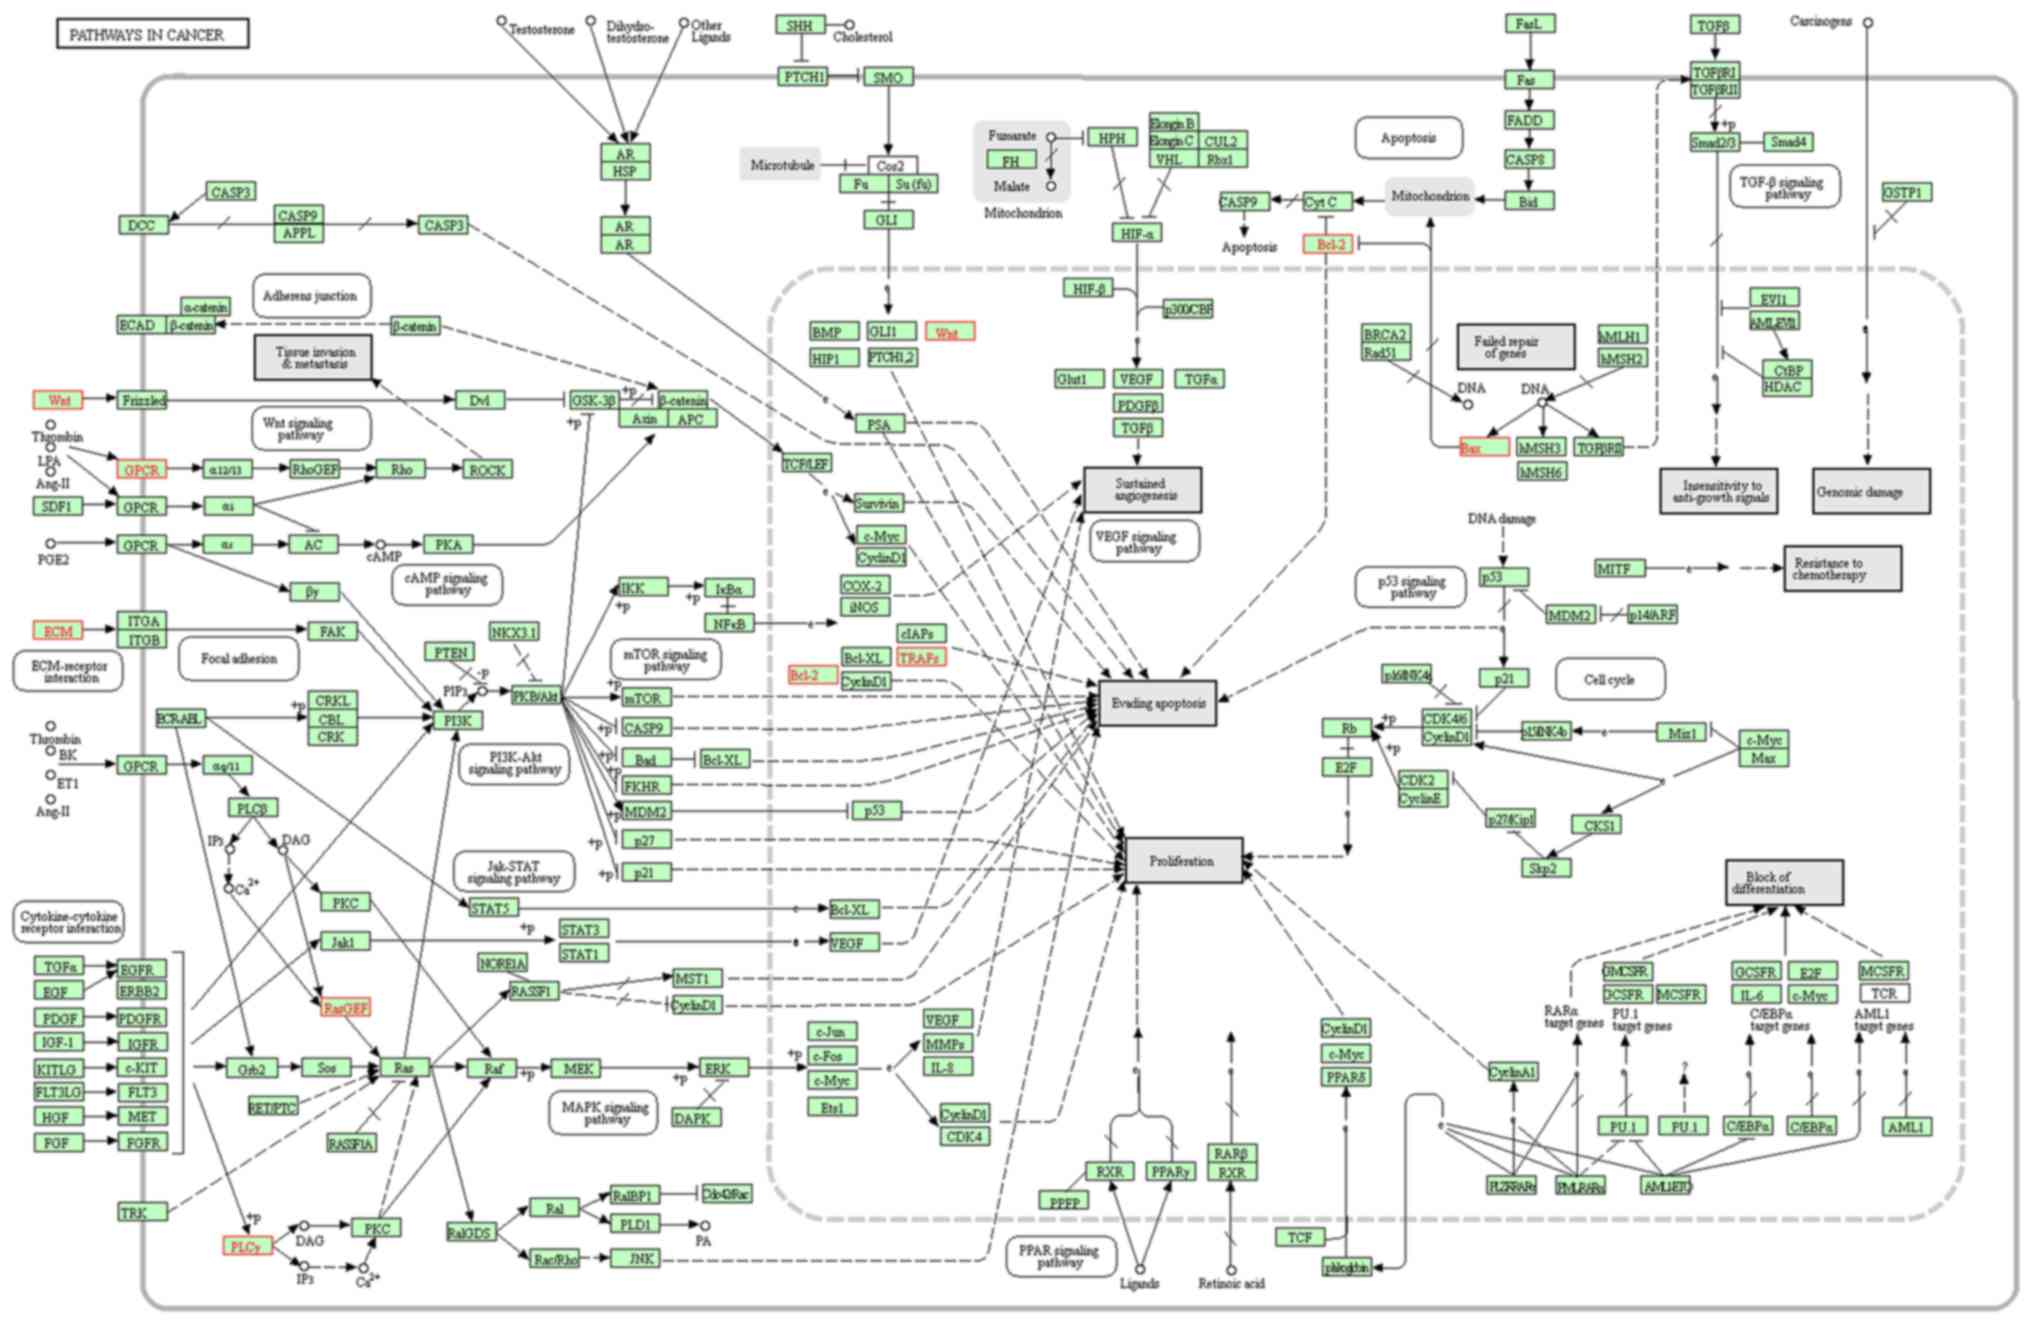
the upregulated DEGs. A map of the DEGs with the KEGG pathways for
the BCR signaling pathway and pathways in cancer are exhibited in
Figs. 4 and 5, respectively.
| Table III.Enriched Kyoto Encyclopedia of Genes
and Genomes pathways for up- and downregulated DEGs in the
protein-protein interaction network. |
Table III.
Enriched Kyoto Encyclopedia of Genes
and Genomes pathways for up- and downregulated DEGs in the
protein-protein interaction network.
| Term | Count | Genes | P-value | FDR |
|---|
| Downregulated
DEG |
|
hsa04662: B cell receptor
signaling pathway | 10 | CD19, FCGR2B, LYN,
PLCG2, CD22, CD79B, INPP5D, VAV2, BLNK, SYK |
3.84×10⁻¹⁰ |
3.84×10⁻⁸ |
|
hsa04064: NF-κB signaling
pathway | 6 | LYN, BCL2, PLCG2,
TRAF5, BLNK, SYK |
2.32×10⁻⁴ |
7.69×10⁻³ |
|
hsa04666: Fc γR-mediated
phagocytosis | 6 | FCGR2B, LYN, PLCG2,
INPP5D, VAV2, SYK |
1.96×10⁻⁴ |
9.77×10⁻³ |
|
hsa04664: Fc ε RI signaling
pathway | 5 | LYN, PLCG2, INPP5D,
VAV2, SYK |
9.43×10⁻⁴ |
2.33×10⁻² |
|
hsa05169: Epstein-Barr virus
infection | 7 | CD19, LYN, BCL2,
PLCG2, ENTPD1, TRAF5, SYK |
1.33×10⁻³ |
2.63×10⁻² |
|
hsa05200: Pathways in
cancer | 9 | COL4A3, WNT3,
LPAR5, BAX, BCL2, PLCG2, RASGRP2, WNT6, TRAF5 |
3.43×10⁻³ |
4.79×10⁻² |
| Upregulated
DEG |
|
hsa00480: Glutathione
metabolism | 7 | GGT6, GSTA4, RRM2,
GPX3, ANPEP, GSTO2, MGST1 |
1.36×10⁻⁴ |
2.31×10⁻² |
|
hsa04970: Salivary
secretion | 8 | CD38, ATP1B1,
CHRM3, SLC12A2, AQP5, LYZ, TRPV6, PLCB1 |
3.86×10⁻⁴ |
3.27×10⁻² |
|
hsa04978: Mineral
absorption | 6 | SLC11A2, TF,
ATP1B1, SLC5A1, TRPV6, SLC40A1 |
7.30×10⁻⁴ |
4.1×10⁻² |
Prediction tools for the occurrence of
malignancy in BLEL
In order to identify genes that could be used to
predict malignant transformation in BLEL, the expression of the
DEGs implicated in the pathways of cancer were compared to the
expression in a control group composed of cavernous hemangioma
samples. No significant difference in expression was observed for
Wnt3, Wnt6, PLCG2, RASGRP2, Bcl−2, Bax, TRAF5 and COL4A3
between the control group and the BLEL group; however, the
expression was significantly increased in the tissues of the
malignant group (P<0.01; Fig.
6).
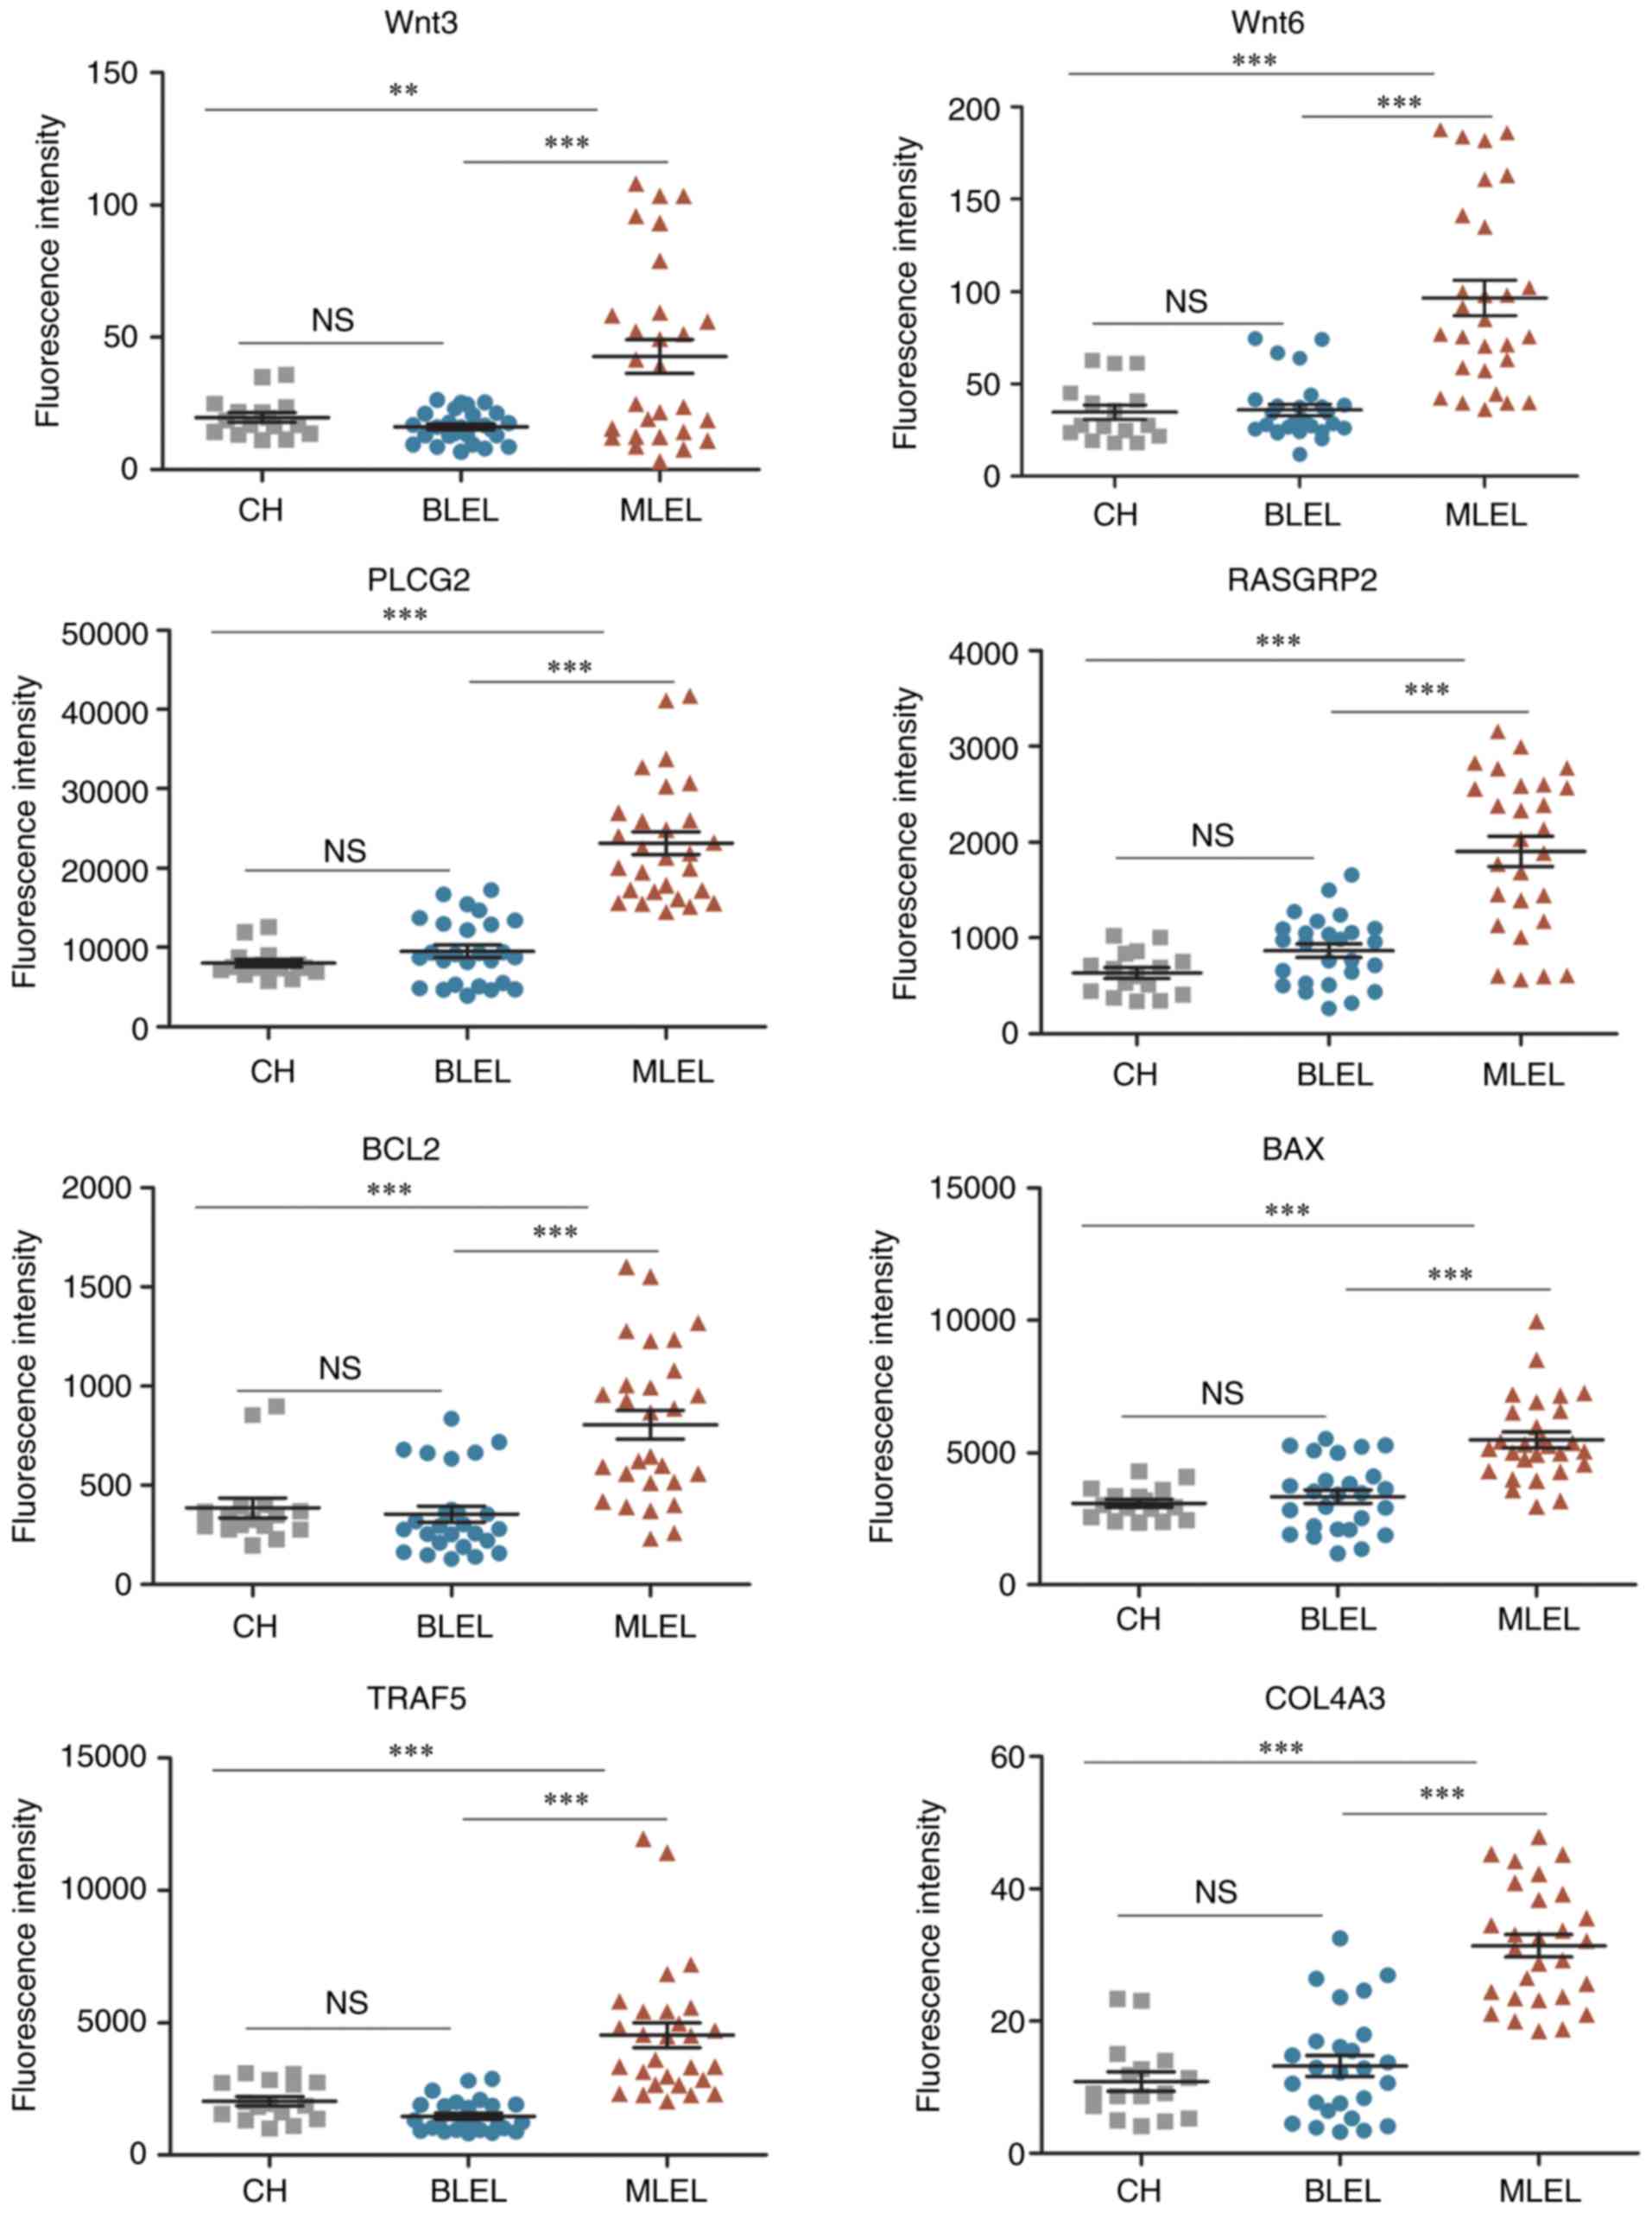 | Figure 6.Expression profile of DEGs implicated
in cancer pathways. All data are presented as the mean ± standard
error of the mean. **P<0.01; ***P<0.001. CH, cavernous
hemangioma; BLEL, benign lymphoepithelial lesion; MLEL, malignant
lymphoepithelial lesion; ns, not significant; DEG, differentially
expressed genes; Wnt3, Wnt family member 3; PLCG2, phospholipase C
γ 2; RASGRP2, RAS guanyl releasing protein 2; BCL2, apoptosis
regulator BCL2; BAX, BCL2 associated X apoptosis regulator; TRAF5,
TNF receptor associated factor 5; COL4A3, collagen type IV α 3
chain. |
Discussion
For decades, gene expression profiling was widely
used to highlight the underlying transcriptional programs and
molecular mechanisms between normal and malignant conditions. It
was used for class discovery and prediction, or for prediction of
molecular markers, and for evaluation of the response to
therapeutic compounds (14−19). In the present study,
microarray-based gene expression profiling was utilized to identify
genes and pathways which may be associated with the occurrence of
malignant lymphoma in BLEL. Comparing the expression profiles of
20,138 genes between BLEL and MLEL, 1,002 (4.98%) DEGs were
identified, among which 364 were downregulated and 638 upregulated
in BLEL. In organisms, proteins interactions determine biological,
molecular and cellular mechanisms which trigger the onset and
progression of diseases (20);
consequently, subsequent to the PPI analysis, the DEGs involved in
this PPI network were used for functional enrichment of biological
functions and for pathways analysis. The upregulated DEGs in the
PPI network were mainly associated with the developmental processes
of glands, tissues and organs, while the downregulated DEGs were
associated with immune-associated signaling processes, confirming
the implication of inflammation in the malignant occurrence as
previously described (21).
Pathway analysis identified BCR signaling and glutathione
metabolism as the most enriched pathways involving down- and
upregulated DEGs, respectively, in BLEL.
Although BCR signaling is important in B-cell
activation and proliferation, evidence indicates that alterations
to its signalosome components may directly or indirectly contribute
to lymphomagenesis (22,23). Cluster of differentiation (CD) 79B
overexpression was reported to induce protein
kinase/mitogen-activated protein kinase 1 activation (24), decreased sensitivity to apoptosis
in normal and B cell malignancies (25), and may promote lymphoma cell
proliferation, while deregulation of the expression of CD19, a
co-stimulator of BCR, may accelerate malignant transformation
and/or disease severity (26−28). Additionally, emerging
data from clinical trials indicates that interruption of BCR
signaling by tyrosine-protein kinase SYK, phosphatidylinositol
3-kinase or tyrosine-protein kinase BTK inhibitors, has substantial
anti-tumor activity in a number of B-cell malignancies. Although
glutathione serves important roles in a number of biological
functions, including antioxidant defense, nutrient metabolism and
the regulation of cellular events, deregulation of its synthesis is
recognized to contribute to pathogenesis. In addition, increased
glutathione levels are exhibited in a number of tumors and have
been demonstrated to confer tumor resistance (29). The results of the present study
indicated that these cellular pathways and associated DEGs may
serve an important role in the occurrence of malignancy in patients
with BLEL.
The downregulated DEGs included a set of genes
[collagen type IV α 3 chain (COL4A3), Wnt family member 3
(Wnt−3), lysophosphatidic acid receptor, BCL2 associated
X apoptosis regulator (BAX), apoptosis regulator BCL2 (BCL2)
phospholipase C γ 2, RAS guanyl releasing protein 2 (RASGRP2),
Wnt−6 and TNF receptor associated factor 5] associated
with pathways in cancer. COL4A3 is located on human chromosome 2q
36-q37 (30) and has a protein
distribution limited to the basement membrane with tissue
specificity. COL4A3 expression is correlated with pathogenesis in
gastric cancer and its high expression is correlated with a poor
prognosis in lung cancer (31,32).
The Wnt−3/6 genes encode secreted signaling proteins,
and have been implicated in oncogenesis and the regulation of cell
fate. Studies of Wnt−3/6 expression suggested that they
may serve an important role in carcinogenesis and their
overexpression may be associated with the development of more
aggressive tumors (33,34). BAX and BCL2 are important
regulators of cancer cell survival. The protein encoded by BCL2 is
an anti-apoptotic protein; its overexpression is correlated with
tumor initiation, drug resistance and a poor outcome in patients
with cancer (35,36). Although BAX is associated with
apoptosis in a number of cell types, its heterodimerization with
the anti-apoptotic protein BCL2 has been reported to suppress
apoptosis (37) and to be
correlated with poor clinical outcomes (38). RASGRP2 is a guanyl nucleotide
exchange factor which, when malfunctioning, may contribute to blood
malignancies. It increases cell viability and cell matrix adhesion
via increased GTPase HRas expression and telomeric repeat-binding
factor 2-interacting protein 1 activation (39).
The comparison of the expression of the DEGs
implicated in the pathways of cancer with the expression in a
control group composed of cavernous hemangioma samples demonstrated
no differential expression between the control group and the BLEL
group; however, their expression was increased in the tissues of
the malignant group, suggesting that they may be considered to be
prediction tool for the occurrence of malignancy in BLEL.
In conclusion, in the present study, a set of genes
and pathways were analyzed which may be useful for an improved
understanding of the molecular mechanisms underlying the occurrence
of malignancy in BLEL; however, further investigation is required
to confirm their exact roles in this process. In addition, the
potential use of certain of the identified DEGs as a predictive
tool of malignant transformation is suggested.
Acknowledgements
The present study was supported by the National
Natural Science Foundation of China (grant nos. 81602408 and
81371052) and the China Postdoctoral Science Foundation funded
project (grant no. 143096).
References
|
1
|
Yamamoto M, Takahashi H, Sugai S and Imai
K: Clinical and pathological characteristics of Mikulicz's disease
(IgG4-related plasmacytic exocrinopathy). Autoimmun Rev. 4:195–200.
2005. View Article : Google Scholar : PubMed/NCBI
|
|
2
|
Yamamoto M, Takahashi H, Ohara M, Suzuki
C, Naishiro Y, Yamamoto H, Shinomura Y and Imai K: A new
conceptualization for Mikulicz's disease as an IgG4-related
plasmacytic disease. Mod Rheumatol. 16:335–340. 2006. View Article : Google Scholar : PubMed/NCBI
|
|
3
|
Stone JH, Zen Y and Deshpande V:
IgG4-related disease. N Engl J Med. 366:539–551. 2012. View Article : Google Scholar : PubMed/NCBI
|
|
4
|
Yamamoto M, Takahashi H, Tabeya T, Suzuki
C, Naishiro Y, Ishigami K, Yajima H, Shimizu Y, Obara M, Yamamoto
H, et al: Risk of malignancies in IgG4-related disease. Mod
Rheumatol. 22:414–418. 2012. View Article : Google Scholar : PubMed/NCBI
|
|
5
|
Sato Y, Ohshima K, Ichimura K, Sato M,
Yamadori I, Tanaka T, Takata K, Morito T, Kondo E and Yoshino T:
Ocular adnexal IgG4-related disease has uniform clinicopathology.
Pathol Int. 58:465–470. 2008. View Article : Google Scholar : PubMed/NCBI
|
|
6
|
Go H, Kim JE, Kim YA, Chung HK, Khwarg SI,
Kim CW and Jeon YK: Ocular adnexal IgG4-related disease:
Comparative analysis with mucosa-associated lymphoid tissue
lymphoma and other chronic inflammatory conditions. Histopathology.
60:296–312. 2012. View Article : Google Scholar : PubMed/NCBI
|
|
7
|
Azzopardi JG and Evans DJ: Malignant
lymphoma of parotid associated with Mikulicz disease (benign
lymphoepithelial lesion). J Clin Pathol. 24:744–752. 1971.
View Article : Google Scholar : PubMed/NCBI
|
|
8
|
Del Bono V, Pretolesi F, Pontali E,
Martinoli C, Bassetti M, Mazzarello G, Chiaramondia M, Derchi LE
and Bassetti D: Possible malignant transformation of benign
lymphoepithelial parotid lesions in human immunodeficiency
virus-infected patients: Report of three cases. Clin Infect Dis.
30:947–949. 2000. View
Article : Google Scholar : PubMed/NCBI
|
|
9
|
Sato K, Kawana M, Sato Y and Takahashi S:
Malignant lymphoma in the head and neck associated with benign
lymphoepithelial lesion of the parotid gland. Auris Nasus Larynx.
29:209–214. 2002. View Article : Google Scholar : PubMed/NCBI
|
|
10
|
Ohta M, Moriyama M, Goto Y, Kawano S,
Tanaka A, Maehara T, Furukawa S, Hayashida JN, Kiyoshima T, Shimizu
M, et al: A case of marginal zone B cell lymphoma mimicking
IgG4-related dacryoadenitis and sialoadenitis. World J Surg Oncol.
13:672015. View Article : Google Scholar : PubMed/NCBI
|
|
11
|
Ohno K, Sato Y, Ohshima K, Takata K,
Miyata-Takata T, Takeuchi M, Gion Y, Tachibana T, Orita Y, Ito T,
et al: A subset of ocular adnexal marginal zone lymphomas may arise
in association with IgG4-related disease. Sci Rep. 5:135392015.
View Article : Google Scholar : PubMed/NCBI
|
|
12
|
Li C and Hung Wong W: Model-based analysis
of oligonucleotide arrays: Model validation, design issues and
standard error application. Genome Biol. 2:Research00322001.
View Article : Google Scholar : PubMed/NCBI
|
|
13
|
Lv J, Zhu B, Zhang L, Xie Q and Zhuo W:
Detection and screening of small molecule agents for overcoming
Sorafenib resistance of hepatocellular carcinoma: A bioinformatics
study. Int J Clin Exp Med. 8:2317–2325. 2015.PubMed/NCBI
|
|
14
|
Golub TR, Slonim DK, Tamayo P, Huard C,
Gaasenbeek M, Mesirov JP, Coller H, Loh ML, Downing JR, Caligiuri
MA, et al: Molecular classification of cancer: Class discovery and
class prediction by gene expression monitoring. Science.
286:531–537. 1999. View Article : Google Scholar : PubMed/NCBI
|
|
15
|
Bullinger L, Dohner K, Bair E, Fröhling S,
Schlenk RF, Tibshirani R, Döhner H and Pollack JR: Use of
gene-expression profiling to identify prognostic subclasses in
adult acute myeloid leukemia. N Engl J Med. 350:1605–1616. 2004.
View Article : Google Scholar : PubMed/NCBI
|
|
16
|
Valk PJ, Verhaak RG, Beijen MA, Erpelinck
CA, Barjesteh van Waalwijk van Doorn-Khosrovani S, Boer JM,
Beverloo HB, Moorhouse MJ, van der Spek PJ, Löwenberg B and Delwel
R: Prognostically useful gene-expression profiles in acute myeloid
leukemia. N Engl J Med. 350:1617–1628. 2004. View Article : Google Scholar : PubMed/NCBI
|
|
17
|
Raponi M, Lancet JE, Fan H, Dossey L, Lee
G, Gojo I, Feldman EJ, Gotlib J, Morris LE, Greenberg PL, et al: A
2-gene classifier for predicting response to the farnesy
ltransferase inhibitor tipifarnib in acute myeloid leukemia. Blood.
111:2589–2596. 2008. View Article : Google Scholar : PubMed/NCBI
|
|
18
|
Kohlmann A, Bullinger L, Thiede C, Schaich
M, Schnittger S, Döhner K, Dugas M, Klein HU, Döhner H, Ehninger G
and Haferlach T: Gene expression profiling in AML with normal
karyotype can predict mutations for molecular markers and allows
novel insights into perturbed biological pathways. Leukemia.
24:1216–1220. 2010. View Article : Google Scholar : PubMed/NCBI
|
|
19
|
Theilgaard-Mönch K, Boultwood J, Ferrari
S, Giannopoulos K, Hernandez-Rivas JM, Kohlmann A, Morgan M, Porse
B, Tagliafico E, Zwaan CM, et al: Gene expression profiling in MDS
and AML: Potential and future avenues. Leukemia. 25:909–920. 2011.
View Article : Google Scholar : PubMed/NCBI
|
|
20
|
Safari-Alighiarloo N, Taghizadeh M,
Rezaei-Tavirani M, Goliaei B and Peyvandi AA: Protein-protein
interaction networks (PPI) and complex diseases. Gastroenterol
Hepatol Bed Bench. 7:17–31. 2014.PubMed/NCBI
|
|
21
|
Elinav E, Nowarski R, Thaiss CA, Hu B, Jin
C and Flavell RA: Inflammation-induced cancer: Crosstalk between
tumours, immune cells and microorganisms. Nat Rev Cancer.
13:759–771. 2013. View
Article : Google Scholar : PubMed/NCBI
|
|
22
|
Niemann CU and Wiestner A: B-cell receptor
signaling as a driver of lymphoma development and evolution. Semin
Cancer Biol. 23:410–421. 2013. View Article : Google Scholar : PubMed/NCBI
|
|
23
|
Refaeli Y, Young RM, Turner BC, Duda J,
Field KA and Bishop JM: The B cell antigen receptor and
overexpression of MYC can cooperate in the genesis of B cell
lymphomas. PLoS Biol. 6:e1522008. View Article : Google Scholar : PubMed/NCBI
|
|
24
|
Kim JH, Kim WS, Ryu K, Kim SJ and Park C:
CD79B limits response of diffuse large B cell lymphoma to
ibrutinib. Leuk Lymphoma. 57:1413–1422. 2016. View Article : Google Scholar : PubMed/NCBI
|
|
25
|
Cragg MS, Chan HT, Fox MD, Tutt A, Smith
A, Oscier DG, Hamblin TJ and Glennie MJ: The alternative transcript
of CD79b is overexpressed in B-CLL and inhibits signaling for
apoptosis. Blood. 100:3068–3076. 2002. View Article : Google Scholar : PubMed/NCBI
|
|
26
|
Chung EY, Psathas JN, Yu D, Li Y, Weiss MJ
and Thomas-Tikhonenko A: CD19 is a major B cell
receptor-independent activator of MYC-driven B-lymphomagenesis. J
Clin Invest. 122:2257–2266. 2012. View
Article : Google Scholar : PubMed/NCBI
|
|
27
|
Li X, Ding Y, Zi M, Sun L, Zhang W, Chen S
and Xu Y: CD19, from bench to bedside. Immunol lett. 183:86–95.
2017. View Article : Google Scholar : PubMed/NCBI
|
|
28
|
Poe JC, Minard-Colin V, Kountikov EI, Haas
KM and Tedder TF: A c-Myc and surface CD19 signaling amplification
loop promotes B cell lymphoma development and progression in mice.
J Immunol. 189:2318–2325. 2012. View Article : Google Scholar : PubMed/NCBI
|
|
29
|
Lu SC: Regulation of glutathione
synthesis. Mol Aspects Med. 30:42–59. 2009. View Article : Google Scholar : PubMed/NCBI
|
|
30
|
Morrison KE, Mariyama M, Yang-Feng TL and
Reeders ST: Sequence and localization of a partial cDNA encoding
the human alpha 3 chain of type IV collagen. Am J Hum Genet.
49:545–554. 1991.PubMed/NCBI
|
|
31
|
Nie XC, Wang JP, Zhu W, Xu XY, Xing YN, Yu
M, Liu YP, Takano Y and Zheng HC: COL4A3 expression correlates with
pathogenesis, pathologic behaviors and prognosis of gastric
carcinomas. Hum Pathol. 44:77–86. 2013. View Article : Google Scholar : PubMed/NCBI
|
|
32
|
Jiang CP, Wu BH, Chen SP, Fu MY, Yang M,
Liu F and Wang BQ: High COL4A3 expression correlates with poor
prognosis after cisplatin plus gemcitabine chemotherapy in
non-small cell lung cancer. Tumour Biol. 34:415–420. 2013.
View Article : Google Scholar : PubMed/NCBI
|
|
33
|
Nakashima N, Liu D, Huang CL, Ueno M,
Zhang X and Yokomise H: Wnt3 gene expression promotes tumor
progression in non-small cell lung cancer. Lung cancer. 76:228–234.
2012. View Article : Google Scholar : PubMed/NCBI
|
|
34
|
Zhang L, Yuan G, Fang Y, Qiu M, Lin J, Sun
J and Yang D: Increased WNT6 expression in tumor cells predicts
unfavorable survival in esophageal squamous cell carcinoma
patients. Int J Clin Exp Pathol. 8:11421–11427. 2015.PubMed/NCBI
|
|
35
|
Kaluzki I, Hrgovic I, Hailemariam-Jahn T,
Doll M, Kleemann J, Valesky EM, Kippenberger S, Kaufmann R, Zoeller
N and Meissner M: Dimethylfumarate inhibits melanoma cell
proliferation via p21 and p53 induction and bcl-2 and cyclin B1
downregulation. Tumour Biol. 37:13627–13635. 2016. View Article : Google Scholar : PubMed/NCBI
|
|
36
|
Bajwa N, Liao C and Nikolovska-Coleska Z:
Inhibitors of the anti-apoptotic Bcl-2 proteins: A patent review.
Expert Opin Ther Pat. 22:37–55. 2012. View Article : Google Scholar : PubMed/NCBI
|
|
37
|
Yin XM, Oltvai ZN and Korsmeyer SJ: BH1
and BH2 domains of Bcl-2 are required for inhibition of apoptosis
and heterodimerization with Bax. Nature. 369:321–323. 1994.
View Article : Google Scholar : PubMed/NCBI
|
|
38
|
Mühlbeier DF, Saddi VA, de Paula ÉC, Cunha
IW, Fregnani JH, Barbosa MA and Manoel WJ: Prognostic Significance
of Apoptosis-related Markers in Patients With Soft-Tissue Sarcomas
of Extremities. Appl Immunohistochem Mol Morphol. 24:268–274. 2016.
View Article : Google Scholar : PubMed/NCBI
|
|
39
|
Takino J, Nagamine K and Hori T: Ras
guanyl nucleotide releasing protein 2 affects cell viability and
cell-matrix adhesion in ECV304 endothelial cells. Cell Adh Migr.
7:262–266. 2013. View Article : Google Scholar : PubMed/NCBI
|