Introduction
The non-protein α-amino acid homocysteine is an
intermediate product that occurs during the normal biosynthesis of
cysteine and methionine. Hyperhomocysteinemia has been proposed to
be an independent risk factor for cardiovascular disease (1). Several previous studies have reported
that an increase in the level of serum homocysteine may be involved
in the pathogenesis of vascular diseases, such as coronary artery
disease (2), coronary heart
disease (3,4), atherosclerotic vascular disease
(5,6), stroke (7,8) and
ischemic heart disease (9). A
meta-analysis reported that for every 5 µmol increase in serum
homocysteine level the danger of coronary heart disease increased
by 60–80% in adults (10);
compared with healthy subjects, there was a sevenfold increase in
the mortality rate in patients with high levels of serum
homocysteine (11). A recent
report indicated that an elevation in serum homocysteine levels may
lead to vascular disease in the general population (12).
Although it has long been considered that an
increased serum homocysteine level was associated with an increased
risk of vascular disease, the biochemical mechanisms that underlie
these effects in serum remain unclear. The present study aimed to
investigate the effects of serum homocysteine levels on human blood
metabolites in humans. To avoid any potential influences on the
results, the samples in which vascular diseases were identified
were not included in the present study.
Metabolomics analyses have previously been
demonstrated to provide a dynamic depiction of metabolic status
(13), and have been successfully
applied in several fields of research, including disease diagnosis
(14), biomarker screening
(15,16) and in characterizing biological
pathways (17,18). Therefore, the present study used a
high-performance liquid chromatography-mass spectrometry
(HPLC-MS)-based metabolomics approach to detect the biochemical
alterations associated with homocysteine levels in human serum.
Materials and methods
Serum sample collection and
preparation
The present study was approved by the Ethics
Committee of the Fourth Affiliated Hospital of Harbin Medical
University (Harbin, China). All participating subjects were
informed of their rights and written informed consent was obtained.
A total of 161 fasting blood samples were obtained from patients
aged 25–79 years during routine physical examination at the
Department of Physical Examination Center of the Fourth Affiliated
Hospital of Harbin Medical University between April 5 and April 18,
2015. The samples were divided into high- and low-serum
homocysteine groups based on a threshold of 15.0 µmol/l serum
homocysteine level. Patients were questioned about their
lifestyles, including smoking status (non-smokers were identified
as having never smoked or stopped smoking >1 year ago) and
alcohol intake (non-drinkers were identified as having not consumed
alcohol in the previous 2 weeks and having not consumed >38%
alcohol v/v and >200 ml in the previous month). Patients were
also asked whether they had already been diagnosed with vascular
disease. In order to prevent vascular disease and unhealthy habits
affecting the results of the present study, patients adhering to
the following criteria were excluded from the study: Hypertension,
diabetes, hyperlipemia, obesity, coronary heart disease,
atherosclerosis, stroke, cerebral embolism and recipients of folic
acid and/or vitamin B12 supplements. Hypertension was diagnosed
when the systolic blood pressure (SBP) was ≥140 mmHg and/or
diastolic blood pressure (DBP) was ≥90 mmHg. Diabetes was diagnosed
when the fasting plasma glucose level was ≥6.1 mmol/l.
Hypercholesterolemia and hyperlipemia were defined as total
cholesterol ≥6.22 mmol/l and triglycerides ≥2.26 mmol/l,
respectively, according to the 2007 Dyslipidemia Prevention Guide
in Chinese Adults (19). Obesity
was defined as having a body mass index (BMI) ≥28.00
kg/m2, according to the 2006 Guidelines for Prevention
and Control of Obesity in Chinese Adults (20). Coronary heart disease was confirmed
by coronary angiography. Stroke, atherosclerosis and cerebral
embolism were diagnosed by computed tomography scanning. A total of
86 samples were excluded and 75 samples were retained for further
investigation.
All fasting blood samples were centrifuged at 1,408
× g for 5 min immediately at room temperature, then the serum was
collected. Levels of fasting serum glucose (FSG), total cholesterol
(TC), high-density lipoprotein cholesterol (HDL-C), low-density
lipoprotein cholesterol (LDL-C), triglyceride (TG) and serum
homocysteine were determined using Hitachi 7600 Automatic
Biochemistry Analyzer (Hitachi Instrument Service, Tokyo, Japan).
All reagents and calibrators were purchased from Roche Diagnostics
(Basel, Switzerland). All quality controls (serum homocysteine,
FSG, TC, HDL-C, LDL-C and TG) were purchased from Bio-Rad
Laboratories, Inc. (Hercules, CA, USA). Hyperhomocysteinemia was
defined as having an abnormally high level (>15 µmol/l) of
homocysteine in the serum sample (21).
Each serum sample was used for metabolite extraction
prior to HPLC-MS analysis. Briefly, acetonitrile (400 µl;
Chromasolv chromatographic grade; Sigma-Aldrich; Merck KGaA,
Darmstadt, Germany) was added to the serum (200 µl), and the
mixture was vortexed for 1 min and incubated at room temperature
for 10 min, followed by centrifugation at 18,500 × g at room
temperature for 10 min. The supernatant (400 µl) was removed and
completely evaporated using ultra-high-purity (99.9%) nitrogen gas
in water bath at 40°C (22), and
100 µl of a mixture of acetonitrile and water (3:1) was added into
each tube. The solution was passed through a syringe filter (0.22
µm) into a 2 ml glass vial prior to HPLC-MS analysis.
Metabolomics profiling with ESI
HPLC-MS analysis was performed with a Shimadzu HPLC
System (Shimadzu Corporation, Kyoto, Japan) coupled to an AB Sciex
API4000+ mass spectrometer with electrospray ionization (ESI) in
the positive (+) and negative (−) modes. The sample solution (5 µl)
was injected into an HPLC InertSustain C18 Column (2.1×150 mm; 3
µm; GL Sciences Inc., Torrance CA, USA). The flow rate of the
mobile phase was 0.35 ml/min, and analytes were eluted from the
column under a gradient (solvent A, 0.1% formic acid in water;
solvent B, 0.1% formic acid in acetonitrile). The optimal
conditions for HPLC separation and ESI detection are shown in
Table I.
 | Table I.HPLC separation and ESI-mass
spectrometry detection conditions. |
Table I.
HPLC separation and ESI-mass
spectrometry detection conditions.
| Component | Condition |
|---|
| HPLC InertSustain C18
Column | 150×2.1 mm; 3 µm |
| Mobile phase A | 0.1% HCOOH in
H2O |
| Mobile phase B | 0.1% HCOOH in
CH3CN |
| Gradient elution | B%=2% maintained (0–2
min), increased to 20% in 4 min, 70% linearly increased (4–8 min),
100% in a further 4 min, and 100% maintained 2 min (14–18 min),
followed by re-equilibration to the initial conditions in 6 min
(18–25 min) |
| Flow rate | 0.35 ml/min |
| Injection volume | 5 µl |
| Polarity | ESI(+) and
ESI(−) |
| Gas1 | 15 l/h |
| Curtain gas | 10 l/h |
| DP | 45 V |
| Source
temperature | 375°C |
| MS range | m/z 40–1,500 |
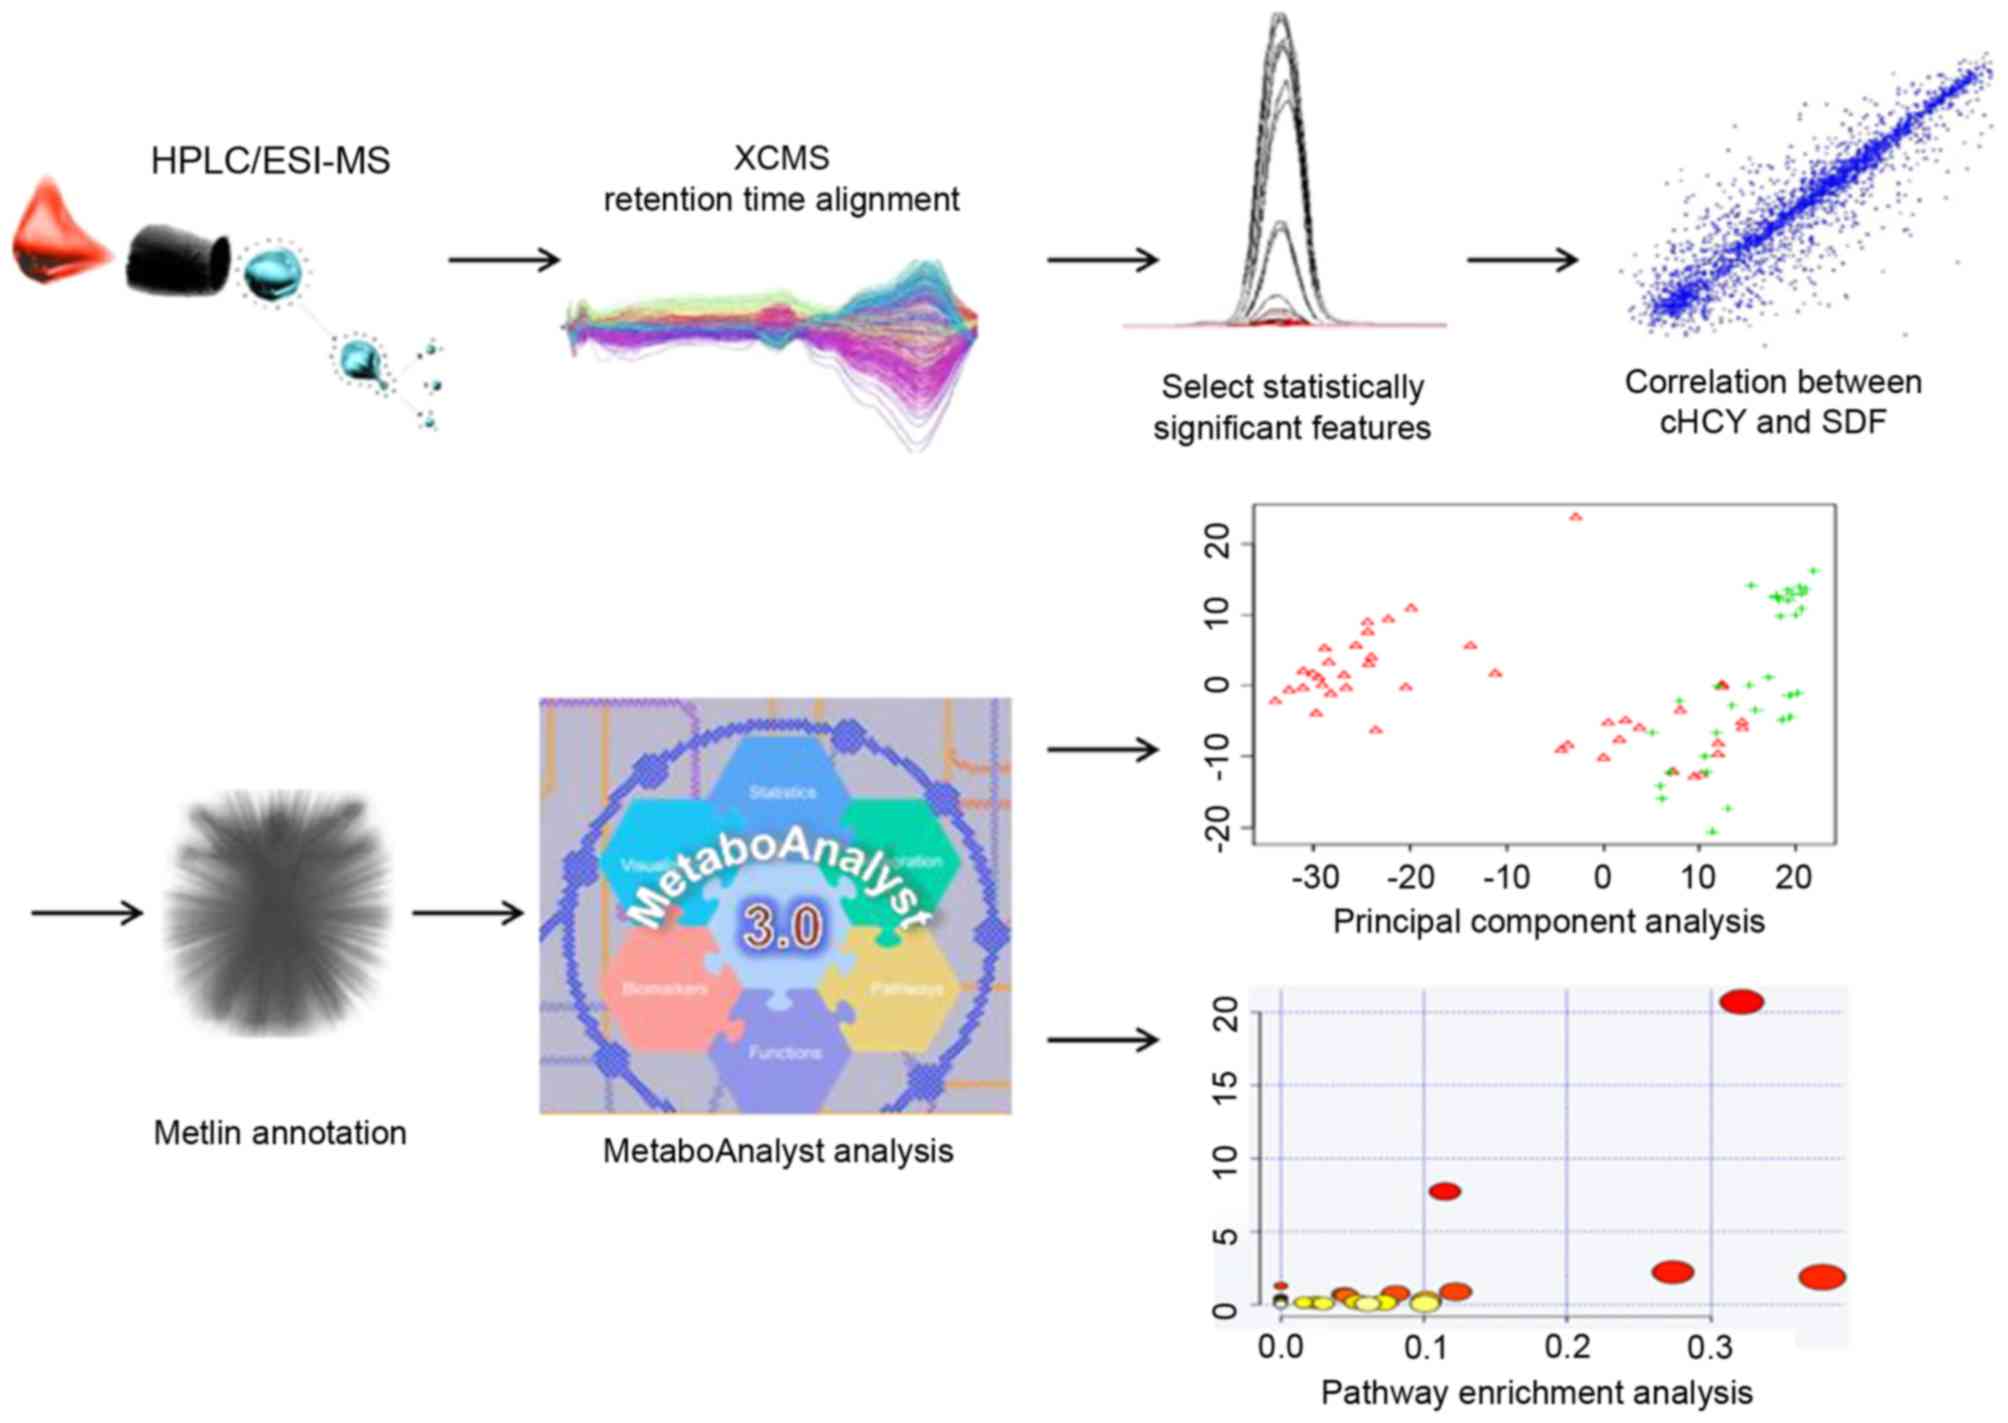
Data and statistical analysis
Raw data was in an instrument specific format
(.wiff) and were converted to common data format (.mzXML) format,
using the Wiff to mzXML translator software (version 1.3; Applied
Biosystems; Thermo Fisher Scientific, Inc.). The program XCMS was
used for nonlinear alignment of the raw data (.mzXML files) in the
time domain and automatic integration and extraction of the peak
intensities (23). Accurate masses
of features that were identified as significantly different and
correlated with serum homocysteine levels were searched against the
Metlin databases. MetaboAnalyst 3.0 software (24,25)
was used for multivariate statistical calculations and plotting and
metabolic pathway enrichment analysis (26). Differences between high- and
low-serum homocysteine groups were determined using a two-tailed
Student's t-test with 5% false discovery rate (FDR). Correlations
between the level of serum homocysteine and accurate masses of
features were analyzed using Pearson's correlation coefficient.
Serum biochemical indicators are presented as the mean ± standard
deviation. FDR-adjusted P<0.05 was considered to indicate a
statistically significant difference. These analyses were performed
using R Bioconductor (version 2.15.3; http:www.r-project.org/). The experimental workflow
for the metabolomics studies performed is depicted in Fig. 1.
Results
The mean values of serum homocysteine concentration
in the high- and low-serum homocysteine groups were 29.4 and 11.9
µmol/l, respectively. The clinical biochemical characteristics of
the samples are summarized in Table
II. No significant differences were identified between the two
groups for the following characteristics: Sex, age, FSG, TC, HDL-C,
LDL-C, DBP, SBP and BMI.
| Table II.Biochemical characteristics in the
high- and low-serum HCY groups. |
Table II.
Biochemical characteristics in the
high- and low-serum HCY groups.
| Characteristic | High-HCY group | Low-HCY group | P-value |
|---|
| Number | 33 | 42 |
|
| Sex
(female/male) | 15/18 | 20/22 | 0.69 |
| Age, year |
47±10.7 |
44±8.6 | 0.25 |
| FSG, mmol/l |
5.5±1.4 |
5.5±1.3 | 0.86 |
| TC, mmol/l |
4.9±0.8 |
4.7±0.9 | 0.12 |
| HDL-C, mmol/l |
1.3±0.4 |
1.3±0.3 | 0.63 |
| LDL-C, mmol/l |
3.2±0.7 |
3.0±0.6 | 0.14 |
| TG, mmol/l | 1.91±0.5 | 1.78±0.7 | 0.43 |
| DBP, mmHg |
81±5.3 |
79±7.1 | 0.16 |
| SBP, mmHg |
131±9.5 |
128±6.7 | 0.22 |
| BMI, kg/m2 | 27.2±4.9 | 28.3±5.2 | 0.58 |
A total of 75 serum samples were analyzed by HPLC
coupled to ESI(+)- or ESI(−)-MS. Raw data from the individual
analyses were subjected to nonlinear data alignment. Univariate
statistics were used to screen the differential features between
the high- and low-serum homocysteine groups, and multivariate
statistics were used to determine group separation. In the ESI(+)
mode, a total of 1,949 features were detected, of which 695 (35.7%)
exhibited significant differences between the two groups
(FDR-adjusted P<0.05; Table
III). Correlation analysis revealed that 269 (13.8%) of the
1,949 different features are correlated with the level of serum
homocysteine (FDR <0.05), ranging from 0.41 to 0.65 for 59
positive correlation features and −0.68 to −0.41 for 210 negative
correlation features. In the ESI(−) mode, a total of 1,721 features
were detected, of which 157 (9.1%) exhibited significant
differences between the two groups (FDR <0.05), and a total of
69 (4.0%) of the 1,721 features had clear correlations with the
level of serum homocysteine (FDR <0.05), ranging from 0.40 to
0.68 for 32 positive correlation features and −0.63 to −0.39 for 37
negative correlation features. Matlin database searches revealed
that only 36 accurate masses that represented significant
differences and correlated features were matched (Table IV), and the corresponding 77
compounds were selected.
| Table III.Summary of the metabolomics profiles
using two different MS-based methods. |
Table III.
Summary of the metabolomics profiles
using two different MS-based methods.
| Method | Total peaks | Significant changed
peaks (%) | Significant changed
and correlated peaks (%) |
|---|
| HPLC/ESI(+)-MS | 1,949 | 695
(35.7) | 269 (13.8) |
| HPLC/ESI(−)-MS | 1,721 | 157 (9.1) | 69 (4.0) |
| Table IV.Detailed information of 36 accurate
masses. |
Table IV.
Detailed information of 36 accurate
masses.
| Feature | FC | P-value1 | Cor | P-value2 |
|---|
| M110T182 | 7.42 |
2.19×10−07 |
0.64 |
6.19×10−07 |
| M305T140 | 1.50 |
9.70×10−08 | −0.54 |
6.44×10−05 |
| M311T139 | 1.53 |
9.25×10−09 | −0.49 |
4.90×10−04 |
| M313T131 | 1.45 |
1.19×10−06 | −0.58 |
1.10×10−05 |
| M315T127 | 1.53 |
5.81×10−06 | −0.52 |
1.76×10−04 |
| M317T125 | 1.68 |
1.37×10−08 | −0.52 |
1.52×10−04 |
| M321T139 | 1.70 |
4.77×10−05 | −0.48 |
7.44×10−04 |
| M335T120 | 1.46 |
5.84×10−06 | −0.59 |
6.44×10−06 |
| M367T135 | 1.62 |
5.49×10−08 | −0.52 |
1.65×10−04 |
| M373T128 | 1.27 |
2.71×10−04 | −0.57 |
2.40×10−05 |
| M385T122 | 1.41 |
7.76×10−04 | −0.54 |
7.55×10−05 |
| M418T138 | 1.31 |
2.39×10−05 | −0.50 |
4.16×10−04 |
| M423T137 | 1.25 |
3.53×10−05 | −0.57 |
1.98×10−05 |
| M427T139 | 1.42 |
8.16×10−06 | −0.49 |
4.68×10−04 |
| M429T132 | 1.50 |
9.97×10−08 | −0.51 |
2.30×10−04 |
| M438T135 | 1.30 |
1.86×10−05 | −0.62 |
1.76×10−06 |
| M441T118 | 1.55 |
2.61×10−07 | −0.61 |
2.41×10−06 |
| M445T126 | 1.38 |
3.56×10−04 | −0.60 |
4.56×10−06 |
| M451T121 | 1.64 |
3.33×10−08 | −0.59 |
9.07×10−06 |
| M482T134 | 1.34 |
8.26×10−06 | −0.64 |
5.52×10−07 |
| M483T134 | 1.42 |
1.24×10−05 | −0.56 |
3.68×10−05 |
| M489T128 | 1.59 |
2.06×10−06 | −0.65 |
2.69×10−07 |
| M623T115 | 1.65 |
5.46×10−08 | −0.50 |
3.80×10−04 |
| M631T132 | 1.57 |
6.29×10−08 | −0.58 |
1.50×10−05 |
| M658T131 | 1.49 |
2.33×10−08 | −0.65 |
3.25×10−07 |
| M672T472 | 3.90 |
1.85×10−06 | 0.50 |
4.17×10−04 |
| M703T130_1 | 1.66 |
8.86×10⁻¹⁰ | −0.54 |
8.58×10−05 |
| M704T131 | 1.56 |
4.21×10−05 | −0.52 |
1.93×10−04 |
| M757T668 | 3.01 |
1.35×10−06 |
0.51 |
2.51×10−04 |
| M777T418 | 3.89 |
2.64×10−08 |
0.51 |
2.69×10−04 |
| M801T471 | 3.34 |
4.14×10−07 |
0.48 |
7.36×10−04 |
| M819T421 | 3.56 |
1.66×10−09 |
0.50 |
3.93×10−04 |
| M849T462 | 4.12 |
4.70×10⁻¹¹ |
0.51 |
2.28×10−04 |
| M865T412 | 3.04 |
6.13×10−07 |
0.47 |
9.55×10−04 |
| M879T417 | 3.09 |
3.64×10−07 |
0.47 |
9.91×10−04 |
| M923T419 | 3.12 |
1.89×10−07 |
0.49 |
5.58×10−04 |
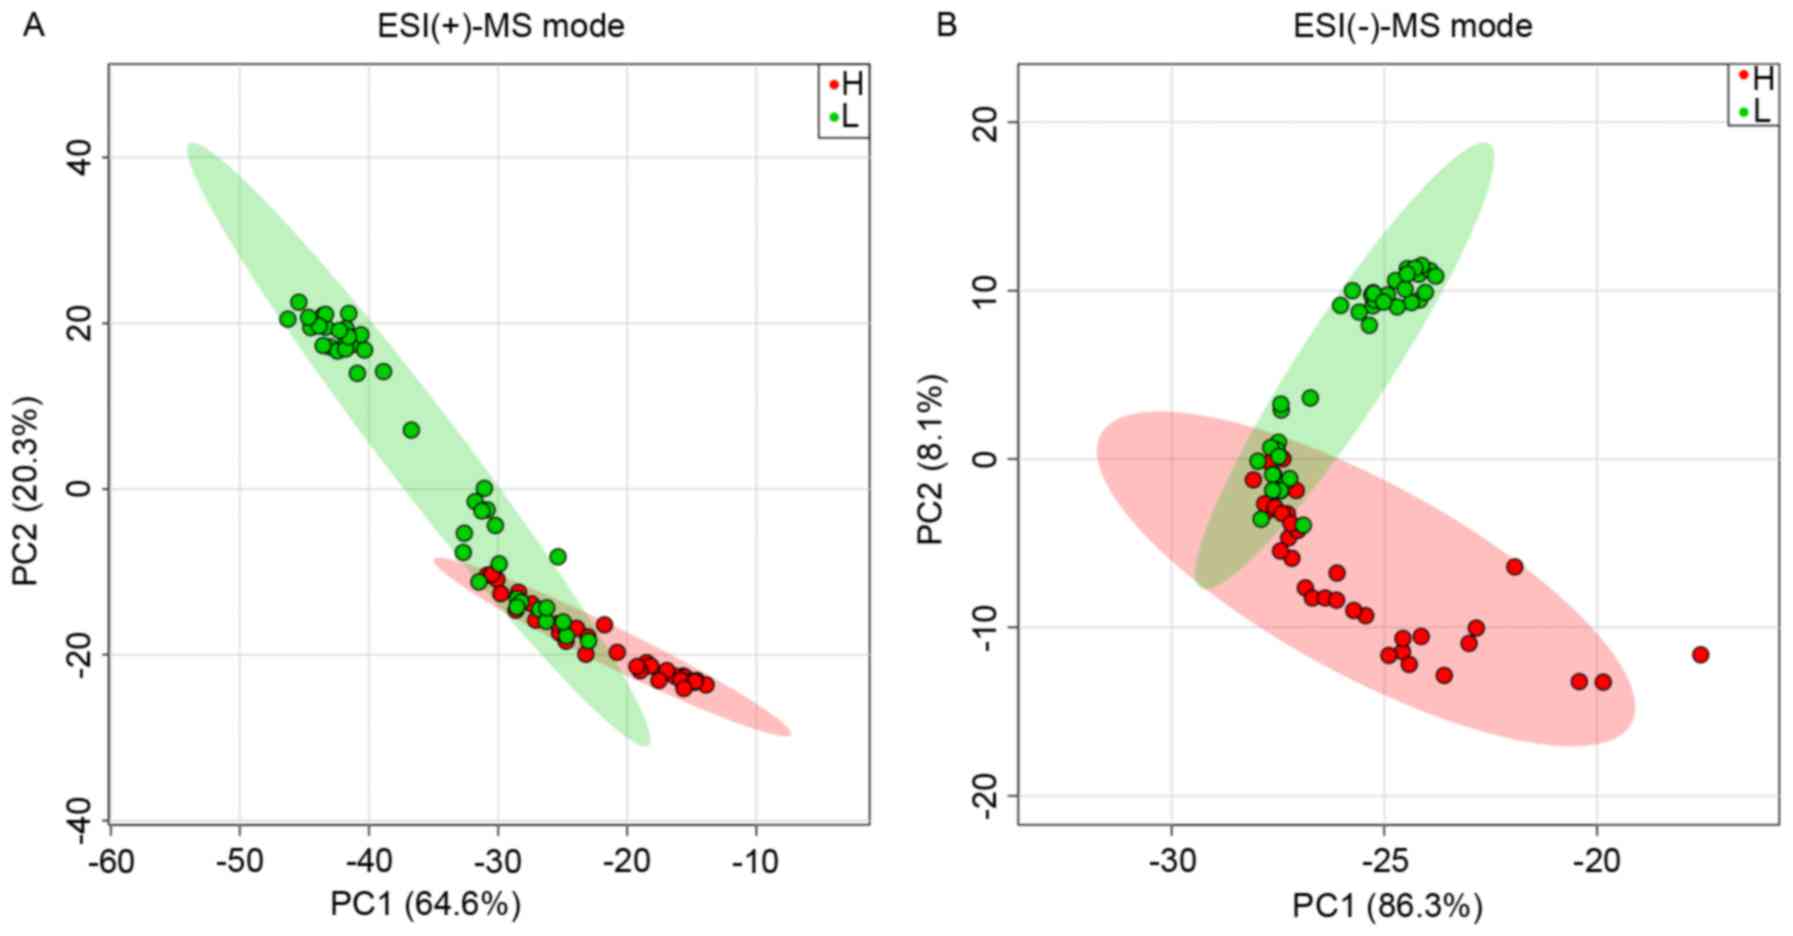
Principal component analysis of the 36 features
aforementioned (that is, plotting principal component 1 vs.
principal component 2) revealed a separation of the high- and the
low-serum homocysteine sample groups (Fig. 2). In the ESI(+)-MS mode, the mean
value of the samples in the low-level group was 10.8 µmol/l
compared with that of the high-level groups (39.1 µmol/l) in the
non-close-knit area (Fig. 2A).
However, a portion of the samples in one group was dispersed to the
other group in close-knit areas and exhibited similar levels of
serum homocysteine: The mean value of the low-level samples in the
close-knit area was 14.3 µmol/l, compared with the high-level
samples (16.6 µmol/l). Similar separation was found in the
ESI(−)-MS mode (Fig. 2B). In the
ESI(−)-MS mode, the mean value of the samples in the low-level
group was 11.2 µmol/l compared with that of the high-level groups
(36.8 µmol/l) in the non-close-knit area (Fig. 2B). The mean value of the low-level
samples in the close-knit area was 14.5 µmol/l, compared with the
high-level samples (17.0 µmol/l). In general, there may be an
overlap between classes owing to the subjective classification
thresholds of serum homocysteine, which was set at 15.0 µmol/l.
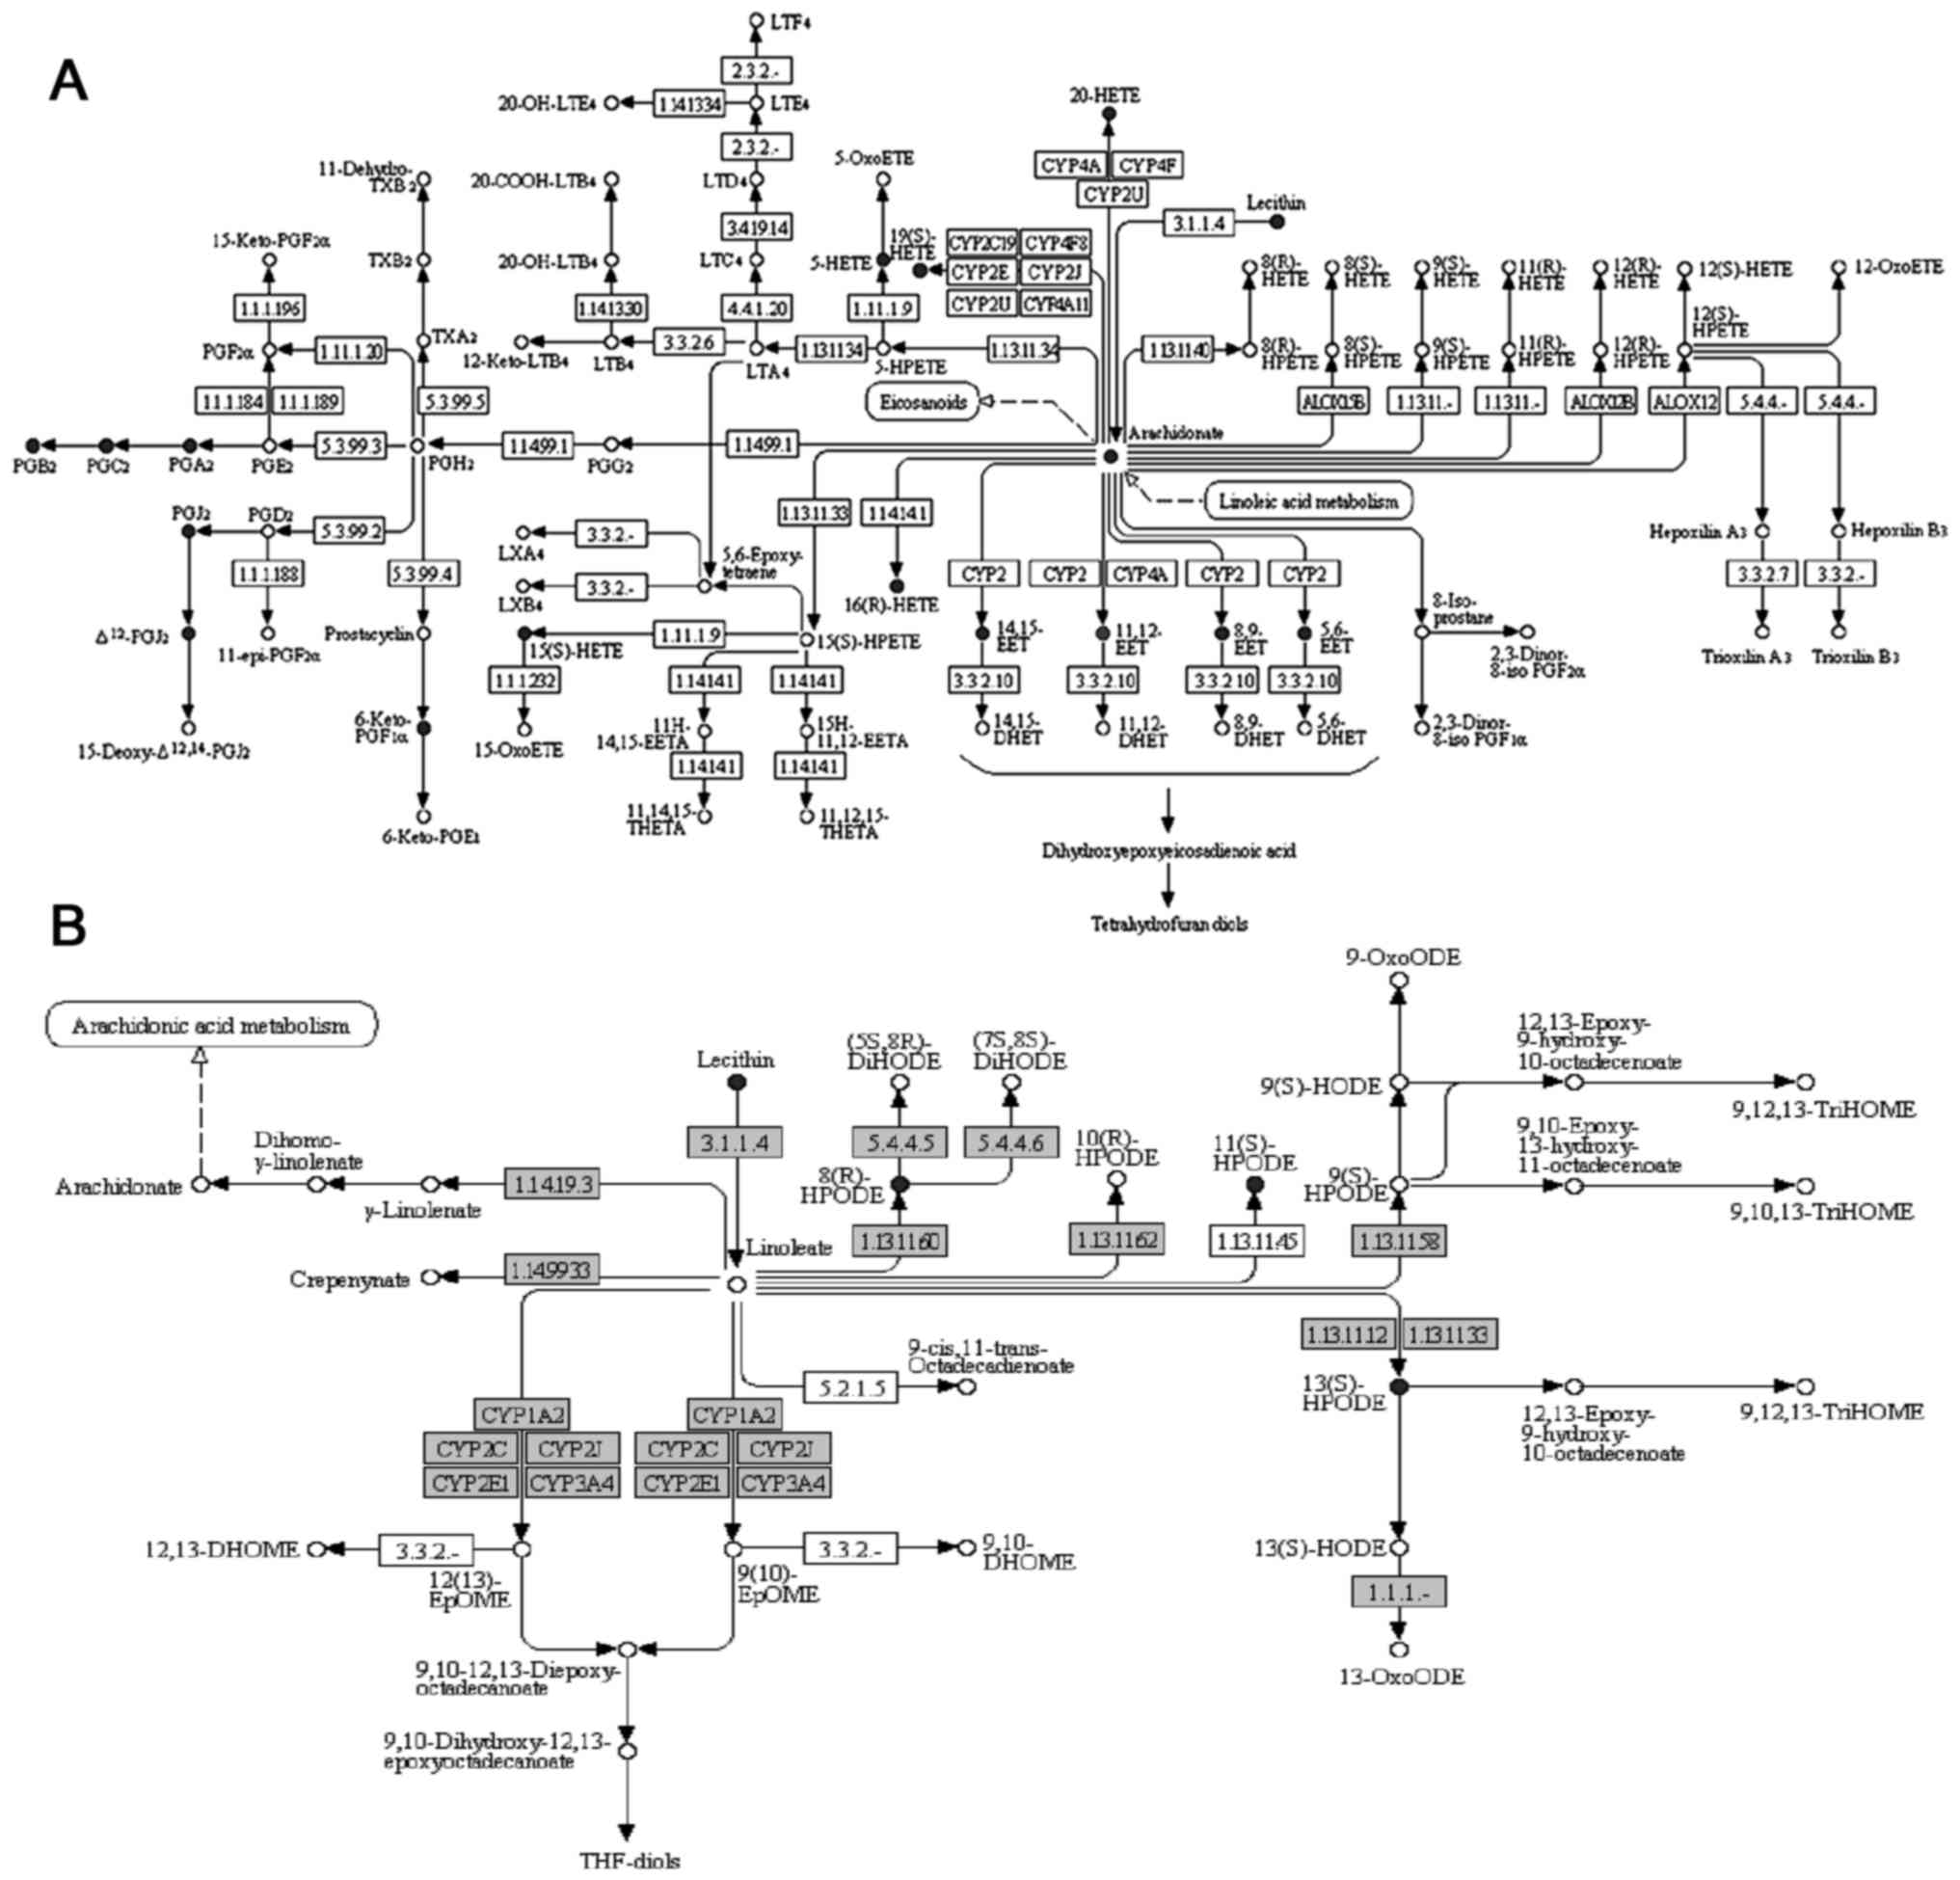
The metabolic pathways that were significantly
enriched for the aforementioned 77 compounds matched in Matlin
database were analyzed and two pathways were identified (Table V; FDR <0.05). The first enriched
pathway was arachidonic acid metabolism (FDR=8.01×10⁻⁸),
which serves an important role in vascular homeostasis; a total of
17 compounds that were matched in the Matlin database were revealed
to be involved in this pathway (Fig.
3A; Table VI). The second
pathway was linoleic acid metabolism (FDR=1.72×10⁻²),
and a total of 4 compounds that were matched in the Matlin database
were involved in this pathway (Fig.
3B; Table VII). However, a
‘one-to-many’ type of relationship was noted between the accurate
mass and the identified compounds in the Matlin database. M321T139,
for example, matched 9 compounds in the Matlin database, and all of
the 9 compounds were annotated in the arachidonic acid metabolism
pathway. This suggests that at least one 1 of the 9 compounds was
abnormally metabolized in the arachidonic acid pathway. In this
case, the false-positive rate of the pathway enrichment analysis
may have been magnified. In order to obtain more reliable results
in the pathway analysis, the one-to-many relationships between the
accurate mass and the compounds were eliminated in the two pathways
revealed to be significant, and only one compound was retained
randomly in each one-to-many relationships. Regardless of which one
compound was retained in the one-to-many relationships, there was
no effect on the significance in the MetaboAnalyst 3.0 analysis.
Subsequently, metabolic pathway enrichment was reanalyzed using
MetaboAnalyst 3.0, and it was revealed that the arachidonic acid
metabolism (FDR=0.02) and linoleic acid metabolism (FDR=0.12)
remained the top two pathways significantly enriched with the 21
retained compounds.
| Table V.Metabolic pathway enrichment
analysis. |
Table V.
Metabolic pathway enrichment
analysis.
| Pathway name | Total | Hits | P-value | FDR |
|---|
| Arachidonic acid
metabolism | 62 | 17 |
1.00×10⁻⁹ |
8.01×10⁻⁸ |
| Linoleic acid
metabolism | 15 | 4 |
4.29×10⁻⁴ |
1.72×10⁻² |
| Table VI.Details of the 17 compounds in
arachidonic acid metabolism pathway. |
Table VI.
Details of the 17 compounds in
arachidonic acid metabolism pathway.
| Feature | KEGG ID | Name |
|---|
| M321T139 | C04742 | 15(S)-HETE |
| M321T139 | C14770 | 11,12-EET |
| M321T139 | C14771 |
14,15-epoxy-5,8,11-eicosatrienoic
acid |
| M321T139 | C14778 | 16(R)-HETE |
| M321T139 | C14749 | 19(S)-HETE |
| M321T139 | C14748 | 20-HETE |
| M321T139 | C14768 |
5,6-epoxy-8,11,14-eicosatrienoic acid |
| M321T139 | C04805 | 5-HETE |
| M321T139 | C14769 | 8,9-EET |
| M367T135 | C05961 |
6-keto-prostaglandin F1α |
| M305T140 | C00219 | Arachidonic
acid |
| M335T120 | C05958 | Δ12-Prostaglandin
J2 |
| M335T120 | C05953 | Prostaglandin
A2 |
| M335T120 | C05954 | Prostaglandin
B2 |
| M335T120 | C05957 | Prostaglandin
J2 |
| M335T120 | C05955 | Prostaglandin
C2 |
| M819T421 | C00157 |
Phosphatidylcholine |
| Table VII.Details of the 4 compounds in
linoleic acid metabolism pathway. |
Table VII.
Details of the 4 compounds in
linoleic acid metabolism pathway.
| Feature | KEGG ID | Name |
|---|
| M819T421 | C00157 |
Phosphatidylcholine |
| M313T131 | C04717 |
13-L-Hydroperoxylinoleic acid |
| M313T131 | C07354 | (7S,8S)-DiHODE |
| M313T131 | C14831 |
8(R)-Hydroperoxylinoleic acid |
Discussion
Results from the present study demonstrated a
separation between the high- and the low-serum homocysteine groups
using the correlated features detected in ESI(+) and ESI(−) modes.
Furthermore, metabolic pathway analysis revealed that arachidonic
acid metabolism and linoleic acid metabolism were significantly
enriched for the compounds matched in the Matlin database. These
results indicated that serum homocysteine levels may affect
arachidonic acid and linoleic acid metabolism, and may subsequently
contribute to the development of vascular diseases. Homocysteine
was previously reported to have the potential to disrupt
arachidonic acid metabolism through DNA demethylation in
vitro (27).
A number of previous studies have suggested that
arachidonic acid metabolism served an important role in vascular
diseases (28–30). Arachidonic acid is a free fatty
acid derived from membrane phospholipids (31), which is catalyzed by phospholipase
A2 and metabolized into hundreds of metabolites by three pathways:
The cyclooxygenase (COX), lipoxygenase (LOX) and cytochrome P450
(CYP450) pathways (32). The
various arachidonic acid metabolites serve different roles in
vascular diseases pathogenesis, and a total of 17 compounds
annotated in arachidonic acid metabolism pathway maybe divided into
three main groups: Prostaglandins, hydroxyeicosatetraenoic acids
(HETEs) and epoxyeicosatrienoic acids (EETs). Prostaglandins are
crucial bioactive molecules that are derived from the COX pathway
and subsequent prostaglandin synthesis, and have been implicated in
inflammation (33,34). The HETEs are metabolites in the LOX
pathway, and have been implicated in numerous biological processes,
such as angiogenesis (35) and
platelet activation (36). The
EETs are metabolites in the CYP450 pathway, and may act as
antihypertensive and antiatherosclerotic (37) mediators for vasculature. Therefore,
an imbalanced arachidonic acid metabolism in vascular may lead to
an impairment in vascular homeostasis and the subsequent
development of vascular disease.
In conclusion, the present study provided novel
insights into the effects of homocysteine on metabolic alterations
in human serum. The results suggested that arachidonic acid and
linoleic acid metabolic pathways may be involved in
homocysteine-induced vascular disease. These data revealed a novel
effect of homocysteine in vascular disease and may have clinical
significance for the treatment of these diseases.
Acknowledgements
Not applicable.
Funding
This study was supported by The National High
Technology Research and Development Program 863 (grant no.
2011AA02A111).
Availability of data and materials
The datasets used during the present study are
available from the corresponding author on reasonable request.
Authors' contributions
The work presented here was performed in
collaboration between all authors. HL, YT and XJ defined the
research theme. BL, GG, WZ, BL and CY designed the methods and
experiments, performed the laboratory experiments and analyzed the
data. BL and WZ wrote the manuscript. All authors have contributed
to, read and approved the manuscript.
Ethics approval and consent to
participate
The present study was approved by the Ethics
Committee of the Fourth Affiliated Hospital of Harbin Medical
University (Harbin, China; 2018-SCILLSC-02). All participating
subjects were informed of their rights and written informed consent
was obtained.
Consent for publication
Not applicable.
Competing interests
The authors declare that they have no competing
interests.
References
|
1
|
McCully KS: Vascular pathology of
homocysteinemia: Implications for the pathogenesis of
arteriosclerosis. Am J Pathol. 56:111–128. 1969.PubMed/NCBI
|
|
2
|
Moll S: Plasma homocysteine levels and
mortality in patients with coronary artery disease. N Engl J Med.
337:1631–1632; author reply 1632–1633. 1997. View Article : Google Scholar : PubMed/NCBI
|
|
3
|
Soinio M, Marniemi J, Laakso M, Lehto S
and Rönnemaa T: Elevated plasma homocysteine level is an
independent predictor of coronary heart disease events in patients
with type 2 diabetes mellitus. Ann Intern Med. 140:94–100. 2004.
View Article : Google Scholar : PubMed/NCBI
|
|
4
|
Arnesen E, Refsum H, Bønaa KH, Ueland PM,
Førde OH and Nordrehaug JE: Serum total homocysteine and coronary
heart disease. Int J Epidemiol. 24:704–709. 1995. View Article : Google Scholar : PubMed/NCBI
|
|
5
|
Cheng SW, Ting AC and Wong J: Fasting
total plasma homocysteine and atherosclerotic peripheral vascular
disease. Ann Vasc Surg. 11:217–223. 1997. View Article : Google Scholar : PubMed/NCBI
|
|
6
|
Graham IM, Daly LE, Refsum HM, Robinson K,
Brattström LE, Ueland PM, Palma-Reis RJ, Boers GH, Sheahan RG,
Israelsson B, et al: Plasma homocysteine as a risk factor for
vascular disease. The European Concerted Action Project. JAMA.
277:1775–1781. 1997. View Article : Google Scholar : PubMed/NCBI
|
|
7
|
Perry IJ, Refsum H, Morris RW, Ebrahim SB,
Ueland PM and Shaper AG: Prospective study of serum total
homocysteine concentration and risk of stroke in middle-aged
British men. Lancet. 346:1395–1398. 1995. View Article : Google Scholar : PubMed/NCBI
|
|
8
|
Towfighi A, Saver JL, Engelhardt R and
Ovbiagele B: Factors associated with the steep increase in
late-midlife stroke occurrence among US men. J Stroke Cerebrovasc
Dis. 17:165–168. 2008. View Article : Google Scholar : PubMed/NCBI
|
|
9
|
Homocysteine Studies Collaboration:
Homocysteine and risk of ischemic heart disease and stroke: A
meta-analysis. JAMA. 288:2015–2022. 2002. View Article : Google Scholar : PubMed/NCBI
|
|
10
|
Boushey CJ, Beresford SA, Omenn GS and
Motulsky AG: A quantitative assessment of plasma homocysteine as a
risk factor for vascular disease. Probable benefits of increasing
folic acid intakes. JAMA. 274:1049–1057. 1995. View Article : Google Scholar : PubMed/NCBI
|
|
11
|
Selhub J: Homocysteine metabolism. Annu
Rev Nutr. 19:217–246. 1999. View Article : Google Scholar : PubMed/NCBI
|
|
12
|
McCully KS: Homocysteine and the
pathogenesis of atherosclerosis. Expert Rev Clin Pharmacol.
8:211–219. 2015. View Article : Google Scholar : PubMed/NCBI
|
|
13
|
Nicholson JK, Lindon JC and Holmes E:
‘Metabonomics’: Understanding the metabolic responses of living
systems to pathophysiological stimuli via multivariate statistical
analysis of biological NMR spectroscopic data. Xenobiotica.
29:1181–1189. 1999. View Article : Google Scholar : PubMed/NCBI
|
|
14
|
Wikoff WR, Gangoiti JA, Barshop BA and
Siuzdak G: Metabolomics identifies perturbations in human disorders
of propionate metabolism. Clin Chem. 53:2169–2176. 2007. View Article : Google Scholar : PubMed/NCBI
|
|
15
|
Xue R, Lin Z, Deng C, Dong L, Liu T, Wang
J and Shen X: A serum metabolomic investigation on hepatocellular
carcinoma patients by chemical derivatization followed by gas
chromatography/mass spectrometry. Rapid Commun Mass Spectrom.
22:3061–3068. 2008. View
Article : Google Scholar : PubMed/NCBI
|
|
16
|
Bogdanov M, Matson WR, Wang L, Matson T,
Saunders-Pullman R, Bressman SS and Flint Beal M: Metabolomic
profiling to develop blood biomarkers for Parkinson's disease.
Brain. 131:389–396. 2008. View Article : Google Scholar : PubMed/NCBI
|
|
17
|
Nicholson JK, Connelly J, Lindon JC and
Holmes E: Metabonomics: A platform for studying drug toxicity and
gene function. Nat Rev Drug Discov. 1:153–161. 2002. View Article : Google Scholar : PubMed/NCBI
|
|
18
|
Want EJ, Nordström A, Morita H and Siuzdak
G: From exogenous to endogenous: The inevitable imprint of mass
spectrometry in metabolomics. J Proteome Res. 6:459–468. 2007.
View Article : Google Scholar : PubMed/NCBI
|
|
19
|
Joint Committee for Developing Chinese
guidelines on Prevention and Treatment of Dyslipidemia in Adults, .
Chinese guidelines on prevention and treatment of dyslipidemia in
adults. Zhonghua Xin Xue Guan Bing Za Zhi. 35:390–419. 2007.(In
Chinese). PubMed/NCBI
|
|
20
|
Chen C and Lu FC: Department of Disease
Control Ministry of Health, PR China: The guidelines for prevention
and control of overweight and obesity in Chinese adults. Biomed
Environ Sci. 17 Suppl:S1–S36. 2004.
|
|
21
|
Guo H, Chi J, Xing Y and Wang P: Influence
of folic acid on plasma homocysteine levels & arterial
endothelial function in patients with unstable angina. Indian J Med
Res. 129:279–284. 2009.PubMed/NCBI
|
|
22
|
Xu J, Tian YP, Chen YH, Zhang RP, Yang F,
Song YM and Zeper A: Plasma preparation method for metabollomic
analysis based on rapid resolution liquid chromatography-mass
spectrometry. Chin J Anal Chem. 39:1793–1797. 2011. View Article : Google Scholar
|
|
23
|
Smith CA, Want EJ, O'Maille G, Abagyan R
and Siuzdak G: XCMS: Processing mass spectrometry data for
metabolite profiling using nonlinear peak alignment, matching, and
identification. Anal Chem. 78:779–787. 2006. View Article : Google Scholar : PubMed/NCBI
|
|
24
|
Xia J, Mandal R, Sinelnikov IV, Broadhurst
D and Wishart DS: MetaboAnalyst 2.0-a comprehensive server for
metabolomic data analysis. Nucleic Acids Res. 40:(Web Server
Issue). W127–W133. 2012. View Article : Google Scholar : PubMed/NCBI
|
|
25
|
Xia J, Sinelnikov IV, Han B and Wishart
DS: MetaboAnalyst 3.0-making metabolomics more meaningful. Nucleic
Acids Res. 43(W1): W251–W257. 2015. View Article : Google Scholar : PubMed/NCBI
|
|
26
|
Xia J and Wishart DS: MetPA: A web-based
metabolomics tool for pathway analysis and visualization.
Bioinformatics. 26:2342–2344. 2010. View Article : Google Scholar : PubMed/NCBI
|
|
27
|
Xue SS, He JL, Zhang X, Liu YJ, Xue FX,
Wang CJ, Ai D and Zhu Y: Metabolomic analysis revealed the role of
DNA methylation in the balance of arachidonic acid metabolism and
endothelial activation. Biochim Biophys Acta. 1851:1317–1326. 2015.
View Article : Google Scholar : PubMed/NCBI
|
|
28
|
Capdevila JH, Falck JR and Harris RC:
Cytochrome P450 and arachidonic acid bioactivation. Molecular and
functional properties of the arachidonate monooxygenase. J Lipid
Res. 41:163–181. 2000.PubMed/NCBI
|
|
29
|
Wang Y, Wei X, Xiao X, Hui R, Card JW,
Carey MA, Wang DW and Zeldin DC: Arachidonic acid epoxygenase
metabolites stimulate endothelial cell growth and angiogenesis via
mitogen-activated protein kinase and phosphatidylinositol
3-kinase/Akt signaling pathways. J Pharmacol Exp Ther. 314:522–532.
2005. View Article : Google Scholar : PubMed/NCBI
|
|
30
|
Xiao B, Li X, Yan J, Yu X, Yang G, Xiao X,
Voltz JW, Zeldin DC and Wang DW: Overexpression of cytochrome P450
epoxygenases prevents development of hypertension in spontaneously
hypertensive rats by enhancing atrial natriuretic peptide. J
Pharmacol Exp Ther. 334:784–794. 2010. View Article : Google Scholar : PubMed/NCBI
|
|
31
|
Smith GI, Atherton P, Reeds DN, Mohammed
BS, Rankin D, Rennie MJ and Mittendorfer B: Omega-3 polyunsaturated
fatty acids augment the muscle protein anabolic response to
hyperaminoacidemia-hyperinsulinemiain healthy young and middle-aged
men and women. Clin Sci (Lond). 121:267–278. 2011. View Article : Google Scholar : PubMed/NCBI
|
|
32
|
Imig JD and Hammock BD: Soluble epoxide
hydrolase as a therapeutic target for cardiovascular diseases. Nat
Rev Drug Discov. 8:794–805. 2009. View
Article : Google Scholar : PubMed/NCBI
|
|
33
|
Nishimura M, Hirai A, Omura M, Tamura Y
and Yoshida S: Arachidonic acid metabolites by cytochrome P-450
dependent monooxygenase pathway in bovine adrenal fasciculata
cells. Prostaglandins. 38:413–430. 1989. View Article : Google Scholar : PubMed/NCBI
|
|
34
|
Capdevila J, Marnett LJ, Chacos N, Prough
RA and Estabrook RW: Cytochrome P-450-dependent oxygenation of
arachidonic acid to hydroxyicosatetraenoic acids. Proc Natl Acad
Sci USA. 79:pp. 767–770. 1982; View Article : Google Scholar : PubMed/NCBI
|
|
35
|
Ma C, Wang Y, Shen T, Zhang C, Ma J, Zhang
L, Liu F and Zhu D: Placenta growth factor mediates angiogenesis in
hypoxic pulmonary hypertension. Prostaglandins Leukot Essent Fatty
Acids. 89:159–168. 2013. View Article : Google Scholar : PubMed/NCBI
|
|
36
|
Blazevic T, Schwaiberger AV, Schreiner CE,
Schachner D, Schaible AM, Grojer CS, Atanasov AG, Werz O, Dirsch VM
and Heiss EH: 12/15-lipoxygenase contributes to platelet-derived
growth factor-induced activation of signal transducer and activator
of transcription 3. J Biol Chem. 288:35592–35603. 2013. View Article : Google Scholar : PubMed/NCBI
|
|
37
|
Bellien J and Joannides R:
Epoxyeicosatrienoic acid pathway in human health and diseases. J
Cardiovasc Pharmacol. 61:188–196. 2013. View Article : Google Scholar : PubMed/NCBI
|