Introduction
Nonalcoholic fatty liver disease (NAFLD) is the most
common chronic liver disease with a worldwide with a prevalence
ranging from 6 to 35% (1). In
patients with type 2 diabetes mellitus (T2DM), the prevalence of
NAFLD is ~60% (2). Patients with
NAFLD are at a high risk of mortality from cardiovascular disease
and liver-associated diseases, including cirrhosis complications
and hepatocellular carcinoma (3).
In particular, patients with NAFLD and T2DM are at risk of
liver-associated mortality (4);
however, at present, no pharmacological therapies are established
for T2DM patients with NAFLD refractory to lifestyle intervention.
Thiazolidinediones (TZDs) and dipeptidyl peptidase-4 (DPP-4)
inhibitors are known to be effective for the treatment of various
T2DM pathophysiological processes. Pioglitazone (PIO), which is one
of the TZDs, has been demonstrated to decrease serum liver enzyme
levels, and to improve hepatic steatosis and lobular inflammation
in patients with nonalcoholic steatohepatitis (NASH) without T2DM
(5). PIO additionally prevented
methionine- and choline-deficient (CD) diet-induced steatohepatitis
in mice (6). Among the available
DPP-4 inhibitors, sitagliptin is reported to reduce serum liver
enzyme levels and decrease ballooning score in patients with NASH
and T2DM (7). Alogliptin (ALO) may
possess efficacy against NAFLD progression in patients with T2DM
(8). However, whether ALO is
effective for NAFLD remains to be elucidated. The present study
examined the effectiveness of ALO in a rodent model of NAFLD and
diabetes mellitus.
Materials and methods
Animal experiments
PIO and ALO were provided by Takeda Pharmaceutical
Company, Ltd. (Osaka, Japan). The CD diet and standard chow were
purchased from Oriental Yeast Co., Ltd. (Tokyo, Japan).
Eight-week-old 30 male KK-Ay mice were purchased from
CLEA Japan, Inc. (Tokyo, Japan). These mice demonstrate ectopic
overexpression of agouti peptide, an endogenous melanocortin-4
receptor (MC4R) antagonist, and social isolation promotes obesity
due primarily to decreased energy expenditure and secondarily to
increased food consumption. In addition, such isolation leads to
insulin-independent diabetes associated with increased hepatic
gluconeogenic gene expression (9).
KK-Ay mice were housed individually in stainless-steel
cages, and provided with unrestricted access to chow and tap water
throughout the duration of the present study. KK-Ay mice were
housed in the room of 23±3°C and 50±10% humidity and maintained on
12 h light/dark cycle. Following a 4-week acclimation period (12
weeks of age), the mice (45.5±4.9 g) were randomly separated into
five groups of 6 mice each and administered the following diets:
Control group, standard chow; CD group, a CD diet; PIO group, the
CD diet containing 0.02% PIO; ALO group, the CD diet containing
0.03% ALO; and the PIO+ALO group, the CD diet with 0.02% PIO and
0.03% ALO. Following 8 weeks of the diet, the mice received no food
for 18 h and were administered ether anesthesia and euthanized by
exsanguination from the inferior vena cava. Serum and hepatic
tissue samples were obtained and frozen at −80°C until assayed.
Certain hepatic tissues were fixed in 10% formalin for 48 h at room
temperature and 3 µm paraffin-embedded hepatic tissues were stained
with hematoxylin for 10 min and eosin for 5 min at room
temperature. Then the histology of samples was analyzed under a
light microscope (magnification, ×40 or ×100). The present study
was performed in strict accordance with the recommendations in the
Guide for the Care and Use of Laboratory Animals of the National
Institutes of Health (Bethesda, MD, USA). The protocol was approved
by the Institute for Animal Experimentation of Shimane University
(Shimane, Japan; protocol no. IZ23-164).
Measurements of serum parameters
Serum levels of aspartate aminotransferase (AST),
alanine aminotransferase (ALT), γ-glutamyl transpeptidase (γ-GTP),
triglyceride (TG), total cholesterol (T-Chol) and high-density
lipoprotein-cholesterol (HDL-C), in addition to fasting serum
glucose were measured using a Spotchem 4430 Benchtop Biochemistry
Analyzer (Arkray; SCIL, Holtzheim, France). Serum levels of fasting
insulin and adiponectin were measured using ELISA kits (AKRIN-011T
and AKMAN-011, respectively; Shibayagi Co., Ltd., Tokyo, Japan).
Homeostasis model of assessment-insulin resistance (HOMA-IR) values
were calculated using the following formula: HOMA-IR=[fasting serum
glucose (mmol/l) × fasting serum insulin (ng/ml)]/22.5 (10).
Determination of hepatic mRNA
levels
Total RNA was isolated from hepatic tissues with
RNAlater RNA Stabilization Reagent and purified using an RNeasy
Mini kit (both from Qiagen GmbH, Hilden, Germany). Samples of cDNA
were generated using a cDNA synthesis kit according to the
manufacturer's protocols (Applied Biosystems; Thermo Fisher
Scientific, Inc., Waltham, MA, USA). RT-qPCR was then performed
using an ABI PRISM 7700 sequence detection system (Thermo Fisher
Scientific, Inc.) with SYBR®-Green PCR master mix
(Applied Biosystems; Thermo Fisher Scientific, Inc.). The PCR
protocol used was as follows: Enzyme activation: 94°C for 10 min;
thermocycling, 94°C for 15 sec, 60°C for 1 min, repeat for 43
cycles. The relative expression of each gene was normalized to that
of GAPDH. qPCR was replicated two times for each sample of cDNA.
Primers for mouse fatty acid transport protein (FATP)1-4, fatty
acid synthase (FAS), liver-type fatty acid binding protein
(L-FABP), acyl-coenzyme A oxidase 1 (AOX) and long-chain
acyl-coenzyme A dehydrogenase (LCAD) genes were prepared as
previously described (11).
Primers for mouse peroxisome proliferator-activated receptor α
(PPARα), α smooth muscle actin (αSMA), superoxide dismutase 1
(SOD1), carnitine palmitoyltransferase 1a (CPT1a), microsomal
triglyceride transfer protein (MTP), monocyte chemoattractant
protein 1 (MCP1) and GAPDH genes were prepared using NCBI blast
tool and Primer3 Input (version 0.4.0, http://bioinfo.ut.ee/primer3-0.4.0/) which is most
commonly used for primer design (12). The primers are presented in
Table I. All the mRNA levels were
normalized to GAPDH mRNA in the same preparation.
 | Table I.Primer sequences for reverse
transcription-quantitative polymerase chain reaction. |
Table I.
Primer sequences for reverse
transcription-quantitative polymerase chain reaction.
| Primer | Sequence |
|---|
| FATP1-fwd |
5′-CGCTTTCTGCGTATCGTCTG-3′ |
| FATP1-rev |
5′-GATGCACGGGATCGTGTCT-3′ |
| FATP2-fwd |
5′-GGTATGGGACAGGCCTTGCT-3′ |
| FATP2-rev |
5′-GGGCATTGTGGTATAGATGACATC-3′ |
| FATP3-fwd |
5′-AGTGCCAGGGATTCTACCATC-3′ |
| FATP3-rev |
5′-GAACTTGGGTTTCAGCACCAC-3′ |
| FATP4-fwd |
5′-GATGGCCTCAGCTATCTGTGA-3′ |
| FATP4-rev |
5′-GGTGCCCGATGTGTAGATGTA-3′ |
| FAS-fwd |
5′-TGCTCCCAGCTGCAGGC-3′ |
| FAS-rev |
5′-GCCCGGTAGCTCTGGGTGTA-3′ |
| L-FABP-fwd |
5′-GTGGTCCGCAATGAGTTCAC-3′ |
| L-FABP-rev |
5′-GTATTGGTGATTGTGTCTCC-3′ |
| AOX-fwd |
5′-CTTGTTCGCGCAAGTGAGG-3′ |
| AOX-rev |
5′-CAGGATCCGACTGTTTACC-3′ |
| LCAD-fwd |
5′-AAGGATTTATTAAGGGCAAGAAGC-3′ |
| LCAD-rev |
5′-GGAAGCGGAGGCGGAGTC-3′ |
| PPARα-fwd |
5′-TGCAAACTTGGACTTGAACG-3′ |
| PPARα-rev |
5′-TGATGTCACAGAACGGCTTC-3′ |
| αSMA-fwd |
5′-CAACTGGGACGACATGGAA-3′ |
| αSMA-rev |
5′-GGTCTCAAACATAATCTGGGTCA-3′ |
| SOD1-fwd |
5′-GAACCATCCACTTCGAGCAG-3′ |
| SOD1-rev |
5′-AAAATGAGGTCCTGCACTGG-3′ |
| CPT1a-fwd |
5′-TGTCAAAGATACCGTGAGCAG-3′ |
| CPT1a-rev |
5′-GCCCACCAGGATTTTAGCTT-3′ |
| MTP-fwd |
5′-CATGTCAGCCATCCTGTTTG-3′ |
| MTP-rev |
5′-CTCGCGATACCACAGACTGA-3′ |
| MCP1-fwd |
5′-AGGTCCCTGTCATGCTTCTG-3′ |
| MCP1-rev |
5′-TCATTGGGATCATCTTGCTG-3′ |
| GAPDH-fwd |
5′-ACCCAGAAGACTGTGGATGG-3′ |
| GAPDH-rev |
5′-GGTCCTCAGTGTAGCCCAAG-3′ |
Protein extraction and western
blotting assays
Protein extraction was performed using
PRO-PREP™ protein extraction solution (Intron
Biotechnology, Inc., Seongnam, Korea), according to the
manufacturer's protocol. A total of 10 mg of liver tissue was
suspended in 500 µl PRO-PREP™ solution mixed with 5 µl
Phosphatase-Inhibitor Mix II (Cosmo Bio Co., Ltd., Tokyo, Japan).
Subsequently, the tissue was disrupted using a Tissue Lyser II
(Qiagen GmbH) for 3 min at 30 Hz and homogenized with a syringe
equipped with a 23-G needle, followed by incubation on ice for 30
min and sonication with Bioruptor UCD-200 TM (Cosmo Bio Co., Ltd.).
In water cooled with ice, sonication for 5 min at 20 KHz was
performed for 30 sec every 60 sec. The resulting liver tissue
lysate was centrifuged at 14,000 × g for 5 min at 4°C, and the
supernatant was collected and subjected to downstream processing.
The protein concentration was estimated using a Pierce™
Bicinchoninic Acid Protein Assay kit (Takara Bio, Inc., Otsu,
Japan), for which 50 µg protein/lane was loaded and processed for
SDS-PAGE fractionation (4–12% SDS-PAGE mini; Tefco Technical
Frontier Co., Tokyo, Japan) and transferred to a polyvinylidene
difluoride membrane (Hybond-P; GE Healthcare Life Sciences, Little
Chalfont, UK). Following blocking of the membrane for 1 h using 5%
skimmed milk (Difco; BD Biosciences, Franklin Lakes, NJ, USA) in
TBS-Tween-20 (TBST; TBS and 0.05% Tween-20, pH 7.4) at room
temperature, it was incubated for 24 h with a
phosphorylated-AMP-activated protein kinase (AMPK)α (Thr172) rabbit
monoclonal antibody (cat. no. 2535S; Cell Signaling Technology,
Inc., Danvers, MA, USA) at a 1:500 dilution at 4°C, reacted with
peroxidase-conjugated polyclonal goat anti-rabbit immunoglobulins
(cat. no. P7-0448; Dako; Agilent Technologies Inc., Santa Clara,
CA, USA) at a 1:1,000 dilution at room temperature for 2 h, and
washed three times in TBST. The resulting signals were imaged using
electrochemiluminescence (GE Healthcare Bio-Sciences, Pittsburgh,
PA, USA). Goat anti-β-actin antibody (catalogue no. SC-47778; Santa
Cruz Biotechnology, Inc., Dallas, TX, USA) was used as an internal
control. Band densitometry was performed using ImageJ software of
version 1.51 (National Institutes of Health, Bethesda, MD,
USA).
Statistical analysis
All data are presented as the mean ± standard
deviation (n=3). Mann-Whitney's U test was used for comparisons
between two groups, while Steel-Dwass test following a
Kruskal-Wallis test was used for comparisons among multiple groups.
P<0.05 was considered to indicate a statistically significant
difference. All statistical analyses were performed using
Statistical Analysis Software (BellCurve for Excel, version 2.14;
Social Survey Research Information Co., Ltd., Tokyo, Japan).
Results
Diet consumption and body weight are
not affected by the administration of PIO or ALO
The Control group consumed a greater amount of food
compared with the CD group (23.5±1.6 and 16.8±2.5 kcal/body/day,
respectively; P=0.006). No significant differences were identified
in the amounts of food consumed among the CD, PIO, ALO and PIO+ALO
groups (Table II). In the CD,
PIO, ALO and PIO+ALO groups, mean body weights prior to starting
the diet were 49.0±1.4, 48.2±2.4, 48.5±2.5, 48.2±2.3 and 48.9±2.3
g, respectively, while those following 8 weeks of diet consumption
were 52.5±2.3, 52.6±4.9, 59.9±7.5, 53.3±4.1 and 63.8±2.5 g,
respectively, illustrating that the body weight of the PIO+ALO
group was significantly increased compared with that of the CD
(P=0.03) and ALO (P=0.03) groups at the end of the 8-week period
(Table II).
| Table II.Food intake, body weight and liver
weight/body weight at 8 weeks in each group. |
Table II.
Food intake, body weight and liver
weight/body weight at 8 weeks in each group.
| Variable | Control | CD | PIO | ALO | PIO+ALO |
|---|
| Food intake,
kcal/day/body |
23.5±1.6 |
16.8±2.4a |
16.9±2.3 |
16.3±1.5 |
18.6±0.7 |
| Body weight after
eight weeks, g |
52.5±2.3 |
52.6±4.9 |
59.9±7.5 |
53.3±4.1 |
63.8±2.5b,c |
| Liver weight/body
weight (%) |
5.8±0.6 |
12.7±4.4a |
7.2±1.4 |
10.6±2.6 |
7.3±2.8 |
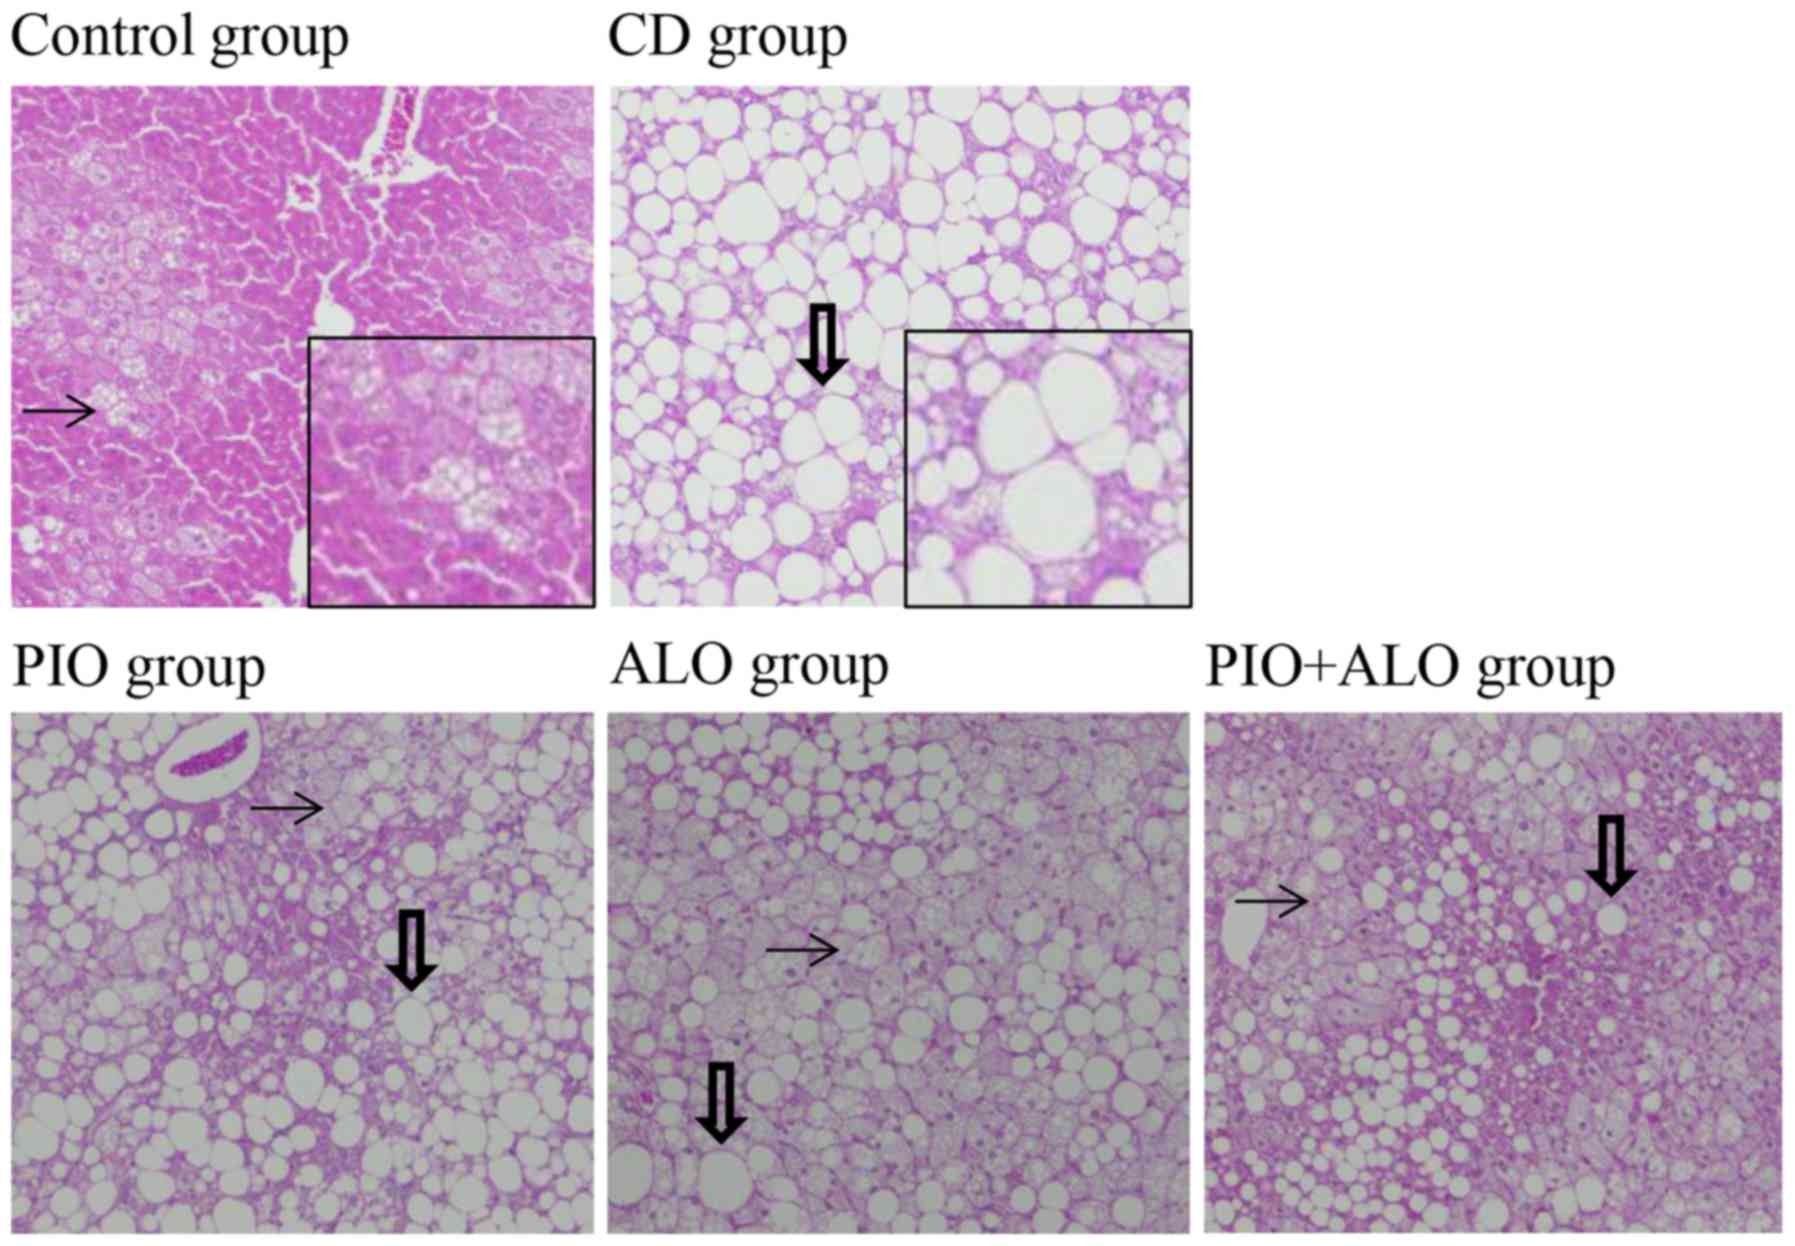
Macrovesicular hepatic steatosis areas
become small following PIO and/or ALO administration
Following 8 weeks of the dietary treatment, the
liver/body weight ratio of the CD group was significantly greater
compared with the Control group (P=0.006). By contrast, no
significant differences were identified among the CD, PIO, ALO and
PIO+ALO groups (Table II). Mild
microvesicular hepatic steatosis was recognized in the Control
group and severe macrovesicular hepatic steatosis was recognized in
the CD group. Macrovesicular hepatic steatosis areas in the PIO,
ALO and PIO+ALO groups were smaller compared with the CD group
(Fig. 1).
CD diet fed to KK-Ay mice
for 8 weeks does not present evident histological findings of
inflammation and fibrosis
No evident histological inflammatory alterations in
the liver were observed in the CD group; however, the level of MCP1
expression in the livers of the CD group was significantly
increased compared with in the Control group. Conversely, no
significant differences were identified between MCP1 expression
levels in the livers of the PIO, ALO and PIO+ALO groups compared
with in the CD group. There was no evident hepatic fibrosis
observed in the CD group and the expression levels of αSMA in the
liver were not significantly different compared with in the Control
group (Table III).
| Table III.mRNA levels of MCP1 and αSMA relative
to the mRNA level of GAPDH in the livers of the Control, CD, PIO,
ALO and PIO+ALO groups. |
Table III.
mRNA levels of MCP1 and αSMA relative
to the mRNA level of GAPDH in the livers of the Control, CD, PIO,
ALO and PIO+ALO groups.
|
| Control | CD | PIO | ALO | PIO+ALO |
|---|
| MCP1 |
0.05±0.01 |
0.63±0.07a |
0.64±0.04 |
0.74±0.08 |
0.71±0.14 |
| αSMA |
1.31±0.68 |
2.42±0.32 |
1.49±1.25 |
1.84±1.25 |
1.74±1.15 |
Serum parameter of liver tests and
metabolic laboratory variables are not altered by PIO or ALO
administration
The serum levels of AST (P=0.006) and ALT (P=0.006)
were significantly higher in the CD group compared with the Control
group, whereas those levels in the PIO, ALO and PIO+ALO groups were
not statistically different from the CD group (Table IV). Serum adiponectin in the CD
group was not statistically different compared with the Control
group, while its level in the PIO group demonstrated a tendency to
be higher compared with the CD group (P=0.09; Table IV). Fasting serum insulin in the
CD group demonstrated a tendency to be lower compared with the
Control group (P=0.055), while no significant differences were
identified among the CD diet groups. On the other hand, fasting
serum glucose in the CD group tended to be higher compared with the
PIO+ALO (P=0.082) group and HOMA-IR in the PIO+ALO (P=0.082) group
also tended to be lower compared with the CD group (Table IV). Serum TG in the CD group was
almost equal to that in the Control group and did not alter with
PIO/ALO administration (Table
IV). However, serum T-Cho and HDL-C in the CD group were
significantly higher compared with the Control group, while serum
HDL-C in the PIO+ALO group was higher compared with the ALO group
(Table IV).
| Table IV.Alterations in serum parameters. |
Table IV.
Alterations in serum parameters.
| Parameter | Control | CD | PIO | ALO | PIO+ALO |
|---|
| AST, IU/l |
37±6 |
301±120a |
268±99 |
213±68 |
236±76 |
| ALT, IU/l |
27±9 |
609±206a |
405±129 |
463±204 |
398±115 |
| Adiponectin,
mg/ml |
5.50±2.15 |
3.62±1.02 |
5.03±0.62 |
4.10±0.80 |
5.40±1.57 |
| Fasting serum
insulin, ng/ml |
3.1±0.5 |
1.3±1.3 |
0.9±0.6 |
1.0±0.6 |
0.3±0.1 |
| Fasting serum
glucose, mmol/l |
11.3±2.1 |
14.0±1.8 |
11.8±1.0 |
13.2±2.9 |
10.5±1.9 |
| HOMA-IR |
1.61±0.53 |
0.83±0.85 |
0.46±0.36 |
0.63±0.44 |
0.16±0.83 |
| TG, mg/dl |
143±21 |
143±23 |
118±24 |
140±23 |
110±12 |
| T-Chol, mg/dl |
95±11 |
155±23a |
163±32 |
141±29 |
156±14 |
| HDL-C, mg/dl |
64±8 |
84±8a |
85±13 |
79±6 |
94±7b |
mRNA expression of CPT1a in the liver
is significantly increased by ALO administration
The gene expression levels of enzymes associated
with lipid metabolism in liver tissue were examined using RT-qPCR,
including genes associated with fatty acid uptake (FATP1, 2, 3 and
4), fatty acid synthesis, fatty acid oxidation (PPARα, L-FABP,
CPT1a, AOX and LCAD) and very low density lipoprotein export. The
expression levels of FATP3 (P=0.006) and FAS (P=0.006) in the liver
were significantly increased in the CD group compared with the
Control group (Table V). On the
other hand, the expression levels of PPARα (P=0.017), L-FABP
(P=0.018), LCAD (P=0.011) and MTP (P=0.006) in the liver were
significantly decreased in the CD group compared with the Control
group (Table V). Macrovesicular
hepatic areas were decreased in the PIO, ALO and PIO+ALO groups
compared with the CD group (Fig.
1). The expression levels of lipid metabolic genes in the
livers of mice in the PIO, ALO and PIO+ALO groups were also
compared with those in the CD group to examine the mechanism of
prevention of fatty liver by PIO and/or ALO administration. The
expression of FAS in the liver demonstrated a tendency to be
decreased in the PIO group compared with the CD group (P=0.051),
while the expression of CPT1a in the ALO group was significantly
increased compared with the CD (P=0.031) and PIO (P=0.031) groups,
whereas the expression of AOX did not alter following
administration of PIO and/or ALO. The antioxidant enzyme SOD1 was
additionally examined. Its expression in the liver was
significantly decreased in the CD group compared with the Control
group (P=0.045), while it demonstrated a tendency to increase in
the PIO+ALO group compared with the CD group (P=0.051) (Table V).
| Table V.mRNA levels of various target
genes/mRNA level of GAPDH in liver following pioglitazone and/or
alogliptin administration. |
Table V.
mRNA levels of various target
genes/mRNA level of GAPDH in liver following pioglitazone and/or
alogliptin administration.
| Target gene | Control | CD | PIO | ALO | PIO+ALO |
|---|
| FATP1 |
0.79±0.14 |
0.56±0.17 |
0.62±0.12 |
0.42±0.13 |
0.43±0.14 |
| FATP2 |
2.64±0.33 |
1.25±0.39a |
1.88±0.65 |
1.65±0.59 |
1.57±0.69 |
| FATP3 |
0.37±0.05 |
0.91±0.26a |
0.72±0.16 |
0.78±0.31 |
0.82±0.22 |
| FATP4 |
0.79±0.14 |
0.56±0.17 |
0.68±0.22 |
0.81±0.14 |
0.82±0.14 |
| FAS |
0.39±0.04 |
0.78±0.23a |
0.48±0.10 |
0.55±0.13 |
0.53±0.15 |
| L-FABP |
1.21±0.35 |
0.78±0.18a |
1.07±0.46 |
0.89±0.18 |
0.94±0.12 |
| AOX |
1.30±0.39 |
1.03±0.23 |
1.64±0.63 |
1.16±0.25 |
1.45±0.58 |
| LCAD |
1.61±0.44 |
0.90±0.25a |
0.93±0.59 |
0.92±0.21 |
0.91±0.13 |
| PPARα |
1.25±0.39 |
0.72±0.25a |
1.15±0.56 |
0.92±0.07 |
1.05±0.28 |
| SOD1 |
0.93±0.45 |
0.34±0.14a |
0.57±0.31 |
0.55±0.20 |
0.70±0.14 |
| CPT1a |
0.47±0.19 |
0.55±0.20 |
0.49±0.26 |
2.00±0.63b,c |
1.94±0.73b,c |
| MTP |
1.39±0.14 |
0.94±0.11a |
0.99±0.22 |
0.97±0.14 |
0.99±0.34 |
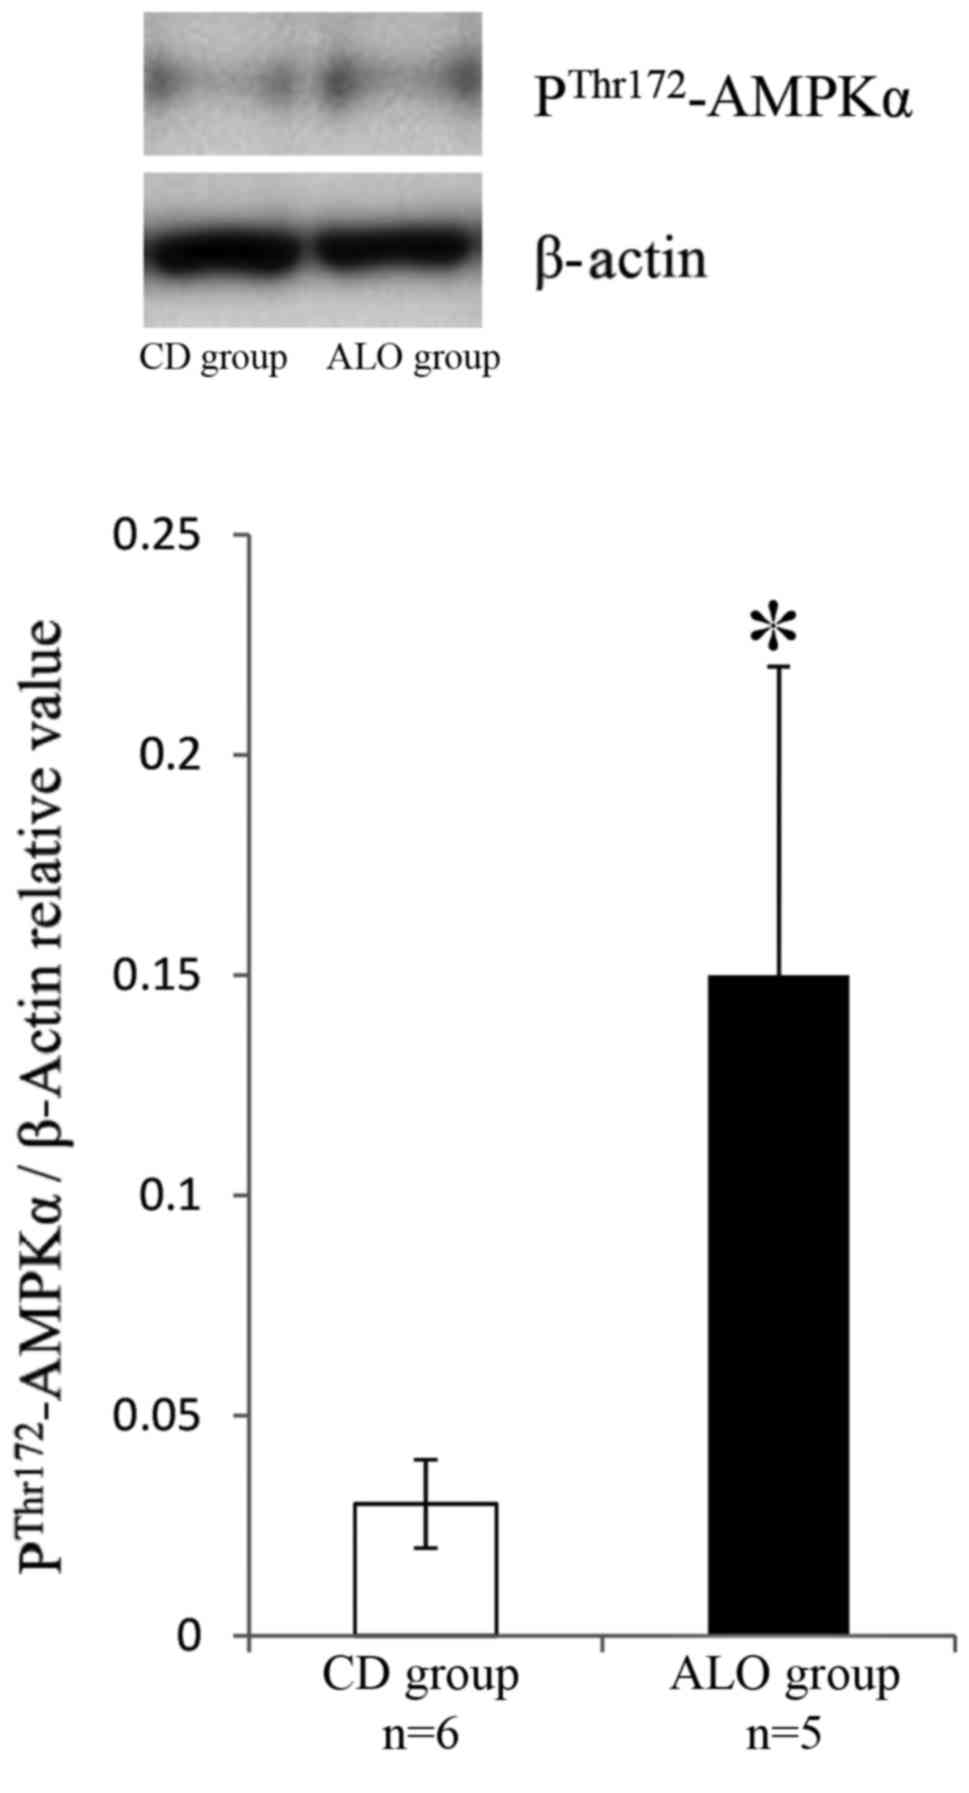
ALO upregulates CPT1a expression via
activation of AMP-activated protein kinase
Western blotting demonstrated that ALO promoted the
phosphorylation of AMPK on Thr-172 in the livers of the ALO group
mice compared with the CD group (Fig.
2).
Discussion
The present study demonstrated that severe hepatic
steatosis developed in KK-Ay mice administered a CD diet
(the CD group), while weight gain was the same as those fed a
standard diet (the Control group). It was concluded that the
increased expression levels of FATP3 and FAS, and the decreased
expression levels of PPARα, L-FABP, LCAD and MTP, in the livers of
the CD group mice contributed to severe hepatic steatosis. MTP is a
peptide that incorporates triglycerides into very low density
lipoprotein (13), thus it was
hypothesized that downregulation of MTP expression contributes to
hepatic steatosis. As for glucose metabolism, no significant
differences were identified between fasting serum glucose, fasting
serum insulin and HOMA-IR levels in the Control and CD groups,
indicating that the CD diet did not attenuate insulin resistance or
glucose intolerance. By contrast, a methionine- and
choline-deficient diet fed to KK-Ay mice for 8 weeks
resulted in severe liver steatosis, inflammatory cell infiltration
and liver fibrosis (14).
In the present study, hepatic steatosis was
evidently alleviated by administration of PIO. PIO is a TZD, which
are known to be effective for T2DM treatment. A previous
meta-analysis identified that PIO improves insulin sensitivity,
serum ALT levels and histological features in patients with NASH
(15). Gastaldelli et al
(16) evaluated the association
between alterations in plasma adiponectin in patients with NASH and
metabolic/histological improvement following treatment with PIO,
and concluded that PIO increases the level of adiponectin in
patients with NASH, which is important to reverse insulin
resistance and improve liver histology. The present study
demonstrated that PIO administration in NAFLD model mice with
diabetes mellitus tended to increase the plasma concentration of
adiponectin. Although the level of adiponectin in the CD group
demonstrated a decreasing tendency compared with the Control group,
PIO tended to increase the level in the PIO group compared with the
CD group. Furthermore, the RT-qPCR analysis of hepatic lipid
metabolism demonstrated that PIO decreased the gene expression
level of FAS. These results suggested that PIO improved hepatic
steatosis by increasing the level of adiponectin and decreasing
fatty acid synthesis. Although PIO has been reported to reduce the
level of αSMA mRNA (17), the
results of the present study did not demonstrate such a reduction
in the livers of mice in the PIO and PIO+ALO groups.
A number of DPP-4 inhibitors have been reported to
be effective for NASH. Linagliptin was demonstrated to alleviate
hepatic steatosis and increased the expression of acetyl-CoA
carboxylase 2 in the livers of NASH model mice (18). Kern et al (19) reported that linagliptin
significantly decreased the mRNA expression levels of genes
associated with inflammation, insulin resistance and fatty acid
synthesis in the livers of diet-induced NASH model mice, although
such an effect was not observed on the mRNA expression of genes
involved in fatty acid oxidation. MK0626, a DPP-4 inhibitor similar
to sitagliptin in regard to pharmacokinetics, rescued western
diet-induced decreases in hepatic PPARγ coactivator-1α (PGC-1α) and
CPT1a mRNA expression (20). In
the present study, ALO alleviated hepatic steatosis in CD-diet fed
KK-Ay mice and significantly increased the hepatic mRNA
expression of CPT1a compared with the CD and PIO groups. It was
hypothesized that ALO attenuated hepatic steatosis primarily via a
fatty acid oxidation pathway, as hepatic mRNA expression is
associated with the hepatic uptake of free fatty acid (FATP1-4),
and fatty acid synthesis and triacylglycerol export did not alter
with ALO administration.
The present study additionally demonstrated that ALO
increased hepatic CPT1a expression via the AMPK pathway. CPT1a is
important for limiting fatty acid oxidation, and its activity in
the liver was identified to be protecting obese mice against
hepatic steatosis and insulin resistance (21). Another study demonstrated that
GLP-1 reduces hepatic lipogenesis via activation of AMPK (22). AMPK is an evolutionarily conserved
metabolic stress-sensing kinase that regulates cellular energy
status through phosphorylation of key substrates (23). An in vitro study identified
that activation of AMPK increases the expression of CPT1a (24). Dahlhoff et al (25) demonstrated that methyl-donor
supplementation (MDS) in obese mice prevented the progression of
NAFLD, and suggested that MDS activates AMPK and increases CPT1a
expression in the liver, resulting in the promotion of fatty acid
oxidation. In the present study, ALO increased hepatic CPT1a
expression in CD-diet fed KK-Ay mice, which it was
hypothesized occurred via AMPK activation, including from MDS. The
results of the present study demonstrated that ALO promoted the
Thr172 phosphorylation of AMPK and increased CPT1a expression in
the livers of CD-diet fed KK-Ay mice.
The present study has certain limitations. The mRNA
expression levels of genes associated with lipid metabolism in
liver tissue were examined, although not those of proteins.
Furthermore, only a single mouse model was utilized. It may be
necessary to examine whether gene expression levels at the mRNA
level are the same as at the protein level. In addition, other
mouse models may be used in future studies.
In conclusion, PIO prevented hepatic steatosis by
decreasing the mRNA expression level of genes previously reported
to be associated with fatty acid synthesis. It is suggested that
ALO prevents hepatic steatosis in KK-Ay mice fed a CD
diet, primarily by increasing the expression of CPT1a via the AMPK
pathway.
Acknowledgements
We thank Rika Tohma, and Keiko Masuzaki (Shimane
University, Japan) for their technical assistance, as well as the
members of our laboratory for the helpful discussion.
Funding
No funding was received.
Availability of data and materials
All data generated or analyzed during this study are
included in this published article.
Authors' contributions
HT and SS designed the research study and wrote the
paper. TY, TM and NI performed data acquisition and analysis. SI
and YK provided major contributions to the design of the study. All
authors read and approved the final manuscript.
Ethics approval and consent to
participate
The present study was performed in strict accordance
with the recommendations in the Guide for the Care and Use of
Laboratory Animals of the National Institutes of Health (Bethesda,
MD, USA). The protocol was approved by the Institute for Animal
Experimentation of Shimane University (Shimane, Japan; protocol no.
IZ23-164).
Consent for publication
Not applicable.
Competing interests
The authors declare that they have no competing
interests.
References
|
1
|
Bellentani S: The epidemiology of
non-alcoholic fatty liver disease. Liver Int. 1:81–84. 2017.
View Article : Google Scholar
|
|
2
|
Dai W, Ye L, Liu A, Wen SW, Deng J, Wu X
and Lai Z: Prevalence of nonalcoholic fatty liver disease in
patients with type 2 diabetes mellitus: A meta-analysis. Medicine
(Baltimore). 96:e81792017. View Article : Google Scholar : PubMed/NCBI
|
|
3
|
Angulo P, Kleiner DE, Dam-Larsen S, Adams
LA, Bjornsson ES, Charatcharoenwitthaya P, Mills PR, Keach JC,
Lafferty HD, Stahler A, et al: Liver fibrosis, but no other
histologic features, is associated with long-term outcomes of
patients with nonalcoholic fatty liver disease. Gastroenterology.
149:389–397. 2015. View Article : Google Scholar : PubMed/NCBI
|
|
4
|
Rafig N, Bai C, Fang Y, Srishord M,
McCullough A, Gramlich T and Younossi ZM: Long-term follow-up of
patients with nonalcoholic fatty liver. Clin Gastroenterol Hepatol.
7:234–238. 2009. View Article : Google Scholar : PubMed/NCBI
|
|
5
|
Sanyal AJ, Chalasani N, Kowdley KV,
McCullough A, Diehl AM, Bass NM, Neuschwander-Tetri BA, Lavine JE,
Tonascia J, Unalp A, et al: Pioglitazone, vitamin E, or placebo for
nonalcoholic steatohepatitis. N Engl J Med. 362:1675–1685. 2010.
View Article : Google Scholar : PubMed/NCBI
|
|
6
|
Da Silva Morais A, Lebrun V,
Abarca-Quinones J, Brichard S, Hue L, Guigas B, Viollet B and
Leclercq IA: Prevention of steatohepatitis by pioglitazone:
Implication of adiponectin-dependent inhibition of SREBP-1c and
inflammation. J Hepatol. 50:489–500. 2009. View Article : Google Scholar : PubMed/NCBI
|
|
7
|
Yilmaz Y, Yonal O, Deyneli O, Celikel CA,
Kalayci C and Duman DG: Effects of sitagliptin in diabetic patients
with nonalcoholic steatohepatitis. Acta Gastroenterol Belg.
75:240–244. 2012.PubMed/NCBI
|
|
8
|
Mashitani T, Noguchi R, Okura Y, Namisaki
T, Mitoro A, Ishii H, Nakatani T, Kikuchi E, Moriyasu H, Matsumoto
M, et al: Efficacy of alogliptin in preventing non-alcoholic fatty
liver disease progression in patients with type 2 diabetes. Biomed
Rep. 4:183–187. 2016. View Article : Google Scholar : PubMed/NCBI
|
|
9
|
Nonogaki K, Nozue K and Oka Y: Social
isolation affects the development of obesity and type 2 diabetes in
mice. Endocrinology. 148:4658–4666. 2007. View Article : Google Scholar : PubMed/NCBI
|
|
10
|
Haluzik MM, Lacinova Z, Dolinkova M,
Haluzikova D, Housa D, Horinek A, Vernerova Z, Kumstyrova T and
Haluzik M: Improvement of insulin sensitivity after peroxisome
proliferator-activated receptor-alpha agonist treatment is
accompanied by paradoxical increase of circulating resistin levels.
Endocrinology. 147:4517–4524. 2006. View Article : Google Scholar : PubMed/NCBI
|
|
11
|
Rinella ME, Elias MS, Smolak RR, Fu T,
Borensztajn J and Green RM: Mechanisms of hepatic steatosis in mice
fed a lipogenic methionine choline-deficient diet. J Lipid Res.
49:1068–1076. 2008. View Article : Google Scholar : PubMed/NCBI
|
|
12
|
Rozen S and Skaletsky H: Primer3 on the
WWW for general users and for biologist programmers. Methods Mol
Biol. 132:365–386. 2000.PubMed/NCBI
|
|
13
|
Raabe M, Véniant MM, Sullivan MA, Zlot CH,
Björkegren J, Nielsen LB, Wong JS, Hamilton RL and Young SG:
Analysis of the role of microsomal triglyceride transfer protein in
the liver of tissue-specific knockout mice. J Clin Invest.
103:1287–1298. 1999. View
Article : Google Scholar : PubMed/NCBI
|
|
14
|
Okumura K, Ikejima K, Kon K, Abe W,
Yamashina S, Enomoto N, Takei Y and Sato N: Exacerbation of dietary
steatohepatitis and fibrosis in obese, diabetic KK-A(y) mice.
Hepatol Res. 36:217–228. 2006. View Article : Google Scholar : PubMed/NCBI
|
|
15
|
Boettcher E, Csako G, Pucino F, Wesley R
and Loomba R: Meta-analysis: Pioglitazone improves liver histology
and fibrosis in patients with non-alcoholic steatohepatitis.
Aliment Pharmacol Ther. 35:66–75. 2012. View Article : Google Scholar : PubMed/NCBI
|
|
16
|
Gastaldelli A, Harrison S, Belfort-Aguiar
R, Hardies J, Balas B, Schenker S and Cusi K: Pioglitazone in the
treatment of NASH: The role of adiponectin. Aliment Pharmacol Ther.
32:769–775. 2010. View Article : Google Scholar : PubMed/NCBI
|
|
17
|
Kon K, Ikejima K, Hirose M, Yoshikawa M,
Enomoto N, Kitamura T, Takei Y and Sato N: Pioglitazone prevents
early-phase hepatic fibrogenesis caused by carbon tetrachloride.
Biochem Biophys Res Commun. 291:55–61. 2002. View Article : Google Scholar : PubMed/NCBI
|
|
18
|
Klein T, Fujii M, Sandel J, Shibazaki Y,
Wakamatsu K, Mark M and Yoneyama H: Linagliptin alleviates hepatic
steatosis and inflammation in a mouse model of non-alcoholic
steatohepatitis. Med Mol Morphol. 47:137–149. 2014. View Article : Google Scholar : PubMed/NCBI
|
|
19
|
Kern M, Klöting N, Niessen HG, Thomas L,
Stiller D, Mark M, Klein T and Blüher M: Linagliptin improves
insulin sensitivity and hepatic steatosis in diet-induced obesity.
PLoS One. 7:e387442012. View Article : Google Scholar : PubMed/NCBI
|
|
20
|
Aroor AR, Habibi J, Ford DA, Nistala R,
Lastra G, Manrique C, Dunham MM, Ford KD, Thyfault JP, Parks EJ, et
al: Dipeptidyl peptidase-4 inhibition ameliorates Western
diet-induced hepatic steatosis and insulin resistance through
hepatic lipid remodeling and modulation of hepatic mitochondrial
function. Diabetes. 64:1988–2001. 2015. View Article : Google Scholar : PubMed/NCBI
|
|
21
|
Orellana-Gavaldà JM, Herrero L, Malandrino
MI, Pañeda A, Sol Rodríguez-Peña M, Petry H, Asins G, Van Deventer
S, Hegardt FG and Serra D: Molecular therapy for obesity and
diabetes based on a long-term increase in hepatic fatty-acid
oxidation. Hepatology. 53:821–832. 2011. View Article : Google Scholar : PubMed/NCBI
|
|
22
|
Ben-Shlomo S, Zvibel I, Shnell M, Shlomai
A, Chepurko E, Halpern Z, Barzilai N, Oren R and Fishman S:
Glucagon-like peptide-1 reduces hepatic lipogenesis via activation
of AMP-activated protein kinase. J Hepatol. 54:1214–1223. 2011.
View Article : Google Scholar : PubMed/NCBI
|
|
23
|
Steinberg GR and Kemp BE: AMPK in health
and disease. Physiol Rev. 89:1025–1078. 2009. View Article : Google Scholar : PubMed/NCBI
|
|
24
|
Kim JH, Kang SI, Shin HS, Yoon SA, Kang
SW, Ko HC and Kim SJ: Sasa quelpaertensis and p-coumaric acid
attenuate oleic acid-induced lipid accumulation in HepG2 cells.
Biosci Biotechnol Biochem. 77:1595–1598. 2013. View Article : Google Scholar : PubMed/NCBI
|
|
25
|
Dahlhoff C, Worsch S, Sailer M, Hummel BA,
Fiamoncini J, Uebel K, Obeid R, Scherling C, Geisel J, Bader BL and
Daniel H: Methyl-donor supplementation in obese mice prevents the
progression of NAFLD, activates AMPK and decreases acyl-carnitine
levels. Mol Metab. 3:565–580. 2014. View Article : Google Scholar : PubMed/NCBI
|