Introduction
Refractive errors are the result of an incorrect
pairing between the axial length of an eye and its refractive
power. Optical defocus inflicted to the retina results in
refractive errors. Indeed, the use of negative lenses triggers
hyperopic defocus and consequent axial myopia, while positive
lenses on myopia defocus result in axial hyperopia (1–3).
Visual signals are used to develop an emmetropization mechanism,
which controls the axial elongation rate in order to locate the
retina close to the focal plane (4). An emmetropic eye is one in which
distant objects' images are sharply focused on the photoreceptors
as a result of the perfect match between optical strengthand axial
length. In contrast, a myopic eye has an axial length longer than
the focal plane, resulting in an image focused in front of the
retina, whilst an axial length shorter than the focal plane is
typical of a hyperopic eye, in which the image is focused behind
the retina. Hyperopia or myopia development is detected by the
retina, triggering a signaling cascade to produce biochemical
modifications via the choroid and retinal pigment epithelium
(5).
Certain biomarkers could be characterized by
important protein modifications such as folding change and
post-translational modifications (PTM). Organisms' complexity is
mainly due to PTM, mostly considered as the addition of a
functional group to one or more amino acids, or the proteolytic
cleavage of one or more groups (6). These modifications can result in
several changes in protein properties (7,8). The
most common PTM types are glycosylation and phosphorylation, both
resulting in protein function modifications. During the life cycle
of the proteins, one in every three is phosphorylated (9). Phosphorylation is characterized by
enzyme activity and protein signaling modifications, while
glycosylation can modify regulatory functions and cell-cell
identification/signaling (10).
However, these important PTMs are rarely studied in myopia.
Myopia development was extensively studied from
different perspectives (1,2,4–11).
Myopia recovery is also considered relevant in understanding myopia
and indeed several studies were performed to evaluate this aspect.
For example, studies describing sclera protein profiles during
development of myopia and recovery are already available (12,13).
Recovery from negative lens induced myopia was analyzed through the
evaluation of axial elongation (14). However, as far as we know, retinal
proteomics during early recovery from lens-induced myopia has not
yet been reported. Therefore, in the present study we examined and
mapped the proteins involved in early recovery from lens-induced
myopia in chickens using two-dimensional fluorescence difference
gel electrophoresis (2D-DIGE) and phosphoproteins using Pro-Q
Diamond staining 2D-difference gel images. Our results underlined
the validity of our approach on finding proteins which have never
been previously detected and described in the retina, which could
be considered as potential biomarkers in the adjustment of myopia,
suggesting potential strategies to counteract it.
Materials and methods
Animals
White Leghorn chicks (Gallus gallus
domesticus), hatched in an incubator, were raised in
temperature-controlled brooders with water and food freely
available under a 12 h light/12 h dark cycle (7:00 a.m.-7:00 p.m.)
from the age of one day. Animal care and use were in accordance
with the ARVO Statement for the Use of Animals in Ophthalmic and
Vision Research. The experimental procedure and protocol were
approved by the animal ethics approval committee of the Hong Kong
Polytechnic University (Hong Kong, China).
Lenses and ocular measurements
All chicks were subjected to the same lens treatment
and recovery conditions as described below. Initially, 34 chicks
were used to monitor biometric data changes. At the end of the
recovery period, four chicks were used to perform 2D-DIGE
experiments, while six of them were used for Pro-Q Diamond staining
2D gel electrophoresis. Three-day old chickens wore a-10D lens in
front of their right eyes and a plano lens in front of their left
eyes for 7 days. These lenses were mounted on Velcro rings and
glued to the feathers around the eyes. Lenses were cleaned twice
every day. At the end of the 7-day period, lenses were removed for
24 h to allow the recovery of the right eyes. Ocular dimensions and
refractive errors were measured before and after 7 days of lens
wear, and again after 24 h recovery. Axial length is defined as the
distance from the front of the cornea to the front of the retina.
Ocular parameters were examined by a high-frequency A-scan
ultrasound system (Manually Controlled Pulser-Receiver) with a 30
MHz transducer (Immersion Transducers; both Olympus Scientific
Solutions Americas, Waltham, MA, USA) sampled at a rate of 100 MHz,
while refractive errors were measured using a streak retinoscope
(KJ6A; KangJie Co. Ltd, Jiangyan, China) as previously described
(15).
Sample preparation
Once the measurements were completed, the retinal
tissue was collected as previously described and frozen in liquid
nitrogen (16). The frozen retinal
tissue was ground in liquid nitrogen using a Teflon freezer mill
(Micro-dismembrator; Braun Biotech, Melsungen, Germany) until a
fine powder was obtained, which was solubilized in 300 µl DIGE
compatible lysis buffer containing 7 M urea, 2 M thiourea, 40 mM
tris, 2% CHAPS, 1% ASB14 and 1 tablet of Complete Mini protease
(buffer for 2D-DIGE samples) or phosphatase (buffer for Pro-Q
Diamond staining 2D gel electrophoresis samples) inhibitor cocktail
in 10 ml buffer (16). After
centrifugation, only the supernatant was collected. The solution
was then concentrated by cold (−20°C) acetone precipitation over 4
h, followed by centrifugation at 16,000 g at 4°C for 15 min. The
pellet obtained was resuspended in lysis buffer and the protein
concentration was determined using a 2-D Quant kit (GE Healthcare
Life Sciences, Uppsala, Sweden).
2D-DIGE
Fifty micrograms of the minus lens sample and
control sample were labelled with 400 pmol dye (GE Healthcare Life
Sciences) on ice for 30 min in the dark. An internal standard (a
pool made by 50 µg retinal proteins from each sample) was labelled
with Cy2 (Table I). All the
procedures were performed in the dark, according to the protocols
previously described (17–19). Isoelectric focusing (IEF) was
achieved using linear immobilized pH gradient strips (IPG strips at
a pH between 5 and 8 and 17 cm size; Bio-Rad Laboratories, San
Diego, CA, USA). IPG strips were rehydrated at 50 V using Protean
IEF cell (Bio-Rad Laboratories) for 12 h under a temperature of
20°C to increase protein uptake. Next, protein samples underwent
IEF at 30 k voltage/h (Vh). Next, strips were incubated in
equilibration buffer (6 M urea, 30% glycerol, 50 mM tris and 2%
SDS, containing 0.5% DTT) for 10 min and they were subsequently
incubated in 2% iodoacetamide for other 10 min. Second dimension
electrophoresis was then performed using 12% polyacrylamide gels
between low fluorescence Pyrex glass plates in Protean II XL
(Bio-Rad Laboratories) tank. Image analysis was performed using
DeCyder Differential Analysis Software (DeCyder; GE Healthcare Life
Sciences). The differential in-gel analysis mode was used for spot
detection and quantification, and images from different gels were
combined using the biological variance analysis (BVA) mode. Protein
spot matching was manually confirmed for all the gels. Gels were
fixed and stained with MS compatible silver stain to visualize MS
spots as previously described (17) after gel analysis. The details were
the following: fixation (10% acetic acid, 40% methanol, 50% double
distilled water) overnight, sensitization (0.2% sodium thiosulfate,
30% methanol, 70% double distilled water) 30 min, washing (double
distilled water) 5 min × 3 times, silver impregnation (0.25% silver
nitrate, 100% double distilled water) 20 min, washing (double
distilled water) 1 min × 2 times, developing (2.5% sodium
carbonate, 100% double distilled water, 0.04% formaldehyde) until
each protein point clearly appeared, stopping (5% acetic acid, 95%
double distilled water) at least for 15 min. The differential
protein expression was taken into consideration, if present, in all
samples and each should show the same up- or downregulation.
 | Table I.CyDyes minimal labelling experiment
design of retinal samples in 2D-DIGE. |
Table I.
CyDyes minimal labelling experiment
design of retinal samples in 2D-DIGE.
| Gel no. | Cy2 (pool internal
control) | Cy3
(treated/control) | Cy5
(treated/control) |
|---|
| Gel 1 | Pool of all 8 eyes
(6.25 µg from both eyes of each animal, total 50 µg) | No. 1 treated (50
µg) | No. 1 control (50
µg) |
| Gel 2 | Pool of all 8 eyes
(6.25 µg from both eyes of each animal, total 50 µg) | No. 2 control (50
µg) | No. 2 treated (50
µg) |
| Gel 3 | Pool of all 8 eyes
(6.25 µg from both eyes of each animal, total 50 µg) | No. 3 treated (50
µg) | No. 3 control (50
µg) |
| Gel 4 | Pool of all 8 eyes
(6.25 µg from both eyes of each animal, total 50 µg) | No. 4 control (50
µg) | No. 4 treated (50
µg) |
Pro-Q Diamond staining 2D gel
electrophoresis
One hundred microgram chick retinas samples were
mixed with an equal volume of buffer containing 7 M urea, 2 M
thiourea, 2% CHAPS, 1% ASB14, 2% DTT, 0.4% Biolytes and a trace
amount of bromophenol blue and left on ice for 10 min. IPG strips
of 11 cm, at a pH 4–7 were passively rehydrated with the samples in
200 µl rehydration buffer for 12 h. Next, IEF was performed at 100
V for 2 h, 500 V for 1 h, 1,000 V for 1 h, 4,000 V for 2 h and
8,000 V for 5 h under linear voltage ramp using a BioRad PROTEAN
IEF Cell. Subsequently, IPG strips were incubated in equilibration
buffer I (6 M urea, 30% glycerol, 50 mM tris, 2% SDS, 0.5% DTT) for
10 min, and then in equilibration buffer II (6 M urea, 30%
glycerol, 50 mM tris, 2% SDS, 2% iodoacetamide) for 10 min. The
strips were loaded onto 12% homogenous SDS PAGE gels of 1.5 mm
thickness and sealed with 0.5% agarose. Protein separation in the
second dimension was performed at 20 mA per gel using an Ettan DALT
(Bio-Rad Laboratories, San Diego, CA, USA).
Gels were stained with Pro-Q Diamond
(Pro-Q® Diamond Phosphoprotein Gel Destaining Solution;
Invitrogen; Thermo Fisher Scientific, Inc., Waltham, MA, USA) to
detect phosphoproteins and imaged using 532 nm excitation
wavelength and 560 nm band pass filter using Typhoon 9400 Variable
Mode Imager (Amersham Biosciences; GE Healthcare Life Sciences).
The image analysis was performed by Image Master Platinum, version
5 (Bioinformatics, Uppsala, Sweden). Differential protein
expression was taken into consideration if present in at least 5
samples and they should show the same up- or downregulation. Silver
was used to visualize the protein spots for mass spectrometry.
LC-MS/MS
The differentially expressed protein spots were
excised and processed as previously described (17–19).
Extracts were dried by Speedvac Savant (Thermo Fisher Scientific,
Inc.) and dissolved in 20 µl 0.1% formic acid. Peptides were
separated using an Ultimate 3000 nano liquid chromatography system
(LC Packings; Dionex, San Francisco, CA, USA) and analyzed by HCT
Ultra ion trap mass spectrometer (Bruker Daltonics, Ettlingen,
Germany) equipped with an online nanospray source. Samples were
injected onto a reversed-phase pre-column (300 µm i.d.; 5 mm; C18
PepMap; LC Packings; Dionex) and then eluted and separated for 10
min on nano reversed phase column (75 µm i.d.; 150 mm; C18 PepMap;
LC Packings; Dionex) with linear gradient from 96% mobile phase
A/4% mobile phase B to 50% mobile phase A/50% mobile phase B.
Mobile phase A contained 0.1% (v/v) formic acid in water and mobile
phase B contained 0.08% formic acid in water-ACN (20:80, v/v%). The
column was connected to an electrospray emitter, distal coating, 20
mm i.d. with 10 mm opening (New Objective, Woburn, MA, USA).
Peptides were detected in the positive ion mode and fragmented by
collision-induced dissociation using helium as the collision gas.
The voltage applied to the capillary cap was −1,500 V and capillary
temperature was set at 150°C. Precursor selection was set at
300–1,500 mass-to-charge ratio (m/z). Two most abundant precursor
ions were selected for MS/MS. Three scans were averaged to obtain
an MS/MS mass spectrum. MS and MS/MS data were searched using
NCBInr protein database (NCBIni_20081017) by MASCOT search engine,
according to the following settings: trypsin was designated as the
digestion enzyme and one missed cleavage was allowed.
Carbamidomethylation of cysteines was set as fixed modification and
oxidation of methionine residues as variable modification. The mass
tolerances were 1.2 Da for MS and 0.6 Da for MS/MS. Proteins were
considered identified when at least two peptides met the confident
threshold of 0.05.
Statistical analysis
2D-DIGE protein spots with an expression change
>1.2-fold and a value of P<0.05 by Student's paired t-test,
were defined as differentially expressed proteins and considered
statistically significant (20,21).
Pro-Q Diamond staining 2D-difference gel images protein spots with
an expression change >1.8-fold and a value of P<0.05 by
Student's Paired t-test were defined as differentially expressed
proteins and considered statistically significant. Results were
considered statistically significant when confirmed in four
(2D-DIGE) or five (Pro-Q Diamond staining) separated gels.
Furthermore, a visual check on the significant spots was performed
by two separated experts to confirm that they were real protein
spots, instead of stripes or artifacts.
Results
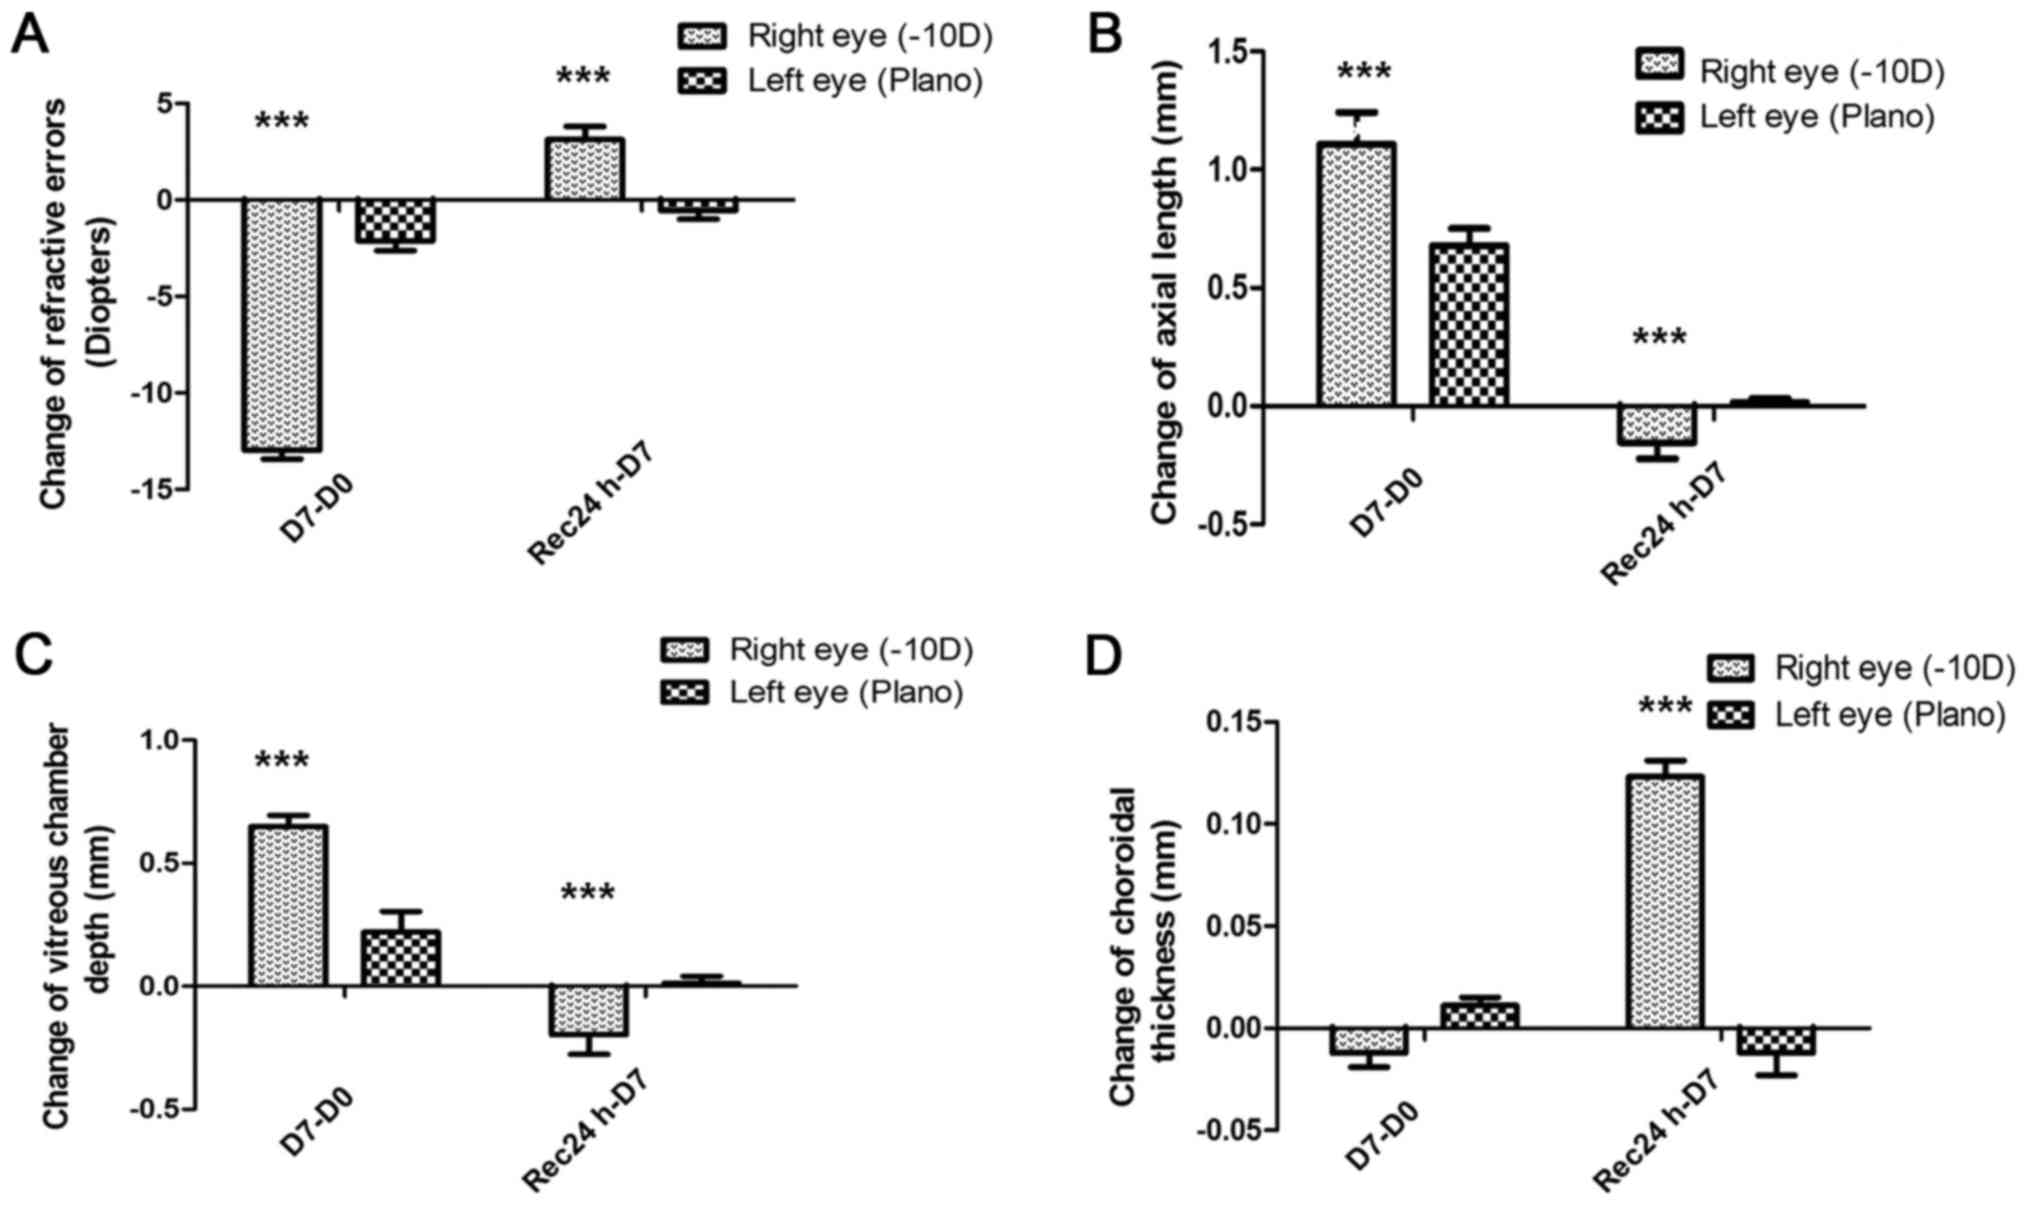
Refractive and axial changes
Refractive values and axial ocular dimensions are
shown in Fig. 1. After 7 days of
lens wear, the treated eyes partially compensated to the presence
of the lens, with the minus lens-treated eye becoming myopic
(treated vs. control: −9.44±0.54 D vs. 1.48±0.50 D, P<0.001,
n=34, Fig. 1A). After 24 h
recovery, less myopia was observed in the treated eyes (treated vs.
control: −6.31±0.82 D vs. 0.94±0.39 D, P<0.001, n=34, Fig. 1A). The axial length of the minus
lens-treated eye was significantly longer than that of the control
eye (treated vs. control: 1.32±0.22 mm vs. 0.70±0.23 mm,
P<0.001, n=34, Fig. 1B) due to
the vitreous chamber enlargement (Fig.
1C). The choroid was significantly thinner in the minus
lens-treated eyes than in the control eyes (Fig. 1D). During the recovery time, axial
length and vitreous chamber length partly recovered their original
values, while the choroid was significantly thicker than the
choroid in the control eyes (Fig.
1B-D).
Differential protein expression
between myopia recovery retina and control retina by 2D-DIGE
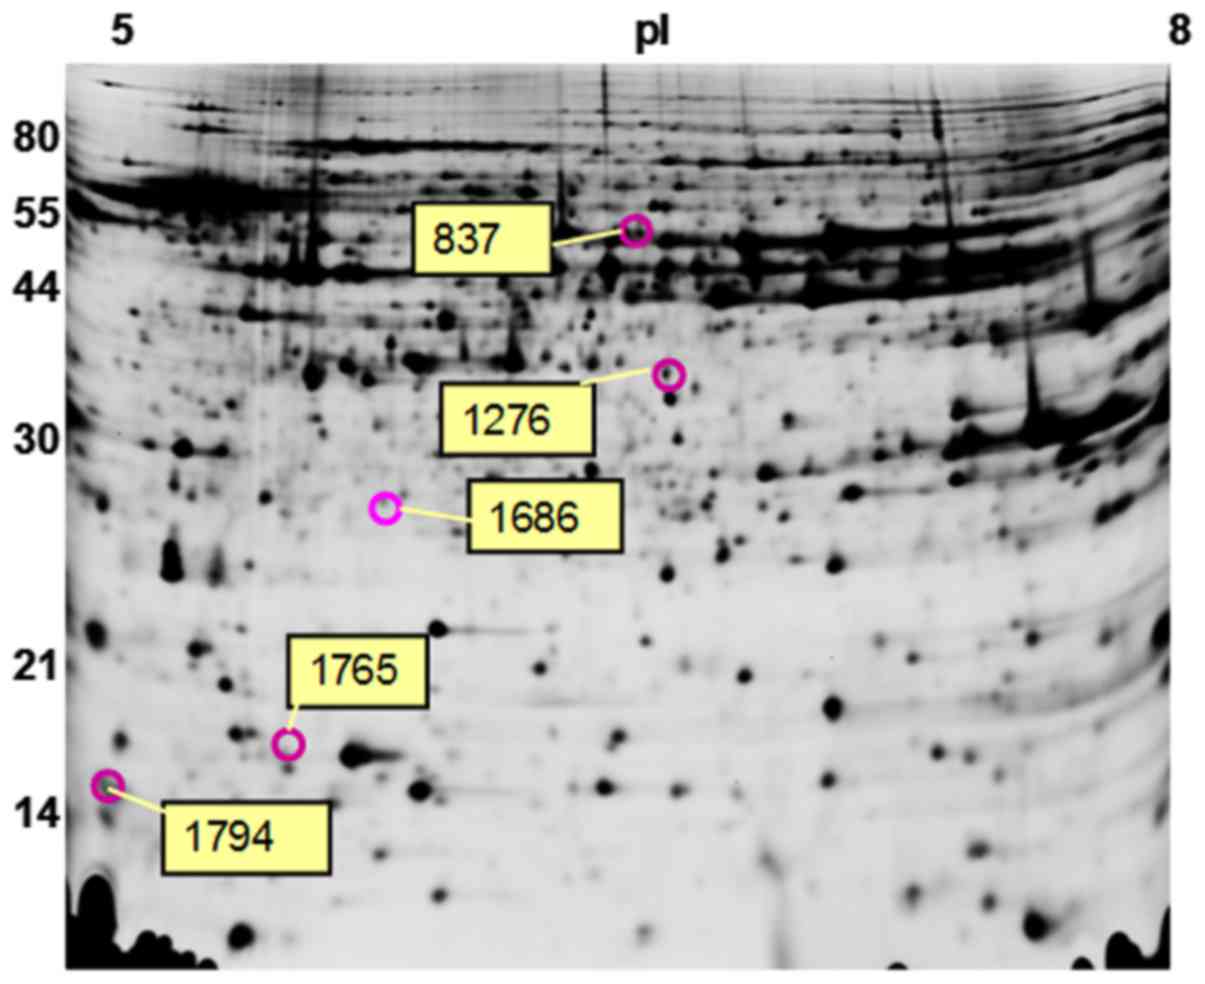
After gel analysis, 1,864±142 protein spots were
resolved and compared on the 2D-DIGE gels (Fig. 2). Five spots differed between the
right myopia recovery group and the left control group. Five spots
showed upregulation in myopic recovery retinas, and three of them
were successfully identified by mass spectrometry: Ras related
protein Rab-11B, S-antigen retina and pineal gland (arrestin) and
26S proteasome non-ATPase regulatory subunit 14 (PSMD14) (Table II). The other two proteins were
not identified because of their very low concentration in chick
retina.
| Table II.Differential protein expression
between myopia early recovery retina and control retina in
2D-DIGE. |
Table II.
Differential protein expression
between myopia early recovery retina and control retina in
2D-DIGE.
| Spot no. | IPI no. | Mascot protein
name | Mowse score | Sequence coverage
(%) | Mascot Pi | Mascot Mw
(kDA) | Peptides no. | Fold
difference |
|---|
|
837 | 596741 | Arrestin | 81.45 | 5.58 | 6.33 | 46.64 | 4 | 1.20 |
| 1686 | 573563 | Rab-11B | 192.46 | 33.94 | 5.57 | 46.64 | 8 | 1.24 |
| 1276 | 604055 | PSMD14 | 225.45 | 16.45 | 6.00 | 34.72 | 8 | 1.23 |
Differential protein expression
between myopia recovery retina and control retina by Pro-Q Diamond
staining 2D gel electrophoresis
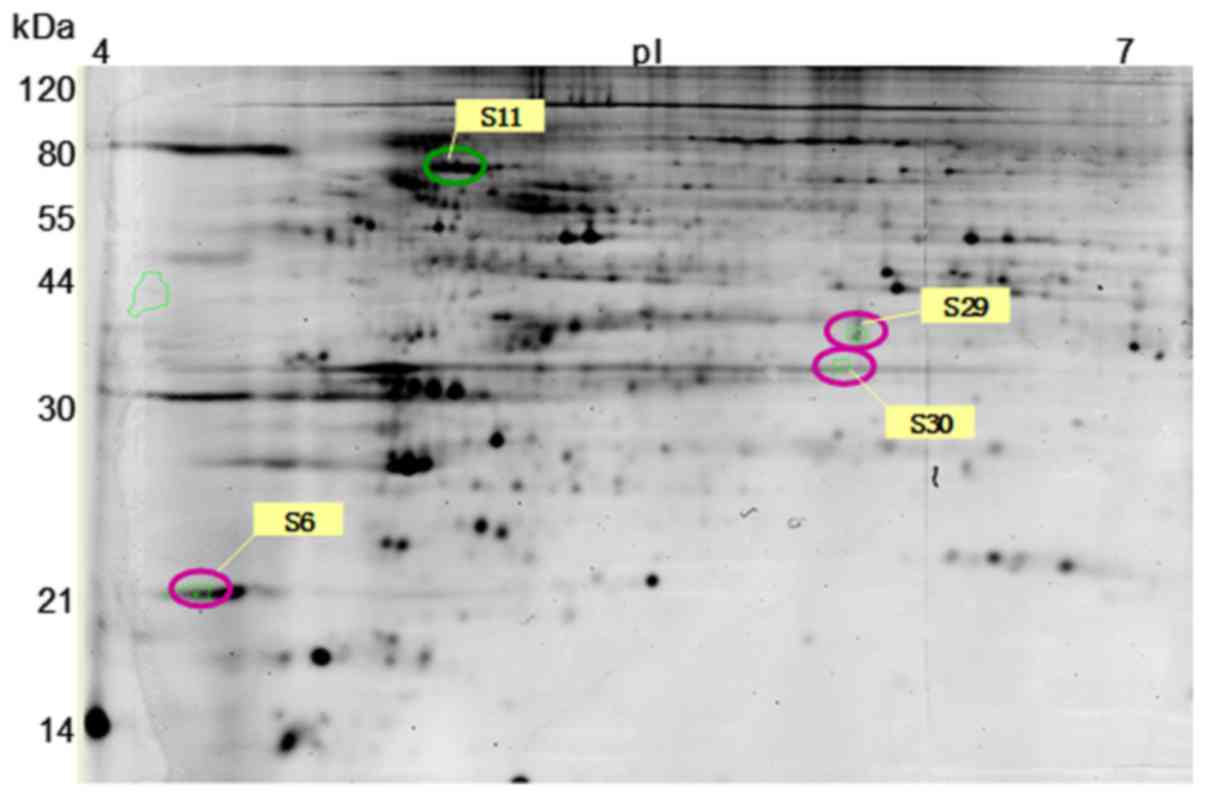
After gel analysis, 4 spots showed a 1.8-fold
difference between the two groups. One spot was downregulated in
the myopia recovery group and 3 were upregulated (Fig. 3).
Of these 4 spots of interest, 3 were successfully
identified by mass spectrometry: β-tubulin, peroxiredoxin 4 and
ubiquitin carboxyl-terminal hydrolaseL1 (UCHL1) (Table III). The remaining protein was
not identified because of its very low concentration in chick
retina.
| Table III.Differential protein expression
between myopia early recovery retina and control retina in Pro-Q
Diamond staining 2D gel electrophoresis. |
Table III.
Differential protein expression
between myopia early recovery retina and control retina in Pro-Q
Diamond staining 2D gel electrophoresis.
| Spot no. | NCBI GI no. | Mascot protein
name | Mowse score | Sequence coverage
(%) | Mascot Pi | Mascot Mw
(kDA) | Peptides no. | Fold
difference |
|---|
| s11 | 118766754 | β-tubulin | 332.729 | 18.01 | 5.62 | 41.48 | 12 | −1.91 |
| s29 | 118084001 | Peroxiredoxin
4 | 7.72 | 13.21 | 6.28 | 29.62 | 3 | 1.96 |
| s30 | 115391986 | UCHL1 | 88.54 | 9.40 | 5.81 | 25.21 | 2 | 1.91 |
Discussion
Our results indicated that short-term myopia was
reversible after minus lens removal, as shown by the axial vitreous
chamber length, although choroidal thickness changed in an opposite
direction to axial length. These results were in accordance with
previous reports (22–27).
DIGE has introduced an internal control, and has a
relatively high resolution. The internal standard paradigm in DIGE
allows a precise comparison within and across treatment groups,
thus displaying new proteins despite their quantity alterations as
a consequence of the comparison (28). Samples are labelled using different
fluorescent dyes, mixed and resolved on a single 2D gel. The
fluorescence-based technique has also an advantage of a broad
linear dynamic range of 104, allowing the detection of
slight changes in protein expression as low as 10%, with a
confidence level of 95% (29–31).
Previous studies revealed that Rab family proteins
possess a regulatory role in membrane transport, which is essential
for developmental processes (32,33).
Indeed, Rab11 is essential for Drosophila eye development and
embryogenesis, since Rab11 endosomes control vesicle exocytosis and
membrane growth in the cellularization process (34,35).
Rab11 family-interacting protein 4 (Rab11-FIP4) is mainly expressed
in neural tissues, playing a role in zebra fish and mouse retinal
development (36,37). Rab11 is also important in the
transport of other rhabdomeric proteins, such as transient receptor
potential (TRP) channel, which is a light-activated Ca2+
channel working in phototransduction (38). From the above reports, we might
conclude that Rab11 is required for the formation of endosomal
multivesicular bodies in rhabdomeres, and might have a role in the
traffic of rhabdomeric membranes.
Arrestin inhibits the activated phototransduction
cascade, although the inhibitory effect mechanism is still not
well-known (39). An accepted
hypothesis is that arrestin binds to the phosphorylated and
photoexcited rhodopsin, thus quenching the light-dependent
cGMP-phosphodiesterase activation, or it may directly act on
inhibiting cGMP-phosphodiesterase activation (40,41).
Additionally, arrestin exerts an inhibitory activity on rhodopsin
phosphatase (42). Our results
showed that arrestin was upregulated in the myopic recovery
retinas, suggesting that it might play a role in desensitizing the
photoactivated transduction cascade and it may be consequently
involved in the occurrence and recovery of myopia.
PSMD14, a 2.5-MDa protein, exerts an important role
in the ubiquitin proteasome system. Indeed, it removes impaired
proteins, as well as those no longer required (43–45).
Although, humans possess several non-ATPase subunits, few of them
have been cloned and sequenced, but their roles remain unclear.
However, the S14 unit is a NIN1 homologue, which is a yeast gene
involved in the cell cycle, encoding for a protein necessary for
both G1/S and G2/M transitions (46). According to our results, PSMD14 was
upregulated in the recovering myopic retinas, suggesting that in
the process of myopia development and recovery, tissue metabolism
was active, as a remarkable amount of metabolic waste was produced
and this protein was acting as a scavenger.
The proteins whose expression was modified, belonged
to the categories ‘metabolic’ and ‘protein degradation and
apoptosis’, suggesting that they might have several different roles
in retinal signal processing during the development of myopia and
its recovery after lens removal. Although 2D-DIGE studies mostly
focused on analyzing native retina protein profiles, PTM results
were also crucial in determining several protein functions, such as
cell differentiation, cell cycle control, and signal transduction
(47,48). More than 200 different PTM types
have been described, but not all of them are relevant in the
biological process regulation: Protein phosphorylation is one of
the most studied PTM (49).
Tubulins have been shown to exert significant roles
in eye development. Tubulin α-1 chain may impart a ‘GO/GROW’ signal
for myopia in chicken retinas (50). In contrast, tubulin downregulation,
such as tubulin α-2 and tubulin α-6, may correspond to a decreased
cell and internal organelle movement during sclera remodeling
(3). Furthermore, tubulin α-3
seems to be involved in keratoconus, a human corneal
non-inflammatory disease, resulting in myopia and astigmatism and
it is considered as a neuromarker due to its presence in developing
retina (51–53). Our results revealed a decrease in
phosphorylation activity of β-tubulin in the retina of myopia
recovery eyes, suggesting a role of the retina in the decreased
scleral remodeling activity in myopia recovery group.
Peroxiredoxin 4 is a cytoplasmic or organellar
anti-oxidative enzyme involved in intracellular redox signaling and
gene transcription (54,55). Guinea pigs’ sclera proteomic
analysis showed that peroxiredoxin 4 was decreased in the monocular
deprivation eyes (3). Tree shrew
sclera proteomic study also found a decrease in peroxiredoxin 4
levels during lens-induced myopia (13). In the present study, peroxiredoxin
4 phosphorylation activity increased in the myopia recovery eye,
suggesting the presence of many oxidation products. Since
peroxiredoxin 4 decreases oxidative stress through hydrogen
peroxide reduction in a thiol-dependent catalytic cycle, the
increase of this protein might suggest an increased protective
effect (56).
UCHL1 is considered a neuron-specific protein
(57). A recent report
demonstrated that UCHL1 silencing resulted in a reduction of both
cell proliferation and migration in human retinal endothelial cells
from human corpses (58). Since
UCHL1 is a deubiquitinating enzyme, their results suggest that its
silencing may inhibit neovascularization, thus indicating UCHL1
involvement in proliferation, migration and neovascularization
within the retina. Although they conclude their work suggesting a
role of UCHL1 in neovascular eye diseases, our results showing an
UCHL1 increase in the retina of a myopia recovering chick eye might
indicate its potential role in regulating retinal rearrangement in
the recovery eye.
Although a recent study demonstrated the potential
involvement of oxidative stress and lipid metabolism in ocular eye
growth (59), no differentially
expressed proteins related to these pathways were found in the
current results. Apolipoprotein A1 (ApoA1) is suggested to act as a
‘STOP’ signal in the myopia development (50). ApoA1 also acts as a retinoic
acid-binding protein secreted by the choroid and sclera during eye
growth (60). However, we did not
find any ApoA1 upregulation in the recovering myopic retina. The
underlying reason could be that different ocular tissues have been
studied and different techniques have been employed. In addition,
our study mainly focused on the expression of soluble proteins
within the pH 4–7 range (in Pro-Q Diamond phosphoprotein staining
2D gel electrophoresis) and the pH 5–8 range (in 2D-DIGE), in which
only part of the retinal proteins can be resolved. This is a very
different approach than the ones used in the two cited studies.
Moreover, Yu et al (59)
studied protein regulation in the vitreous instead of in the retina
as was done in our work. Hence, the entire retinal proteome in this
study could not be visualized. Furthermore, during early active
growth, great inter-animal variations in retinal proteins could be
present. In order to decrease the inter-animal variations, we used
both eyes in each chick and we only chose the differentially
expressed proteins detected in all chicks and in the same change
direction. Therefore, this study did not describe all the
differences in retinal proteins during the myopia recovery process
and purposely excluded those proteins that failed to repeat in all
chicks. Although this method can minimize false positive results,
some potentially important proteins such as ApoA1 can be missed. On
the other hand, in this study the control eye is not a myopic eye
but a paired ‘normal’ eye. As a result, some of the proteins which
increased (or decreased) during myopia process but decreased (or
increased) during the myopia recovery process are missed. The
initial protein increase (or decrease) can be partly counteracted
by the following protein decrease (or increase), thus, the total
change is very small and might not be detected. Our study firstly
focused on those most significant and repeatable differences in
proteins not only in their abundance but also their PTMs in the
myopic recovery retina. Although the actual number of proteins that
were regulated was likely to be under-estimated in this study, the
differentially expressed proteins reported are helpful for
generating hypotheses that can unravel the biochemical mechanisms
implicated in myopia early recovery.
In our present study, we did not perform
confirmation of the proteomics results by conventional western blot
or gene expression because of the relatively low fold changes of
differentially expressed proteins we found. Poorer consistency in
quantification and limited antibodies for chicks are two typical
technical constrains for confirming MS data, which is more robust,
accurate, reproducible and achieving low limits of detection
(61). As regard gene expression,
more recent studies on microarray and RNA sequencing have indicated
that mRNA levels may not be accurate as surrogates for
corresponding protein levels as mRNA levels do not usually predict
the corresponding protein levels (62–64).
Hannis weighs PCR amplicons using MS and obtained accurate protein
results to unambiguously determine the base composition of each
amplicon, and not the other way around, that is, using PCR to
confirm MS results (65). Hence,
our further direction is trying to apply multiple reactions
monitoring (MRM) MS as an alternative approach to conventional
western blot analysis. This targeted approach was reported as a
next-generation platform overcoming many of the limitations of
western blotting, providing new prospects for protein analysis
(20). Once the setup is
established, we may run MS-based validation on protein level.
Overall, our results suggested that retinal
proteomics and its related characterization could be useful in the
discovery of biomarkers. The observed differences in protein
expression between groups revealed proteins that are potentially
involved in myopia early recovery, which might be important in
developing strategies to counteract myopia.
Acknowledgements
Not applicable.
Funding
The present study was supported by The Hong Kong
Polytechnic University (grant nos. GUA32, GYK89, RGC-GRF-PolyU
151051/17M, 151033/15M, Strategic Area of Importance-1-ZE1A, PolyU
Research Fund GYBBU and GYBQU) and the Henry G Leong Professorship
in Elderly Vision Health.
Availability of data and materials
All data generated or analyzed during this study are
included in this published article.
Authors' contributions
YYZ wrote the manuscript and performed the
experiments. RKMC supervised the entire work and critically revised
the manuscript, analyzed and interpreted the data and had final
approval of the manuscript. JCW and BZ collected the results and
drafted the manuscript. KKL analyzed and interpreted the results
and supervised the entire work. TCL analyzed and interpreted the
results and critically revised the manuscript. QL and CHT designed
the experiments and approved the final version of the
manuscript.
Ethics approval and consent to
participate
The experimental procedure and protocols were
approved by the Animal Ethics Approval Committee of the Hong Kong
Polytechnic University.
Consent for publication
Not applicable.
Competing interests
The authors declare that they have no competing
interests.
References
|
1
|
Norton TT, Amedo AO and Siegwart JT Jr:
The effect of age on compensation for a negative lens and recovery
from lens-induced myopia in tree shrews (Tupaia glis
belangeri). Vision Res. 50:564–576. 2010. View Article : Google Scholar : PubMed/NCBI
|
|
2
|
Smith EL III, Hung LF, Arumugam B and
Huang J: Negative lens-induced myopia in infant monkeys: Effects of
high ambient lighting. Invest Ophthalmol Vis Sci. 54:2959–2969.
2013. View Article : Google Scholar : PubMed/NCBI
|
|
3
|
Zhou X, Ye J, Willcox MD, Xie R, Jiang L,
Lu R, Shi J, Bai Y and Qu J: Changes in protein profiles of guinea
pig sclera during development of form deprivation myopia and
recovery. Mol Vis. 16:2163–2174. 2010.PubMed/NCBI
|
|
4
|
Shen W and Sivak JG: Eyes of a lower
vertebrate are susceptible to the visual environment. Invest
Ophthalmol Vis Sci. 48:4829–4837. 2007. View Article : Google Scholar : PubMed/NCBI
|
|
5
|
Wallman J and Winawer J: Homeostasis of
eye growth and the question of myopia. Neuron. 43:447–468. 2004.
View Article : Google Scholar : PubMed/NCBI
|
|
6
|
Zee BM and Garcia BA: Discovery of lysine
post-translational modifications through mass spectrometric
detection. Essays Biochem. 52:147–163. 2012. View Article : Google Scholar : PubMed/NCBI
|
|
7
|
Eichler J and Maupin-Furlow J:
Post-translation modification in Archaea: Lessons from Haloferax
volcanii and other haloarchaea. FEMS Microbiol Rev. 37:583–606.
2013. View Article : Google Scholar : PubMed/NCBI
|
|
8
|
Mann M and Jensen ON: Proteomic analysis
of post-translational modifications. Nat Biotechnol. 21:255–261.
2003. View Article : Google Scholar : PubMed/NCBI
|
|
9
|
Petrov D, Margreitter C, Grandits M,
Oostenbrink C and Zagrovic B: A systematic framework for molecular
dynamics simulations of protein post-translational modifications.
PLoS Comput Biol. 9:e10031542013. View Article : Google Scholar : PubMed/NCBI
|
|
10
|
Zolnierowicz S and Bollen M: Protein
phosphorylation and protein phosphatases. De Panne, Belgium,
September 19–24, 1999. EMBO J. 19:483–488. 2000. View Article : Google Scholar : PubMed/NCBI
|
|
11
|
Zhu X, McBrien NA, Smith EL III, Troilo D
and Wallman J: Eyes in various species can shorten to compensate
for myopic defocus. Invest Ophthalmol Vis Sci. 54:2634–2644. 2013.
View Article : Google Scholar : PubMed/NCBI
|
|
12
|
Frost MR and Norton TT: Differential
protein expression in tree shrew sclera during development of
lens-induced myopia and recovery. Mol Vis. 13:1580–1588.
2007.PubMed/NCBI
|
|
13
|
Frost MR and Norton TT: Alterations in
protein expression in tree shrew sclera during development of
lens-induced myopia and recovery. Invest Ophthalmol Vis Sci.
53:322–336. 2012. View Article : Google Scholar : PubMed/NCBI
|
|
14
|
Amedo AO and Norton TT: Visual guidance of
recovery from lens-induced myopia in tree shrews (Tupaia glis
belangeri). Ophthalmic Physiol Opt. 32:89–99. 2012. View Article : Google Scholar : PubMed/NCBI
|
|
15
|
Wang JC, Chun RK, Zhou YY, Zuo B, Li KK,
Liu Q and To CH: Both the central and peripheral retina contribute
to myopia development in chicks. Ophthalmic Physiol Opt.
35:652–662. 2015. View Article : Google Scholar : PubMed/NCBI
|
|
16
|
Chun RK, Shan SW, Lam TC, Wong CL, Li KK,
Do CW and To CH: Cyclic adenosine monophosphate activates retinal
apolipoprotein A1 expression and inhibits myopic eye growth. Invest
Ophthalmol Vis Sci. 56:8151–8157. 2015. View Article : Google Scholar : PubMed/NCBI
|
|
17
|
Lam TC, Li KK, Lo SC, Guggenheim JA and To
CH: A chick retinal proteome database and differential retinal
protein expressions during early ocular development. J Proteome
Res. 5:771–784. 2006. View Article : Google Scholar : PubMed/NCBI
|
|
18
|
Lam TC, Li KK, Lo SC, Guggenheim JA and To
CH: Application of fluorescence difference gel electrophoresis
technology in searching for protein biomarkers in chick myopia. J
Proteome Res. 6:4135–4149. 2007. View Article : Google Scholar : PubMed/NCBI
|
|
19
|
Wu Y, Liu Q, To C, Li K, Chun R, Yu J and
Lam T: Differential retinal protein expressions during form
deprivation myopia in albino guinea pigs. Curr Proteomics.
11:37–47. 2014. View Article : Google Scholar
|
|
20
|
Liebler DC and Zimmerman LJ: Targeted
quantitation of proteins by mass spectrometry. Biochemistry.
52:3797–3806. 2013. View Article : Google Scholar : PubMed/NCBI
|
|
21
|
Tu C, Beharry KD, Shen X, Li J, Wang L,
Aranda JV and Qu J: Proteomic profiling of the retinas in a
neonatal rat model of oxygen-induced retinopathy with a
reproducible ion-current-based MS1 approach. J Proteome Res.
14:2109–2120. 2015. View Article : Google Scholar : PubMed/NCBI
|
|
22
|
Hung LF, Wallman J and Smith EL III:
Vision-dependent changes in the choroidal thickness of macaque
monkeys. Invest Ophthalmol Vis Sci. 41:1259–1269. 2000.PubMed/NCBI
|
|
23
|
Liang H, Crewther SG, Crewther DP and
Junghans BM: Structural and elemental evidence for edema in the
retina, retinal pigment epithelium, and choroid during recovery
from experimentally induced myopia. Invest Ophthalmol Vis Sci.
45:2463–2474. 2004. View Article : Google Scholar : PubMed/NCBI
|
|
24
|
Lu F, Zhou X, Jiang L, Fu Y, Lai X, Xie R
and Qu J: Axial myopia induced by hyperopic defocus in guinea pigs:
A detailed assessment on susceptibility and recovery. Exp Eye Res.
89:101–108. 2009. View Article : Google Scholar : PubMed/NCBI
|
|
25
|
Nickla DL, Zhu X and Wallman J: Effects of
muscarinic agents on chick choroids in intact eyes and eyecups:
Evidence for a muscarinic mechanism in choroidal thinning.
Ophthalmic Physiol Opt. 33:245–256. 2013. View Article : Google Scholar : PubMed/NCBI
|
|
26
|
Rada JA and Palmer L: Choroidal regulation
of scleral glycosaminoglycan synthesis during recovery from induced
myopia. Invest Ophthalmol Vis Sci. 48:2957–2966. 2007. View Article : Google Scholar : PubMed/NCBI
|
|
27
|
Wildsoet C: Neural pathways subserving
negative lens-induced emmetropization in chicks-insights from
selective lesions of the optic nerve and ciliary nerve. Curr Eye
Res. 27:371–385. 2003. View Article : Google Scholar : PubMed/NCBI
|
|
28
|
Ferrin G, Ranchal I, Llamoza C,
Rodríguez-Perálvarez ML, Romero-Ruiz A, Aguilar-Melero P,
López-Cillero P, Briceño J, Muntané J, Montero-Álvarez JL and De la
Mata M: Identification of candidate biomarkers for hepatocellular
carcinoma in plasma of HCV-infected cirrhotic patients by 2-D DIGE.
Liver Int. 34:438–446. 2014. View Article : Google Scholar : PubMed/NCBI
|
|
29
|
Knowles MR, Cervino S, Skynner HA, Hunt
SP, de Felipe C, Salim K, Meneses-Lorente G, McAllister G and Guest
PC: Multiplex proteomic analysis by two-dimensional differential
in-gel electrophoresis. Proteomics. 3:1162–1171. 2003. View Article : Google Scholar : PubMed/NCBI
|
|
30
|
Marouga R, David S and Hawkins E: The
development of the DIGE system: 2D fluorescence difference gel
analysis technology. Anal Bioanal Chem. 382:669–678. 2005.
View Article : Google Scholar : PubMed/NCBI
|
|
31
|
Wu TL: Two-dimensional difference gel
electrophoresis. Methods Mol Biol. 328:71–95. 2006.PubMed/NCBI
|
|
32
|
Fukuda M: Regulation of secretory vesicle
traffic by Rab small GTPases. Cell Mol Life Sci. 65:2801–2813.
2008. View Article : Google Scholar : PubMed/NCBI
|
|
33
|
Khvotchev MV, Ren M, Takamori S, Jahn R
and Südhof TC: Divergent functions of neuronal Rab11b in
Ca2+-regulated versus constitutive exocytosis. J
Neurosci. 23:10531–10539. 2003. View Article : Google Scholar : PubMed/NCBI
|
|
34
|
Alone DP, Tiwari AK, Mandal L, Li M,
Mechler BM and Roy JK: Rab11 is required during Drosophila eye
development. Int J Dev Biol. 49:873–879. 2005. View Article : Google Scholar : PubMed/NCBI
|
|
35
|
Pelissier A, Chauvin JP and Lecuit T:
Trafficking through Rab11 endosomes is required for cellularization
during Drosophila embryogenesis. Curr Biol. 13:1848–1857.
2003. View Article : Google Scholar : PubMed/NCBI
|
|
36
|
Muto A, Aoki Y and Watanabe S: Mouse
Rab11-FIP4 regulates proliferation and differentiation of retinal
progenitors in a Rab11-independent manner. Dev Dyn. 236:214–225.
2007. View Article : Google Scholar : PubMed/NCBI
|
|
37
|
Muto A, Arai K and Watanabe S: Rab11-FIP4
is predominantly expressed in neural tissues and involved in
proliferation as well as in differentiation during zebrafish
retinal development. Dev Biol. 292:90–102. 2006. View Article : Google Scholar : PubMed/NCBI
|
|
38
|
Ng EL and Tang BL: Rab GTPases and their
roles in brain neurons and glia. Brain Res Rev. 58:236–246. 2008.
View Article : Google Scholar : PubMed/NCBI
|
|
39
|
Zhu X, Li A, Brown B, Weiss ER, Osawa S
and Craft CM: Mouse cone arrestin expression pattern: Light induced
translocation in cone photoreceptors. Mol Vis. 8:462–471.
2002.PubMed/NCBI
|
|
40
|
Palczewski K, Pulvermüller A, Buczyłko J
and Hofmann KP: Phosphorylated rhodopsin and heparin induce similar
conformational changes in arrestin. J Biol Chem. 266:18649–18654.
1991.PubMed/NCBI
|
|
41
|
Zipfel B, Schmid HA and Meissl H:
Photoendocrine signal transduction in pineal photoreceptors of the
trout. Role of cGMP and nitric oxide. Adv Exp Med Biol. 460:79–82.
1999. View Article : Google Scholar : PubMed/NCBI
|
|
42
|
Palczewski K, McDowell JH, Jakes S,
Ingebritsen TS and Hargrave PA: Regulation of rhodopsin
dephosphorylation by arrestin. J Biol Chem. 264:15770–15773.
1989.PubMed/NCBI
|
|
43
|
Finley D: Recognition and processing of
ubiquitin-protein conjugates by the proteasome. Annu Rev Biochem.
78:477–513. 2009. View Article : Google Scholar : PubMed/NCBI
|
|
44
|
Murata S, Yashiroda H and Tanaka K:
Molecular mechanisms of proteasome assembly. Nat Rev Mol Cell Biol.
10:104–115. 2009. View Article : Google Scholar : PubMed/NCBI
|
|
45
|
Tanaka K: The proteasome: Overview of
structure and functions. Proc Jpn Acad Ser B Phys Biol Sci.
85:12–36. 2009. View Article : Google Scholar : PubMed/NCBI
|
|
46
|
Kominami K, DeMartino GN, Moomaw CR,
Slaughter CA, Shimbara N, Fujimuro M, Yokosawa H, Hisamatsu H,
Tanahashi N, Shimizu Y, et al: Nin1p, a regulatory subunit of the
26S proteasome, is necessary for activation of Cdc28p kinase of
Saccharomyces cerevisiae. EMBO J. 14:3105–3115. 1995.PubMed/NCBI
|
|
47
|
Lee S: Post-translational modification of
proteins in toxicological research: Focus on lysine acylation.
Toxicol Res. 29:81–86. 2013. View Article : Google Scholar : PubMed/NCBI
|
|
48
|
Xu Y, Wang X, Wang Y, Tian Y, Shao X, Wu
LY and Deng N: Prediction of posttranslational modification sites
from amino acid sequences with kernel methods. J Theor Biol.
344:78–87. 2014. View Article : Google Scholar : PubMed/NCBI
|
|
49
|
Axelsen LN, Calloe K, Holstein-Rathlou NH
and Nielsen MS: Managing the complexity of communication:
Regulation of gap junctions by post-translational modification.
Front Pharmacol. 4:1302013. View Article : Google Scholar : PubMed/NCBI
|
|
50
|
Bertrand E, Fritsch C, Diether S, Lambrou
G, Müller D, Schaeffel F, Schindler P, Schmid KL, van Oostrum J and
Voshol H: Identification of apolipoprotein A-I as a ‘STOP’ signal
for myopia. Mol Cell Proteomics. 5:2158–2166. 2006. View Article : Google Scholar : PubMed/NCBI
|
|
51
|
McKerracher L, Essagian C and Aguayo AJ:
Marked increase in beta-tubulin mRNA expression during regeneration
of axotomized retinal ganglion cells in adult mammals. J Neurosci.
13:5294–5300. 1993. View Article : Google Scholar : PubMed/NCBI
|
|
52
|
Nielsen K, Birkenkamp-Demtröder K, Ehlers
N and Orntoft TF: Identification of differentially expressed genes
in keratoconus epithelium analyzed on microarrays. Invest
Ophthalmol Vis Sci. 44:2466–2476. 2003. View Article : Google Scholar : PubMed/NCBI
|
|
53
|
Sharma RK, O'Leary TE, Fields CM and
Johnson DA: Development of the outer retina in the mouse. Brain Res
Dev Brain Res. 145:93–105. 2003. View Article : Google Scholar : PubMed/NCBI
|
|
54
|
Wagner E, Luche S, Penna L, Chevallet M,
Van Dorsselaer A, Leize-Wagner E and Rabilloud T: A method for
detection of overoxidation of cysteines: Peroxiredoxins are
oxidized in vivo at the active-site cysteine during oxidative
stress. Biochem J. 366:777–785. 2002. View Article : Google Scholar : PubMed/NCBI
|
|
55
|
Wong CM, Chun AC, Kok KH, Zhou Y, Fung PC,
Kung HF, Jeang KT and Jin DY: Characterization of human and mouse
peroxiredoxin IV: Evidence for inhibition by Prx-IV of epidermal
growth factor- and p53-induced reactive oxygen species. Antioxid
Redox Signal. 2:507–518. 2000. View Article : Google Scholar : PubMed/NCBI
|
|
56
|
Wood ZA, Schröder E, Harris Robin J and
Poole LB: Structure, mechanism and regulation of peroxiredoxins.
Trends Biochem Sci. 28:32–40. 2003. View Article : Google Scholar : PubMed/NCBI
|
|
57
|
Day IN and Thompson RJ: UCHL1 (PGP 9.5):
Neuronal biomarker and ubiquitin system protein. Prog Neurobiol.
90:327–362. 2010. View Article : Google Scholar : PubMed/NCBI
|
|
58
|
Pan Y, Appukuttan B, Mohs K, Ashander LM
and Smith JR: Ubiquitin carboxyl-terminal esterase L1 promotes
proliferation of human choroidal and retinal endothelial cells.
Asia Pac J Ophthalmol (Phila). 4:51–55. 2015. View Article : Google Scholar : PubMed/NCBI
|
|
59
|
Yu FJ, Lam TC, Liu LQ, Chun RK, Cheung JK,
Li KK and To CH: Isotope-coded protein label based quantitative
proteomic analysis reveals significant up-regulation of
apolipoprotein A1 and ovotransferrin in the myopic chick vitreous.
Sci Rep. 7:126492017. View Article : Google Scholar : PubMed/NCBI
|
|
60
|
Summers JA, Harper AR, Feasley CL,
Van-Der-Wel H, Byrum JN, Hermann M and West CM: Identification of
apolipoprotein A-I as a retinoic acid-binding protein in the eye. J
Biol Chem. 291:18991–19005. 2016. View Article : Google Scholar : PubMed/NCBI
|
|
61
|
Aebersold R, Burlingame AL and Bradshaw
RA: Western blots versus selected reaction monitoring assays: Time
to turn the tables? Mol Cell Proteomics. 12:2381–2382. 2013.
View Article : Google Scholar : PubMed/NCBI
|
|
62
|
Lundberg E, Fagerberg L, Klevebring D,
Matic I, Geiger T, Cox J, Algenäs C, Lundeberg J, Mann M and Uhlen
M: Defining the transcriptome and proteome in three functionally
different human cell lines. Mol Syst Biol. 6:4502010. View Article : Google Scholar : PubMed/NCBI
|
|
63
|
Schwanhäusser B, Busse D, Li N, Dittmar G,
Schuchhardt J, Wolf J, Chen W and Selbach M: Global quantification
of mammalian gene expression control. Nature. 473:337–342. 2011.
View Article : Google Scholar : PubMed/NCBI
|
|
64
|
Vogel C, Silva GM and Marcotte EM: Protein
expression regulation under oxidative stress. Mol Cell Proteomics.
10(M111): 0092172011.PubMed/NCBI
|
|
65
|
Hannis JC, Manalili SM, Hall TA, Ranken R,
White N, Sampath R, Blyn LB, Ecker DJ, Mandrell RE, Fagerquist CK,
et al: High-resolution genotyping of Campylobacter species by use
of PCR and high-throughput mass spectrometry. J Clin Microbiol.
46:1220–1225. 2008. View Article : Google Scholar : PubMed/NCBI
|