Introduction
Endometrial carcinoma (EC) is one of the most common
female reproductive tract malignancies globally (1–5).
Type I EC, additionally termed endometrioid endometrial carcinoma
(EEC) or endometrioid adenocarcinoma (EAC), accounts for 80–90% of
all subtypes of EC (6). Based on
the degree of differentiation, EEC is classified into three grades:
G1 (well-differentiated EEC), G2 (moderately differentiated EEC)
and G3 (poorly differentiated EEC). The diagnosis of the EEC grade
primarily depends on the histopathological examination of the
structure of tumor tissue and/or nuclear atypia. The higher the
grade, the more malignant the behavior of the tumor. Poorly
differentiated EEC usually develops rapidly and presents with
metastasis in a short time. A previous study demonstrated that
lymph vascular space invasion, which is an important factor in
prognostic evaluation and therapeutic strategy determination, is
uncommon in EEC of G1 and G2; however, it is common in EEC of G3
(7). Deep myometrial infiltration
is additionally common in EEC of G3. Thus, the treatment of
different grades of EEC varies. For patients with EEC of G1 with
<50% myometrial invasion, a systematic lymphadenopathy bares no
benefit; however, for patients with EEC of G3, lymphadenectomy is
considered or should be recommended (8). In addition, adjuvant chemotherapy,
radiotherapy or hormone therapy is necessary for EEC of G3. Due to
the unfavorable biological behavior, the recurrence of G3 EEC is
high. Therefore, it is important to investigate the molecular
mechanism underlying how poorly differentiated EEC occurs or
develops, and to identify novel targeted therapy. As mentioned
above, the present study aimed to reveal the difference between EEC
of G1 and G3 at the gene level, and to identify candidate
biomarkers or therapeutic targets for EEC of G3.
Bioinformatics analysis of gene microarrays is a
popular method to detect the expression of mRNA alterations between
different samples on a high-throughput platform (9). It is efficient to screen the
differentially expressed genes (DEGs) once among a mass of data and
furthermore, function, pathway and interaction analyses regarding
the genes may be implemented. Additionally, microRNAs (miRNAs),
small noncoding single-stranded RNAs, perform vital roles in
tumorigenesis by regulating their target genes, and may be used for
targeted DEG prediction. It is necessary and meaningful to
investigate the molecular alterations in well and poorly
differentiated EEC; however, no comprehensive study of
bioinformatics analysis has been conducted in this regard, to the
best of the authors' knowledge. Consequently, relevant microarrays
were searched for in the Gene Expression Omnibus (GEO) database,
and a bioinformatics analysis was conducted, including
identification of DEGs and differentially expressed miRNAs (DEMs),
together with function and pathway enrichment analyses and
interaction network construction. From the present study, novel
clues regarding the association between gene expression and
differentiation degree of EEC may be determined.
Materials and methods
Microarray data
The gene expression profiles of EEC were obtained
from the GEO at the National Center for Biotechnology Information
(http://www.ncbi.nlm.nih.gov/geo/), which
is an international public repository that allows users to upload
or download high-throughput microarrays freely. The mRNA microarray
dataset GSE17025 contains 103 samples, among which 79 samples were
stage I EECs including 30 samples of G1, 33 samples of G2 and 16
samples of G3. A total of 24 samples were 12 papillary serious
carcinoma samples and 12 atrophic endometrium samples, which were
subsequently excluded. The other mRNA microarray dataset GSE24537
contains 33 early stage EC samples, including 11 EAC samples of G1,
11 EAC samples of G3 and 11 uterine serous carcinoma samples. The
miRNA microarray dataset GSE35784 includes six G1 EEC samples, nine
G2 EEC samples, three G3 EEC samples and four normal endometrium
samples.
Identification of DEGs
To analyze these data, the online tool GEO2R
(https://www.ncbi.nlm.nih.gov/geo/geo2r/) was used.
GEO2R is an interactive tool for users to identify genes that are
differentially expressed across experimental conditions by
comparing two groups of samples in a GEO series. In the present
study, 30 G1 EEC samples and 16 G3 EEC samples from the dataset
GSE17025 were analyzed with 11 G1 EAC samples and 11 G3 EAC samples
from the dataset GSE24537. |Log FC|≥1 and P<0.05 were set as the
cut-off values. Subsequently, the genes, which were differentially
expressed with the same expression trends in datasets GSE17025 and
GSE24537 were selected.
Gene Ontology (GO) and Kyoto
Encyclopedia of Genes and Genomes (KEGG) analyses of DEGs
The GO (http://geneontology.org/) is a popular repository that
allows investigators to acquire information on categories and
attributes of genes, which contains biological processes (BP),
cellular components (CC) and molecular functions (MF) (10). The KEGG database (http://www.genome.jp/) is a knowledge base for the
systematic analysis of gene functional and metabolic pathways
(11). With the GO and KEGG
enrichment analyses, primary information regarding the function and
pathways of the identified DEGs was acquired. To perform the
analyses, the Database for Annotation, Visualization and Integrated
Discovery (DAVID, http://david.abcc.ncifcrf.gov/) was used, which
provides a comprehensive set of functional annotation tools for
users to understand the biological meaning of genes (12). P<0.05 was considered to indicate
a statistically significant difference.
Protein-protein interaction (PPI)
network construction
The PPI network, constructed using the Search Tool
for the Retrieval of Interacting Genes (STRING) database
(http://string-db.org/), is a visualized molecular
interaction network that presents the associations among the
proteins encoded through the identified DEGs (13). Cytoscape (http://www.cytoscape.org/) is a software for
visualizing the PPI network (14),
and the plugin Molecular Complex Detection (MCODE; http://apps.cytoscape.org/apps/mcode) is
designed for module analysis. In the present study, STRING (version
10.0) and Cytoscape (version 3.5.0) were used to construct the PPI
network with combined score >0.4 as the cut-off value. Using
NetworkAnalyzer in Cytoscape (http://apps.cytoscape.org/apps/networkanalyzer), the
top 10 hub DEGs with the highest node degrees were determined.
Using the MCODE, modules of the PPI network were extracted, and
only modules with scores >4 were selected to receive further
function and pathway enrichment analyzes. P<0.05 was considered
to indicate a statistically significant difference.
miRNA-DEG pairs
DEMs between G3 and G1 EEC samples of the dataset
GSE35784 were identified using GEO2R. |Log FC|≥1 and P-value
<0.05 were set as the threshold. The screened DEGs were uploaded
to the online tool WebGestalt (http://www.webgestalt.org), and the miRNA-target gene
enrichment analysis was performed. WebGestalt is a comprehensive,
flexible and interactive gene set enrichment analysis toolkit, from
which information about miRNA-target gene interactions may be
obtained. Subsequently, the miRNA-target regulatory network was
constructed using Cytoscape.
Results
Identification of the DEGs
The DEGs were identified using GEO2R by comparing
the data of well-differentiated samples with the poorly
differentiated samples. With the criteria of |log FC|≥1 and
P<0.05, a total of 1,456 and 1,739 genes were screened as DEGs
from the microarray datasets GSE17025 and GSE24537, respectively.
Among them, 243 upregulated and 1,213 downregulated genes were
identified in GSE17025, while 869 upregulated and 870 downregulated
genes were identified in GSE24537. Subsequently, 213 DEGs with the
same expression trends in the two datasets were screened, of which
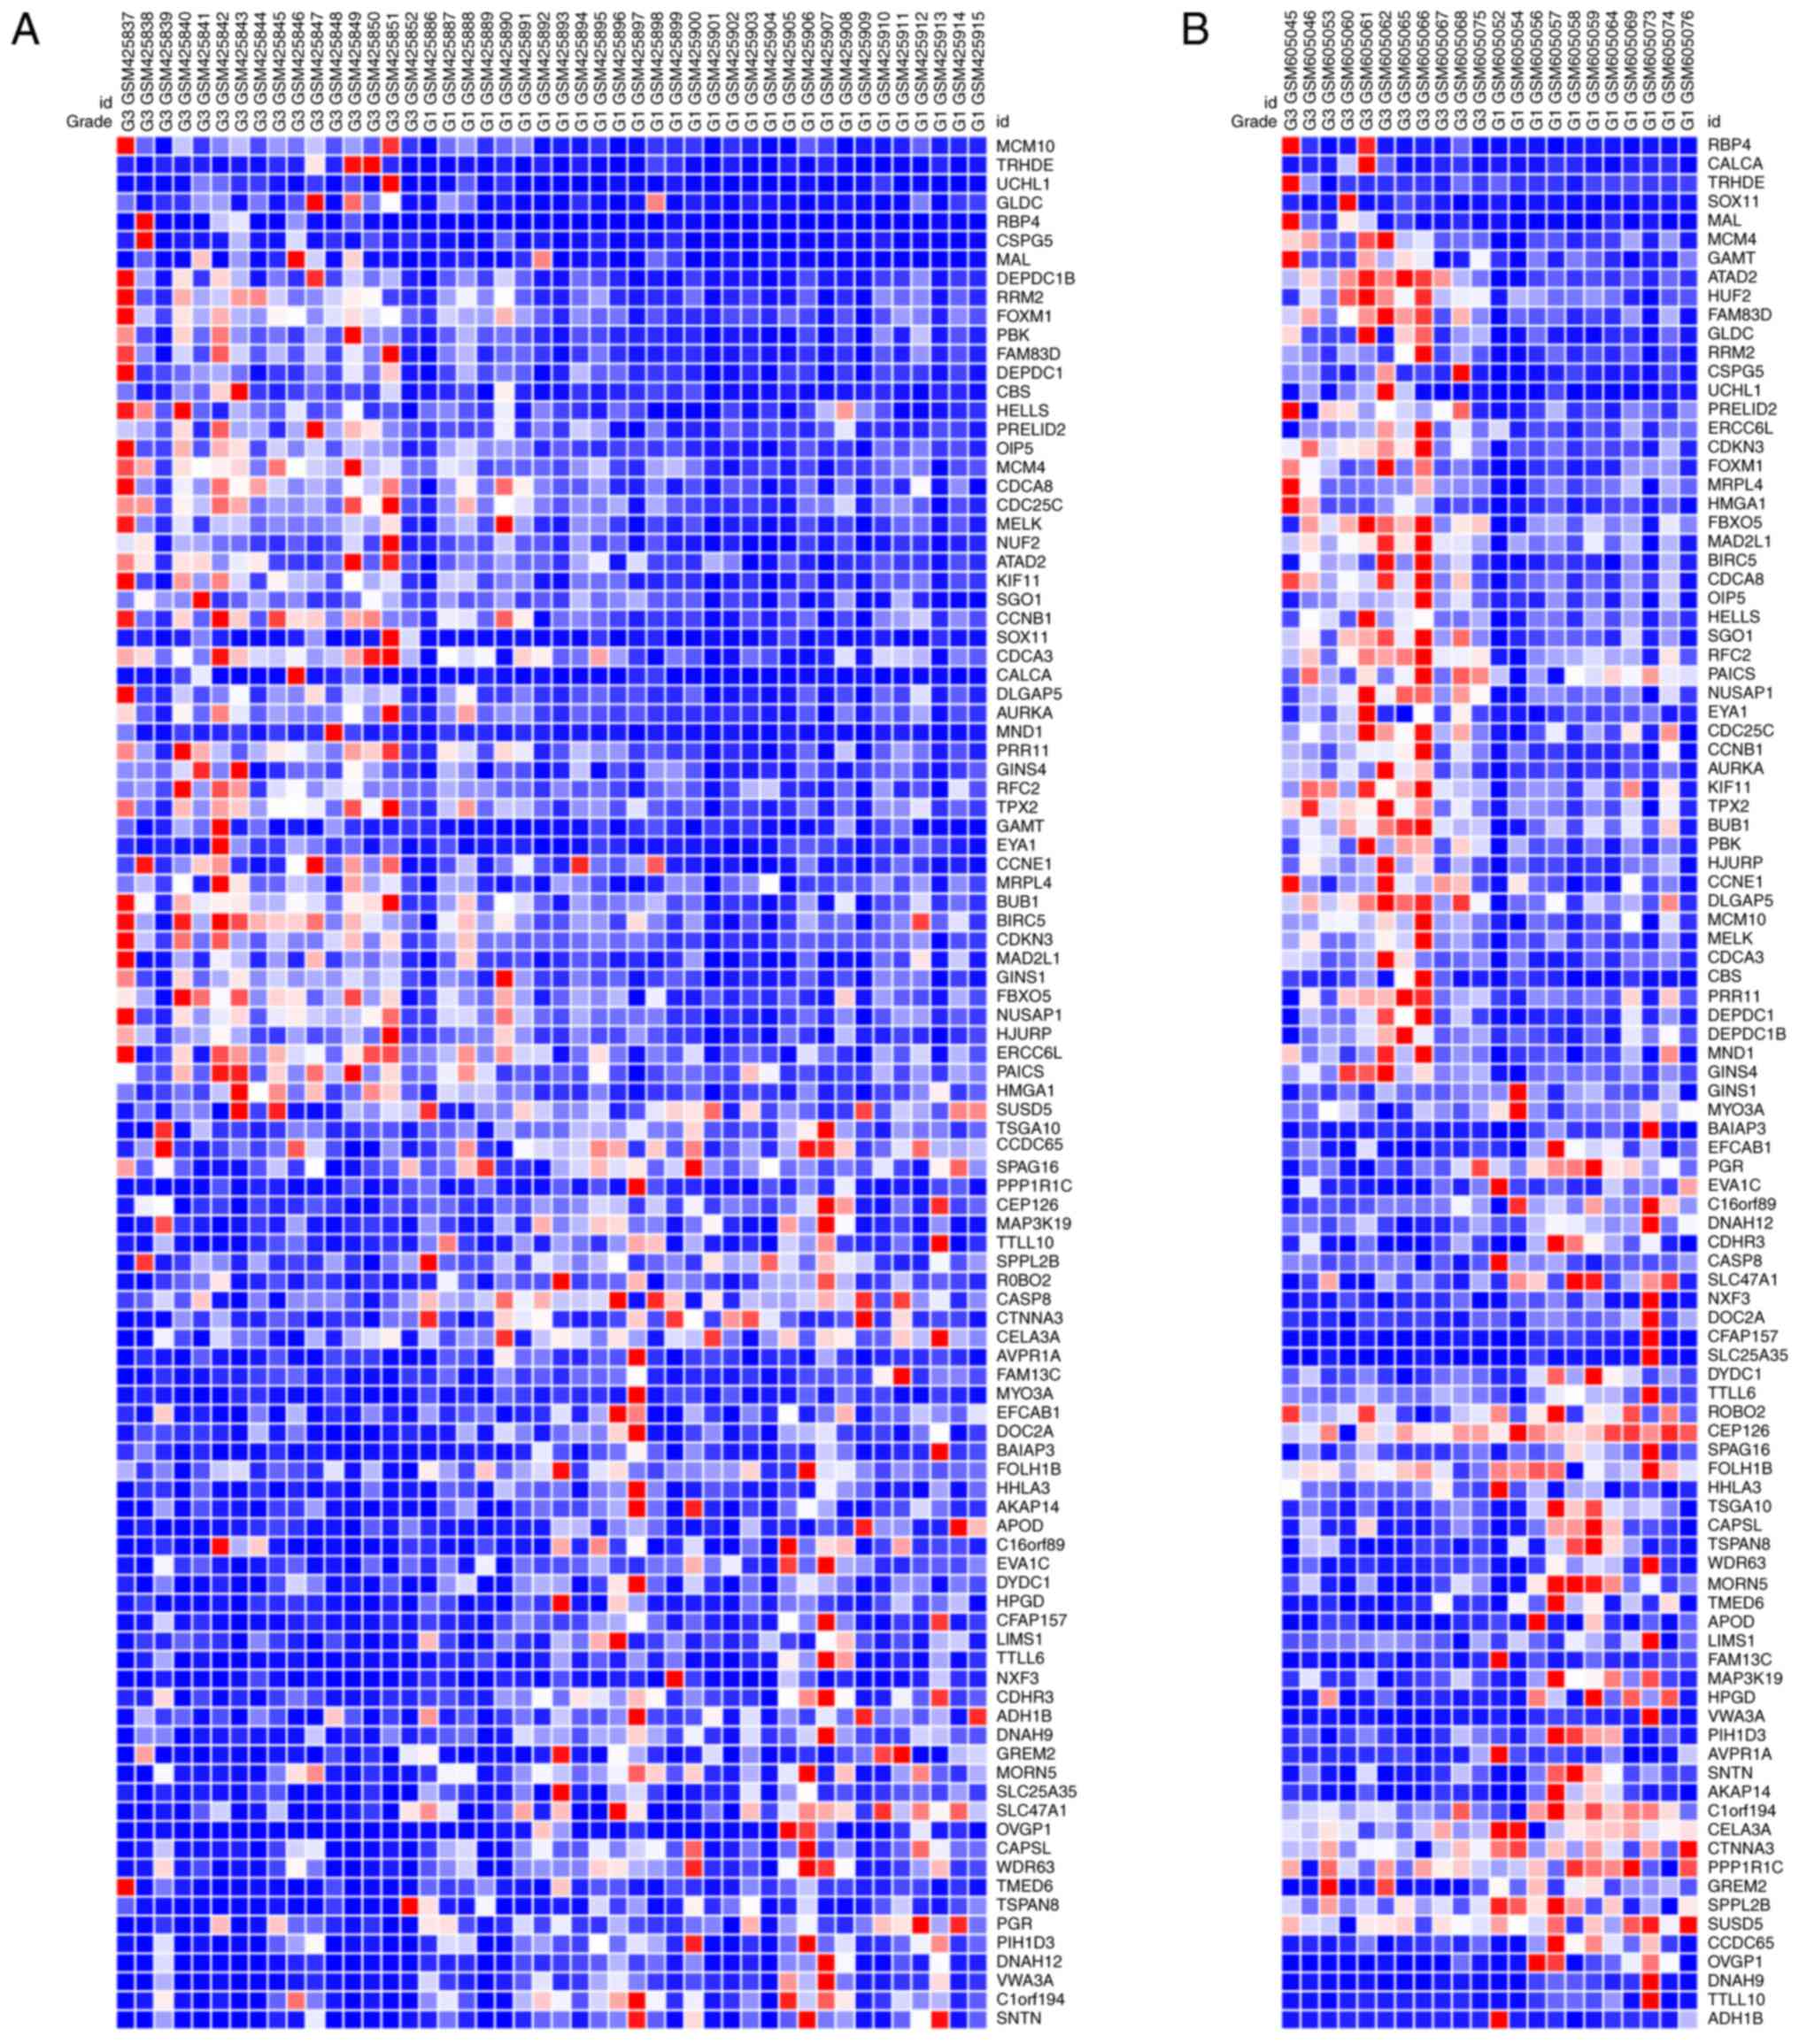
83 genes were upregulated and 130 genes were downregulated. The
expression heat maps of the top 100 genes of the matched 213 DEGs
are presented in Fig. 1.
GO and KEGG analyses
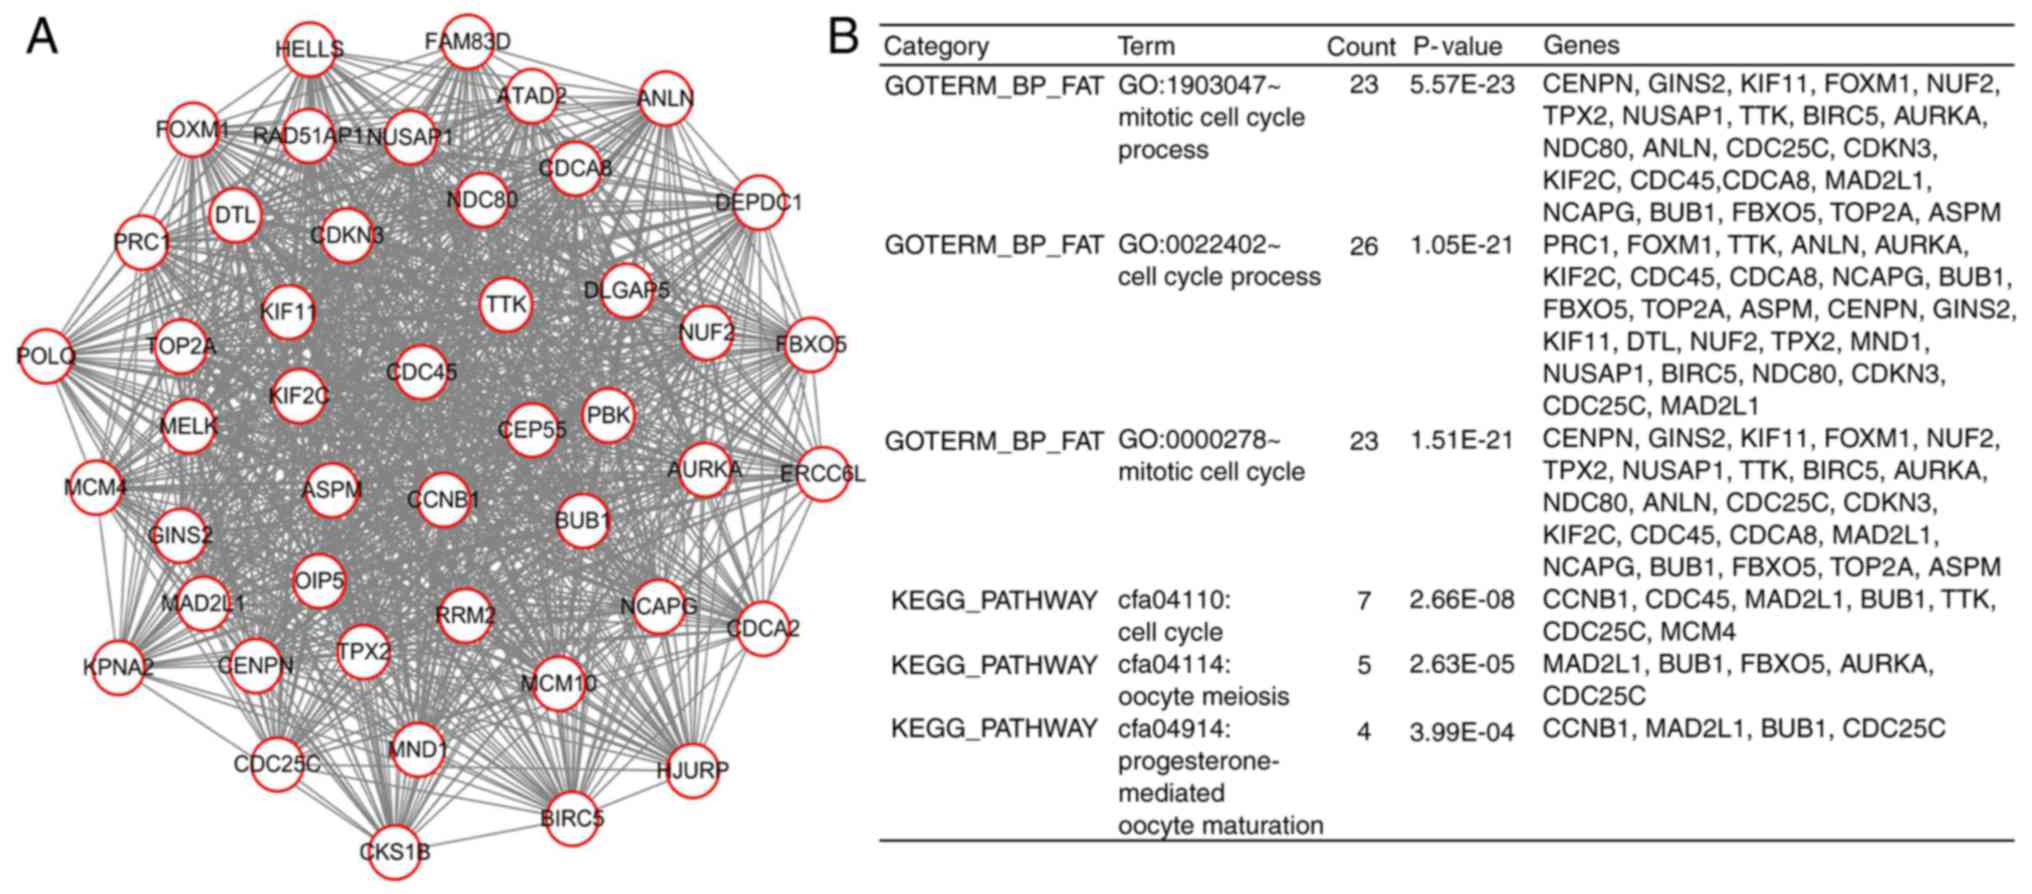
With the functional annotation tool DAVID
Bioinformatics Resources 6.8, the results of GO and KEGG analyses
were obtained (Tables I and
II). The top five results of BP,
CC and MF in GO analysis with P<0.05 are listed in Table I, which revealed that the
upregulated DEGs were primarily involved in ‘mitotic cell cycle
process’, ‘cell cycle process’, ‘mitotic cell cycle’, ‘cell cycle’
and ‘chromosome segregation’; while the downregulated DEGs were
primarily involved in ‘cellular component assembly involved in
morphogenesis’, ‘cell projection organization’, ‘microtubule-based
movement’, ‘cilium organization’ and ‘microtubule-based process’.
Results of the KEGG pathway enrichment analysis with P<0.05 are
presented in Table II. The
upregulated DEGs were primarily enriched in ‘cell cycle’, ‘oocyte
meiosis’ and ‘progesterone-mediated oocyte maturation’; while the
downregulated DEGs were enriched in ‘drug metabolism - cytochrome
P450’, ‘metabolism of xenobiotics by cytochrome P450’ and ‘chemical
carcinogenesis’.
 | Table I.GO analysis of the DEG associated
with the degree of differentiation in EEC. |
Table I.
GO analysis of the DEG associated
with the degree of differentiation in EEC.
| Category | Term | Count | P-value |
|---|
|
|---|
| A, upregulated |
|---|
| GOTERM_BP_FAT | GO:1903047~mitotic
cell cycle process | 26 |
1.65×10²⁰ |
| GOTERM_BP_FAT | GO:0022402~cell
cycle process | 31 |
6.67×10²⁰ |
| GOTERM_BP_FAT | GO:0000278~mitotic
cell cycle | 26 |
6.32×10¹⁹ |
| GOTERM_BP_FAT | GO:0007049~cell
cycle | 31 |
8.78×10¹⁸ |
| GOTERM_BP_FAT |
GO:0007059~chromosome segregation | 17 |
1.67×10¹⁴ |
| GOTERM_CC_FAT |
GO:0005694~chromosome | 25 |
1.77×10¹⁴ |
| GOTERM_CC_FAT |
GO:0000775~chromosome, centromeric
region | 14 |
4.87×10¹⁴ |
| GOTERM_CC_FAT |
GO:0044427~chromosomal part | 23 |
3.74×10¹³ |
| GOTERM_CC_FAT |
GO:0005819~spindle | 14 |
1.50×10¹¹ |
| GOTERM_CC_FAT |
GO:0098687~chromosomal region | 15 |
1.84×10¹¹ |
| GOTERM_MF_FAT | GO:0005524~ATP
binding | 14 |
6.46×10⁴ |
| GOTERM_MF_FAT | GO:0032559~adenyl
ribonucleotide binding | 14 |
7.68×10⁴ |
| GOTERM_MF_FAT | GO:0030554~adenyl
nucleotide binding | 14 |
7.99×10⁴ |
| GOTERM_MF_FAT |
GO:0003697~single-stranded DNA
binding | 4 |
2.51×10³ |
| GOTERM_MF_FAT | GO:0035639~purine
ribonucleoside triphosphate binding | 14 |
5.05×10³ |
|
| B,
downregulated |
|
| GOTERM_BP_FAT | GO:0010927~cellular
component assembly involved in morphogenesis | 8 |
9.34×10⁴ |
| GOTERM_BP_FAT | GO:0030030~cell
projection organization | 17 |
1.18×10³ |
| GOTERM_BP_FAT |
GO:0007018~microtubule-based movement | 7 |
1.26×10³ |
| GOTERM_BP_FAT | GO:0044782~cilium
organization | 7 |
1.28×10³ |
| GOTERM_BP_FAT |
GO:0007017~microtubule-based process | 11 |
1.54×10³ |
| GOTERM_CC_FAT |
GO:0005929~cilium | 16 |
2.75×10⁷ |
| GOTERM_CC_FAT | GO:0044441~ciliary
part | 9 |
1.00×10³ |
| GOTERM_CC_FAT |
GO:0005930~axoneme | 4 |
1.92×10² |
| GOTERM_CC_FAT | GO:0097014~ciliary
plasm | 4 |
1.92×10² |
| GOTERM_CC_FAT | GO:0030286~dynein
complex | 3 |
2.62×10² |
| GOTERM_MF_FAT | GO:0003774~motor
activity | 5 |
8.56×10³ |
| GOTERM_MF_FAT | GO:0004024~alcohol
dehydrogenase activity, zinc-dependent | 2 |
3.44×10² |
| GOTERM_MF_FAT | GO:0004022~alcohol
dehydrogenase (NAD) activity | 2 |
4.56×10² |
| Table II.KEGG pathway analysis of the DEGs
associated with the degree of differentiation in EEC. |
Table II.
KEGG pathway analysis of the DEGs
associated with the degree of differentiation in EEC.
| Term | Count | P-value | Genes |
|---|
|
|---|
| A, upregulated |
|---|
| cfa04110:Cell
cycle | 9 |
1.55×10⁸ | CCNB1, CCNE1,
CDC45, YWHAZ, MAD2L1, BUB1, TTK, CDC25C, MCM4 |
| cfa04114:Oocyte
meiosis | 8 |
1.37×10⁷ | CCNE1, YWHAZ,
MAD2L1, SGO1, BUB1, FBXO5, AURKA, CDC25C |
|
cfa04914:Progesterone-mediated oocyte
maturation | 4 |
4.62×10³ | CCNB1, MAD2L1,
BUB1, CDC25C |
|
cfa01130:Biosynthesis of antibiotics | 5 |
9.42×10³ | PGK1, PAICS, PPAT,
CBS, GLDC |
| cfa00260:Glycine,
serine and threonine metabolism | 3 |
1.03×10² | GAMT, CBS,
GLDC |
| cfa04115:p53
signaling pathway | 3 |
2.72×10² | CCNB1, CCNE1,
RRM2 |
|
| B,
downregulated |
|
| hsa00982:Drug
metabolism-cytochrome P450 | 4 |
3.06×10³ | GSTA3, ALDH1A3,
ADH6, ADH1B |
| hsa00980:Metabolism
of xenobiotics by cytochrome P450 | 4 |
3.89×10³ | GSTA3, ALDH1A3,
ADH6, ADH1B |
| hsa05204:Chemical
carcinogenesis | 4 |
4.84×10³ | GSTA3, ALDH1A3,
ADH6, ADH1B |
| hsa00350:Tyrosine
metabolism | 3 |
9.92×10³ | ALDH1A3, ADH6,
ADH1B |
|
hsa00010:Glycolysis/Gluconeogenesis | 3 |
3.38×10² | ALDH1A3, ADH6,
ADH1B |
|
hsa05016:Huntington's disease | 4 |
4.95×10² | DNAH9, DNAH12,
CASP8, DNAH6 |
PPI network analysis
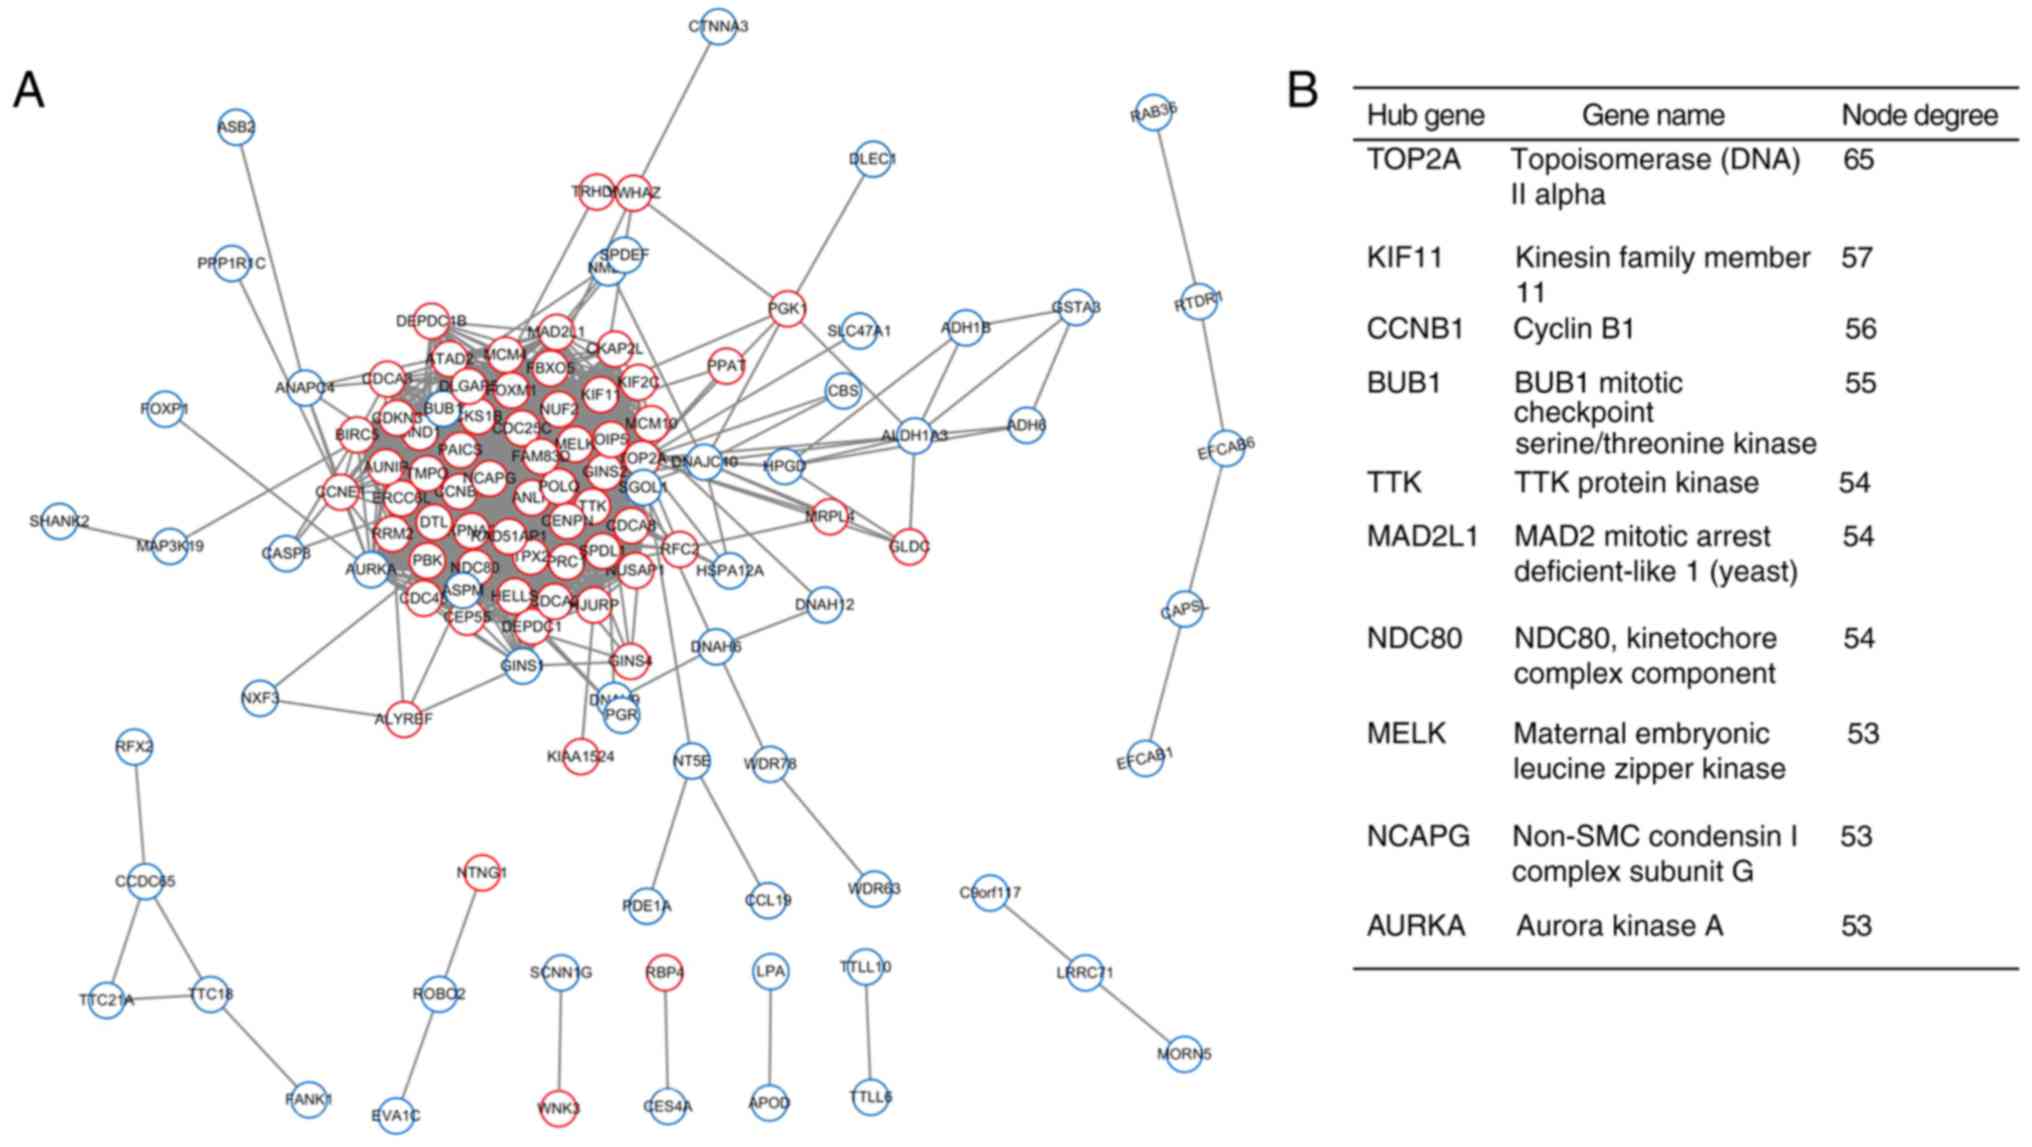
Using the STRING database and Cytoscape software,
the PPI network with 120 nodes and 1,300 edges was constructed.
Using the NetworkAnalyzer tool, the top 10 hub DEGs were obtained
(Fig. 2). As demonstrated in
Fig. 2, the hub genes were DNA
topoisomerase IIα (TOP2A), kinesin family member 11 (KIF11), cyclin
B1 (CCNB1), BUB1 (BUB1 mitotic checkpoint serine/threonine kinase),
TTK protein kinase, MAD2 mitotic arrest deficient-like 1 (yeast),
NDC80, kinetochore complex component, maternal embryonic leucine
zipper kinase, non-SMC condensing I complex subunit G and aurora
kinase A (AURKA). Furthermore, one significant module with a score
>4 was extracted by the plugin MCODE, followed by further
functional and pathway enrichment analyses (Fig. 3). This module was composed of 46
nodes and 970 edges, which were primarily involved in ‘mitotic cell
cycle process’, ‘cell cycle process’ and ‘mitotic cell cycle’. All
the genes in this module were upregulated and closely
interrelated.
Identification of the DEMs and
analysis of miRNA-target regulatory network
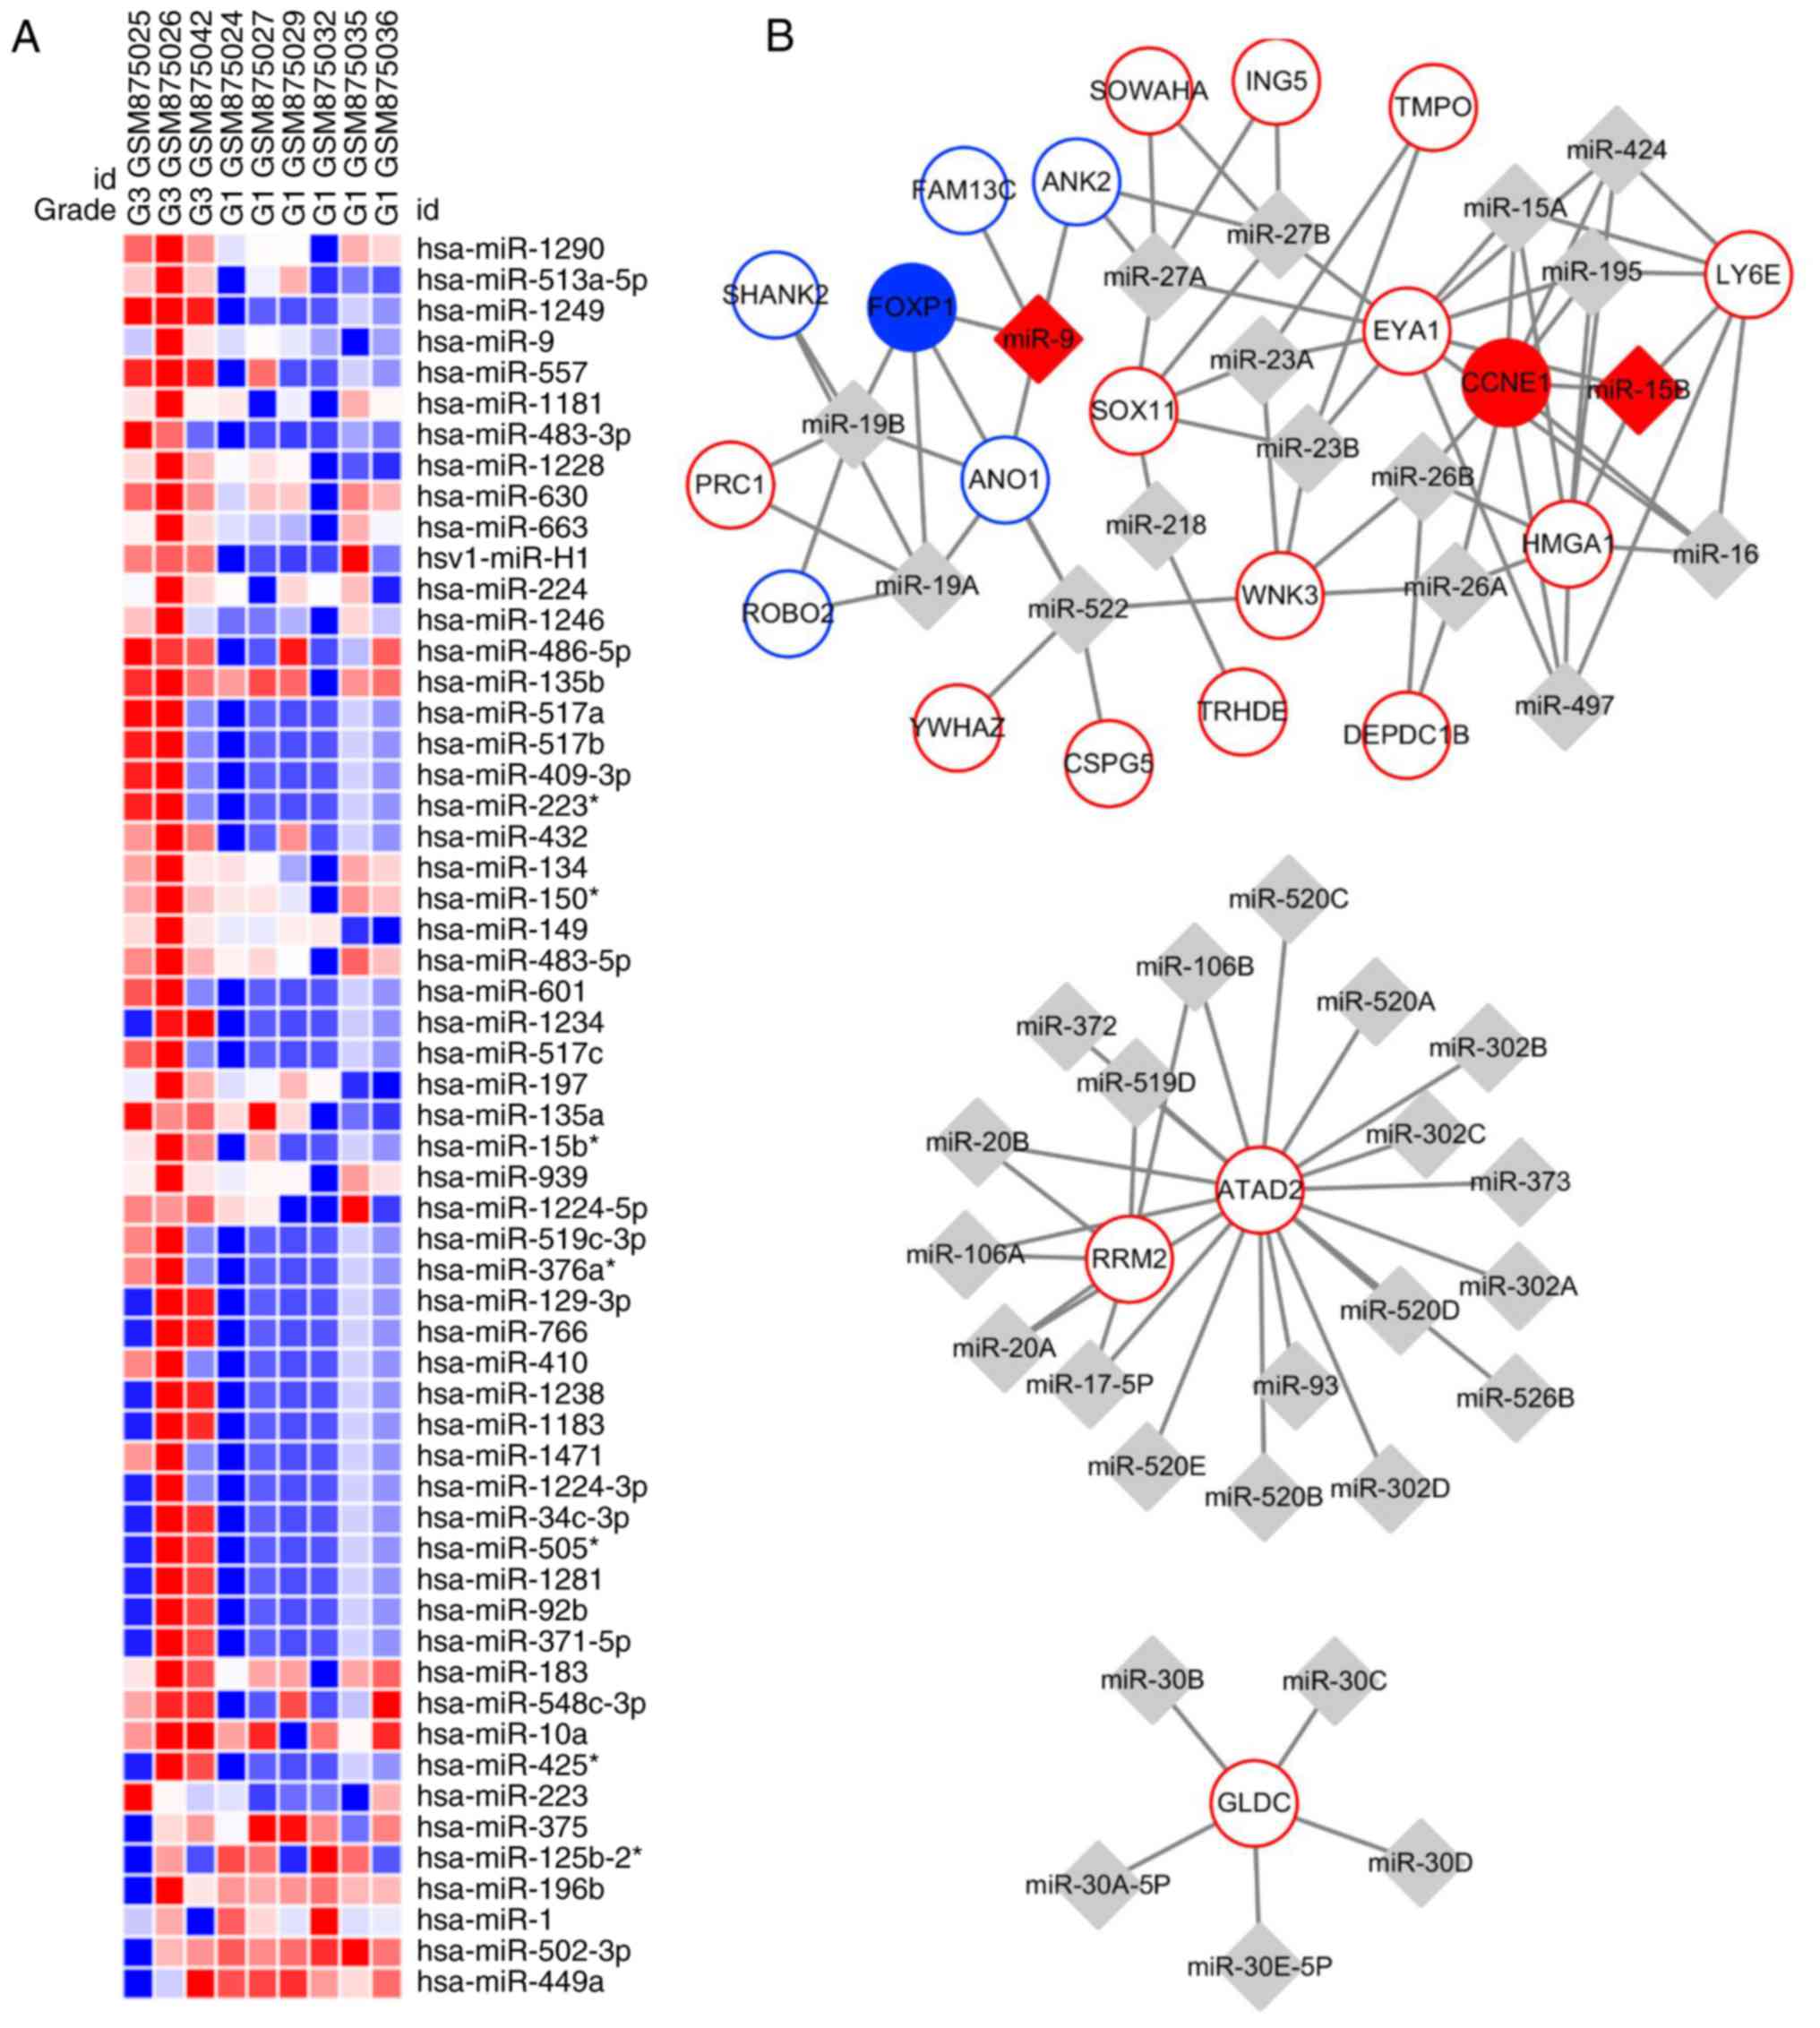
Using GEO2R, a total of 57 DEMs were identified,
including 51 upregulated DEMs and six downregulated DEMs (Fig. 4). From the results,
hsa-miRNA(miR)-1290, hsa-miR-513a-5p, hsa-miR-1249, hsa-miR-9 and
hsa-miR-557 were the top five upregulated DEMs, while hsa-miR-449a
was the most downregulated DEM. The miRNA-target regulatory network
was constructed using Cytoscape with the information from
WebGestalt, containing 23 DEGs and 41 miRNAs (Fig. 4). From Fig. 4, miRNAs hsa-miR-9 and hsa-miR-15b
were matched in the two results. Furthermore, their target genes
forkhead box P1 (FOXP1) and cyclin E1 (CCNE1) were involved in the
PPI network.
Discussion
EC is a common gynecological tumor, which is divided
into two types. The degree of differentiation serves a crucial role
in the prognosis of type I EC (EEC or EAC). EEC of G3 (poorly
differentiated EEC) usually has a poor prognosis leading to
metastasis in a short time. Therefore, it is important to examine
the molecular mechanism of EEC differentiation and bioinformatics
analysis of microarrays, facilitating the genetic study of EEC. In
the present study, microarray datasets GSE17025, GSE24537 and
GSE35784 were downloaded from the GEO database, and the difference
between well-differentiated and poorly differentiated samples was
analyzed. A total of 83 upregulated and 130 downregulated DEGs,
together with 51 upregulated and six downregulated DEMs, were
identified. In order to elucidate the category and pathway that the
DEGs were involved in, GO and KEGG enrichment analyses were
performed. Subsequently, the PPI network and subnetworks were
constructed with the hub DEGs screened. A miRNA-target regulatory
network was constructed with DEGs and their regulatory miRNAs.
Subsequently, by combining the DEMs, miRNA-target regulatory
network and PPI network, crucial DEGs were identified.
According to the results of the PPI network, TOP2A,
KIF11, CCNB1 and BUB1 were identified as the foremost hub DEGs.
They were all involved in one module extracted from the PPI
network. DEGs in this module interacted closely with each other,
and were primarily involved in ‘mitotic cell cycle process’ and
‘cell cycle process’. From the GO and KEGG pathway analyses, TOP2A,
KIF11, CCNB1 and BUB1 were all enriched in cell cycle-associated BP
and pathways. hsa-miR-9 was identified as one of the top five
upregulated DEMs; meanwhile, it was additionally involved in the
miRNA-target regulatory network, as was hsa-miR-15b. Their
respective target genes, the downregulated DEG FOXP1 and
upregulated DEG CCNE1, were concurrently involved in the PPI
network.
TOP2A encodes a DNA topoisomerase, an enzyme
involved in DNA transcription and replication processes including
chromosome condensation and chromatid separation. Thus, TOP2A
serves a principal role in controlling the cell cycle and
maintaining the integrity of the genome. It was reported that TOP2A
was upregulated in numerous cancer types, including endometrial
cancer (3,4,15),
pancreatic cancer (16), prostate
cancer (17) and breast cancer
(18). In agreement with the
present results, the increased TOP2A expression level indicated an
association with more aggressive tumor behavior, including
myometrial infiltration, and was associated with the prognosis in
patients with EC (4,15). Moreover, TOP2A may be used as a
biomarker in patients receiving adjuvant taxane-platinum regimens
with moderate- to high-risk EC (3). The previous study (3) coincides with the present result that
TOP2A was significantly upregulated in EC of G3 compared with EC of
G1. In 2018, Pei et al (16) reported that the upregulation of
TOP2A was observed in pancreatic cancer compared with non-tumor
tissues, and significantly correlated with tumor metastasis and
shorter survival. In a previous study (16), it was additionally revealed that a
novel miR-139\TOP2A\β-catenin axis drives the malignant progression
of pancreatic cancer. In this axis, TOP2A induces cell
proliferation and epithelial-mesenchymal transition (EMT) by
activating the β-catenin signaling pathway, however, the process
may be reversed by miR-139 (16).
Zheng et al (18),
demonstrated that the overexpression of TOP2A was associated with
unfavorable biological behaviors of triple-negative breast cancer
(TNBC), and TOP2A was confirmed as an independent prognostic
indicator of 5-year disease-free survival. In prostate cancer,
TOP2A was selected as a biomarker for early identification of
patients with higher metastatic potential, thus these patients may
receive timely adjuvant or neoadjuvant targeted therapy to improve
prognosis (17). In summary, TOP2A
is likely to have an important role in the genesis of poorly
differentiated EC and may be used as an indicator of poor
prognosis.
KIF11 is a motor kinesin required for the control of
the accurate arrangement of microtubules and the separation of
duplicated centrosomes during spindle formation. Overexpression of
KIF11 is common in breast cancer, esophageal cancer, colorectal
cancer and glioblastoma (19–21).
According to certain studies, the high expression level of KIF11 is
significantly associated with poor prognosis among patients with
non-small cell lung cancer (NSCLC) (22), oral cancer (23) and TNBC (24). Inhibition experiments were
performed to examine the role of KIF11 in cancer cells. KIF11 was
proven to be vital for proliferation and self-renewal in TNBC tumor
cells (24). In vitro,
knockdown of KIF11 via small interfering RNA resulted in a
significant decrease in the percentage of cancer stem cells (CSCs)
and mammosphere formation, with additional cell cycle G2/M arrest,
cell growth inhibition and apoptosis. In vivo, a KIF11
inhibitor exerted an inhibitory growth effect in
docetaxel-resistant TNBC xenograft models. Similarly, knockdown of
KIF11 or the application of KIF11 inhibitors suppressed cell
proliferation, possibly through G2/M arrest, followed by the
induction of apoptosis in oral cancer cells (23). In the study of Imai et al
(20), knockdown of KIF11
inhibited mammosphere formation in esophageal and colorectal CSCs.
Thus, the overexpression of KIF11 is associated with development
and poor outcomes of cancer types, possibly by influencing the
mammosphere formation of CSCs and cell cycle regulation.
BUB1 is the gene encoding the mitotic checkpoint
serine/threonine kinase BUB1, a type of spindle assembly checkpoint
protein kinase required for accurate chromosome segregation. It is
important to maintain genome stability during mitosis and meiosis.
An insufficiency of BUB1 expression triggers chromosomal
instability, aneuploidy and premature senescence. An association
between BUB1 expression and poor clinical prognosis was inferred in
patients with breast cancer (25).
The depletion of BUB1 suppressed the CSC potential of the
MDA-MB-231 breast cancer cell line (25). Davidson et al (26) reported that in advanced-stage
ovarian serous carcinoma, BUB1 was significantly coexpressed with
aurora kinase A (AURKA). As a member of another family of mitotic
serine/threonine kinases, AURKA is a hub gene in the significant
module in the present study. Based on the study by Nyati et
al (27), BUB1, as an integral
component of transforming growth factor β (TGFβ) signaling, may
promote the formation of TGFBRI/II receptor complex, which
regulates downstream signaling pathways, including the mothers
against decapentaplegic homolog, mitogen-activated protein kinase
and phosphoinositide 3-kinase/RAC-α serine/threonine-protein kinase
pathways, and mediate TGFβ-dependent EMT, cell migration and
invasion. All the aforementioned studies were in support of the
facilitating effect of BUB1 on tumorigenesis and progression.
However, in EC, it was declared that low expression of BUB1 was
closely associated with poorly differentiated EC, which is contrary
to the present results (28).
However, another study investigating the expression of BUB1 in EC
reported that BUB1 was upregulated in serous EC compared with EEC
(29). As is known, the malignant
potential of serous EC is higher compared with that of EEC. Thus,
BUB1 is possibly positively associated with the malignancy of EC.
In summary, the role of BUB1 in EC development remains
undetermined
As a principal cell cycle regulator,
G2/mitotic-specific cylin-B1 (the protein product of CCNB1)
controls the G2/M transition by combining with cyclin-dependent
kinase 1 to form a complex, which may promote progression to
mitosis and amplify the cellular growth rate. Therefore, the
aberrant expression of CCNB1 contributes to tumorigenesis. The
overexpression of CCNB1 has been observed in a multitude of tumors,
including breast cancer, lung cancer, colorectal cancer and bladder
cancer (30–32). Kim et al (32) demonstrated that FOXM1-CCNB1
signaling may be associated with the poor prognosis of
non-muscle-invasive bladder cancer, and the expression of CCNB1 is
able to predict the risk of recurrence in these patients. It was
reported that inhibition or knockdown of CCNB1 suppressed cell
proliferation, blocked cell cycle progression and induced cell
apoptosis in colorectal cancer (31). The single nuecleotide polymorphisms
(SNPs) of rs2069429 and rs2069433 in CCNB1 were verified to be
associated with overall survival in NSCLC (30). Similarly, SNP rs2069433 in CCNB1
was revealed to be associated with the risk of EC (33). Furthermore, CCNB1, as a myc
proto-oncogene downstream transcriptional target, was identified to
be negatively correlated with the tumor suppressor progesterone
receptor in EC (34). As mentioned
above, CCNB1 may serve an important role in the genesis of EC and
may be a powerful predictor of disease prognosis.
CCNE1 encodes the protein G1/S-specific cyclin-E1,
which belongs to the highly conserved cyclin family, a cell cycle
regulator. The protein forms a complex with cyclin-dependent kinase
2 and controls the G1 to S phase transition. The overexpression of
CCNE1 may be an early event in tumorigenesis. In accordance with
the present study, amplification of CCNE1 was reported to be
significantly associated with high grade EEC and non-endometrioid
EC (35). More notably, the
expression level of CCNE1 in poorly differentiated EAC cell line
was detected as higher compared with in well-differentiated EAC
cell line (1.6±0.19 vs. 1.4±0.33) (1). In ovarian cancer, CCNE1 amplification
confers worse survival and may be used as a potential therapeutic
target (36). In lung
adenocarcinoma (LUAD), the downregulation of CCNE1 may be induced
by knockdown of homeobox C13 (HOXC13), leading to arrest at the G1
phase and subsequent inhibition of cell proliferation; whereas,
miR-141 may exert the same effect by reducing the expression of
HOXC13 and CCNE1 (37). Similarly,
the inhibition of family with sequence similarity 83 member D may
additionally suppress the proliferation of LUAD cells by
interfering with the cell cycle by suppressing the expression of
CCNE1 (38). Notably, according to
the study from Krivega et al (39), CCNE1 exerts a crucial role in
balancing totipotency and differentiation in human embryonic cells,
which means that CCNE1 possesses the potential of regulating cell
differentiation. In summary, it was confirmed that CCNE1 is
upregulated in poorly differentiated EEC and is important in cell
differentiation.
FOXP1, a P subfamily of forkhead box, is an
estrogen-responsive transcription factor and is implicated in
cellular differentiation and proliferation. Previous studies
(2,40–43)
suggested that FOXP1 may be a tumor suppressor gene in breast
cancer, prostate cancer, epithelial ovarian cancer and EC. A
meta-analysis of 22 articles that examined nine tumor types and
included 2,468 patients reported that reduced FOXP1 expression was
associated with worse survival in patients with solid tumors
(40). It was reported that the
activation of FOXP1 may inhibit tumor proliferation in epithelial
ovarian cancer (41). Conversely,
the downregulation of FOXP1 expression regulated by miR-504
triggered tumorigenesis in glioma (42). Consistent with the present study,
lower FOXP1 expression in the nucleus and cytoplasm of G3 EEC was
detected when compared with G1 and G2 EEC in a study conducted by
Mizunuma et al (2). This
previous study also reported that FOXP1 acted as a tumor suppressor
in EEC through the GTPase KRAS pathway. Furthermore, Giatromanolaki
et al (43) demonstrated
that the loss of FOXP1 expression resulted in a slightly worse
outcome in early EC. According to the aforementioned literature,
the inverse effect of FOXP1 was assured in the process of
tumorigenesis and poor differentiation of EEC.
The microRNA miR-9 is a small, non-coding RNA
involved in gene regulation. As demonstrated in Fig. 4, miR-9 was one of the top
upregulated DEMs in the heatmap and interacted with a number of
downregulated DEGs in the miRNA-target regulatory network. In
accordance with the present results, Torres et al (5) demonstrated that the expression level
of miR-9 was lower in G1 samples compared with G2 and G3 samples of
EEC. Additionally, miR-9 expression was reported to be upregulated
in numerous cancer types, including colorectal cancer, breast
cancer and lung cancer. As an example, miR-9 was upregulated in
NSCLC, and functioned as the core of TGF-β1-induced cell invasion
and adhesion by targeting SOX7 (44). More notably, the upregulation of
miR-9 and subsequent downregulation of its target, Cadherin-1, may
induce EMT in NSCLC cells by regulating TGF-β1 signaling (45). Furthermore, significant
overexpression of miR-9 was observed in breast cancer tissues and
cell lines, and miR-9 may promote the proliferation, migration and
invasion of breast cancer cells by downregulating FOXO1 (46). As aforementioned, miR-9 may promote
tumor progression by downregulating the target tumor
suppressors.
Principal genes were identified that may be
determinants of the carcinogenesis of poorly differentiated EC,
which may facilitate the investigation of the potential molecular
mechanism. These genes may additionally help to identify candidate
biomarkers and novel therapeutic targets of poorly differentiated
EC. However, there are limitations of the present study. Among all
the genes identified, only the genes TOP2A, CCNE1, FOXP1 and miR-9
have already been verified to be differentially expressed between
G1 and G3 EC samples in previous studies; however, the remaining
genes have not been studied in this regard. Similarly,
overexpression of TOP2A has been demonstrated to be associated with
the poor prognosis of EC in previous studies (4,15),
while the significance of prognostic evaluation of the remaining
genes has been proven in other cancer types, although not in EC.
Therefore, further laboratory tests of clinical samples are
essential to confirm the present findings. Additionally, whether
these genes may be used as biomarkers and therapeutic targets
requires further experimental verification.
In conclusion, by comparing the G3 and G1 EEC
samples, a total of 213 DEGs, including 83 upregulated and 130
downregulated DEGs, were identified; a total of 57 DEMs including
51 upregulated DEMs and six downregulated DEMs, were identified.
Based on the PPI network, TOP2A, KIF11, CCNB1 and BUB1 were the
main hub genes. According to the enrichment analysis of DEGs of the
significant modules, they were primarily associated with ‘mitotic
cell cycle process’, ‘cell cycle process’ and ‘mitotic cell cycle’.
Based on the analysis of DEMs and the miRNA-target regulatory
network, miR-9 may be the most important upregulated DEM, and the
DEGs FOXP1 and CCNE1 may serve vital roles in the differentiation
of EC. These identified principal genes may help to identify the
potential molecular mechanism of tumorigenesis and additionally,
candidate biomarkers and novel targeted therapy for poorly
differentiated EC. However, further laboratory tests of clinical
samples or laboratory research are required to verify the
reliability of the results in the present study.
Acknowledgements
The present study was supported by grants from the
Natural Science Foundation of China (grant nos. 81572568 and
81272863).
Funding
The present study was supported by grants from the
Natural Science Foundation of China (grant nos. 81572568 and
81272863).
Availability of data and materials
The datasets analysed during the current study are
available in the Gene Expression Omnibus repository (http://www.ncbi.nlm.nih.gov/geo/).
Authors' contributions
YZ, YW and FX conceived and designed the study. YZ,
MD, KZ and WT performed the experiments. YZ wrote the manuscript.
YW and FX revised and edited the manuscript. All authors read and
approved the final manuscript.
Ethics approval and consent to
participate
Not applicable.
Consent for publication
Not applicable.
Competing interests
The authors declare that they have no competing
interests.
References
|
1
|
Nowakowska M, Matysiak-Burzyńska Z,
Kowalska K, Płuciennik E, Domińska K and Piastowska-Ciesielska AW:
Angiotensin II promotes endometrial cancer cell survival. Oncol
Rep. 36:1101–1110. 2016. View Article : Google Scholar : PubMed/NCBI
|
|
2
|
Mizunuma M, Yokoyama Y, Futagami M, Horie
K, Watanabe J and Mizunuma H: FOXP1 forkhead transcription factor
is associated with the pathogenesis of endometrial cancer. Heliyon.
2:e001162016. View Article : Google Scholar : PubMed/NCBI
|
|
3
|
Ito F, Furukawa N and Nakai T: Evaluation
of TOP2A as a predictive marker for endometrial cancer with
taxane-containing adjuvant chemotherapy. Int J Gynecol Cancer.
26:325–330. 2016. View Article : Google Scholar : PubMed/NCBI
|
|
4
|
Supernat A, Łapińska-Szumczyk S, Majewska
H, Gulczyński J, Biernat W, Wydra D and Zaczek AJ: A multimarker
qPCR platform for the characterisation of endometrial cancer. Oncol
Rep. 31:1003–1013. 2014. View Article : Google Scholar : PubMed/NCBI
|
|
5
|
Torres A, Torres K, Pesci A, Ceccaroni M,
Paszkowski T, Cassandrini P, Zamboni G and Maciejewski R:
Diagnostic and prognostic significance of miRNA signatures in
tissues and plasma of endometrioid endometrial carcinoma patients.
Int J Cancer. 132:1633–1645. 2013. View Article : Google Scholar : PubMed/NCBI
|
|
6
|
Koh WJ, Greer BE, Abu-Rustum NR, Apte SM,
Campos SM, Chan J, Cho KR, Cohn D, Crispens MA, Dupont N, et al:
Uterine neoplasms. version 1.2017. 2016 National Comprehensive
Cancer Network Inc.; 2017
|
|
7
|
Kaloglu S, Guraslan H, Tekirdag AI,
Dagdeviren H and Kaya C: Relation of preoperative thrombocytosis
between tumor stage and grade in patients with endometrial cancer.
Eurasian J Med. 46:164–168. 2014. View Article : Google Scholar : PubMed/NCBI
|
|
8
|
Colombo N, Creutzberg C, Amant F, Bosse T,
González-Martín A, Ledermann J, Marth C, Nout R, Querleu D, Mirza
MR, et al: ESMO-ESGO-ESTRO consensus conference on endometrial
cancer: Diagnosis, treatment and follow-up. Radiother Oncol.
117:559–581. 2015. View Article : Google Scholar : PubMed/NCBI
|
|
9
|
Mou T, Zhu D, Wei X, Li T, Zheng D, Pu J,
Guo Z and Wu Z: Identification and interaction analysis of key
genes and microRNAs in hepatocellular carcinoma by bioinformatics
analysis. World J Surg Oncol. 15:632017. View Article : Google Scholar : PubMed/NCBI
|
|
10
|
Bastos HP, Tavares B, Pesquita C, Faria D
and Couto FM: Application of gene ontology to gene identification.
Methods Mol Biol. 760:141–157. 2011. View Article : Google Scholar : PubMed/NCBI
|
|
11
|
Kanehisa M, Sato Y, Kawashima M, Furumichi
M and Tanabe M: KEGG as a reference resource for gene and protein
annotation. Nucleic Acids Res. 44:D457–D462. 2016. View Article : Google Scholar : PubMed/NCBI
|
|
12
|
da Huang W, Sherman BT and Lempicki RA:
Systematic and integrative analysis of large gene lists using DAVID
bioinformatics resources. Nat Protoc. 4:44–57. 2009. View Article : Google Scholar : PubMed/NCBI
|
|
13
|
Szklarczyk D, Franceschini A, Wyder S,
Forslund K, Heller D, Huerta-Cepas J, Simonovic M, Roth A, Santos
A, Tsafou KP, et al: STRING v10: Protein-protein interaction
networks, integrated over the tree of life. Nucleic Acids Res.
43:(Database Issue). D447–D452. 2015. View Article : Google Scholar : PubMed/NCBI
|
|
14
|
Su G, Morris JH, Demchak B and Bader GD:
Biological network exploration with Cytoscape 3. Curr Protoc
Bioinformatics. 47:8.13.1. 242014. View Article : Google Scholar : PubMed/NCBI
|
|
15
|
Supernat A, Lapińska-Szumczyk S, Majewska
H, Gulczyński J, Biernat W, Wydra D and Zaczek AJ: Tumor
heterogeneity at protein level as an independent prognostic factor
in endometrial cancer. Transl Oncol. 7:613–619. 2014. View Article : Google Scholar : PubMed/NCBI
|
|
16
|
Pei YF, Yin XM and Liu XQ: TOP2A induces
malignant character of pancreatic cancer through activating
β-catenin signaling pathway. Biochim Biophys Acta. 1864:197–207.
2018. View Article : Google Scholar : PubMed/NCBI
|
|
17
|
Labbé DP, Sweeney CJ, Brown M, Galbo P,
Rosario S, Wadosky KM, Ku SY, Sjöström M, Alshalalfa M, Erho N, et
al: TOP2A and EZH2 provide early detection of an aggressive
prostate cancer subgroup. Clin Cancer Res. 23:7072–7083. 2017.
View Article : Google Scholar : PubMed/NCBI
|
|
18
|
Zheng H, Li X, Chen C, Chen J, Sun J, Sun
S, Jin L, Li J, Sun S and Wu X: Quantum dot-based immunofluorescent
imaging and quantitative detection of TOP2A and prognostic value in
triple-negative breast cancer. Int J Nanomedicine. 11:5519–5529.
2016. View Article : Google Scholar : PubMed/NCBI
|
|
19
|
Pei YY, Li GC, Ran J and Wei FX: Kinesin
family member 11 contributes to the progression and prognosis of
human breast cancer. Oncol Lett. 14:6618–6626. 2017.PubMed/NCBI
|
|
20
|
Imai T, Oue N, Sentani K, Sakamoto N,
Uraoka N, Egi H, Hinoi T, Ohdan H, Yoshida K and Yasui W: KIF11 is
required for spheroid formation by oesophageal and colorectal
cancer cells. Anticancer Res. 37:47–55. 2017. View Article : Google Scholar : PubMed/NCBI
|
|
21
|
Venere M, Horbinski C, Crish JF, Jin X,
Vasanji A, Major J, Burrows AC, Chang C, Prokop J, Wu Q, et al: The
mitotic kinesin KIF11 is a driver of invasion, proliferation, and
self-renewal in glioblastoma. Sci Transl Med. 7:304ra1432015.
View Article : Google Scholar : PubMed/NCBI
|
|
22
|
Schneider MA, Christopoulos P, Muley T,
Warth A, Klingmueller U, Thomas M, Herth FJ, Dienemann H, Mueller
NS, Theis F and Meister M: AURKA, DLGAP5, TPX2, KIF11 and CKAP5:
Five specific mitosis-associated genes correlate with poor
prognosis for non-small cell lung cancer patients. Int J Oncol.
50:365–372. 2017. View Article : Google Scholar : PubMed/NCBI
|
|
23
|
Daigo K, Takano A, Thang PM, Yoshitake Y,
Shinohara M, Tohnai I, Murakami Y, Maegawa J and Daigo Y:
Characterization of KIF11 as a novel prognostic biomarker and
therapeutic target for oral cancer. Int J Oncol. 52:155–165.
2018.PubMed/NCBI
|
|
24
|
Jiang M, Zhuang H, Xia R, Gan L, Wu Y, Ma
J, Sun Y and Zhuang Z: KIF11 is required for proliferation and
self-renewal of docetaxel resistant triple negative breast cancer
cells. Oncotarget. 8:92106–92118. 2017. View Article : Google Scholar : PubMed/NCBI
|
|
25
|
Han JY, Han YK, Park GY, Kim SD, Kim JS,
Jo WS and Lee CG: Bub1 is required for maintaining cancer stem
cells in breast cancer cell lines. Sci Rep. 5:159932015. View Article : Google Scholar : PubMed/NCBI
|
|
26
|
Davidson B, Nymoen DA, Elgaaen BV, Staff
AC, Tropé CG, Kaern J, Reich R and Falkenthal TE: BUB1 mRNA is
significantly co-expressed with AURKA and AURKB mRNA in
advanced-stage ovarian serous carcinoma. Virchows Arch.
464:701–707. 2014. View Article : Google Scholar : PubMed/NCBI
|
|
27
|
Nyati S, Schinske-Sebolt K, Pitchiaya S,
Chekhovskiy K, Chator A, Chaudhry N, Dosch J, Van Dort ME,
Varambally S, Kumar-Sinha C, et al: The kinase activity of the
Ser/Thr kinase BUB1 promotes TGF-beta signaling. Sci Signal.
8:ra12015. View Article : Google Scholar : PubMed/NCBI
|
|
28
|
Li L, Xu DB, Zhao XL and Hao TY:
Combination analysis of Bub1 and Mad2 expression in endometrial
cancer: Act as a prognostic factor in endometrial cancer. Arch
Gynecol Obstet. 288:155–165. 2013. View Article : Google Scholar : PubMed/NCBI
|
|
29
|
Chen Y, Yao Y, Zhang L, Li X, Wang Y, Zhao
L, Wang J, Wang G, Shen D, Wei L and Zhao J: cDNA microarray
analysis and immunohistochemistry reveal a distinct molecular
phenotype in serous endometrial cancer compared to endometrioid
endometrial cancer. Exp Mol Pathol. 91:373–384. 2011. View Article : Google Scholar : PubMed/NCBI
|
|
30
|
Liu D, Xu W, Ding X, Yang Y, Su B and Fei
K: Polymorphisms of CCNB1 associated with the clinical outcomes of
platinum-based chemotherapy in Chinese NSCLC patients. J Cancer.
8:3785–3794. 2017. View Article : Google Scholar : PubMed/NCBI
|
|
31
|
Fang Y, Yu H, Liang X, Xu J and Cai X:
Chk1-induced CCNB1 overexpression promotes cell proliferation and
tumor growth in human colorectal cancer. Cancer Biol Ther.
15:1268–1279. 2014. View Article : Google Scholar : PubMed/NCBI
|
|
32
|
Kim SK, Roh YG, Park K, Kang TH, Kim WJ,
Lee JS, Leem SH and Chu IS: Expression signature defined by
FOXM1-CCNB1 activation predicts disease recurrence in
non-muscle-invasive bladder cancer. Clin Cancer Res. 20:3233–3243.
2014. View Article : Google Scholar : PubMed/NCBI
|
|
33
|
Cai H, Xiang YB, Qu S, Long J, Cai Q, Gao
J, Zheng W and Shu XO: Association of genetic polymorphisms in
cell-cycle control genes and susceptibility to endometrial cancer
among Chinese women. Am J Epidemiol. 173:1263–1271. 2011.
View Article : Google Scholar : PubMed/NCBI
|
|
34
|
Kavlashvili T, Jia Y, Dai D, Meng X, Thiel
KW, Leslie KK and Yang S: Inverse relationship between progesterone
receptor and Myc in endometrial cancer. PLoS One. 11:e01489122016.
View Article : Google Scholar : PubMed/NCBI
|
|
35
|
Noske A, Brandt S, Valtcheva N, Wagner U,
Zhong Q, Bellini E, Fink D, Obermann EC, Moch H and Wild PJ:
Detection of CCNE1/URI (19q12) amplification by in situ
hybridisation is common in high grade and type II endometrial
cancer. Oncotarget. 8:14794–14805. 2017. View Article : Google Scholar : PubMed/NCBI
|
|
36
|
Nakayama N, Nakayama K, Shamima Y,
Ishikawa M, Katagiri A, Iida K and Miyazaki K: Gene amplification
CCNE1 is related to poor survival and potential therapeutic target
in ovarian cancer. Cancer. 116:2621–2634. 2010.PubMed/NCBI
|
|
37
|
Yao Y, Luo J, Sun Q, Xu T, Sun S, Chen M,
Lin X, Qian Q, Zhang Y, Cao L, et al: HOXC13 promotes proliferation
of lung adenocarcinoma via modulation of CCND1 and CCNE1. Am J
Cancer Res. 7:1820–1834. 2017.PubMed/NCBI
|
|
38
|
Shi R, Sun J, Sun Q, Zhang Q, Xia W, Dong
G, Wang A, Jiang F and Xu L: Upregulation of FAM83D promotes
malignant phenotypes of lung adenocarcinoma by regulating cell
cycle. Am J Cancer Res. 6:2587–2598. 2016.PubMed/NCBI
|
|
39
|
Krivega MV, Geens M, Heindryckx B,
Santos-Ribeiro S, Tournaye H and Van de Velde H: Cyclin E1 plays a
key role in balancing between totipotency and differentiation in
human embryonic cells. Mol Hum Reprod. 21:942–956. 2015. View Article : Google Scholar : PubMed/NCBI
|
|
40
|
Xiao J, He B, Zou Y, Chen X, Lu X, Xie M,
Li W, He S, You S and Chen Q: Prognostic value of decreased FOXP1
protein expression in various tumors: A systematic review and
meta-analysis. Sci Rep. 6:304372016. View Article : Google Scholar : PubMed/NCBI
|
|
41
|
Hu Z, Zhu L, Tan M, Cai M, Deng L, Yu G,
Liu D, Liu J and Lin B: The expression and correlation between the
transcription factor FOXP1 and estrogen receptors in epithelial
ovarian cancer. Biochimie. 109:42–48. 2015. View Article : Google Scholar : PubMed/NCBI
|
|
42
|
Cui R, Guan Y, Sun C, Chen L, Bao Y, Li G,
Qiu B, Meng X, Pang C and Wang Y: A tumor-suppressive microRNA,
miR-504, inhibits cell proliferation and promotes apoptosis by
targeting FOXP1 in human glioma. Cancer Lett. 374:1–11. 2016.
View Article : Google Scholar : PubMed/NCBI
|
|
43
|
Giatromanolaki A, Koukourakis MI, Sivridis
E, Gatter KC, Harris AL and Banham AH: Loss of expression and
nuclear/cytoplasmic localization of the FOXP1 forkhead
transcription factor are common events in early endometrial cancer:
Relationship with estrogen receptors and HIF-1alpha expression. Mod
Pathol. 19:9–16. 2006. View Article : Google Scholar : PubMed/NCBI
|
|
44
|
Han L, Wang W, Ding W and Zhang L: MiR-9
is involved in TGF-β1-induced lung cancer cell invasion and
adhesion by targeting SOX7. J Cell Mol Med. 21:2000–2008. 2017.
View Article : Google Scholar : PubMed/NCBI
|
|
45
|
Wang H, Wu Q, Zhang Y, Zhang HN, Wang YB
and Wang W: TGF-β1-induced epithelial-mesenchymal transition in
lung cancer cells involves upregulation of miR-9 and downregulation
of its target, E-cadherin. Cell Mol Biol Lett. 22:222017.
View Article : Google Scholar : PubMed/NCBI
|
|
46
|
Liu DZ, Chang B, Li XD, Zhang QH and Zou
YH: MicroRNA-9 promotes the proliferation, migration, and invasion
of breast cancer cells via down-regulating FOXO1. Clin Transl
Oncol. 19:1133–1140. 2017. View Article : Google Scholar : PubMed/NCBI
|