Introduction
Reactive oxygen species (ROS) have traditionally
been viewed as an undesirable metabolic byproduct, which are
principally generated by the mitochondrial respiratory chain and
plasma membrane enzyme system (1).
In obesity and type 2 diabetes mellitus, a high caloric diet causes
a surplus of reducing equivalents, increasing electron transport in
the mitochondrial respiratory chain and ROS generation (2–4).
Other studies show that the endoplasmic reticulum (ER) is a
potentially important source of ROS (2,5,6). The
ER is an important site of protein folding and disulfide bond
formation in eukaryotic organisms (7). The oxidation of cysteine residues and
the release of electrons are involved in the formation of disulfide
bonds, which results in the production of superoxide anions
(O2•−) and other ROS (2,5).
However, nutrient excess might overload the protein-folding ability
of the ER and cause chronic ROS generation, resulting in insulin
resistance, obesity and type 2 diabetes mellitus (2). Therefore, chronic ROS generation and
oxidative stress can suppress the insulin response and contribute
to the development of insulin resistance.
Although intercellular chronic oxidative stress
induces insulin resistance in obesity and type 2 diabetes mellitus,
ROS have an important role in insulin-regulated glucose and lipid
metabolism (1,8,9).
Previous studies reported that insulin activates nicotinamide
adenine dinucleotide phosphate (NADPH) oxidase in the plasma
membrane, leading to hydrogen peroxide (H2O2)
generation (10,11). The protein tyrosine phosphatase
(PTP) family is oxidized and inactivated by ROS, which are
dephosphorylases and catalyze the dephosphorylation of
tyrosyl-phosphorylated proteins (12). Phosphatase and tensin homologue
deleted on chromosome 10 (PTEN), one member of the PTP family, can
dephosphorylate phosphatidylinositol-3-phosphate (PIP),
phosphatidylinositol-3,4-bisphosphate (PIP2) and
phosphatidylinositol-3,4,5-triphosphate (PIP3) in
vitro, while it is likely that PIP3 is the most
important substrate in vivo (13,14).
Activation of insulin-induced phosphoinositide-3 kinase (PI3-K)
catalyzes PIP3 generation to induce the phosphorylation
and activation of protein kinase B (AKT) (15,16).
Thus, PTEN and PI3-K have opposing effects on PIP3
content (17), and inactivation of
PTEN enhances insulin-stimulated metabolic effects (18).
In insulin-signaling processes, insulin-induced
insulin receptor (IR) phosphorylates insulin receptor substrate
(IRS) proteins, which further phosphorylate the PI3-K regulatory
subunit and activate the PI3-K catalytic subunit. PI3-K activation
converts PIP2 to PIP3, which results in the
activation of AKT (19).
Subsequently, PI3-K/AKT signaling regulates glucose uptake,
glycogen synthesis and lipid synthesis (15). In adipose cells and tissues,
insulin-activated AKT signaling pathways promotes glucose
transporter 4 (GLUT4) translocation to the cell membrane,
increasing extracellular glucose uptake (20). However, GLUT4 defects or reduced
expression in adipose cells and tissues can cause insulin
resistance and metabolic syndrome in mouse models and patients
(21,22). Thus, regulation of glucose uptake
in fatty tissues has an important role in the development of
whole-body insulin resistance and type 2 diabetes mellitus. In the
present study, we find that transient H2O2
stimulation increases insulin sensitivity in 3T3-L1 adipocytes.
H2O2 treatment oxidizes and inhibits PTEN,
enhancing insulin-induced AKT phosphorylation, GLUT4 translocation
and glucose uptake in 3T3-L1 adipocytes. However, chronic ROS
exposure attenuates the insulin-stimulated AKT signaling pathway
and causes insulin resistance in 3T3-L1 adipocytes. Our data
indicate different effects of ROS on insulin-regulated signaling
pathways in 3T3-L1 adipocytes.
Materials and methods
Materials
Dulbecco's modified Eagle's medium/Ham's nutrient
mixture F12 (DMEM/F12) were purchased from Gibco Co. Ltd, Grand
Island, NY, USA. Methylisobutylxanthine, dexamethasone and insulin
were purchased from Tocris Bioscience (Bristol, UK). Oil Red O,
[2-(N-(7-nitrobenz-2-oxa-1,3-diazol-4-yl) amino)-2-deoxyglucose]
(2-NBDG), N-acetylcysteine (NAC), N-ethylmaleimide (NEM) and
glucose oxidase were purchased from Sigma-Aldrich (St. Louis, MO,
USA). H2O2 was purchased from Guangzhou
Chemical Reagent Factory, (Guangzhou, China). H2DCFDA
and MitoTracker Red were purchased from Thermo Fisher Scientific,
Inc. (Pittsburgh, PA, USA). Anti-PTEN (cat. no. 5384),
anti-phospho-Thr308/309-AKT [AKT (T308/309P); cat. no. 13038)],
anti-phospho-Ser473/474-AKT [AKT (S473/474P); cat. no. 9271)],
anti-total-AKT (cat. no. 9272) and anti-GLUT4 (cat. no. 2213) were
procured from Cell Signaling Technology, Inc. (Danvers, MA, USA).
Anti-β-actin (sc-47778) was purchased from Santa Cruz Biotechnology
(Santa Cruz, CA, USA). Goat Anti-Mouse IgG H&L (Alexa Fluor
680; ab175775), Goat Anti-Rabbit IgG H&L (Alexa Fluor 790;
ab175781), Goat Anti-Mouse IgG H&L (Alexa Fluor 555; ab150114)
and Goat Anti-Rabbit IgG H&L (Alexa Fluor 488; ab150077) were
purchased from Abcam (Cambridge, MA, USA).
Cell culture and differentiation
The 3T3-L1 preadipocytes were obtained from the
Chinese Academy of Science Cell Library (Shanghai, China). 3T3-L1
preadipocytes were cultured and differentiated into 3T3-L1
adipocytes as described previously (23). The preadipocytes were grown and
maintained in DMEM/F12 containing 10% fetal bovine serum (FBS), 100
Us/ml penicillin and 100 µl/ml streptomycin in a 5% CO2,
37°C constant temperature/humidity incubator. When the cells had
reached confluence, the cells were transferred to differential
medium, DMEM/F12 containing 10% FBS, 0.5 mM methylisobutylxanthine,
0.25 µM dexamethasone and 1 µg/ml insulin, for 2 days, and then
were incubated in DMEM/F12 containing 10% FBS and insulin (1 µg/ml)
for 2 days. Subsequently, the cells were cultured in 10%
FBS-DMEM/F12 medium. The 3T3-L1 adipocytes were experimented upon 8
days after differentiation.
Oil Red O staining
Oil Red O staining was performed as described
previously (24). Briefly, the
cells were washed with phosphate-buffered saline (PBS), and then
fixed in 4% paraformaldehyde for 30 min. Subsequently, the cells
were incubated with Oil Red O working solution for 10 min at room
temperature, and rinsed under running tap water for 20 min.
Finally, cells were sealed with nail polish and checked using a
light microscope.
ROS treatment
For transient ROS treatment, 3T3-L1 adipocytes were
incubated with serum-free medium supplemented with 100 µM
H2O2 for 15 min. Then, the cells were used
for further experiments. For chronic ROS treatment, the cells were
exposed to fresh medium with 100 mU/ml glucose oxidase. Glucose
oxidase catalyzed the conversion of glucose to glucuronic acid and
H2O2, which generated about 40 µM
H2O2 for 24 h (25). Then, the cells were used for
further experiments.
Detection of intercellular ROS
3T3-L1 adipocytes were treated with 100 µM
H2O2 or 10 nM insulin for 15 min and washed
with PBS. Pretreatment with 200 µM NAC was performed for 30 min
before H2O2 or insulin. Subsequently, the
cells were incubated with 20 µM H2DCFDA for 15 min.
Then, the cells were detected using the LSM510 confocal microscope
(Zeiss, Jena, Germany), or were harvested and detected using flow
cytometry sorting (FACS; BD Biosciences, Franklin Lakes, NJ,
USA).
Glucose uptake and consumption
assay
Glucose uptake was performed as described previously
(26). In brief, 3T3-L1 adipocytes
were starved in free-serum medium for 12 h, then treated with or
without H2O2 or/and insulin for 30 min.
Glucose uptake was measured using 2-NBDG. The cells were incubated
with 10 mM 2-NBDG in PBS for 15 min at 37°C and extracted using a
lysis buffer. 2-NBDG content was detected using a microplate
fluorimeter (Infinite M200; Tecan, Hillsborough, NC, USA). Glucose
consumption in the medium was performed using the Glucose Oxidase
Method (GOM; Applygen Technologies Inc., Beijing, China). The cells
were cultured in fresh serum-free medium for 3 h after the
different treatments. The glucose content in the medium was
determined using GOM.
Immunofluorescence
3T3L-L1 adipocytes were subjected to different
stimulations, then fixed with 4% paraformaldehyde for 30 min,
permeabilized with methanol for 15 min, and incubated with anti-AKT
(S473/4P) (1:300) and anti-β-actin (1:300) at 4°C overnight. Then,
the cells were incubated with Goat Anti-Mouse IgG H&L (Alexa
Fluor 555; 1:300) for β-actin and Goat Anti-Rabbit IgG H&L
(Alexa Fluor 488; 1:300) for AKT (S473/4P) for 3 h at room
temperature. The cells were detected using confocal microscopy.
Immunoblot analysis
Immunoblot analysis was performed as described
previously (27). In brief, 3T3-L1
adipocytes were lysed using RIPA buffer (50 mM Tris-HCl (pH 8.0),
150 mM NaCl, 0.1% SDS, 1% NP-40, 5 mM EDTA, and 0.5% sodium
deoxycholate) containing 1 mM PMSF. For the PTEN examination, cells
were lysed with RIPA buffer containing 40 mM NEM and 1 mM PMSF. The
total cell lysates were loaded onto SDS-PAGE gels and transferred
to a PVDF membrane (Millipore, Billerica, MA, USA), which was
incubated in the primary antibodies and the secondary antibodies.
The results were detected with an ODYSSEY Infrared Imaging System
(LI-COR Biosciences, Lincoln, NE, USA).
Cytoplasm and membrane fractions
Cytoplasm and membrane fractions were obtained as
described previously (28).
Briefly, 3T3-L1 adipocytes were homogenized in buffer 1 (10 mM
Tris-HCl, 2 mM MgCl2, 0.2 M sucrose, 0.5 mM EDTA, pH
7.5) and centrifuged at 1,000 g for 10 min. The supernatant was
centrifuged at 100,000 g for 40 min to obtain the cytoplasm
fraction. The pellet was homogenized in buffer 2 (6 mM Tris-HCl, 1
mM EDTA, pH 8.0), centrifuged at 100,000 g 40 min, and then
resuspended in buffer 3 (20 mM Tris-HCl, 1 mM EDTA, pH 7.5) and
centrifuged at 100,000 g for 40 min to obtain the membrane
fraction.
Statistical analysis
All experiments were performed three times
independently. Results were presented as means ± standard error
mean. Statistical analysis was performed using SPSS 13.0 software
(SPSS, Inc., Chicago IL, USA) and significant differences were
determined by Student's t-test or one-way analysis of variance with
Tukey's post hoc test. P<0.05 was considered to indicate a
statistically significant difference.
Results
H2O2 disrupts
the intracellular redox balance in a manner similar to insulin
stimulation
3T3-L1 preadipocytes are derived from mouse embryos
and are a fibroblast cell type. The cells are differentiated into
3T3-L1 adipocytes, which exhibit characteristics of adipose cells,
including the expression of lipid metabolic genes and the
production of lipid droplets (29). Thus, this cell line is often used
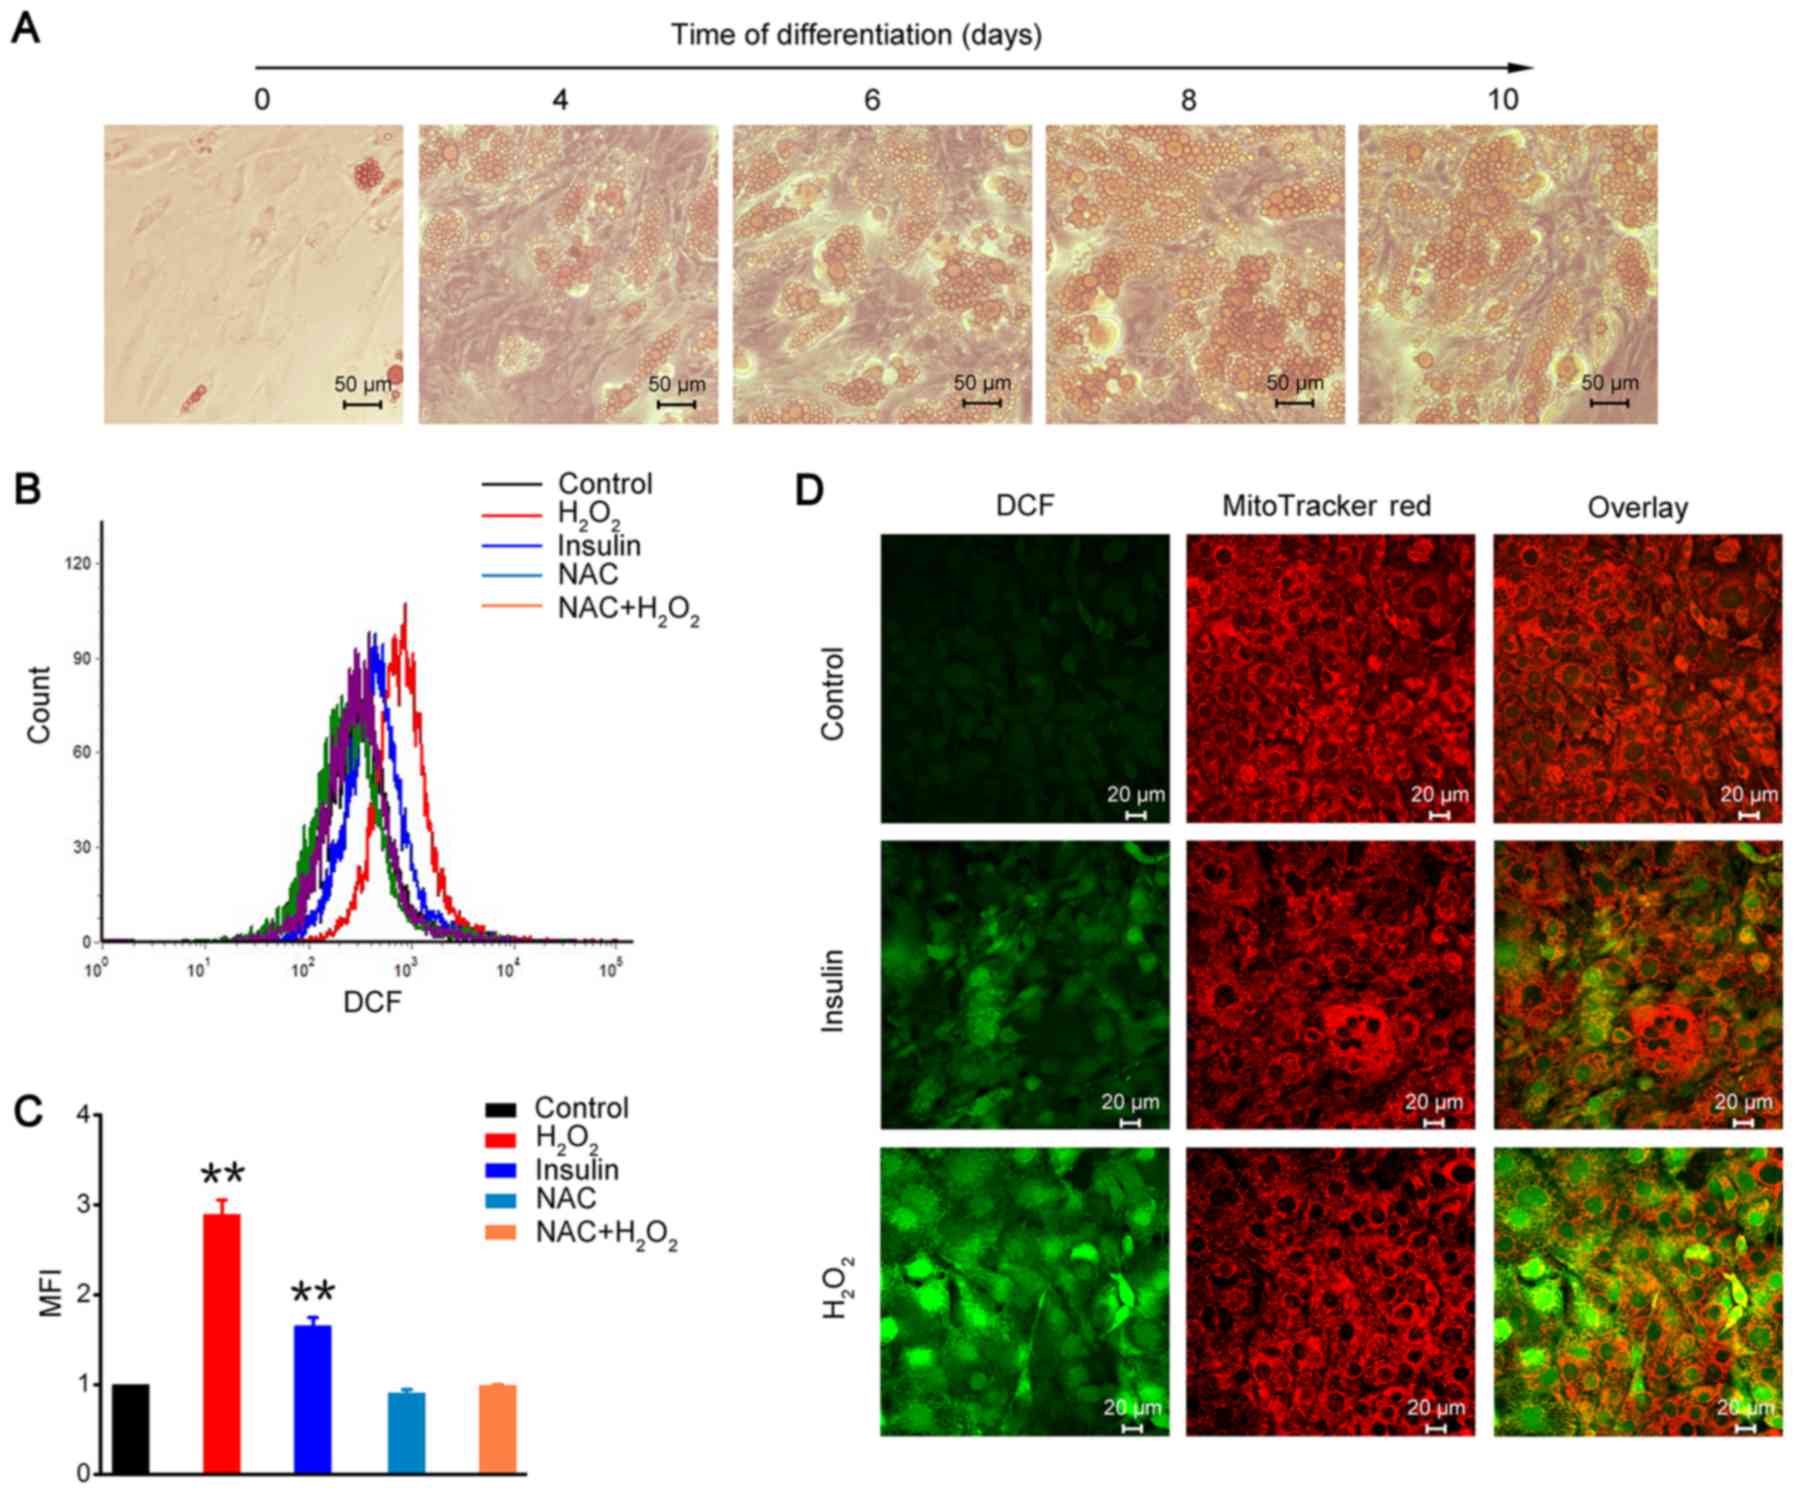
in lipid metabolic studies on adipose tissue. As shown in Fig. 1A, 3T3-L1 preadipocytes appeared to
have a fusiform and flattened fibroblastic morphology, and
converted into a ‘rounded-up’ morphology after differentiation. The
number and size of the lipid droplets visualized by Oil Red O
staining were gradually increased in a differentiating
time-dependent manner (Fig. 1A).
The 3T3-L1 adipocytes of 8-day differentiation were used in the
subsequent experiments.
The oxidation sensitive probe H2DCFDA is
often used to examine intracellular ROS levels, and is cleaved by
nonspecific esterases to transform into the
dichlorodihydrofluorescein derivative H2DCF.
H2DCF is oxidized and converts to fluorescent adduct
DCF, and is trapped inside the cell (30,31).
The results of the FACS analysis showed that insulin stimulation
increased ROS generation in 3T3-L1 adipocytes, and
H2O2 could disrupt the intracellular redox
balance and increase intracellular ROS level (Fig. 1B and C). However, the ROS scavenger
NAC inhibited H2O2-induced intracellular ROS
accumulation in 3T3-L1 adipocytes (Fig. 1B and C). Furthermore, we detected
DCF fluorescence using confocal microscope. The results showed that
fluorescence intensity was significantly increased after either
insulin stimulation or H2O2 treatment in
3T3-L1 adipocytes (Fig. 1D). These
results demonstrated that H2O2, similar to
insulin treatment, could increase intracellular ROS generation and
change the redox balance in 3T3-L1 adipocytes.
Insulin sensitivity is improved in
3T3-L1 adipocytes after transient H2O2
treatment
PTEN can catalyze the dephosphorylation of
PIP3, preventing insulin-induced PI3-K signaling to AKT
and downstream of AKT (12,23).
However, PTEN, as one of the important targets of ROS, is oxidized
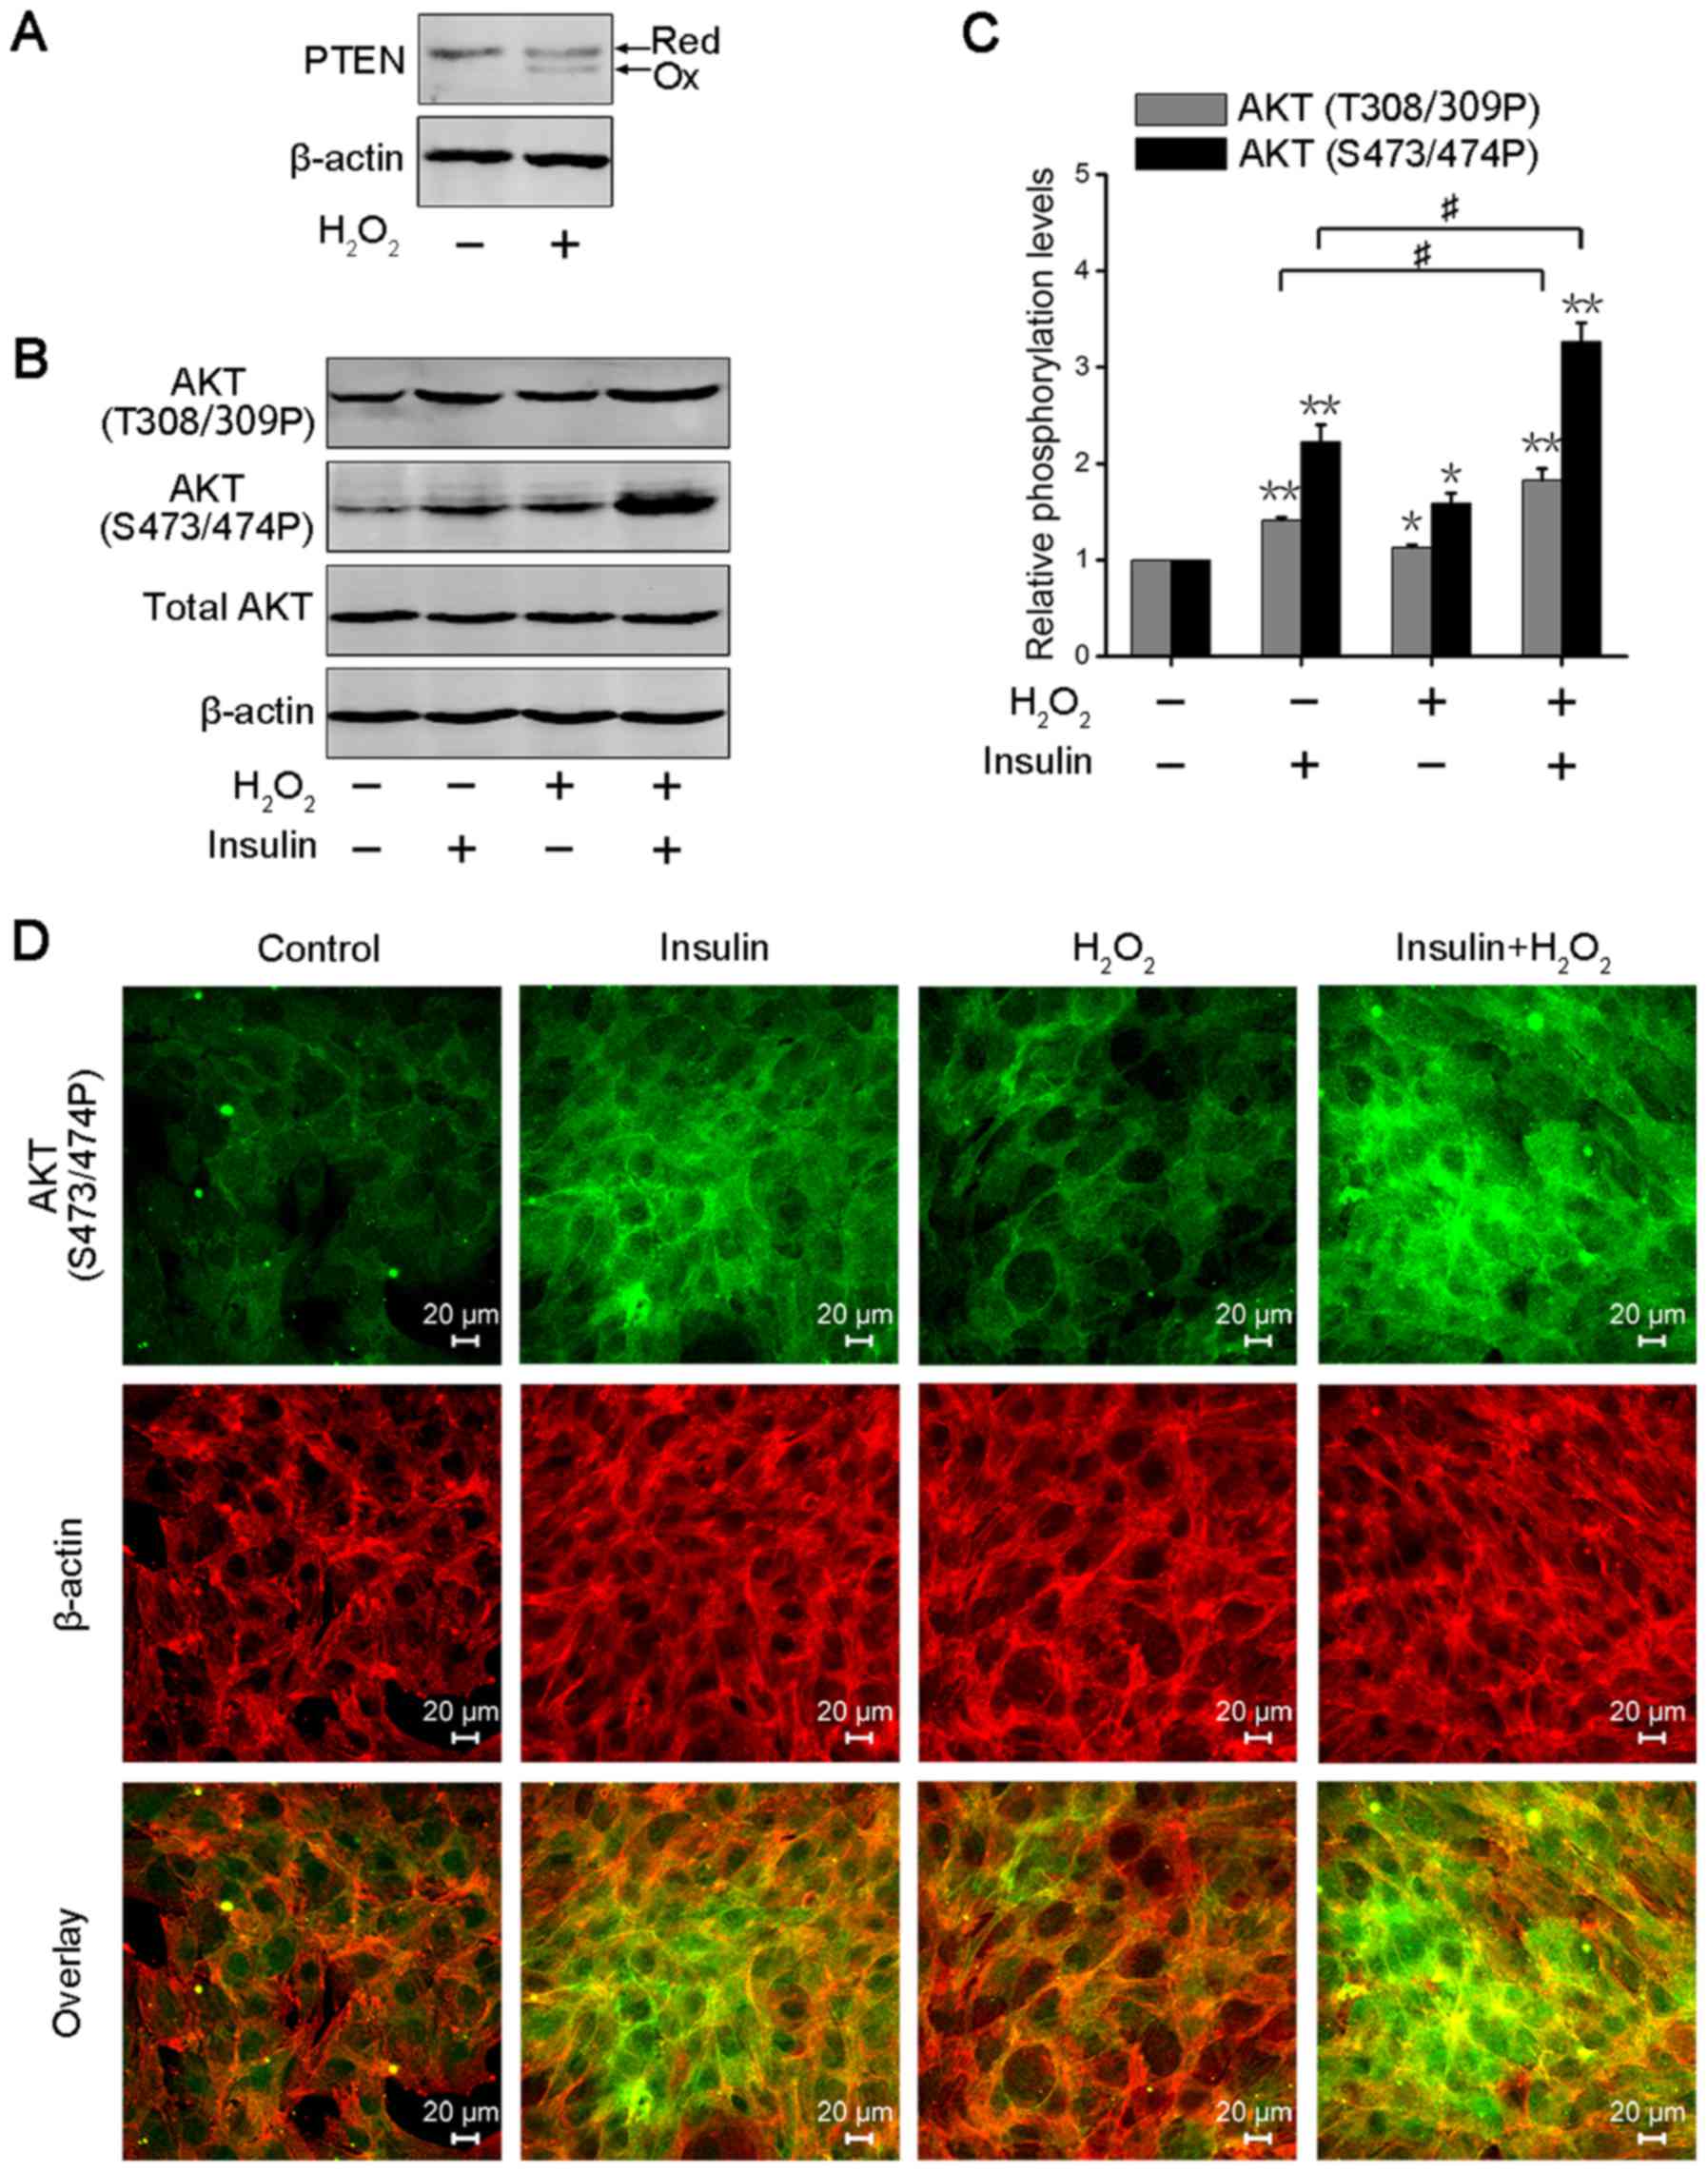
at cysteine residues and inactivated (27). Thus, we analyzed PTEN oxidation in
3T3-L1 adipocytes after transient H2O2
treatment. The cells were lysed in a buffer containing NEM to block
free sulfhydryl groups, leading to increasing electrophoretic
mobility in the oxidized form of PTEN. As shown in Fig. 2A, transient
H2O2 treatment significantly increased PTEN
oxidation in 3T3-L1 adipocytes. The PI3-K/AKT signaling axis
regulates insulin-induced metabolic action, including glucose
uptake, glycogen synthesis and lipid synthesis (32). Thus, AKT phosphorylation is often
used to evaluate the activity of insulin signaling in
insulin-response tissues or cells (33). AKT1/2 are activated via
phosphorylation of Thr308/309 residues in the catalytic domain and
Ser473/474 residues in the hydrophobic motif (34). We further detected AKT
phosphorylation levels at Thr308/309 and Ser473/474 residues in
3T3-L1 adipocytes after transient H2O2 or/and
insulin treatment. The result showed that the phosphorylation
levels of AKT were significantly enhanced in insulin or/and
transient H2O2-treated 3T3-L1 adipocytes, and
that co-treatment with insulin and H2O2
promoted increased AKT phosphorylation compared with insulin
stimulation (Fig. 2B). The
statistical analysis was consistent with this result (Fig. 2C). Immunofluorescence analysis also
revealed that transient H2O2 treatment
enhanced the activation of insulin-induced AKT in 3T3-L1 adipocytes
(Fig. 2D). These data suggested
that transient H2O2 could enhance AKT
activation through the oxidation and inactivation of PTEN, and
improve insulin sensitivity in 3T3-L1 adipocytes.
Transient H2O2
increases insulin-induced GLUT4 translocation and glucose uptake in
3T3-L1 adipocytes
We further analyzed the activation level of
AKT-downstream signaling after different treatments in 3T3-L1
adipocytes. GLUT4, which is glucose transport protein that is
highly expressed in adipose tissues, shifts from its intracellular
location to the cell membrane via insulin-stimulated AKT signaling
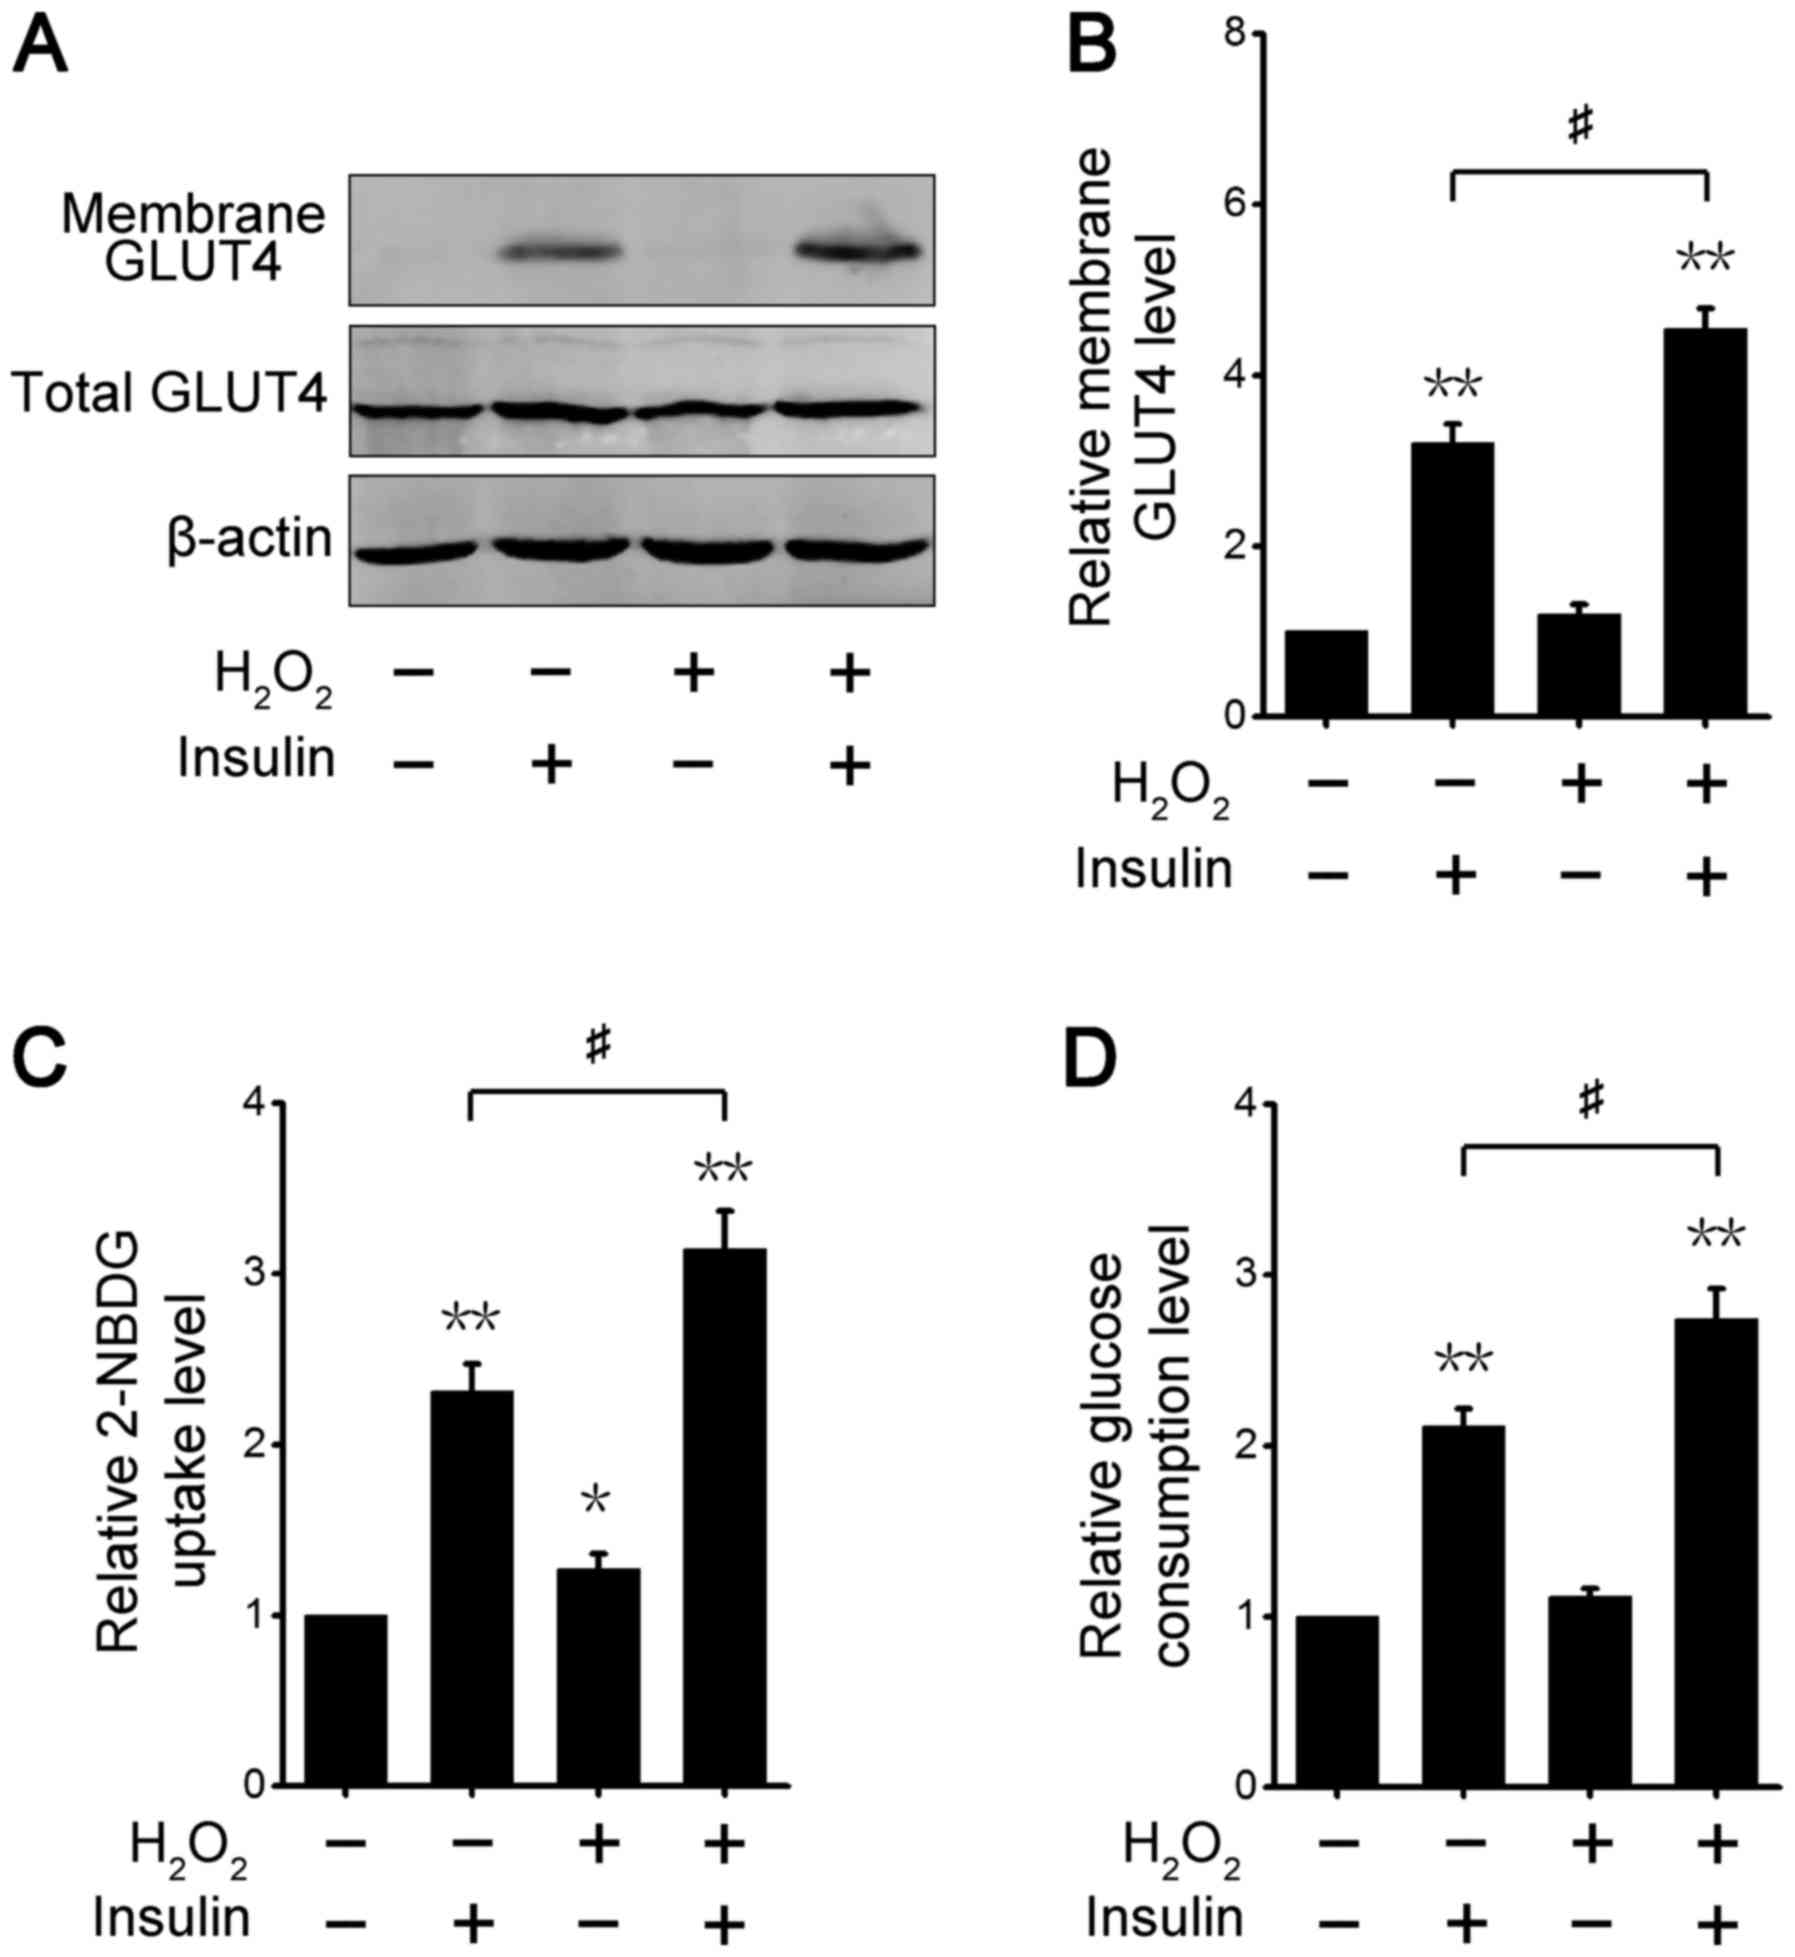
(35). The cytoplasm and membrane
fractions assay showed that insulin increased GLUT4 translocation
to the cell membrane, and co-treatment with both insulin and
transient H2O2 also significantly enhanced
GLUT4 redistribution in 3T3-L1 adipocytes (Fig. 3A). Consistent with this result,
quantitative analysis revealed that the GLUT4 protein level at the
cell surface was increased after insulin or/and transient
H2O2 treatment, and the translocation effect
with insulin and H2O2 co-treatment was more
marked than with single insulin treatment (Fig. 3B). These results demonstrated that
transient ROS increases the effect of insulin on the regulation of
GLUT4 protein expression in 3T3-L1 adipocytes.
We next examined changes in glucose uptake ability
in 3T3-L1 adipocytes treated with insulin or/and transient
H2O2. The level of intracellular 2-NBDG, a
fluorescent glucose, was measured, and the results indicated that
the 2-NBDG uptake level was significantly raised in 3T3-L1
adipocytes treated with insulin or/and transient
H2O2 (Fig.
3C). The effect was best after co-stimulation with both insulin
and H2O2 (Fig.
3C). Likewise, we examined the glucose consumption level in the
culture medium. The results showed that the three different
treatments led to increases in glucose utilization, and transient
H2O2 markedly enhanced insulin-induced
glucose consumption in the culture medium (Fig. 3D). These results demonstrated that
transient ROS increased the insulin-stimulated glucose uptake
level, suggesting that the insulin sensitivity of adipocytes is
elevated by transient ROS.
Chronic H2O2
caused insulin resistance in 3T3-L1 adipocytes
The above data suggested that transient ROS
treatment could enhance insulin-regulated metabolic effects
(Figs. 2 and 3), thus we further explored metabolic
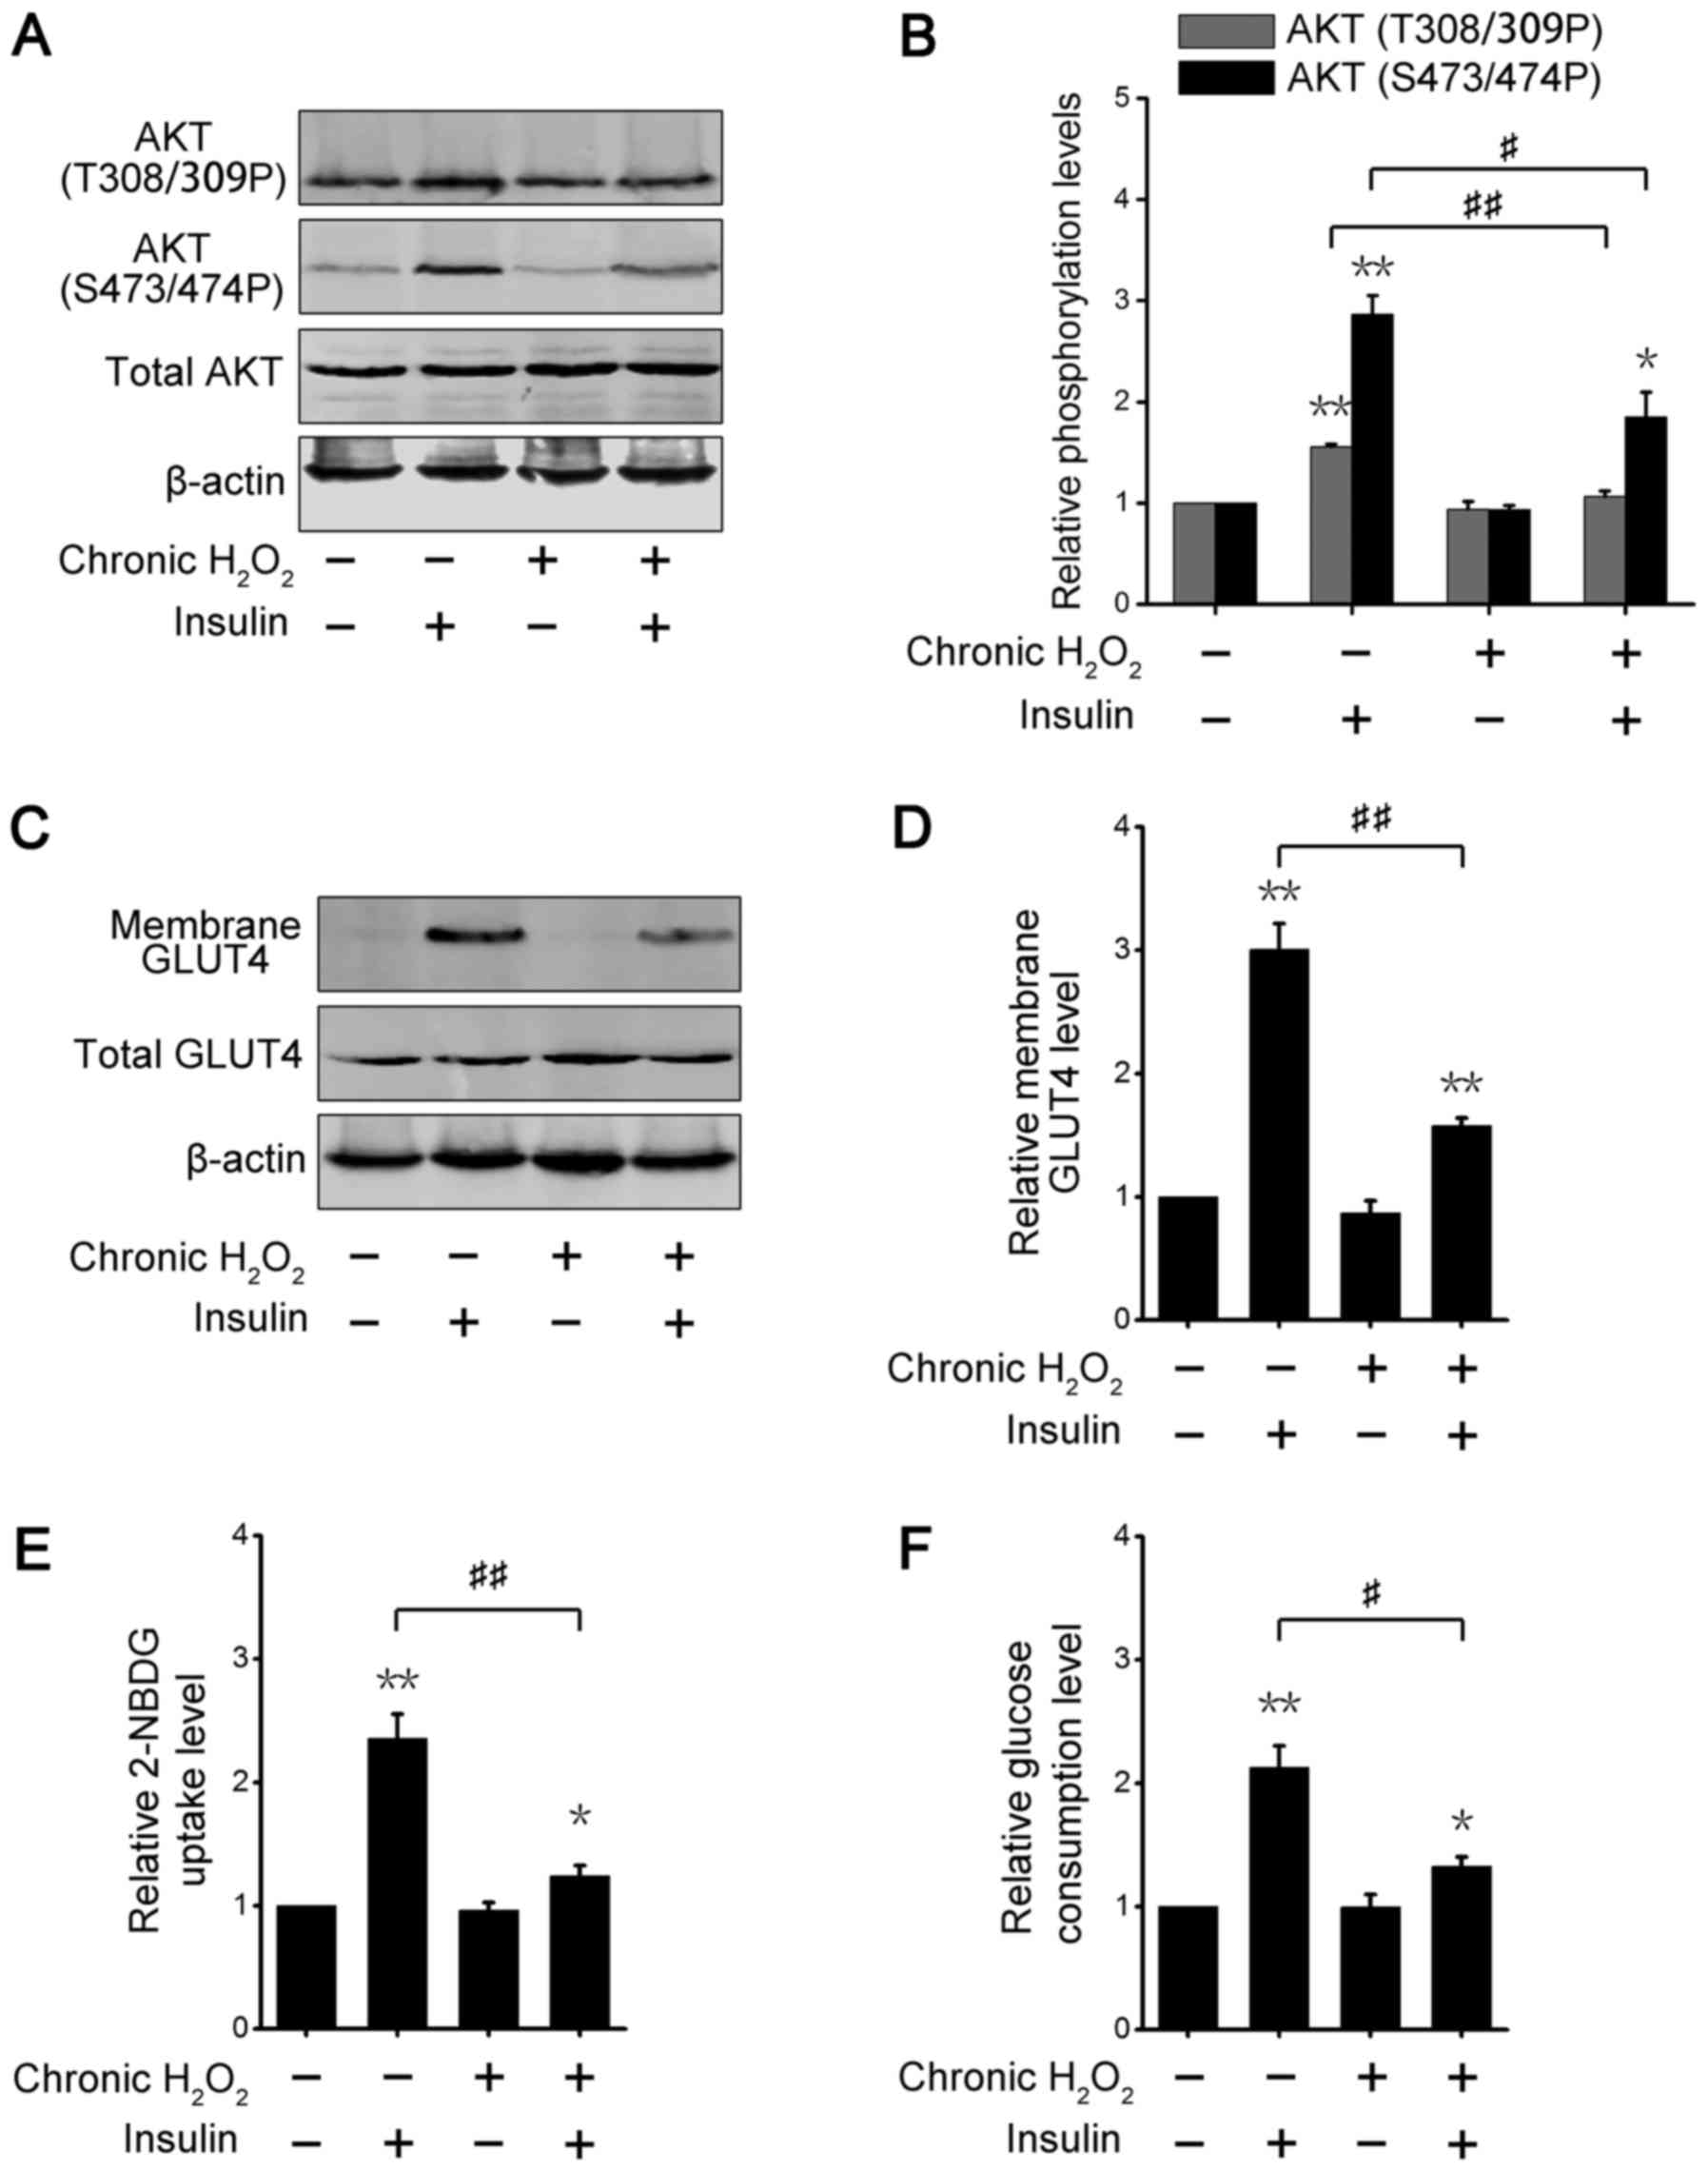
alterations in adipose cells after chronic ROS exposure. As shown
in Fig. 4A, incubation with
glucose oxidase, which catalyzed the conversion of glucose to
glucuronic acid and H2O2, did not change
basic AKT phosphorylation levels; however, the phosphorylation
levels of insulin-induced AKT in chronic ROS-treated adipocytes
were significantly decreased. Densitometry analysis of
phosphorylated AKT also produced the similar results (Fig. 4B). These data suggested that
chronic ROS stimulation damaged 3T3-L1 adipocytes in response to
insulin. The cytoplasm and membrane fractions assay showed the
insulin-stimulated GLUT4 translocation to the cell surface was
lower in chronic glucose oxidase-incubated adipocytes than in
non-incubated cells (Fig. 4C and
D). We further examined the changes in glucose absorption in
3T3-L1 adipocytes under chronic ROS treatment. Insulin promoted
2-NBDG uptake in 3T3-L1 adipocytes incubated with or without
glucose oxidase; however, the capability of insulin-stimulated
2-NBDG absorption in chronic ROS-treated adipocytes was strikingly
decreased (Fig. 4E). Consistent
with this result, glucose consumption was also reduced in
insulin-stimulated 3T3-L1 adipocytes incubated with glucose
oxidase, compared with enzyme-free incubation (Fig. 4F). These results demonstrated that
chronic ROS exposure impaired the insulin sensitivity of 3T3-L1
adipocytes.
Discussion
About 40 years ago, many studies reported that
insulin can elicit ROS generation in skeletal muscles, adipose
tissues, the liver and other target tissues and cells (36). Insulin activates NADPH oxidase,
which is a plasma membrane enzyme, leading to
H2O2 production (10,11,36).
Our data also showed that insulin increased the intracellular ROS
content in 3T3-L1 adipocytes. ROS oxidize and inactivate PTPs, such
as PTEN and protein-tyrosine phosphatase-1b (PTP1b), which
dephosphorylate insulin-induced phosphorylation to block insulin
signaling (12,18,23).
However, catalytic activation of PTPs depends on cysteine residues,
which are highly susceptible to reversible oxidation and
inactivation by ROS (37). A
previous study further revealed that an increase in intracellular
ROS content enhances insulin regulatory functions, but ROS
scavengers attenuate these effects (18). Co-treatment with both
H2O2 and insulin led to stronger metabolic
regulation, including AKT activation, GLUT4 translocation and
glucose uptake, compared with the single-insulin stimulation. Thus,
transient and acute ROS treatment improves insulin sensitivity in
adipose cells.
Although ROS have important roles in
insulin-regulated metabolic pathways, chronic ROS or oxidative
stress could cause activation of intracellular stress-sensitive
pathways, resulting in insulin resistance and glucose-lipid
metabolic diseases (38,39). ROS activate mitogen-activated
protein kinases (MAPKs), such as c-Jun N-terminal kinase (JNK),
through oxidation and inactivation of MAPK phosphatases (2). Many studies have also revealed that
ROS activate apoptosis signal-regulating kinase 1 (ASK1) by
oxidizing thioredoxin (TRX), which binds and inhibits ASK1
activation, leading to activation of the JNK signaling pathway
(40,41). In addition, ROS also activate
inhibitor of nuclear factor κ-B kinase subunit β (IKKβ) through Src
and Abl tyrosine kinase signaling pathway (42). ROS-activated JNK and IKKβ
phosphorylate IRS1 at Ser 302, 307 and 612 sites to block IRS1
binding to the IR and promote IRS1 degradation, resulting in
attenuation of the delivery of insulin signaling (43). Therefore, chronic ROS treatment can
induce and contribute to insulin resistance.
In conclusion, here we clarified that transient
H2O2 enhances insulin sensitivity in 3T3-L1
adipocytes. Mechanistically, H2O2 treatment
may enhance insulin-stimulated AKT activation through the oxidation
and inactivation of PTEN compared with single insulin treatment,
resulting in increased GLUT4 translocation and glucose uptake.
Overall this study provides evidence to better understand the
function of ROS in insulin signaling pathways in adipose cells.
Acknowledgements
Not applicable.
Funding
The present study was supported by the National Key
Research and Development Program of China (grant no.
2017YFA0205200), National Natural Science Foundation of China
(grant no. 81571785 and 81771957) and Natural Science Foundation of
Guangdong Province, China (grant nos. 2016A030311055 and
2016A030313770).
Availability of data and materials
The datasets used and analyzed during the current
study are available from the corresponding author on reasonable
request.
Authors' contributions
LLuo, LLu and MM conceived and designed the
research. MM, YQ, YL, XH, JX, MZ, WZ and YX performed the
experiments. MM processed and analyzed the experimental results. MM
and YQ wrote the manuscript. All authors read and approved the
manuscript.
Ethics approval and consent to
participate
Not applicable.
Consent for publication
Not applicable.
Competing interests
The authors declare that they have no competing
interests.
Glossary
Abbreviations
Abbreviations:
|
ROS
|
reactive oxygen species
|
|
PTEN
|
phosphatase and tensin homologue
deleted on chromosome 10
|
|
GLUT4
|
glucose transporter 4
|
|
ER
|
endoplasmic reticulum
|
|
PTPs
|
protein tyrosine phosphatases
|
|
PI3K
|
phosphoinositide-3 kinase
|
|
IR
|
insulin receptor
|
|
IRS
|
insulin receptor substrate
|
|
NAC
|
N-acetylcysteine
|
|
NEM
|
N-ethylmaleimide
|
|
FBS
|
fetal bovine serum
|
|
PTP1b
|
protein-tyrosine phosphatase-1b
|
|
MAPKs
|
mitogen-activated protein kinases
|
|
JNK
|
c-Jun N-terminal kinase
|
|
ASK1
|
apoptosis signal-regulating kinase
1
|
|
TRX
|
oxidizing thioredoxin
|
|
MFI
|
mean fluorescence intensity
|
|
MTR
|
MitoTraker Deeper Red
|
|
PBS
|
phosphate-buffered saline
|
|
NADPH
|
nicotinamide adenine dinucleotide
phosphate
|
|
H2O2
|
hydrogen peroxide
|
|
IKKβ
|
nuclear factor κ-B kinase subunit
β
|
References
|
1
|
Turrens JF: Mitochondrial formation of
reactive oxygen species. J Physiol. 552:335–344. 2003. View Article : Google Scholar : PubMed/NCBI
|
|
2
|
Tiganis T: Reactive oxygen species and
insulin resistance: The good, the bad and the ugly. Trends
Pharmacol Sci. 32:82–89. 2011. View Article : Google Scholar : PubMed/NCBI
|
|
3
|
Nishikawa T and Araki E: Impact of
mitochondrial ROS production in the pathogenesis of diabetes
mellitus and its complications. Antioxid Redox Signal. 9:343–353.
2007. View Article : Google Scholar : PubMed/NCBI
|
|
4
|
Newsholme P, Haber EP, Hirabara SM,
Rebelato EL, Procopio J, Morgan D, Oliveira-Emilio HC, Carpinelli
AR and Curi R: Diabetes associated cell stress and dysfunction:
Role of mitochondrial and non-mitochondrial ROS production and
activity. J Physiol. 583:9–24. 2007. View Article : Google Scholar : PubMed/NCBI
|
|
5
|
Riemer J, Bulleid N and Herrmann JM:
Disulfide formation in the ER and mitochondria: Two solutions to a
common process. Science. 324:1284–1287. 2009. View Article : Google Scholar : PubMed/NCBI
|
|
6
|
Panzhinskiy E, Ren J and Nair S: Protein
tyrosine phosphatase 1B and insulin resistance: role of endoplasmic
reticulum stress/reactive oxygen species/nuclear factor kappa B
axis. PLoS One. 8:e772282013. View Article : Google Scholar : PubMed/NCBI
|
|
7
|
Freedman RB, Hirst TR and Tuite MF:
Protein disulphide isomerase: Building bridges in protein folding.
Trends Biochem Sci. 19:331–336. 1994. View Article : Google Scholar : PubMed/NCBI
|
|
8
|
Figueira TR, Barros MH, Camargo AA,
Castilho RF, Ferreira JC, Kowaltowski AJ, Sluse FE, Souza-Pinto NC
and Vercesi AE: Mitochondria as a source of reactive oxygen and
nitrogen species: From molecular mechanisms to human health.
Antioxid Redox Sign. 18:2029–2074. 2013. View Article : Google Scholar
|
|
9
|
Bedard K and Krause KH: The NOX family of
ROS-generating NADPH oxidases: Physiology and pathophysiology.
Physiol Rev. 87:245–313. 2007. View Article : Google Scholar : PubMed/NCBI
|
|
10
|
Mukherjee SP, Lane RH and Lynn WS:
Endogenous hydrogen peroxide and peroxidative metabolism in
adipocytes in response to insulin and sulfhydryl reagents. Biochem
Pharmacol. 27:2589–2594. 1978. View Article : Google Scholar : PubMed/NCBI
|
|
11
|
May JM and de Haën C: Insulin-stimulated
intracellular hydrogen peroxide production in rat epididymal fat
cells. J Biol Chem. 254:2214–2220. 1979.PubMed/NCBI
|
|
12
|
Seo JH, Ahn Y, Lee SR, Yeo Yeol C and Hur
Chung K: The major target of the endogenously generated reactive
oxygen species in response to insulin stimulation is phosphatase
and tensin homolog and not phosphoinositide-3 kinase (PI-3 kinase)
in the PI-3 kinase/Akt pathway. Mol Biol Cell. 16:348–357. 2005.
View Article : Google Scholar : PubMed/NCBI
|
|
13
|
Gericke A, Munson M and Ross AH:
Regulation of the PTEN phosphatase. Gene. 374:1–9. 2006. View Article : Google Scholar : PubMed/NCBI
|
|
14
|
Ross AH and Gericke A: Phosphorylation
keeps PTEN phosphatase closed for business. Proc Natl Acad Sci USA.
106:1297–1298. 2009. View Article : Google Scholar : PubMed/NCBI
|
|
15
|
Taniguchi CM, Emanuelli B and Kahn CR:
Critical nodes in signalling pathways: Insights into insulin
action. Nat Rev Mol Cell Biol. 7:85–96. 2006. View Article : Google Scholar : PubMed/NCBI
|
|
16
|
Cantley LC: The phosphoinositide 3-kinase
pathway. Science. 296:1655–1657. 2002. View Article : Google Scholar : PubMed/NCBI
|
|
17
|
Cheng CK, Fan QW and Weiss WA: PI3K
signaling in glioma-animal models and therapeutic challenges. Brain
pathol. 19:112–120. 2009. View Article : Google Scholar : PubMed/NCBI
|
|
18
|
Loh K, Deng H, Fukushima A, Cai X, Boivin
B, Galic S, Bruce C, Shields BJ, Skiba B, Ooms LM, et al: Reactive
oxygen species enhance insulin sensitivity. Cell Metab. 10:260–272.
2009. View Article : Google Scholar : PubMed/NCBI
|
|
19
|
Whelan SA, Dias WB, Thiruneelakantapillai
L, Lane MD and Hart GW: Regulation of insulin receptor substrate 1
(IRS-1)/AKT kinase-mediated insulin signaling by O-Linked
beta-N-acetylglucosamine in 3T3-L1 adipocytes. J Biol Chem.
285:5204–5211. 2010. View Article : Google Scholar : PubMed/NCBI
|
|
20
|
Cong LN, Chen H, Li Y, Zhou L, McGibbon
MA, Taylor SI and Quon MJ: Physiological role of Akt in
insulin-stimulated translocation of GLUT4 in transfected rat
adipose cells. Mol Endocrinol. 11:1881–1890. 1997. View Article : Google Scholar : PubMed/NCBI
|
|
21
|
Favaretto F, Milan G, Collin GB, Marshall
JD, Stasi F, Maffei P, Vettor R and Naggert JK: GLUT4 defects in
adipose tissue are early signs of metabolic alterations in
Alms1GT/GT, a mouse model for obesity and insulin resistance. PLoS
One. 9:e1095402014. View Article : Google Scholar : PubMed/NCBI
|
|
22
|
Chen YH, Heneidi S, Lee JM, Layman LC,
Stepp DW, Gamboa GM, Chen BS, Chazenbalk G and Azziz R: miRNA-93
inhibits GLUT4 and is overexpressed in adipose tissue of polycystic
ovary syndrome patients and women with insulin resistance.
Diabetes. 62:2278–2286. 2013. View Article : Google Scholar : PubMed/NCBI
|
|
23
|
Nakashima N, Sharma PM, Imamura T,
Bookstein R and Olefsky JM: The tumor suppressor PTEN negatively
regulates insulin signaling in 3T3-L1 adipocytes. J Biol Chem.
275:12889–12895. 2000. View Article : Google Scholar : PubMed/NCBI
|
|
24
|
Mehlem A, Hagberg CE, Muhl L, Eriksson U
and Falkevall A: Imaging of neutral lipids by oil red O for
analyzing the metabolic status in health and disease. Nat Protoc.
8:1149–1154. 2013. View Article : Google Scholar : PubMed/NCBI
|
|
25
|
Potashnik R, Bloch-Damti A, Bashan N and
Rudich A: IRS1 degradation and increased serine phosphorylation
cannot predict the degree of metabolic insulin resistance induced
by oxidative stress. Diabetologia. 46:639–648. 2003. View Article : Google Scholar : PubMed/NCBI
|
|
26
|
Yang P, Zhao Y, Zhao L, Yuan J, Chen Y,
Varghese Z, Moorhead JF, Chen Y and Ruan XZ: Paradoxical effect of
rapamycin on inflammatory stress-induced insulin resistance in
vitro and in vivo. Sci Rep. 5:149592015. View Article : Google Scholar : PubMed/NCBI
|
|
27
|
Lee SR, Yang KS, Kwon J, Lee C, Jeong W
and Rhee SG: Reversible inactivation of the tumor suppressor PTEN
by H2O2. J Biol Chem. 277:20336–20342. 2002.
View Article : Google Scholar : PubMed/NCBI
|
|
28
|
Jiang X, Huang L and Xing D:
Photoactivation of Dok1/ERK/PPARγ signaling axis inhibits excessive
lipolysis in insulin-resistant adipocytes. Cell Signal.
27:1265–1275. 2015. View Article : Google Scholar : PubMed/NCBI
|
|
29
|
Bernlohr DA, Bolanowski MA, Kelly TJ Jr
and Lane MD: Evidence for an increase in transcription of specific
mRNAs during differentiation of 3T3-L1 preadipocytes. J Biol Chem.
260:5563–5567. 1985.PubMed/NCBI
|
|
30
|
Turpin SM, Nicholls HT, Willmes DM,
Mourier A, Brodesser S, Wunderlich CM, Mauer J, Xu E, Hammerschmidt
P, Brönneke HS, et al: Obesity-induced CerS6-dependent C16:0
ceramide production promotes weight gain and glucose intolerance.
Cell Metab. 20:678–686. 2014. View Article : Google Scholar : PubMed/NCBI
|
|
31
|
Quan YY, Qin GQ, Huang H, Liu YH, Wang XP
and Chen TS: Dominant roles of Fenton reaction in sodium
nitroprusside-induced chondrocyte apoptosis. Free Radic Biol Med.
94:135–144. 2016. View Article : Google Scholar : PubMed/NCBI
|
|
32
|
Whiteman EL, Cho H and Birnbaum MJ: Role
of Akt/protein kinase B in metabolism. Trends Endocrinol Metab.
13:444–451. 2002. View Article : Google Scholar : PubMed/NCBI
|
|
33
|
Gonzalez E, Flier E, Molle D, Accili D and
McGraw TE: Hyperinsulinemia leads to uncoupled insulin regulation
of the GLUT4 glucose transporter and the FoxO1 transcription
factor. Proc Natl Acad Sci USA. 108:10162–10167. 2011. View Article : Google Scholar : PubMed/NCBI
|
|
34
|
Koseoglu S, Lu Z, Kumar C, Kirschmeier P
and Zou J: AKT1, AKT2 and AKT3-dependent cell survival is cell
line-specific and knockdown of all three isoforms selectively
induces apoptosis in 20 human tumor cell lines. Cancer Biol Ther.
6:755–762. 2007. View Article : Google Scholar : PubMed/NCBI
|
|
35
|
Bryant NJ, Govers R and James DE:
Regulated transport of the glucose transporter GLUT4. Nat Rev Mol
Cell Biol. 3:267–277. 2002. View
Article : Google Scholar : PubMed/NCBI
|
|
36
|
Goldstein BJ, Mahadev K, Wu X, Zhu L and
Motoshima H: Role of insulin-induced reactive oxygen species in the
insulin signaling pathway. Antioxid Redox Signal. 7:1021–1031.
2005. View Article : Google Scholar : PubMed/NCBI
|
|
37
|
Tonks NK: Protein tyrosine phosphatases:
From genes, to function, to disease. Nat Rev Mol Cell Biol.
7:833–846. 2006. View Article : Google Scholar : PubMed/NCBI
|
|
38
|
Bloch-Damti A and Bashan N: Proposed
mechanisms for the induction of insulin resistance by oxidative
stress. Antioxid Redox Signal. 7:1553–1567. 2005. View Article : Google Scholar : PubMed/NCBI
|
|
39
|
Ding H, Heng B, He W, Shi L, Lai C, Xiao
L, Ren H, Mo S and Su Z: Chronic reactive oxygen species exposure
inhibits glucose uptake and causes insulin resistance in C2C12
myotubes. Biochem Biophys Res Commun. 478:798–803. 2016. View Article : Google Scholar : PubMed/NCBI
|
|
40
|
Matsukawa J, Matsuzawa A, Takeda K and
Ichijo H: The ASK1-MAP kinase cascades in mammalian stress
response. J Biochem. 136:261–265. 2004. View Article : Google Scholar : PubMed/NCBI
|
|
41
|
Tobiume K, Matsuzawa A, Takahashi T,
Nishitoh H, Morita K, Takeda K, Minowa O, Miyazono K, Noda T and
Ichijo H: ASK1 is required for sustained activations of JNK/p38 MAP
kinases and apoptosis. EMBO Rep. 2:222–228. 2001. View Article : Google Scholar : PubMed/NCBI
|
|
42
|
Storz P and Toker A: Protein kinase D
mediates a stress-induced NF-kappaB activation and survival
pathway. EMBO J. 22:109–120. 2003. View Article : Google Scholar : PubMed/NCBI
|
|
43
|
Gual P, Le Marchand-Brustel Y and Tanti
JF: Positive and negative regulation of insulin signaling through
IRS-1 phosphorylation. Biochimie. 87:99–109. 2005. View Article : Google Scholar : PubMed/NCBI
|