Introduction
MicroRNAs (miRNAs/miRs) are small, non-coding
molecules ~21 nucleotides long. They have regulatory properties and
control almost all processes in the human body (1). miRNA genes are scattered throughout
the genome and they can be located within introns or exons of
protein-coding genes (1).
Processes involving miRNAs are not fully understood. However,
alterations in the expression of individual molecules are
associated with the occurrence and course of human diseases. This
is particularly evident in cancer (2,3).
Research on the miRNA signatures that will most aptly describe the
type of tumor and its stage are still being conducted (2,3).
miRNA expression has important diagnostic and
prognostic value; therefore, the present study addressed the issue
of its alterations in patients with chronic lymphocytic leukemia
(CLL). CLL is a hematooncological disease characterized by the
accumulation of small, but non-functional mature B cells in
peripheral blood, bone marrow, spleen and lymph nodes (4). CLL predominantly affects elderly
over the age of 60 years old, but cases of younger patients are
currently being observed, even before the age of 50 years old
(4). CLL is a heterogeneous
disease. There are two main forms, benign and aggressive, but the
diagnostic boundary between them is often unclear. Patients with
benign CLL may experience transformation of this leukemia to an
aggressive form that requires intensive treatment. miRNAs can be
used as potential biomarkers in the early diagnosis and precise
assessment of benign and aggressive forms of CLL (4,5).
Diagnosticians and clinicians consider numerous
clinical and laboratory factors that would indicate the form of
leukemia and the risk of disease progression. These include: Rai
and Binet staging system, serum markers, zeta-chain-associated
protein kinase 70 kinase (ZAP-70) expression, CD38 expression,
immunoglobulin variable heavy chain gene (IgVH) and tumor
protein p53 (TP53) mutation status, as well as chromosomal
aberrations. The latter have a substantial impact on the diagnosis
and treatment of CLL. Identification of characteristic, common
cytogenetic abnormalities have been considered as a valuable
component of the CLL diagnostic panel (4–7).
Deletion of 13q14 is the most frequently observed
chromosomal aberration in patients with CLL (5). An isolated 13q14 deletion is a good
prognostic factor. Nevertheless, it has been demonstrated that the
prognosis is worse when more cells (≥70%) with isolated del (13q14)
are observed (6). Some genes
involved in CLL pathogenesis are located within the 13q14.2-q14.3
region. These include deleted in lymphocytic leukemia 2
(DLEU2) with the miRNA-15/16 gene cluster, deleted in
lymphocytic leukemia 7 (DLEU7) and retinoblastoma 1
(RB1) (7,8).
Deletions of the 11q22-23 region, which harbors the
ataxia telangiectasia mutated (ATM) gene locus, are observed
in ~20% of patients (9). In such
cases, the disorder is associated with an aggressive course,
shorter overall survival (OS), treatment-free survival and rapid
progression (10–12). Enlargement of peripheral,
abdominal and mediastinal lymph nodes are often observed in
patients with 11q deletion (11,12). If the number of lymphocytes with
11q deletion exceeds 25%, the time to therapy is significantly
shortened, irrespective of the IgVH mutation status and
ZAP-70 and CD38 expression (13).
Chromosome 12 trisomy is the third most common
aberration in patients with CLL. It occurs in 15–20% of patients,
and it is an isolated aberration in >2/3 of patients in this
group. The median time to disease progression in such cases is 33
months, while the median OS is 114 months (11,14).
17p13 deletion is identified in ~7% of patients with
CLL and often occurs with the unmutated form of IgVH
(11,15). 17p13 deletion involves part of the
short arm of chromosome 17, and the most important lost fragment is
the 17p13.1 locus, a site occupied by the TP53 gene. It has
been demonstrated that in cases with deletion of a single 17p13.1
allele, TP53 mutations may occur in the second allele
(16). This situation is very
disadvantageous for the patient, as complete deactivation of the
TP53 gene can occur, which is associated with increased treatment
resistance (16). Both 17p13
deletions and TP53 mutations are associated in CLL with
rapid disease progression, shortened OS and worse prognosis
(15,16). For this reason, identification of
these changes is of great importance in clinical management. Their
presence in patients' lymphocytes indicates the need for rapid
initiation of therapy. TP53-associated disorders also
indicate the possibility of developing resistance to
chemotherapeutics, which makes treatment difficult (15,16).
Certain miRNA genes associated with leukemogenesis
or miRNA-regulated genes (and perhaps still unknown miRNA
controller genes) are located in chromosomal regions that are
frequently altered in CLL. The miR-15/16 cluster is located on
chromosome 13 (locus 13q14.3) between the second and fifth exon of
the DLEU2 gene. DLEU2 is located in the minimal
deleted region and it does not encode any protein; however, it is
necessary for the initiation of miR-15/16 transcription (17,18). Other miRNAs involved in CLL
pathogenesis are negative regulators of the T cell
leukemia/lymphoma 1 (TCL1) oncogene: The miR-29 and miR-181
family (19). Pekarsky et
al (19) noted low expression
of miR-29b and miR-181b in CLL lymphocytes with high level of TCL1
expression. This state is commonly associated with the lack of
IgVH mutations and high ZAP70 kinase levels, which indicates
a malignant phenotype of CLL.
The miRNA-34 family plays a notable role in CLL
pathogenesis. Expression of miRNA-34a is reduced in patients with
17p deletion or TP53 mutation. Low levels of miR-34a are
also observed in patients resistant to fludarabine, even in the
absence of 17p deletions or TP53 mutations (20). Another miRNA from the
CLL-associated group is miRNA-155. A high expression level of
miRNA-155 observed in patients with CLL can attenuate histone
deacetylase 4 and BCL6 transcription repressor expression, leading
to the activation of oncogenes associated with increased cell
division and apoptosis inhibition (21). Increased expression of miRNA-155
is associated with high levels of ZAP-70 kinase, which corresponds
to an aggressive form of CLL (22).
miR-221 and −222 molecules are involved in
regulatory mechanisms that maintain CLL lymphocytes in the
G0 phase (23). This
may be due to the fact that the expression levels of these two
miRNAs are inversely correlated with P27 protein expression in both
peripheral blood CLL lymphocytes and lymphocytes isolated from bone
marrow or lymph nodes. However, differences in the expression of
miR-221/222 were found in cells from individual anatomical
compartments (peripheral blood, bone marrow, lymph nodes) of the
same patients. Higher expression was observed in bone marrow/lymph
node lymphocytes compared with peripheral blood cells. However, the
correlation with P27 levels was preserved in both cases (23).
Considering this, the aim of the present study was
to evaluate miRNA expression associated with chromosomal
aberrations in CLL.
Materials and methods
Studied group
A total of 35 consecutive, treatment-naïve patients
with CLL, diagnosed according to standard morphological and
immunophenotypic criteria (24,25) were enrolled from October 2012 to
December 2013 in the study. Diagnosis was routinely confirmed based
on peripheral blood smear analysis by an independent pathologist.
The study group consisted of 15 (43%) women and 20 (57%) men. The
median age was 63 years (SD=8.19; min-max, 46–84 years). According
to the Rai classification (26),
12 (34%) patients were in stage 0, 10 (29%) in stage I, eight (23%)
in stage II, two (6%) in stage III and three (8%) patients were in
stage IV. There were 12 (34%) patients in the low risk group (Rai
stage 0), 18 (52%) patients in the intermediate risk group (Rai
stage I and II) and the high risk group (Rai stage III) included
five (14%) patients. Clinical and pathological features of the
studied group are presented in Table
I. White blood cell count, lymphocytosis, β2 microglobulin,
lactate dehydrogenase and the percentage of ZAP-70- and
CD38-positive cells were assessed according to standard protocols
at the Clinic of Hematooncology and Bone Marrow Transplantation
(Lublin, Poland) (24,25). Written informed consent was
obtained from patients at the time of taking the blood for the
study. The present study was conducted with the approval of the
Ethics Committee of the Medical University of Lublin (approval no.
KE-0254/155/2010).
 | Table I.Distribution of aberrations in low
and high miRNA expression groups (below and above the median,
respectively). |
Table I.
Distribution of aberrations in low
and high miRNA expression groups (below and above the median,
respectively).
|
| RB1 | D13S19 | ATM | TP53 | Trisomy of 12 |
|---|
|
|
|
|
|
|
|
|---|
| miRNA
expression | ≥10% (n=29;
85%) | <10% (n=5;
15%) | χ2 | P-value | ≥8.4% (n=10;
29%) | <8.4% (n=24;
71%) | χ2 | P-value | ≥8.8% (n=23;
68%) | <8.8% (n=11;
32%) | χ2 | P-value | ≥9.6% (n=26;
76%) | <9.6% (n=8;
24%) | χ2 | P-value | ≥5% (n=25;
74%) | <5% (n=9;
26%) | χ2 | P-value |
|---|
| miRNA-15a |
|
| 0.394 | 0.530 |
|
| 1.145 | 0.285 |
|
| 2.555 | 0.110 |
|
| 3.278 | 0.070 |
|
| 0.034 | 0.854 |
|
Low | 16 (55) | 2 (40) |
|
| 7 (70) | 12 (50) |
|
| 10 (43) | 8 (73) |
|
| 16 (62) | 2 (25) |
|
| 13 (52) | 5 (56) |
|
|
|
High | 13 (45) | 3 (60) |
|
| 3 (30) | 12 (50) |
|
| 13 (57) | 3 (27) |
|
| 10 (38) | 6 (75) |
|
| 12 (48) | 4 (44) |
|
|
| miRNA-16-1 |
|
| 0.234 | 0.629 |
|
| 5.100 | 0.024 |
|
| 1.209 | 0.272 |
|
| 0.000 | 1.000 |
|
| 1.360 | 0.244 |
|
Low | 15 (52) | 2 (40) |
|
| 8 (80) | 9 (38) |
|
| 10 (43) | 7 (64) |
|
| 13 (50) | 4 (50) |
|
| 11 (44) | 6 (67) |
|
|
|
High | 14 (48) | 3 (60) |
|
| 2 (20) | 15 (63) |
|
| 13 (57) | 4 (36) |
|
| 13 (50) | 4 (50) |
|
| 14 (56) | 3 (33) |
|
|
| miRNA-29a |
|
| 2.110 | 0.146 |
|
| 2.267 | 0.132 |
|
| 1.794 | 0.180 |
|
| 2.615 | 0.106 |
|
| 0.034 | 0.854 |
|
Low | 16 (55) | 1 (20) |
|
| 3 (30) | 14 (58) |
|
| 9 (39) | 7 (64) |
|
| 15 (58) | 2 (25) |
|
| 12 (48) | 4 (45) |
|
|
|
High | 13 (45) | 4 (80) |
|
| 7 (70) | 10 (42) |
|
| 14 (61) | 4 (36) |
|
| 11 (42) | 6 (75) |
|
| 13 (52) | 5 (55) |
|
|
| miRNA-29c |
|
| 2.110 | 0.146 |
|
| 0.567 | 0.451 |
|
| 0.229 | 0.632 |
|
| 2.615 | 0.106 |
|
| 0.151 | 0.698 |
|
Low | 16 (55) | 1 (20) |
|
| 6 (60) | 11 (46) |
|
| 11 (49) | 6 (55) |
|
| 15 (58) | 2 (25) |
|
| 12 (48) | 5 (55) |
|
|
|
High | 13 (45) | 4 (80) |
|
| 4 (40) | 13 (54) |
|
| 13 (57) | 5 (45) |
|
| 11 (42) | 6 (75) |
|
| 13 (52) | 4 (45) |
|
|
| miRNA-34a |
|
| 0.234 | 0.629 |
|
| 0.567 | 0.451 |
|
| 0.229 | 0.632 |
|
| 0.654 | 0.419 |
|
| 0.034 | 0.854 |
|
Low | 15 (52) | 2 (40) |
|
| 6 (60) | 11 (38) |
|
| 11 (49) | 6 (55) |
|
| 14 (54) | 3 (38) |
|
| 12 (48) | 4 (45) |
|
|
|
High | 14 (48) | 3 (60) |
|
| 4 (40) | 13 (54) |
|
| 13 (57) | 5 (45) |
|
| 12 (46) | 5 (63) |
|
| 13 (52) | 5 (55) |
|
|
| miRNA-34b |
|
| 0.858 | 0.354 |
|
| 0.097 | 0.755 |
|
| 0.123 | 0.726 |
|
| 0.002 | 0.964 |
|
| 0.311 | 0.577 |
|
Low | 18 (62) | 2 (40) |
|
| 6 (60) | 13 (54) |
|
| 14 (61) | 6 (55) |
|
| 16 (62) | 5 (62) |
|
| 14 (56) | 6 (67) |
|
|
|
High | 11 (38) | 3 (60) |
|
| 4 (40) | 11 (46) |
|
| 9 (39) | 5 (45) |
|
| 10 (38) | 3 (38) |
|
| 11 (44) | 3 (33) |
|
|
| miRNA-155 |
|
| 0.234 | 0.629 |
|
| 2.267 | 0.132 |
|
| 0.062 | 0.803 |
|
| 0.101 | 0.751 |
|
| 0.151 | 0.698 |
|
Low | 15 (52) | 2 (40) |
|
| 3 (30) | 14 (58) |
|
| 11 (49) | 6 (55) |
|
| 15 (58) | 2 (25) |
|
| 13 (52) | 4 (45) |
|
|
|
High | 14 (48) | 3 (60) |
|
| 7 (70) | 10 (42) |
|
| 12 (52) | 5 (45) |
|
| 11 (42) | 6 (75) |
|
| 12 (48) | 5 (55) |
|
|
| miRNA-181a |
|
| 2.110 | 0.146 |
|
| 2.267 | 0.132 |
|
| 0.134 | 0.714 |
|
| 0 | 1.000 |
|
| 1.360 | 0.244 |
|
Low | 16 (55) | 1 (20) |
|
| 3 (30) | 14 (58) |
|
| 11 (49) | 6 (55) |
|
| 13 (50) | 4 (50) |
|
| 14 (56) | 3 (33) |
|
|
|
High | 13 (45) | 4 (80) |
|
| 7 (70) | 10 (42) |
|
| 12 (52) | 5 (45) |
|
| 13 (50) | 4 (50) |
|
| 11 (44) | 6 (67) |
|
|
| miRNA-181b |
|
| 1.085 | 0.298 |
|
| 3.342 | 0.067 |
|
| 1.872 | 0.171 |
|
| 0.186 | 0.666 |
|
| 0.577 | 0.447 |
|
Low | 13 (45) | 1 (20) |
|
| 2 (20) | 13 (54) |
|
| 12 (52) | 3 (27) |
|
| 12 (46) | 3 (38) |
|
| 12 (48) | 3 (33) |
|
|
|
High | 16 (55) | 4 (80) |
|
| 8 (80) | 11 (46) |
|
| 11 (49) | 8 (73) |
|
| 14 (54) | 5 (62) |
|
| 13 (52) | 6 (67) |
|
|
| miRNA-221 |
|
| 6.177 | 0.013 |
|
| 2.842 | 0.092 |
|
| 1.298 | 0.255 |
|
| 1.434 | 0.231 |
|
| 0.054 | 0.816 |
|
Low | 19 (66) | 1 (20) |
|
| 4 (40) | 17 (71) |
|
| 12 (52) | 8 (73) |
|
| 16 (62) | 3 (38) |
|
| 15 (60) | 5 (56) |
|
|
|
High | 10 (34) | 4 (80) |
|
| 6 (60) | 7 (29) |
|
| 11 (49) | 3 (27) |
|
| 10 (38) | 5 (62) |
|
| 10 (40) | 4 (44) |
|
|
| miRNA-222 |
|
| 0.394 | 0.530 |
|
| 0.097 | 0.755 |
|
| 0.747 | 0.387 |
|
| 2.043 | 0.153 |
|
| 0.355 | 0.551 |
|
Low | 13 (45) | 3 (60) |
|
| 4 (40) | 11 (46) |
|
| 12 (52) | 4 (36) |
|
| 14 (54) | 2 (25) |
|
| 11 (44) | 5 (56) |
|
|
|
High | 16 (55) | 2 (40) |
|
| 6 (60) | 13 (54) |
|
| 11 (48) | 7 (64) |
|
| 12 (46) | 6 (75) |
|
| 14 (56) | 4 (44) |
|
|
| miRNA-223 |
|
| 4.628 | 0.031 |
|
| 6.170 | 0.013 |
|
| 1.209 | 0.272 |
|
| 0 | 1.000 |
|
| 0.151 | 0.698 |
|
Low | 15 (52) | 0 (0) |
|
| 2 (20) | 16 (67) |
|
| 10 (43) | 7 (64) |
|
| 13 (50) | 4 (50) |
|
| 12 (48) | 5 (56) |
|
|
|
High | 14 (48) | 5 (100) |
|
| 8 (80) | 8 (33) |
|
| 13 (57) | 4 (36) |
|
| 13 (50) | 4 (50) |
|
| 13 (52) | 4 (44) |
|
|
Collection and culture of lymphocytes
for cytogenetic tests
Fresh peripheral blood samples were collected into
lithium heparin (as an anticoagulant) tubes and placed in a 37°C
incubator for 1–2 h to sediment erythrocytes and platelets. After
sedimentation, the fraction above the sediment containing white
blood cells was collected and the obtained cells were used for cell
cultures.
Lymphocyte suspension cultures were carried out in
duplicate, in a volume of 15 ml of medium in sterile Falcon culture
flasks (Sarstedt, Inc.) at 37°C (Haereus Incubator; Heraeus Holding
GmbH). The culture medium was RPMI 1640 with L-glutamine (Biomed
Lublin S.A.) supplemented with 15% heat-inactivated fetal bovine
serum and 1% mixture of antibiotics and antimycotics (Gibco; Thermo
Fisher Scientific, Inc.).
The cultures were run for 5 days with daily
agitation by gentle shaking. On the last day of culture, KaryoMAX™
Colcemid™ (Gibco; Thermo Fisher Scientific, Inc.) was added to each
culture to a final concentration of 0.1 µg/ml. Immediately after
the addition of Colcemid, the cultures were incubated for 1–1.5 h
at 37°C to stop cell divisions at the metaphase stage. The cultures
were then placed into 15 ml tubes and centrifuged at 80 × g for 10
min at room temperature. Subsequently, the supernatant was
collected and ~10 ml of 0.075 M KCl (POCH; Avantor, Inc.) at 37°C
was added dropwise to the cell pellet and incubated at 37°C for
15–20 min. After incubation, the suspensions were centrifuged at 80
× g for 10 min at room temperature. After centrifugation, the
supernatant was collected and the cell pellet in the metaphase
stage was immediately fixed in a 1:3 solution of glacial acetic
acid and methanol (both Sigma-Aldrich; Merck KGaA) at −20°C. The
fixative was added in the volume of ~10 ml, and the suspensions
were shaken briefly and immediately they were centrifuged at 80 × g
for 10 min at room temperature. The fixation step was repeated
three times. After the last rinse, the fixative was added and the
opalescent lymphocyte suspension was delivered in the fixative.
Drops of this material were spread on the dry microscope slide
super frost plus (Thermo Scientific, Inc.) and dried. Metaphase
spreads were checked using an eclipse Ni-U Nikon upright light
microscope (Nikon Corporation) at a magnification of ×200 and using
a Nikon Plan Fluor lens 20×0.50.
Fluorescent in situ hybridization
(FISH)
FISH was carried out to analyze the most common
chromosomal aberrations using specific fluorescently labeled
cytogenetic probes. They included: i) 13q14 Deletion, miR-15/16
gene locus, Vysis D13S319 probe and RB1 Vysis LSI 13 (RB1)
probe (Abbott Molecular); ii) 17p13 deletion, Vysis LSI TP53 probe
(Abbott Laboratories); iii) 11q22-23 deletion, Vysis LSI ATM probe
(Abbott Laboratories); and iv) trisomy 12, Vysis CEP 12 probe
(Abbott Laboratories).
Dried slides with spattered drops of CLL suspension
were incubated in 70% formamide at 73°C for 5 min. Next, the slides
were dehydrated in a series of ethyl alcohol dilutions (70, 80 and
96%), each for 2 min and then dried at room temperature.
Subsequently, the slides with fluorescent probes were incubated in
the dark at 73°C for 5 min to denature and then covered with a
coverslip. Fixogum-protected slides were incubated in a humidity
chamber at 37°C for 20 h. After this, the preparations were washed
in a solution of 0.4X saline-sodium citrate buffer (SSC)/0.3% NP-40
(non-ionic detergent) (Abbott Laboratories) at 73°C for 2 min,
followed by 2X SSC/0.1% NP-40 incubation at room temperature for 1
min. Next, the slides were dehydrated in a dilution series of ethyl
alcohol (70, 80 and 96%) for 2 min each and air-dried in the dark.
Next, 10 µl of DAPI was applied and coverslips were put on the
slides. Slides were analyzed at 1,000× magnification under
immersion (100×1.45 Plan Apo λ Oil lens; Nikon Corporation), using
an eclipse Ni-U Nikon upright fluorescent microscope (Nikon
Corporation) with a UV lamp. At least 100 nuclei (or metaphases)
were analyzed per sample, and the percentage of aberrant
nuclei/metaphases was calculated.
Acquisition and storage of peripheral
blood lymphocytes for molecular studies
Fresh peripheral blood samples (4.5 ml) from
patients with CLL were collected into EDTA tubes and were diluted
1:1 with PBS without Ca2+ and Mg2+ (Biomed
Lublin S.A.). The prepared blood was layered on Lymphoprep™
(STEMCELL™ Technologies) and centrifuged in a density gradient
(11). The samples were
centrifuged immediately after layering at 560 × g for 30 min at
room temperature in 15 ml conical tubes. Leukocyte interphases were
collected after centrifugation, using a truncated needle and
transferred to a 50 ml conical tube.
Leukocytes were washed three times with 45 ml of
PBS, followed by centrifugation at 560 × g for 10 min at room
temperature. The supernatant was removed after each centrifugation.
After the second wash, the cells were counted in a Thom chamber
using Tűrk's fluid (Chempur). The total number of lymphocytes were
determined in a given collected amount of blood. Subsequently, the
lymphocytes were divided into 1.5 ml Eppendorf tubes, with no more
than 1×10⁷ cells per tube. Lymphocyte suspensions were
centrifuged at 560 × g for 10 min at room temperature, and then the
supernatant was removed to obtain a dry cell pellet. Cells were
stored at −80°C until RNA isolation.
Measuring miRNA expression
The miRNeasy Mini kit (Qiagen, Inc.; cat. no.
217084) was used to isolate RNA with miRNA fraction from the cells
according to the manufacturer's instructions. The quality of
isolated RNA was assessed using a NanoDrop 2000 (Thermo Fisher
Scientific, Inc.). RNA was stored at −80°C until further
analysis.
Reverse transcription was conducted to obtain
complementary (c)DNA for real-time PCR using the Universal cDNA
Synthesis kit (Exiqon; Qiagen, Inc.) according to the
manufacturer's instructions. The reaction mixture (20 µl) contained
4 µl of reaction buffer, 9 µl of nuclease-free water, 2 µl of
enzyme mix, 1 µl (0.15 fmol) of ‘spike in’ and 4 µl of RNA (5
ng/µl). Reverse transcription was carried out in an Applied
Biosystems 2720 thermal cycler (Applied Biosystems; Thermo Fisher
Scientific, Inc.). Reaction conditions were as follows: 42°C For 60
min, 95°C for 5 min and direct cooling to 4°C. The cDNA samples
were stored at −20°C until real-time PCR was performed. Real-time
PCR reaction was performed using the SYBR® Green Master
Mix kit (Exicon). Real-time PCR reactions were performed using
specific primers (miRCURY LNA™ Universal RT PCR miRNA LNA™ PCR
primer set; cat. no. 339306; Exicon; Qiagen, Inc.) for:
Hsa-miR-15a, −16-1, −29a, −29c, −34a, −34b, −155, −181a, −181b,
−221, −222 and −223. U6 RNA (U6 snRNA PCR primer set; UniRT,
Exiqon, cat. no. 203907) was used as an internal control.
Real-time PCR reaction mix (10 µl) contained 5 µl
SYBR Green master mix, 4 µl of cDNA diluted ×80 with nuclease-free
water and 1 µl of appropriate specific primers. Real-time PCR
reaction was carried out using an Applied Biosystems 7500 Fast
Real-Time PCR System (Applied Biosystems; Thermo Fisher Scientific,
Inc.). Conditions for real-time PCR were in accordance with the
protocol included in the SYBR® Green master mix kit
(Exiqon; Qiagen, Inc.). The initial step was denaturation at 95°C
for 10 min, followed by 40 amplification cycles with the following
temperature profile: 95°C For 10 sec and 60°C for 1 min. Each
reaction was run in duplicate and was controlled by a melting
curve. The threshold cycle was obtained from the logarithmic growth
phase of the product from samples from patients with CLL.
Evaluation of miRNA expression was conducted using the
2−Δ∆Cq method (27).
Statistical analysis
U-Mann-Whitney test was used to compare miRNA
expression in individual patient groups. The data are presented as
median and interquartile range. The Spearman rank test was used to
estimate the correlation between the data on a continuous scale.
The χ2 and Fisher's exact tests were used to compare
individual groups of patients with respect to clinical and
demographic characteristics. Statistical analysis was performed
using the Statistica 12 software (TIBCO Software Inc.). P<0.05
was considered to indicate a statistically significant
difference.
Results
Chromosomal aberrations
Identification of chromosomal aberrations using the
FISH method was performed in 34 (97%) of the 35 patients enrolled
in the study. In one patient, blood was collected for EDTA only,
and therefore no blood was available for lithium heparin for
culture and FISH. Cytogenetic aberrations were observed in 30
patients (88%). Normal karyotype was found in four patients (12%).
Single chromosomal changes were found in 12 patients (35%), two
different aberrations occurred in 12 patients (35%) and ≥3 changes
were identified in six patients (18%; data not shown). The most
common aberration observed was 13q14 (D13S319) deletion
(n=23; 68%). 11q22-23 deletion (n=11; 32%) was the second most
common in the studied group of patients. The third most common was
trisomy of chromosome 12 (n=9; 26%). A total of eight patients
(24%) had a 17p13 deletion, and five patients (15%) had a deletion
of the 13q14 region where the RB1 gene is located. Notably,
in three cases (9%) it coexisted with D13S319 deletion, and
in two cases there was no D13S319 deletion. The distribution
of the occurrence of individual chromosomal aberrations depending
on the cut-off thresholds is presented in Table I.
Expression of miRNA and disease risk
progression according to the Rai staging
The present study observed significantly higher
expression levels of miR-181a, −221 and −223 in the group with low
risk of disease progression (stage 0) compared with the high risk
of CLL progression (P=0.036, P=0.019 and P=0.038, respectively;
Fig. 1D-F). Markedly higher
expression levels of miR-34a, −181a and −181b were observed in the
group with low risk of disease progression compared with the
intermediate-risk progression group, but it was not statistically
significant (Fig. 1A-C).
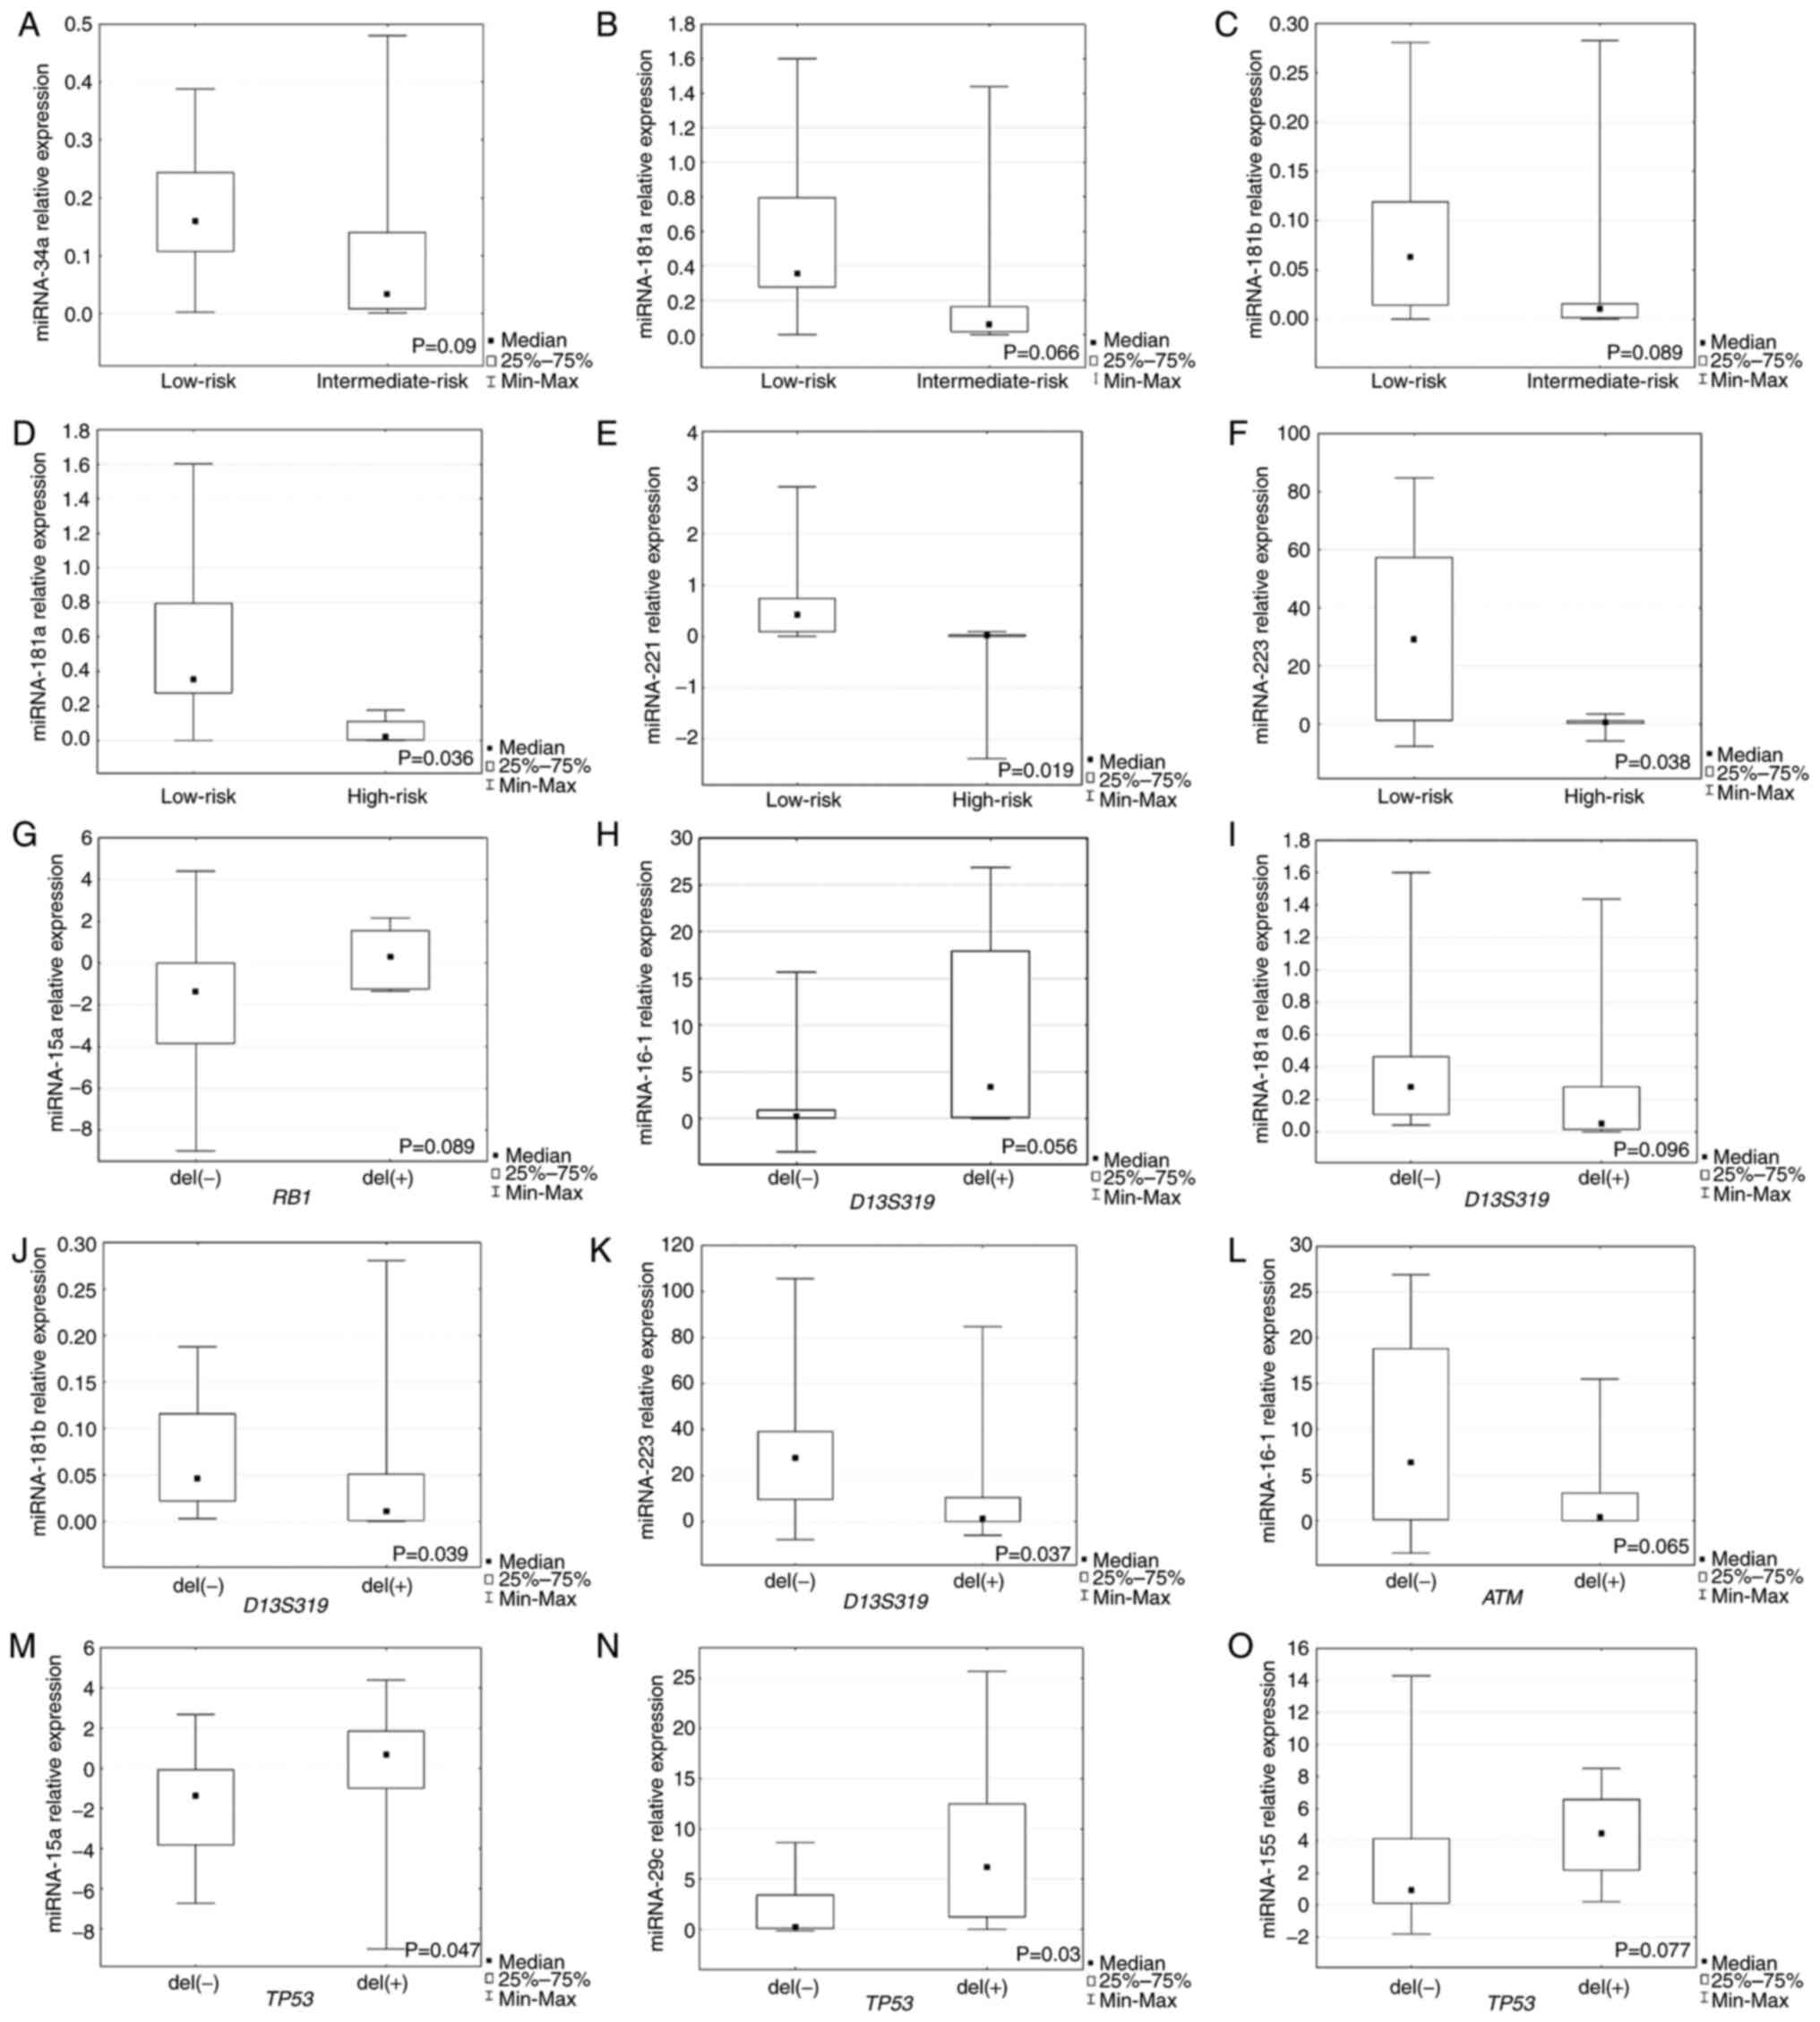 | Figure 1.Expression of miRNAs in individual
groups of patients with chronic lymphocytic leukemia. Relative
expression of (A) miR-34a, (B) miR-181a and (C) miR-181b in low-
and intermediate-risk groups. Relative expression of (D) miR-181a,
(E) miR-221 and (F) miR-223 in low- and high-risk groups. (G)
Relative expression of miR-15a in group of patients with or without
deletions in RB1 locus. Relative expression of (H) miR-16-1,
(I) miR-181a, (J) miR-181b and (K) miR-223 in patients with or
without deletions in D13S319 locus. (L) Relative expression
of miR-16-1 in patients with or without deletions in ATM
locus. Relative expression of (M) miR-16-1, (N) miR-15a,
miR-29c and (O) miR-155 in patients with or without deletions in
TP-53 locus. miRNA, microRNA; RB1, retinoblastoma 1;
ATM, ataxia telangiectasia mutated; TP53, tumor protein
53. |
Expression of miRNA and chromosomal
aberrations
The present study revealed that miR-181b and −223
expression levels were significantly higher in the group of
patients without D13S319 deletion (P=0.039 and P=0.037,
respectively; Fig. 1J and K).
Higher miR-16-1 expression was observed in the group with
D13S319 deletion (Fig.
1H), but it was not statistically significant. Non-significant
lower expression of miR-181a was detected in patients with
D13S319 deletion (Fig.
1I).
For RB1 deletion identified by FISH, a higher
expression of miRNA-15a was observed in the group of patients with
deletion of this locus, but it was not statistically significant
(Fig. 1G). Moreover, the
expression levels of miR-15a and miR-29c were significantly higher
in the group with TP53 deletion identified by FISH compared
with the group without this deletion (P=0.047, P=0.03,
respectively; Fig. 1M and N).
Higher miR-155 expression was detected in the group of patients
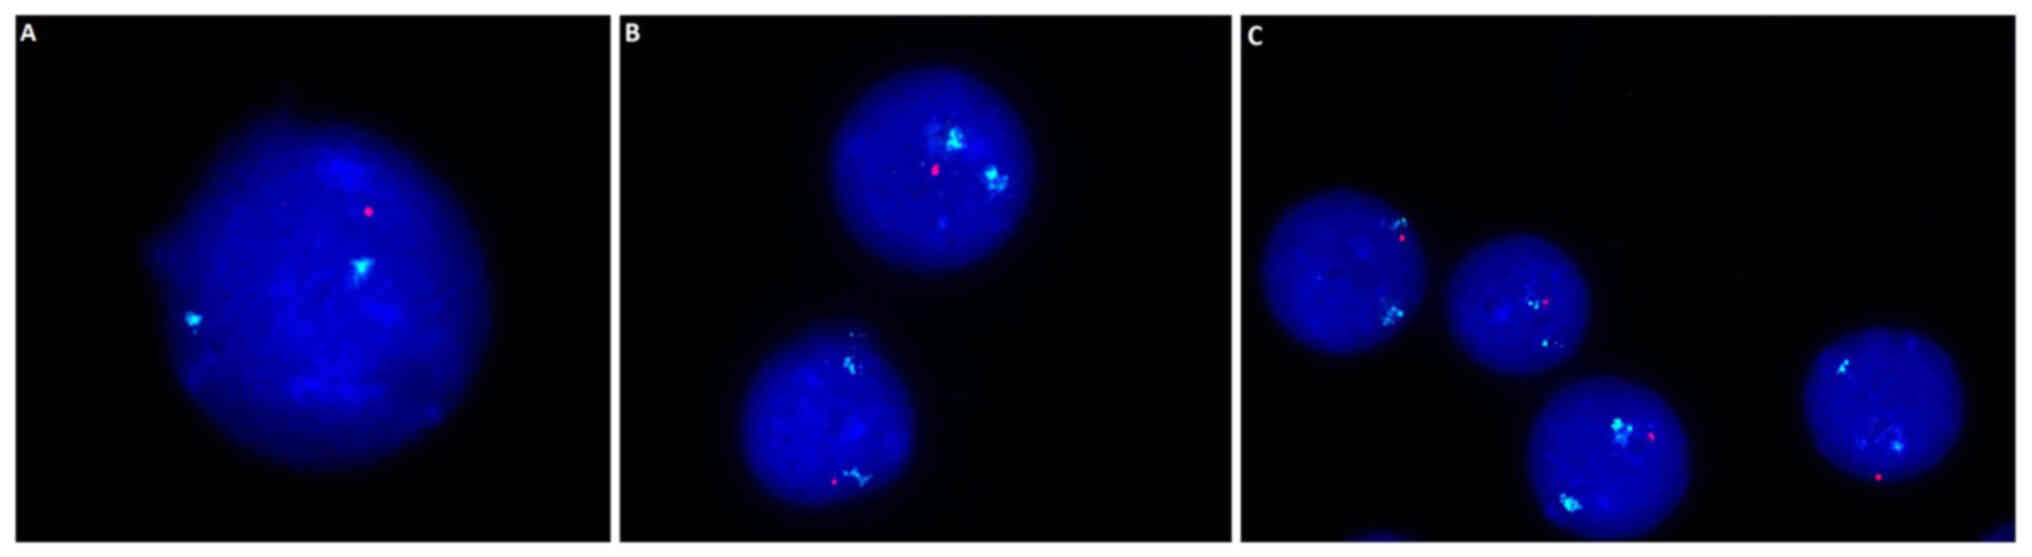
with TP53 deletion, but this was not significant (Fig. 1O). Example images presenting the
17q13 deletion within which the TP-53 gene is located are
presented in Fig. 2. A
non-significantly lower expression of miR-16-1 was found in the
group of patients with CLL with ATM deletion compared with
patients without this deletion (Fig.
1L).
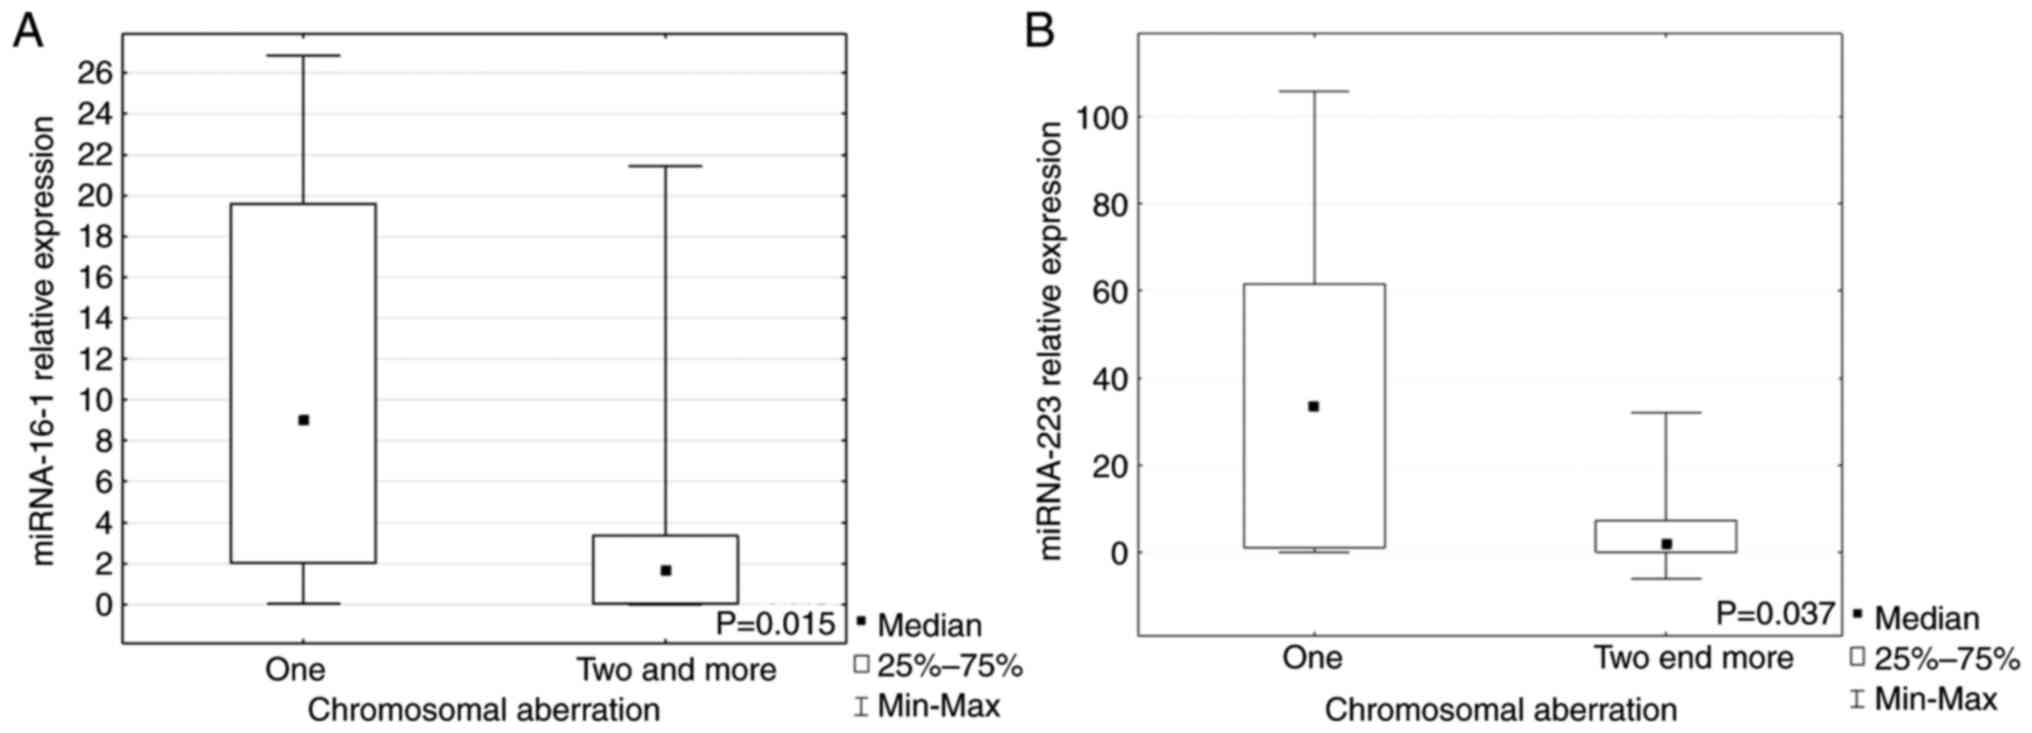
When the patients were divided into groups with one
or ≥2 chromosomal aberrations, it was demonstrated that miR-16-1
and miR-223 expression levels were significantly higher in the
group with just one aberration compared with groups with ≥2 lesions
(P=0.015, P=0.037, respectively; Fig.
3A and B). Expression of each miRNA marked as a low or high in
the group with a given aberration are presented in Table I.
Expression of miRNAs depending on
clinical and demographical factors
It was observed that in the patient group with low
miR-34b expression, the percentage of cells expressing ZAP-70 over
20% was non-significantly more frequent compared with patients with
high expression of this molecule (P=0.065; Table II).
| Table II.Clinical and demographic features in
the groups with low and high (below and above the median,
respectively) miRNA expression. |
Table II.
Clinical and demographic features in
the groups with low and high (below and above the median,
respectively) miRNA expression.
|
|
|
|
|
|
|
|
|
| Rai staging |
|
|
|
|
|
|
|
|
|
|
|
|
|
|---|
|
| Agea | Sex |
|
|
|
| CD38 |
Β-2-microglobulin | LDH | ZAP-70 |
|---|
| Feature | <63 (n= 17;
50%) | ≥63 (n= 17;
50%) | χ2 | P-value | Male (n= 20;
57%) | Female (n= 15;
4%) | χ2 | P-value | Low-risk (n= 12;
34%) | Inter mediate-risk
(n=18; 52%) | High-risk (n=15;
14%) | P-value | <30% (n= 24;
69%) | ≥30% (n= 11;
31%) | P-value | <3 (mg/l) (n=17;
55%) | ≥3 (mg/l) (n=14;
45%) | χ2 | P-value | <480 (IU/l)
(n=22; 69%) | ≥480 (IU/l) (n=10;
31%) | P-value | <20% (n=24;
69%) | ≥20% (n=11;
31%) | P-value |
|---|
| miRNA-15a |
|
| 0.486 | 0.486 |
|
| 0.038 | 0.845 |
|
|
| 0.805 |
|
| 1 |
|
| 0.055 | 0.814 |
|
| 1 |
|
| 0.704 |
|
Low | 6 | 8 |
|
| 10 | 8 |
|
| 5 | 8 | 3 |
| 12 | 6 |
| 9 | 8 |
|
| 12 | 5 |
| 14 | 4 |
|
|
| (35) | (47) |
|
| (50) | (53) |
|
| (42) | (44) | (60) |
| (50) | (55) |
| (53) | (57) |
|
| (55) | (50) |
| (58) | (36) |
|
|
High | 11 | 9 |
|
| 10 | 7 |
|
| 7 | 10 | 2 |
| 12 | 5 |
| 8 | 6 |
|
| 10 | 5 |
| 10 | 7 |
|
|
| (65) | (53) |
|
| (50) | (47) |
|
| (58) | (56) | (40) |
| (50) | (45) |
| (47) | (43) |
|
| (45) | (50) |
| (42) | (64) |
|
| miRNA-16-1 |
|
| 0 | 1 |
|
| 0.238 | 0.626 |
|
|
| 0.811 |
|
| 0.725 |
|
| 0.784 | 0.376 |
|
| 1 |
|
| 0.146 |
|
Low | 7 | 7 |
|
| 9 | 8 |
|
| 5 | 9 | 3 |
| 11 | 6 |
| 7 | 8 |
|
| 11 | 5 |
| 14 | 3 |
|
|
| (41) | (41) |
|
| (45) | (53) |
|
| (42) | (50) | (60) |
| (46) | (54) |
| (41) | (57) |
|
| (50) | (50) |
| (58) | (27) |
|
|
High | 10 | 10 |
|
| 11 | 7 |
|
| 7 | 9 | 2 |
| 13 | 5 |
| 10 | 6 |
|
| 11 | 5 |
| 10 | 8 |
|
|
| (59) | (59) |
|
| (55) | (47) |
|
| (58) | (50) | (40) |
| (54) | (45) |
| (59) | (43) |
|
| (50) | (50) |
| (42) | (73) |
|
| miRNA-29a |
|
| 0.125 | 0.724 |
|
| 0.002 | 0.964 |
|
|
| 0.278 |
|
| 0.470 |
|
| 0.406 | 0.524 |
|
| 1 |
|
| 0.027 |
|
Low | 6 | 7 |
|
| 10 | 7 |
|
| 5 | 9 | 2 |
| 13 | 4 |
| 8 | 5 |
|
| 10 | 4 |
| 15 | 2 |
|
|
| (35) | (41) |
|
| (50) | (47) |
|
| (42) | (50) | (40) |
| (54) | (36) |
| (47) | (36) |
|
| (45) | (40) |
| (58) | (18) |
|
|
High | 11 | 10 |
|
| 10 | 8 |
|
| 7 | 9 | 3 |
| 11 | 7 |
| 9 | 9 |
|
| 12 | 6 |
| 9 | 9 |
|
|
| (65) | (59) |
|
| (50) | (53) |
|
| (58) | (50) | (60) |
| (46) | (64) |
| (53) | (64) |
|
| (55) | (60) |
| (38) | (82) |
|
| miRNA-29c |
|
| 0.486 | 0.486 |
|
| 0.772 | 0.379 |
|
|
| 0.216 |
|
| 1 |
|
| 2.584 | 0.108 |
|
| 0.712 |
|
| 0.724 |
|
Low | 6 | 8 |
|
| 11 | 6 |
|
| 4 | 9 | 4 |
| 12 | 5 |
| 6 | 9 |
|
| 11 | 4 |
| 11 | 6 |
|
|
| (35) | (47) |
|
| (55) | (40) |
|
| (33) | (50) | (75) |
| (50) | (45) |
| (35) | (64) |
|
| (50) | (40) |
| (46) | (55) |
|
|
High | 11 | 9 |
|
| 9 | 9 |
|
| 8 | 9 | 1 |
| 12 | 6 |
| 11 | 5 |
|
| 11 | 6 |
| 13 | 5 |
|
|
| (65) | (53) |
|
| (45) | (60) |
|
| (67) | (50) | (25) |
| (50) | (55) |
| (65) | (36) |
|
| (50) | (60) |
| (54) | (45) |
|
| miRNA-34a |
|
| 0.125 | 0.724 |
|
| 0.139 | 0.709 |
|
|
| 0.243 |
|
| 1 |
|
| 0.027 | 0.869 |
|
| 0.712 |
|
| 0.470 |
|
Low | 7 | 6 |
|
| 10 | 7 |
|
| 5 | 11 | 1 |
| 12 | 5 |
| 8 | 7 |
|
| 11 | 4 |
| 13 | 4 |
|
|
| (41) | (35) |
|
| (50) | (47) |
|
| (42) | (61) | (25) |
| (50) | (45) |
| (47) | (50) |
|
| (50) | (40) |
| (54) | (36) |
|
|
High | 10 | 11 |
|
| 10 | 8 |
|
| 7 | 7 | 4 |
| 12 | 6 |
| 9 | 7 |
|
| 11 | 6 |
| 11 | 7 |
|
|
| (59) | (65) |
|
| (50) | (53) |
|
| (58) | (39) | (75) |
| (50) | (55) |
| (53) | (50) |
|
| (50) | (60) |
| (46) | (64) |
|
| miRNA-34b |
|
| 0.486 | 0.486 |
|
| 0.735 | 0.391 |
|
|
| 0.147 |
|
| 0.721 |
|
| 0.814 | 0.367 |
|
| 0.699 |
|
| 0.065 |
|
Low | 11 | 9 |
|
| 11 | 10 |
|
| 4 | 12 | 4 |
| 15 | 6 |
| 9 | 10 |
|
| 14 | 5 |
| 16 | 3 |
|
|
| (65) | (53) |
|
| (55) | (67) |
|
| (33) | (67) | (75) |
| (63) | (55) |
| (53) | (71) |
|
| (64) | (50) |
| (67) | (27) |
|
|
High | 6 | 8 |
|
| 9 | 5 |
|
| 8 | 6 | 1 |
| 9 | 5 |
| 8 | 4 |
|
| 8 | 5 |
| 8 | 8 |
|
|
| (35) | (47) |
|
| (45) | (33) |
|
| (67) | (33) | (25) |
| (37) | (45) |
| (47) | (29) |
|
| (36) | (50) |
| (33) | (73) |
|
| miRNA-155 |
|
| 0.486 | 0.486 |
|
| 2.440 | 0.118 |
|
|
| 0.244 |
|
| 0.470 |
|
| 0.241 | 0.623 |
|
| 0.450 |
|
| 0.289 |
|
Low | 6 | 8 |
|
| 12 | 5 |
|
| 5 | 11 | 1 |
| 13 | 4 |
| 10 | 7 |
|
| 13 | 4 |
| 10 | 7 |
|
|
| (35) | (47) |
|
| (60) | (33) |
|
| (42) | (61) | (25) |
| (54) | (36) |
| (59) | (50) |
|
| (59) | (40) |
| (42) | (64) |
|
|
High | 11 | 9 |
|
| 8 | 10 |
|
| 7 | 7 | 4 |
| 11 | 7 |
| 7 | 7 |
|
| 9 | 6 |
| 14 | 4 |
|
|
| (65) | (53) |
|
| (40) | (67) |
|
| (58) | (64) | (75) |
| (46) | (64) |
| (41) | (50) |
|
| (41) | (60) |
| (58) | (36) |
|
| miRNA-181a |
|
| 0.486 | 0.486 |
|
| 0.772 | 0.379 |
|
|
| 0.114 |
|
| 1 |
|
| 1.642 | 0.200 |
|
| 0.704 |
|
| 1 |
|
Low | 6 | 8 |
|
| 11 | 6 |
|
| 3 | 10 | 4 |
| 12 | 5 |
| 7 | 9 |
|
| 12 | 4 |
| 12 | 5 |
|
|
| (35) | (47) |
|
| (55) | (40) |
|
| (25) | (56) | (75) |
| (50) | (45) |
| (41) | (64) |
|
| (55) | (40) |
| (50) | (45) |
|
|
High | 11 | 9 |
|
| 9 | 9 |
|
| 9 | 8 | 1 |
| 12 | 6 |
| 10 | 5 |
|
| 10 | 6 |
| 12 | 6 |
|
|
| (65) | (53) |
|
| (45) | (60) |
|
| (75) | (44) | (25) |
| (50) | (56) |
| (59) | (36) |
|
| (45) | (60) |
| (50) | (55) |
|
| miRNA-181b |
|
| 0.486 | 0.486 |
|
| 0.972 | 0.324 |
|
|
| 0.293 |
|
| 0.47 |
|
| 0.682 | 0.409 |
|
| 1 |
|
| 0.467 |
|
Low | 6 | 8 |
|
| 10 | 5 |
|
| 3 | 9 | 3 |
| 13 | 4 |
| 6 | 7 |
|
| 9 | 4 |
| 9 | 6 |
|
|
| (35) | (47) |
|
| (50) | (33) |
|
| (25) | (50) | (60) |
| (54) | (37) |
| (35) | (50) |
|
| (41) | (40) |
| (37) | (55) |
|
|
High | 11 | 9 |
|
| 10 | 10 |
|
| 9 | 9 | 2 |
| 11 | 7 |
| 11 | 7 |
|
| 13 | 6 |
| 15 | 5 |
|
|
| (65) | (53) |
|
| (50) | (67) |
|
| (75) | (50) | (40) |
| (46) | (63) |
| (65) | (50) |
|
| (59) | (60) |
| (63) | (45) |
|
| miRNA-221 |
|
| 0.515 | 0.473 |
|
| 0.793 | 0.373 |
|
|
| 0.083 |
|
| 0.467 |
|
| 1.873 | 0.171 |
|
| 0.266 |
|
| 0.716 |
|
Low | 5 | 7 |
|
| 10 | 9 |
|
| 5 | 10 | 5 |
| 15 | 5 |
| 8 | 10 |
|
| 14 | 4 |
| 14 | 5 |
|
|
| (29) | (41) |
|
| (50) | (60) |
|
| (42) | (56) | (100) |
| (63) | (45) |
| (47) | (71) |
|
| (64) | (40) |
| (58) | (45) |
|
|
High | 12 | 10 |
|
| 10 | 6 |
|
| 7 | 8 | 0 |
| 9 | 6 |
| 9 | 4 |
|
| 8 | 6 |
| 10 | 6 |
|
|
| (71) | (59) |
|
| (50) | (40) |
|
| (58) | (54) | (0) |
| (37) | (55) |
| (53) | (29) |
|
| (36) | (60) |
| (42) | (55) |
|
| miRNA-222 |
|
| 0.486 | 0.486 |
|
| 0.772 | 0.379 |
|
|
| 0.471 |
|
| 0.493 |
|
| 0.027 | 0.869 |
|
| 1 |
|
| 0.065 |
|
Low | 6 | 8 |
|
| 11 | 6 |
|
| 4 | 10 | 2 |
| 12 | 4 |
| 8 | 7 |
|
| 10 | 4 |
| 8 | 8 |
|
|
| (35) | (47) |
|
| (55) | (40) |
|
| (33) | (56) | (40) |
| (50) | (37) |
| (47) | (50) |
|
| (45) | (40) |
| (33) | (73) |
|
|
High | 11 | 9 |
|
| 9 | 9 |
|
| 8 | 8 | 3 |
| 12 | 7 |
| 9 | 7 |
|
| 12 | 6 |
| 16 | 3 |
|
|
| (65) | (53) |
|
| (45) | (60) |
|
| (67) | (54) | (60) |
| (50) | (63) |
| (53) | (50) |
|
| (54) | (60) |
| (67) | (27) |
|
| miRNA-223 |
|
| 0.486 | 0.486 |
|
| 0.772 | 0.379 |
|
|
| 0.019 |
|
| 0.146 |
|
| 0.313 | 0.576 |
|
| 0.704 |
|
| 0.47 |
|
Low | 8 | 6 |
|
| 11 | 6 |
|
| 3 | 9 | 5 |
| 14 | 3 |
| 8 | 8 |
|
| 12 | 4 |
| 13 | 4 |
|
|
| (47) | (35) |
|
| (55) | (40) |
|
| (25) | (50) | (100) |
| (58) | (27) |
| (47) | (57) |
|
| (54) | (40) |
| (54) | (36) |
|
|
High | 9 | 11 |
|
| 9 | 9 |
|
| 9 | 9 | 0 |
| 10 | 8 |
| 9 | 6 |
|
| 10 | 6 |
| 11 | 7 |
|
|
| (53) | (65) |
|
| (45) | (60) |
|
| (75) | (50) | (0) |
| (42) | (73) |
| (53) | (43) |
|
| (45) | (60) |
| (46) | (64) |
|
Diagnostic value of miRNA expression
in differentiating low and high risk of CLL progression
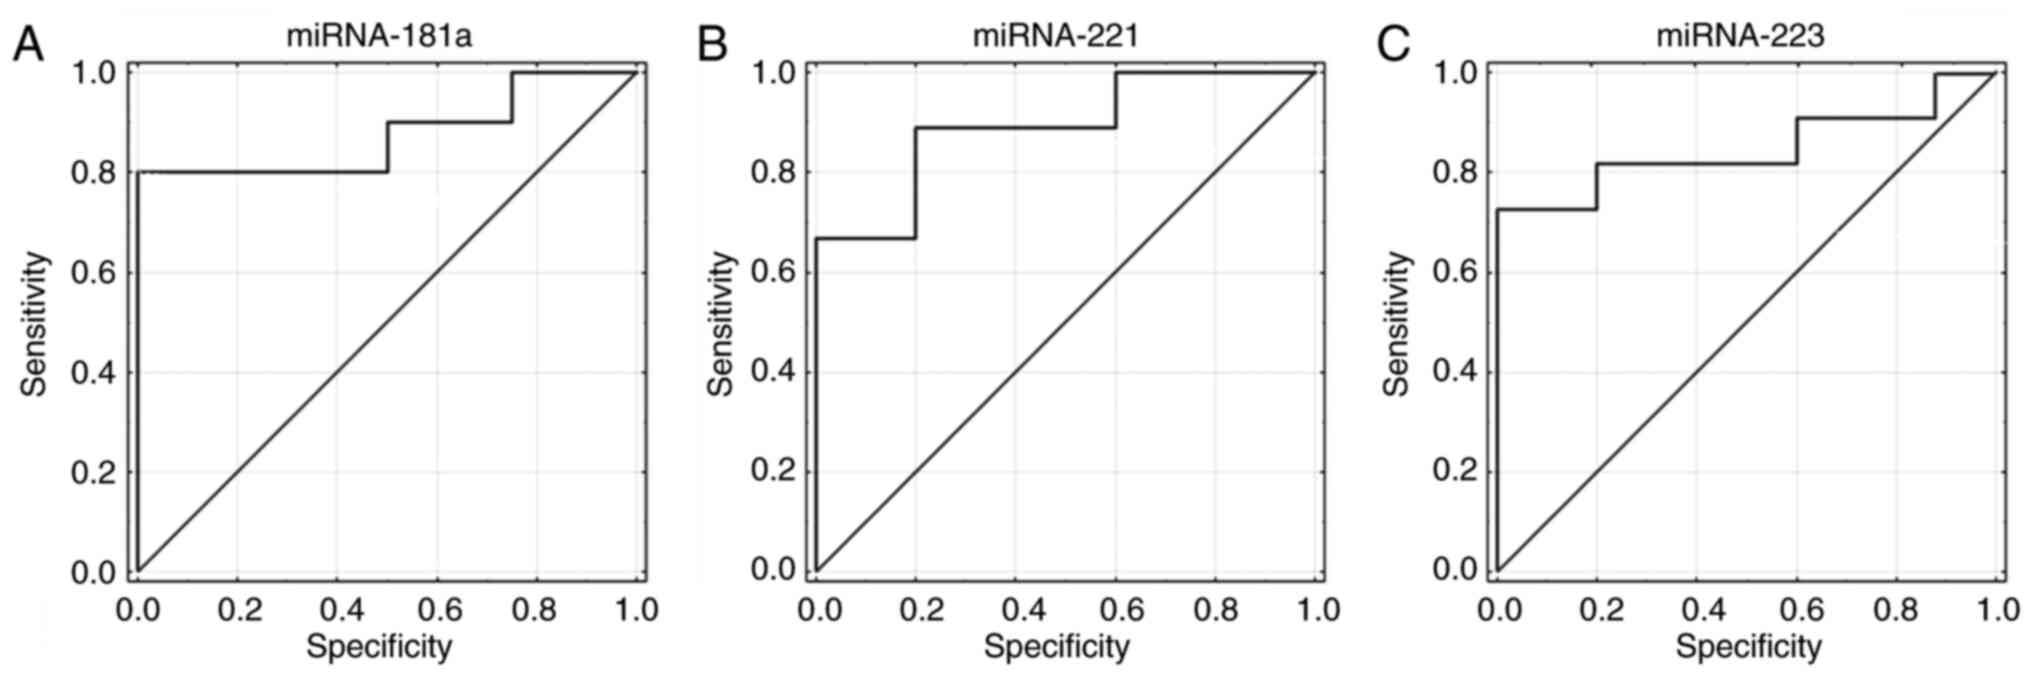
In further analyses, the utility of miRNA expression
was evaluated as a diagnostic factor. Receiver operating
characteristic curves (ROC) were generated and areas under the
curves (AUC) were defined. It was revealed that miR-181a, −221 and
−223 expression had the ability to distinguish between low and high
risk of progression in patients with CLL (Fig. 4A-C). Sensitivity for miR-181a was
69% and specificity was 100% (AUC=0.875; 95% CI, 0.687-1; P=0.0001;
Fig. 4A). Sensitivity for miR-221
was 78% and specificity was 91% (AUC=0.889; 95% CI, 0.713-1;
P=0.00001; Fig. 4B). Sensitivity
for miR-223 was 72% and specificity was 100% (AUC=0.836; 95% CI,
0.634-1; P=0.0011; Fig. 4C).
Discussion
According to the prospective observational study by
Mato et al (27) covering
almost 1,500 patients with CLL stratified by the results of
cytogenetic/fluorescence in situ hybridization testing,
three risk levels could be distinguished: Unfavorable [presence of
del(17p) or del(11q)], favorable [absence of del(17p) and del(11q)]
and unknown. FISH testing was performed in 58% of patients,
cytogenetic testing was performed in 861 patients (58%) at
enrollment and only 40% of these patients were re-tested before
starting the subsequent line of therapy. FISH testing is rarely
performed, and patients with unfavorable risk genetics treated with
immunochemotherapy combinations have worse outcomes (27). However, Hallek et al
(28) stated in the International
Workshop on CLL guidelines for diagnosis, indications for
treatment, response assessment and supportive management of CLL
that FISH is not essential to diagnose CLL, but can help predict
prognosis or assess tumor burden (28,29). In addition, they pointed that the
indication for treatment did not depend on the results of these
tests, but on the clinical stage and symptoms of the patient
(28).
Baliakas et al (30) reported that a complex karyotype,
defined as the presence of ≥3 numerical and/or structural
chromosomal aberrations detected with the use of chromosome-banding
analysis, should not be indisputably considered unfavorable in CLL
due to the fact that it represents a heterogeneous group with
variable clinical behavior. Furthermore, the coexistence of ≥5
chromosomal aberrations seems to be unfavorable prognostically,
regardless of clinical stage or TP53 status, while the
occurrence of <5 cytogenetic changes is clinically relevant only
when coexisting with TP53 disruption (30). Simultaneously, Baliakas et
al (30) indicated that a
complex karyotype in CLL is not always adverse and demonstrated
that additional chromosome 12 and 19 can be involved in prolonging
OS compared with patients with and without a complex karyotype.
The present study observed >2 aberrations in 35%
of patients and >3 in six patients with CLL. Moreover, miR-16-1
and miR-223 expression levels were revealed to be significantly
higher in patients with just one aberration compared with patients
with ≥2 aberrations. This could indicate that in patients with CLL,
the genome with more complexed karyotype is more disrupted, which
may be reflected in genetic changes (aberrations, mutations), but
also in epigenetic changes (methylation, miRNA expression).
miRNA-16-1 and miRNA-223 are considered as tumor suppressors and,
along with pathological changes in the genome, their expression
levels are reduced as a result of deletion of their genes or
mutation in the 3′UTR regions of oncogenic target genes; this
prevents efficient binding of mRNAs and subsequent silencing,
especially in the seed region (the best matching sequence)
(31–33). A significant destabilization of
the genome is observed in tumor cells, including leukemia cells,
which may be associated with reduced survival time, worse prognosis
and ineffective therapy. Chromosomal aberrations may be accompanied
by mutations and epigenetic disorders. Understanding auxiliary
markers such as miRNAs as epigenetic regulators may be helpful in
patient stratification and qualification for personalized
treatment, and thus it seems to be the right research direction.
However, difficulties are often encountered in the interpretation
of study results (6,31–33).
An example is the presence of the D13S319
deletion, a region containing miRNA15a/16 genes. Research
has demonstrated that patients with the loss of this region had a
favorable prognosis (6). 13q14
deletion may also appear as a coexisting lesion, and it has been
confirmed that the prognosis for patients is improved in the case
of an isolated deletion (6).
Reports have demonstrated that there is a relationship between low
levels of miR-15/16 and 13q14 deletion; notably, when >70-80% of
cells carry 13q14 deletion, then it is most often biallelic
(18,34). Such a relationship was not
revealed in the present study. The lack of correlation between the
expression of miR-15/16 and del13q14 in the present study may be
due to the fact that only two patients in the study group had
>70% of cells with a deletion of the region (data not shown)
where miRNA genes were located. Nevertheless, there were also
reports, for example by Rossi et al (35) that indicate that there is no
relationship or correlation between 13q14 deletion and miR-15/16
expression. Nonetheless, the present study revealed that patients
with D13S319 deletion had lower expression of miRNA-181b and
miRNA-223. In addition, it should be mentioned that 70% (n=16) of
patients with the D13S319 deletion had an additional
aberration. Due to the fact that D13S319 deletion itself may
be a useful prognostic factor, additional chromosome aberrations
may indicate a more aggressive course of CLL and the appearance of
abnormal miRNA expression may be the evidence of this.
miR-181 is considered a regulator of TCL1,
and the product of this gene is involved in the aggressive form of
CLL (36–38). Moreover, miR-181b expression is
often decreased in patients with progressive CLL disease.
Therefore, higher expression of this miRNA in patients without
D13S319 lesions appears to be a good complementary marker
indicating a potentially improved prognosis. Especially since the
decrease in its expression is observed with CLL progression, which
also qualifies this molecule as a potential disease monitoring
factor (35,36). Similarly, miRNA-223 expression
decreases as the disease progresses (37). Zhou et al (39) reported that lower expression of
this miRNA can be observed with the transition of CLL from stage A
to C, according to the Binet classification, and the transformation
of a low-risk form (stage 0 according to the Rai classification)
into a high-risk form of CLL progression (stage III and IV
according to the Rai classification). Low expression of miR-223 may
indicate a worse prognosis and, additionally, it is frequently
observed in patients with non-mutated IgVH (39). Thus, similarly to miR-181, high
miR-223 expression may be a useful prognostic factor with the
simultaneous presence of D13S319 deletion and coexisting
aberrations.
In the present study, higher expression levels of
miRNA-15a and miRNA-29c were also observed in the group of patients
with TP-53 deletion. There is evidence that tumor protein 53
can stimulate miRNA-15a expression (40). By contrast, miR-15a (and
miR-16-1) may be involved in TP53 silencing at the
posttranscriptional level, directly targeting its 3′-UTR region,
and miRNA-15a overexpression may result in reduced TP53
expression at the RNA and protein levels (41). Liu et al (42) demonstrated that miR-15a and
miR-16-1 expression levels were significantly decreased in CLL
cells with TP-53 loss. Janaki et al (43) reported that miRNA-15a and TP-53
form a specific feedback loop: TP-53 regulates miRNA by stimulating
its expression, and miRNA-15a has the ability to silence
TP-53 expression. In the present study, high expression of
miRNA-15a in the group with TP-53 deletion was notable.
Perhaps the detection of an inverse correlation between these
parameters was influenced by the small size of the group, which
included only eight cases with TP-53 deletion. In addition,
other regulatory mechanisms could affect miRNA-15a expression, with
decreased TP-53 expression as a result of deletion. This topic
remains to be considered as a further, extended research in terms
of methodology and in terms of group size.
When miR-29c expression was analyzed, it was found
that it was higher in the presence of 17p13 deletion compared with
lymphocytes from patients without this change in the present study.
Pekarsky et al (19,44) indicated that higher miR-29
expression may characterize the initial stage of CLL, while its
reduction can indicate disease progression and its transformation
into an aggressive form. In the present study, this thesis was not
confirmed because higher expression was recorded in the presence of
17p13 deletion, which is considered a negative prognostic factor
indicating an aggressive form of CLL or the risk of transformation
of the benign to aggressive form. Mraz et al (45) revealed that miR-29c expression was
reduced in the presence of TP53 deletion or mutation. The
different results of the present study may have been influenced by
the size of the groups being compared (patients without deletion
=26; patients with deletion=8) as in the miRNA-15a study.
Particular attention should be paid to this issue in further
studies, due to the fact that no associations were found between
miR-34 (miR-34a, miR-34b) and TP-53 in the current study,
and in the literature there are examples of the relationship
between these molecules in CLL (46)
Zenz et al (20) and Mraz et al (45) reported a relationship between the
occurrence of TP-53 deletions/mutations and reduced miR-34a
expression associated with unfavorable prognosis or resistance to
chemotherapy. The present study revealed no correlations between
these factors; however low miRNA-34b expression was observed in the
group of patients with CD38-positive cells below 30%. Balatti et
al (47) indicated that there
is a lower expression level of miRNA-34b/c in patients with CLL
with del11q. The present study did not observe such a correlation
between deletion in the region of chromosome 11 (where ATM
is located) and miRNA-34a expression. This may have been due to the
small size of the study group or other molecular phenomena, such as
the lack of methylation of the miRNA34b/34c gene cluster,
which was observed in CLL (48).
It is noteworthy that with high miRNA-34b expression, >20% of
ZAP-70-positive cells were observed significantly more often. This
is notable due to the fact that Fabbri et al (41) demonstrated the existence of the
TP-53/miRNA-34b/c/ZAP-70 axis and that TP-53 is a positive
regulator of the miRNA-34b/c gene cluster, which has the ability to
post-transcriptionally silence TP-53 or ZAP-70 (41). Thus, a relationship between the
factors associated with this feedback loop and decreased miRNA-34b
expression is expected. The observed high expression of miRNA-34b
in the ZAP-70-positive patients in the present study may have been
the result of the small size of the study groups, or may have been
associated with other molecular mechanisms that interacted with
each other.
The situation was similar in present study with
miR-29a, whose expression was higher in ZAP-70-positive patients,
despite previous evidence of reduced expression of this miRNA in
ZAP-70-positive patients (49).
Since a high percentage of ZAP-70-positive cells may indicate an
aggressive course of CLL, and miRNA-221 is described as an oncomiR,
it can be considered as a prognostic marker (23). The present study performed ROC
analysis to demonstrate the diagnostic utility of the miRNAs, and
revealed that three of them could be useful as prognostic factors;
miRNA-181a, miRNA 221 and miRNA-223 could differentiate between
patients with low and high risk of progression. There is evidence
that miRNA molecules may be a prognostic factor in CLL (37,38).
However, it should be noted that the study group
should be expanded in further analyses in order to confirm the
present findings. Furthermore, the analysis of a few or a several
miRNAs should be performed jointly if the study group is much
larger and then a miRNA panel can be proposed. It is now possible
to use next-generation sequencing (NGS) as an extensive study to
search for miRNA molecules that can serve as prognostic and
predictive factors in CLL. Kaur et al (50) conducted a genome-wide small RNA
sequencing study to reveal a unique pattern of differential
regulation of eight miRNAs in CLL. Upregulated miRNAs include
miR-1295a, miR-155 and miR-4524a; while miR-30a, miR-423, miR-486*,
let-7e and miR-744 are downregulated (50). This demonstrated that miR-4524a
and miR-744 are significantly associated with CLL risk and time to
first treatment (50). These
authors also validated NGS results using RT-qPCR. Therefore, NGS
may be a first-line method in broad analysis to identify miRNAs
that may be useful as predictive markers. However, to implement
miRNA assessment into practice, a less expensive and more
accessible method should be used, such as RT-qPCR.
Beyond research on the diagnostic utility of miRNAs,
it is worth noting that these molecules have therapeutic potential.
Studies on the expression levels of miRNAs contribute to directing
the next steps of research toward specific miRNA molecules that can
be used therapeutically as complementary antagomirs for silencing
miRNA overexpression or as mimic RNAs for supplementing
deficiencies of specific molecules. Fu et al (51) indicated that delivery systems for
therapeutic miRNA molecules are different (viral or non-viral
vectors or microvesicles). They are used in clinical trials for the
application of miRNA-based systems to cancer treatment (52). Examples of miRNA-based agents
include: miR-34a (MRX34; Phase I clinical trial,
liposome-encapsulated miRNA-34a mimic for the treatment of advanced
solid tumors; Clinical trial, NCT01829971) or miRNA-16 (MesomiR-1
Clinical Trials, NCT02369198), a molecule mimicking miR-16
encapsulated in non-viable bacterial minicells with an anti-EGFR
bispecific antibody, for the treatment of mesothelioma and
non-small cell lung cancer. Research on miRNA expression in
different types of cancer, including CLL, is ongoing and are
extensive. They are important due to the fact that on their basis
miRNA-activity-based therapeutic systems or diagnostic tests can be
developed for early cancer detection or disease monitoring.
In conclusion, the present study demonstrated that
miRNAs have diagnostic potential. There is a large number of miRNA
molecules from which those that are important in particular disease
entities or their stages can be selected. The present study
demonstrated that among the tested miRNAs, miRNA-181a, miR-221 and
miR-223 appeared to have the greatest diagnostic potential in
CLL.
Acknowledgements
The authors would like to thank Mrs. Barbara
Kwiatkowska-Drabik and Mrs. Małgorzata Luterek (Department of
Cancer Genetics with Cytogenetic Laboratory) for their help during
the FISH research.
Funding
Funding: No funding was received.
Availability of data and materials
The datasets used and/or analyzed during the current
study are available from the corresponding author on reasonable
request.
Authors' contributions
AG and AAF conceptualized the study. AG and EWS
collected the data. AG performed data analysis. AG, EWS and AAF
designed the methodology. AG and AAF confirm the authenticity of
all the raw data. AG was project administrator and wrote the
original draft. AAF and EWS supervised the present study. All
authors have read and approved the final manuscript.
Ethics approval and consent to
participate
Informed consent was obtained from patients and the
present study was conducted with the approval of the Ethics
Committee of the Medical University of Lublin (approval no.
KE-0254/155/2010).
Patient consent for publication
Not applicable.
Competing interests
The authors declare that they have no competing
interests.
References
|
1
|
Rodriguez A, Griffiths-Jones S, Ashurst JL
and Bradley A: Identification of mammalian microRNA host genes and
transcription units. Genome Res. 14:1902–1910. 2004. View Article : Google Scholar : PubMed/NCBI
|
|
2
|
Farazi TA, Spitzer JI, Morozov and Tuschl
T: miRNAs in human cancer. J Pathol. 223:102–115. 2011. View Article : Google Scholar : PubMed/NCBI
|
|
3
|
Lynam-Lennon N, Maher SG and Reynolds JV:
The roles of microRNA in cancer and apoptosis. Biol Rev Camb Philos
Soc. 84:55–71. 2009. View Article : Google Scholar : PubMed/NCBI
|
|
4
|
Delgado J and Villamor N: Chronic
lymphocytic leukemia in young individuals revisited. Haematologica.
99:4–5. 2014. View Article : Google Scholar : PubMed/NCBI
|
|
5
|
Bacher U, Kern W, Schoch C, Hiddemann W
and Haferlach T: Discrimination of chronic lymphocytic leukemia
(CLL) and CLL/PL by cytomorphology can clearly be correlated to
specific genetic markers as investigated by interphase fluorescence
in situ hybridization (FISH). Ann Hematol. 83:349–355. 2004.
View Article : Google Scholar : PubMed/NCBI
|
|
6
|
Dal Bo M, Rossi FM, Rossi D, Deambrogi C,
Bertoni F, Del Giudice I, Palumbo G, Nanni M, Rinaldi A, Kwee I, et
al: 13q14 deletion size and number of deleted cells both influence
prognosis in chronic lymphocytic leukemia. Genes Chromosomes
Cancer. 50:633–643. 2011. View Article : Google Scholar : PubMed/NCBI
|
|
7
|
Klein U, Lia M, Crespo M, Siegel R, Shen
Q, Mo T, Ambesi-Impiombato A, Califano A, Migliazza A, Bhagat G and
Dalla-Favera R: The DLEU2/miR-15a/16-1 cluster controls B cell
proliferation and its deletion leads to chronic lymphocytic
leukemia. Cancer Cell. 17:28–40. 2010. View Article : Google Scholar : PubMed/NCBI
|
|
8
|
Palamarchuk A, Efanov A, Nazaryan N,
Santanam U, Alder H, Rassenti L, Kipps T, Croce CM and Pekarsky Y:
13q14 deletions in CLL involve cooperating tumor suppressors.
Blood. 115:3916–3922. 2010. View Article : Google Scholar : PubMed/NCBI
|
|
9
|
Kiefer Y, Schulte C, Tiemann M and
Bullerdiek J: Chronic lymphocytic leukemia-associated chromosomal
abnormalities and miRNA deregulation. The Application of Clinical
Genetics. 5:21–28. 2012.PubMed/NCBI
|
|
10
|
Austen B, Powell JE, Alvi A, Edwards I,
Hooper L, Starczynski J, Taylor AM, Fegan C, Moss P and Stankovic
T: Mutations in the ATM gene lead to impaired overall and
treatment-free survival that is independent of IGVH mutation status
in patients with B-CLL. Blood. 106:3175–3182. 2005. View Article : Google Scholar : PubMed/NCBI
|
|
11
|
Döhner H, Stilgenbauer S, Benner A,
Leupolt E, Kröber A, Bullinger L, Döhner K, Bentz M and Lichter P:
Genomic aberrations and survival in chronic lymphocytic leukemia. N
Engl J Med. 343:1910–1916. 2000. View Article : Google Scholar : PubMed/NCBI
|
|
12
|
Döhner H, Stilgenbauer S, James MR, Benner
A, Weilguni T, Bentz M, Fischer K, Hunstein W and Lichter P: 11q
deletions identify a new subset of B-cell chronic lymphocytic
leukemia characterized by extensive nodal involvement and inferior
prognosis. Blood. 89:2516–2522. 1997. View Article : Google Scholar : PubMed/NCBI
|
|
13
|
Marasca R, Maffei R, Martinelli S,
Fiorcari S, Bulgarelli J, Debbia G, Rossi D, Rossi FM, Rigolin GM,
Martinelli S, et al: Clinical heterogeneity of de novo 11q deletion
chronic lymphocytic leukaemia: Prognostic relevance of extent of
11q deleted nuclei inside leukemic clone. Hematol Oncol. 31:88–95.
2013. View Article : Google Scholar : PubMed/NCBI
|
|
14
|
Matutes E, Oscier D, Garcia-Marco J, Ellis
J, Copplestone A, Gillingham R, Hamblin T, Lens D, Swansbury GJ and
Catovsky D: Trisomy 12 defines a group of CLL with atypical
morphology: Correlation between cytogenetic, clinical and
laboratory features in 544 patients. Br J Haematol. 92:382–388.
1996. View Article : Google Scholar : PubMed/NCBI
|
|
15
|
Zent CS, Kyasa MJ, Evans R and Schichman
SA: Chronic lymphocytic leukemia incidence is substantially higher
than estimated from tumor registry data. Cancer. 92:1325–1330.
2001. View Article : Google Scholar : PubMed/NCBI
|
|
16
|
Zenz T, Eichhorst B, Busch R, Denzel T,
Häbe S, Winkler D, Bühler A, Edelmann J, Bergmann M, Hopfinger G,
et al: TP53 mutation and survival in chronic lymphocytic leukemia.
J Clin Oncol. 28:4473–4479. 2010. View Article : Google Scholar : PubMed/NCBI
|
|
17
|
Bullrich F, Fujii H, Calin G, Mabuchi H,
Negrini M, Pekarsky Y, Rassenti L, Alder H, Reed JC, Keating MJ, et
al: Characterization of the 13q14 tumor suppressor locus in CLL:
Identification of ALT1, an alternative splice variant of the LEU2
gene. Cancer Res. 61:6640–6648. 2001.PubMed/NCBI
|
|
18
|
Calin GA, Dumitru CD, Shimizu M, Bichi R,
Zupo S, Noch E, Aldler H, Rattan S, Keating M, Rai K, et al:
Frequent deletions and down-regulation of micro- RNA genes miR15
and miR16 at 13q14 in chronic lymphocytic leukemia. Proc Natl Acad
Sci USA. 99:15524–15529. 2002. View Article : Google Scholar : PubMed/NCBI
|
|
19
|
Pekarsky Y, Santanam U, Cimmino A,
Palamarchuk A, Efanov A, Maximov V, Volinia S, Alder H, Liu CG,
Rassenti L, et al: Tcl1 expression in chronic lymphocytic leukemia
is regulated by miR-29 and miR-181. Cancer Res. 66:11590–11593.
2006. View Article : Google Scholar : PubMed/NCBI
|
|
20
|
Zenz T, Häbe S, Denzel T, Mohr J, Winkler
D, Bühler A, Sarno A, Groner S, Mertens D, Busch R, et al: Detailed
analysis of p53 pathway defects in fludarabine-refractory chronic
lymphocytic leukemia (CLL): Dissecting the contribution of 17p
deletion, TP53 mutation, p53-p21 dysfunction, and miR34a in a
prospective clinical trial. Blood. 114:2589–2597. 2009. View Article : Google Scholar : PubMed/NCBI
|
|
21
|
Calin GA, Liu CG, Sevignani C, Ferracin M,
Felli N, Dumitru CD, Shimizu M, Cimmino A, Zupo S, Dono M, et al:
MicroRNA profiling reveals distinct signaturesin B cell chronic
lymphocytic leukemias. Proc Natl Acad Sci USA. 101:11755–11760.
2004. View Article : Google Scholar : PubMed/NCBI
|
|
22
|
Sandhu SK, Volinia S, Costinean S, Galasso
M, Neinast R, Santhanam R, Parthun MR, Perrotti D, Marcucci G,
Garzon R and Croce CM: miR-155 targets histone deacetylase 4
(HDAC4) and impairs transcriptional activity of B-cell lymphoma 6
(BCL6) in the Eµ-miR-155 transgenic mouse model. Proc Natl Acad Sci
USA. 109:20047–2052. 2012. View Article : Google Scholar : PubMed/NCBI
|
|
23
|
Frenquelli M, Muzio M, Scielzo C, Fazi C,
Scarfò L, Rossi C, Ferrari G, Ghia P and Caligaris-Cappio F:
MicroRNA and proliferation control in chronic lymphocytic leukemia:
Functional relationship between miR-221/222 cluster and p27. Blood.
115:3949–3959. 2010. View Article : Google Scholar : PubMed/NCBI
|
|
24
|
Montillo M, Hamblin T, Hallek M,
Montserrat E and Morra E: Chronic lymphocytic leukemia: Novel
prognostic factors and their relevance for risk-adapted therapeutic
strategies. Haematologica. 90:391–399. 2005.PubMed/NCBI
|
|
25
|
Hallek M, Cheson BD, Catovsky D,
Caligaris-Cappio F, Dighiero G, Döhner H, Hillmen P, Keating MJ,
Montserrat E, Rai KR, et al: Guidelines for the diagnosis and
treatment of chronic lymphocytic leukemia: A report from the
International Workshop on Chronic Lymphocytic Leukemia updating the
National Cancer Institute-Working Group 1996 guidelines. Blood.
111:5446–5456. 2008. View Article : Google Scholar : PubMed/NCBI
|
|
26
|
Livak KJ and Schmittgen TD: Analysis of
relative gene expression data using real-time quantitative PCR and
the 2(-Delta Delta C(T)) method. Methods. 25:402–408. 2001.
View Article : Google Scholar : PubMed/NCBI
|
|
27
|
Mato A, Nabhan C, Kay NE, Lamanna N, Kipps
TJ, Grinblatt DL, Flowers CR, Farber CM, Davids MS, Kiselev P, et
al: Prognostic Testing patterns and outcomes of chronic lymphocytic
leukemia patients stratified by fluorescence in situ
hybridization/cytogenetics: A real-world clinical experience in the
connect CLL registry. Clin Lymphoma Myeloma Leuk. 18:114–124.e2.
2018. View Article : Google Scholar : PubMed/NCBI
|
|
28
|
Hallek M, Cheson BD, Catovsky D,
Caligaris-Cappio F, Dighiero G, Döhner H, Hillmen P, Keating M,
Montserrat E, Chiorazzi N, et al: iwCLL guidelines for diagnosis,
indications for treatment, response assessment, and supportive
management of CLL. Blood. 131:2745–2760. 2018. View Article : Google Scholar : PubMed/NCBI
|
|
29
|
Eichhorst B, Robak T, Montserrat E, Ghia
P, Niemann CU, Kater AP, Gregor M, Cymbalista F, Buske C, Hillmen
P, et al: Chronic lymphocytic leukaemia: ESMO Clinical Practice
Guidelines for diagnosis, treatment and follow-up. Ann Oncol.
32:23–33. 2021. View Article : Google Scholar : PubMed/NCBI
|
|
30
|
Baliakas P, Jeromin S, Iskas M, Puiggros
A, Plevova K, Nguyen-Khac F, Davis Z, Rigolin GM, Visentin A,
Xochelli A, et al: Cytogenetic complexity in chronic lymphocytic
leukemia: Definitions, associations, and clinical impact. Blood.
133:1205–1216. 2019. View Article : Google Scholar : PubMed/NCBI
|
|
31
|
Galka-Marciniak P, Urbanek-Trzeciak MO,
Nawrocka PM, Dutkiewicz A, Giefing M, Lewandowska MA and Kozlowski
P: Somatic mutations in miRNA genes in lung cancer-potential
functional consequences of non-coding sequence variants. Cancers
(Basel). 11:7932019. View Article : Google Scholar : PubMed/NCBI
|
|
32
|
Gao Y, Lin L, Li T, Yang J and Wei Y: The
role of miRNA-223 in cancer: Function, diagnosis and therapy. Gene.
616:1–7. 2017. View Article : Google Scholar : PubMed/NCBI
|
|
33
|
Luo P, Wang Q, Ye Y, Zhang J, Lu D, Cheng
L, Zhou H, Xie M and Wang B: miR-223-3p functions as a tumor
suppressor in lung squamous cell carcinoma by miR-223-3p-mutant p53
regulatory feedback loop. J Exp Clin Cancer Res. 38:742019.
View Article : Google Scholar : PubMed/NCBI
|
|
34
|
Humplikova L, Kollinerova S, Papajik T,
Pikalova Z, Holzerova M, Prochazka V, Divoka M, Modriansky M,
Indrak K and Jarosova M: Expression of miR-15a and miR-16-1 in
patients with chronic lymphocytic leukemia. Biomed Pap Med Fac Univ
Palacky Olomouc Czech Repub. 157:284–293. 2013. View Article : Google Scholar : PubMed/NCBI
|
|
35
|
Rossi M, Fuligni F, Ciccone M, Agostinelli
C, Righi S, Luciani M, Laginestra MA, Rigolin GM, Sapienza MR,
Gazzola A, et al: Hsa-miR-15a and Hsa-miR-16-1 expression is not
related to proliferation centers abundance and other prognostic
factors in chronic lymphocytic leukemia. Biomed Res Int.
2013:7153912013. View Article : Google Scholar : PubMed/NCBI
|
|
36
|
Zhu DX, Zhu W, Fang C, Fan L, Zou ZJ, Wang
YH, Liu P, Hong M, Miao KR, Liu P, et al: miR-181a/b significantly
enhances drug sensitivity in chronic lymphocytic leukemia cells via
targeting multiple anti-apoptosis genes. Carcinogenesis.
33:1294–1301. 2012. View Article : Google Scholar : PubMed/NCBI
|
|
37
|
Visone R, Veronese A, Balatti V and Croce
CM: miR-181b: New perspective to evaluate disease progression in
chronic lymphocytic leukemia. Oncotarget. 3:195–202. 2012.
View Article : Google Scholar : PubMed/NCBI
|
|
38
|
Visone R, Veronese A, Rassenti LZ, Balatti
V, Pearl DK, Acunzo M, Volinia S, Taccioli C, Kipps TJ and Croce
CM: miR-181b is a biomarker of disease progression in chronic
lymphocytic leukemia. Blood. 118:3072–3079. 2011. View Article : Google Scholar : PubMed/NCBI
|
|
39
|
Zhou K, Yi S, Yu Z, Li Z, Wang Y, Zou D,
Qi J, Zhao Y and Qiu L: MicroRNA-223 expression is uniformly
down-regulated in B cell lymphoproliferative disorders and is
associated with poor survival in patients with chronic lymphocytic
leukemia. Leuk Lymphoma. 53:1155–1161. 2012. View Article : Google Scholar : PubMed/NCBI
|
|
40
|
Yang L, Zhao W, Wei P, Zuo W and Zhu S:
Tumor suppressor p53 induces miR-15a processing to inhibit neuronal
apoptosis inhibitory protein (NAIP) in the apoptotic response DNA
damage in breast cancer cell. Am J Transl Res. 9:683–691.
2017.PubMed/NCBI
|
|
41
|
Fabbri M, Bottoni A, Shimizu M, Spizzo R,
Nicoloso MS, Rossi S, Barbarotto E, Cimmino A, Adair B, Wojcik SE,
et al: Association of a microRNA/TP53 feedback circuitry with
pathogenesis and outcome of B-cell chronic lymphocytic leukemia.
JAMA. 305:59–67. 2011. View Article : Google Scholar : PubMed/NCBI
|
|
42
|
Liu J, Chen G, Feng L, Zhang W, Pelicano
H, Wang F, Ogasawara MA, Lu W, Amin HM, Croce CM, et al: Loss of
p53 and altered miR15-a/16-1 MCL-1 pathway in CLL: Insights from
TCL1-Tg:p53(−/−) mouse model and primary human leukemia cells.
Leukemia. 28:118–128. 2014. View Article : Google Scholar : PubMed/NCBI
|
|
43
|
Janaki RM: Functions and epigenetic
aspects of miR-15/16: Possible future cancer therapeutics. Gene
Reports. 12:149–164. 2018. View Article : Google Scholar
|
|
44
|
Pekarsky Y and Croce CM: Is miR-29 an
oncogene or tumor suppressor in CLL? Oncotarget. 1:224–227. 2010.
View Article : Google Scholar : PubMed/NCBI
|
|
45
|
Mraz M, Malinova K, Kotaskova J, Pavlova
S, Tichy B, Malcikova J, Stano Kozubik K, Smardova J, Brychtova Y,
Doubek M, et al: miR-34a, miR-29c and miR-17-5p are downregulated
in CLL patients with TP53 abnormalities. Leukemia. 23:1159–1163.
2009. View Article : Google Scholar : PubMed/NCBI
|
|
46
|
Zhang L, Liao Y and Tang L: MicroRNA-34
family: a potential tumor suppressor and therapeutic candidate in
cancer. J Exp Clin Cancer Res. 38:532019. View Article : Google Scholar : PubMed/NCBI
|
|
47
|
Balatti V, Pekarky Y, Rizzotto L and Croce
CM: miR deregulation in CLL. Advances in experimental medicine and
biology. 792:309–325. 2013. View Article : Google Scholar : PubMed/NCBI
|
|
48
|
Deneberg S, Kanduri M, Ali D, Bengtzen S,
Karimi M, Qu Y, Kimby E, Mansouri L, Rosenquist R, Lennartsson A
and Lehmann S: microRNA-34b/c on chromosome 11q23 is aberrantly
methylated in chronic lymphocytic leukemia. Epigenetics. 9:910–917.
2014. View Article : Google Scholar : PubMed/NCBI
|
|
49
|
Farahat NMG, Elkaffash DMNED, Alghandour
AH, Swelem RS and Abo El-Wafa RAH: Study of microRNA profile as a
molecular biomarker in Egyptian Chronic Lymphocytic Leukemia.
Indian J Hematol Blood Transfus. 35:89–99. 2019. View Article : Google Scholar : PubMed/NCBI
|
|
50
|
Kaur G, Ruhela V, Rani L, Gupta A, Sriram
K, Gogia A, Sharma A, Kumar L and Gupta R: RNA-Seq profiling of
deregulated miRs in CLL and their impact on clinical outcome. Blood
Cancer J. 10:62020. View Article : Google Scholar : PubMed/NCBI
|
|
51
|
Fu Y, Chen J and Huang Z: Recent progress
in microRNA-based delivery systems for the treatment of human
disease. ExRNA. 1:242019. View Article : Google Scholar : PubMed/NCBI
|
|
52
|
Chakraborty C, Sharma AR, Sharma G and Lee
SS: Therapeutic advances of miRNAs: A preclinical and clinical
update. J Adv Res. 28:127–138. 2020. View Article : Google Scholar : PubMed/NCBI
|